1. Introduction
According to the Agreement of 27 September 2001 [
1], the term ‘indoor environment’ is intended to refer to all confined living and working spaces, including dwellings, public and private offices, community facilities (hospitals, schools, barracks, hotels, banks, etc.), spaces designated for recreational and/or social activities (cinemas, bars, restaurants, shops, sports facilities, etc.), and public and/or private transportation means (cars, trains, planes, ships, etc.). Due to their enclosed nature, confined spaces generate pollutants that, in single or synergistic action, result in a decrease in environmental comfort, risks to the health of occupants [
2,
3], and damage to the built and natural environment.
The effects on health and the reduction of indoor well-being due to indoor pollution have been studied with increasing intensity since the end of World War II. Several factors have strongly contributed the increasing importance of this phenomenon, including the progressive ‘tertiarization’ of activities [
4] and, during the last few years, the COVID-19 pandemic [
5]. Many studies on the use of time by different population groups in advanced countries have shown that people currently spend truly little time outdoors (on average 2% of the 24 h on weekdays for working adults) [
6]. Americans spend 60–90% of their time indoors [
7] (60% of the time is spent at home, 30% at work, and the remaining 8% inside other structures or transportation). This is compounded by a gradual deterioration of indoor air quality attributed to different causes, including the energy crisis that, since the 1970s, has led to substantial changes in heating and cooling methods, along with the widespread introduction of thermal and synthetic insulation. While these measures reduce energy resource usage by minimizing air infiltration, they also contribute to worsening air quality [
8]. Additionally, the introduction of new materials for both fixed and movable furnishings [
9], new treatment and cleaning/maintenance products, and new tools in workplaces (photocopiers, laser printers, video terminals, etc.) help to understand how much the indoor environment has been modified [
10], along with the lifestyles of the occupants. The relationships between humans and new machines and between humans and their new habitat, both built and natural, need to be carefully studied, understood, and monitored to ensure health and safety conditions, from both physiological and psychological point of view.
Indoor pollution refers to any alteration of the chemical, physical, and biological characteristics of the air caused by changes in the concentration of its normal constituents or the presence of substances foreign to its natural composition. Specifically, only those variations that generate harmful effects and/or discomfort to humans should be considered; human health and indoor well-being depend on the quality of the indoor environment [
11].
In light of this, the European Parliament, with the ‘General Union Environment Action Program until 2020’—‘Living well within the limits of our planet’, Decision No. 1386/2013/EU of November 20, 2013 [
12], the seventh such program of action on environmental matters, set the goal of achieving Built Environment Quality levels that do not pose significant impacts or risks to human health and the environment. This program specifically emphasizes the need to ensure a significant improvement in outdoor air quality in the European Union, accompanied by an improvement in indoor air quality, based on the relevant guidelines of the World Health Organization (WHO) [
13].
Although the methods for defining indoor and outdoor comfort are known in the literature [
14,
15,
16] (a literature review on these issues is out of the scope of this work), as is the definition of Indoor Environmental Quality (IEQ), consisting of thermal comfort, IAQ, and visual and acoustic comfort [
17,
18], to date, a single methodology of definition and control regarding the relationship between the well-being of people in closed environments has not been completely envisaged [
19]. Indeed, focusing on Built Environment Quality as a whole, occupant well-being (here referring to physiological aspects) as a result of factors linked to the characteristics of the building, outdoor/environmental conditions, and indoor safety, needs further investigation. This study proposes a reinterpretation of the main factors that contribute to defining and monitoring Built Environment Quality in relation to indoor physiological well-being and considers the IEQ factors as part of the methodology described below.
In the presented scenario, it is possible to define three fundamental elements for the study and control of occupant well-being:
- (1)
inputs, i.e., factors introduced into a confined environment that generate a change in Built Environment Quality (BEQ);
- (2)
constraints, rules, and controls, i.e., measures necessary for the activities developed within the confined environment;
- (3)
outputs, i.e., the variation in Built Environment Quality (BEQ).
Therefore, the confined environment may be schematically represented as a ‘box’ where inputs enter, actions occur according to constraints, rules, and controls, and outputs result. Unlike inputs, which can be variable, constraints, rules, and controls are necessary actions that determine the progression of the transformation that generates the new state, the output BEQ. The main references in this area, related to the indoor comfort, are the Predicted Mean Vote (PMV) and Standard Effective Temperature (SET), which have been steadily improved since the 1980s [
20,
21]. But today, as highlighted by other authors [
22,
23], there is a distinct lack of IEQ evaluation methods related to people’s well-being that are reliable and easy to use, especially in relation to the fact that there are many parameters to consider [
24,
25]. This criticality is even more evident when considering the application of such models to real-life contexts, firstly because many parameters have to be considered and secondly because it is not always possible to know some of these variables, such as metabolic rate and clothing insulation [
26]. So, given the multiplicity of factors which contribute to determine the output BEQ and, consequently, the level of indoor well-being [
27], the aim of this research is to establish a unique and one-dimensional quantification that encompasses the main information needed to monitor occupant well-being in relation to Built Environment Quality; the goal is to control and manage the state of the built environment to ensure the health, safety, and comfort of people in accordance with environmental sustainability. This unique quantification, known as a synthetic index, will allow the simplified observation of the studied phenomenon, making the data immediately visible and interpretable. Thus, it will be more easily accessible and usable by both industry specialists and occupants. For this purpose, a preliminary set of elementary indicators has been defined, subsequently aggregated into the synthetic index.
2. Materials and Scope
The aim of this research is to achieve comprehensive indoor environmental monitoring, understood as a form of verification of Built Environment Quality conformity, according to a predetermined well-being paradigm aligned to the United Nations’ 2030 Agenda for Sustainable Development. Monitoring may be conducted: (i) preventively, to anticipate the transformation of inputs into outputs within the confined environment; (ii) in-progress, to check for deviations from the set objectives; or (iii) retrospectively, once the transformation process is completed, as a sort of state certification of the indoor environment. Consequently, the control action [
28] is carried out through a suitable monitoring of selected parameters or indicators.
To fulfil this purpose effectively, the indicators monitored have to essentially serve three basic functions:
Control: indicators allow for the evaluation and control of the performance of the process itself;
Communication: indicators enable the disclosure of process performance to all stakeholders by providing quantitative information otherwise not available. Indicators that poorly represent a process can lead to conflicts and confusion;
Improvement: indicators help identify performance gaps between expectations and results obtained. The amplitude and direction of these gaps provide useful insights from which to develop strategies aimed at optimizing the process.
The basic functions of the indicators revolve around a standard, a predetermined objective, which is an expected result. The expected result is nothing more than the measurement of a goal and in the specific case of indoor well-being analysis; it is determined by both the creation of a comfortable environment and the healthiness of buildings. When this goal is achieved, the result is positive; conversely, when the goal is not achieved, the result is negative. Therefore, indicators are essential to measure the actions and results that follow; if they are used without proper precautions, they can lead to a distorted analysis of processes, encouraging incorrect, or at least suboptimal, improvement procedures and interventions.
The issue of reciprocal influences between humans and the environment can be better analyzed using indicators organized according to conceptual models which are able to highlight the relationships and interdependencies of the phenomena under investigation.
The preliminary definition of the set of indicators and the resulting synthetic index in the methodology is based on previous research on the monitoring of a post-earthquake reconstruction process [
29]. This study aimed to define a replicable method to construct a useful set of indicators for monitoring and evaluating a process. As in the reference study [
29], and in this case too, the research involves the adoption of the Pressure-State-Response (PSR) model proposed by the Organisation for Economic Co-operation and Development (OECD). In this context, the model has been used to express and promptly evaluate human and climatic actions, Indoor Air Quality (IAQ), and the condition of comfort, as well as the performance of the building-system-user system, with the scope of mitigate their impacts. Thanks to the adoption of the PSR model, the set of indicators may be converted into a synthetic index, which describes the overall quality of the environment analyzed from the perspective of indoor physiological well-being by considering all the parameters preliminarily described by the indicators.
In this research, pressure indicators describe human and climatic actions that intervene in a confined environment in a certain equilibrium state; state indicators describe the BEQ, boundary conditions, and the microclimate of the environment under investigation; and response indicators are suitable to measure the reactions/performance of the building-system-user system as a response to human and climatic actions generated within a confined environment.
Finally, the selected indicators must meet the following requirements: (i) relevance, i.e., the most appropriate to describe the phenomenon; (ii) practicality, i.e., easy to establish and simple to use, being accessible to both industry experts and users; (iii) cost-effectiveness, not expensive to obtain; (iv) resilience; and (v) timeliness, i.e., able to provide fast responses to intervene and mitigate any risks.
Regarding their units of measure: these may include numerical values, percentages, rates, or ratios.
3. Methods
In this study, seven thematic areas (themes) were identified to comprehensively represent physiological well-being in the built environment from a quantitative point of view. These are:
Health: in the ‘Health’ thematic area, all indicators that pose a risk to human health within confined spaces are identified.
Safety: in the ‘Safety’ thematic area, all indicators that pose a risk to human safety within confined spaces are identified.
Indoor Comfort: In the ‘Indoor Comfort’ thematic area, all indicators that define a condition of comfort sensed by occupants in a confined environment are identified.
Building Quality: in the ‘Building Quality’ thematic area, indicators that best describe the characteristics of the building encompassing the confined environment under examination are identified.
Site Environmental Quality: in the ‘Site Environmental Quality’ thematic area, all parameters describing the surroundings of the building within its urban/environmental/site/climatic reference are identified.
Indoor Air Quality (IAQ): in the ‘Indoor Air Quality’ thematic area, all indicators describing the quality of indoor air in relation to the presence of pollutants are identified.
Indoor Microclimate: in the ‘Indoor Microclimate’ thematic area, all parameters describing the local climate characterizing a specific enclosed environment are identified.
Once the thematic areas were identified, the fundamental step was to select the set of indicators. The selection of the themes and indicators analyzed in this work is based on literature reviews and studies on multi-domain indoor environments [
30,
31,
32,
33] in addition to studies based on forward reference searching and the authors’ knowledge of international standards and guidelines [
34,
35,
36,
37,
38,
39].
This process entailed choosing from among all those parameters that could effectively describe the respective theme. The critical factor in this selection process was the establishment of strategic objectives that indoor well-being quality should strive to achieve and uphold. These strategic objectives serve as representation goals to which indicators must align.
Recognizing climate change, environmental protection, urbanization, and consumption and production patterns as relevant research areas, among the 17 Sustainable Development Goals, the ones most aligned with the subject of the investigation are: Good Health and Well-being; Industry, Innovation, and Infrastructure; Sustainable Cities and Communities; Responsible Consumption and Production; Climate Action; Life on Land.
Defining these six strategic goals was an essential step for the selection of the indicators themselves, identifying those suitable to address the aims of the study. To do this, it was useful to construct a ‘Matrix of Relationships’ between goals and indicators to establish how a single indicator may represent one or more strategic goals simultaneously. In this way, it is possible to obtain a reduced number of indicators capable of describing the phenomenon in the most appropriate manner.
Then, in order to identify just the more significant and effective indicators to the scope of the research from all those defined in the previous step, a Pareto Analysis [
29,
41] was carried out to determine the factors that have a major influence on a single thematic area.
The Pareto analysis is a statistical technique that may be used to support decision-making processes where it is necessary to identify the significant subset of causes or actions that produces the highest percentage of effects. In 1906, Vilfredo Pareto observed that 80% of the land in Italy was owned by 20% of the population. This observation later led to an empirical law, the Pareto Principle, stating that the majority of effects come from a small number of causes. The principle was adapted to quality management by Joseph Juran, who observed that 80% of system failures result from 20% of the causes.
The key steps of the Pareto Analysis are:
Constructing a table associating each cause with its frequency of occurrence in percentage;
Organizing the rows of the table in descending order of percentage importance;
Adding a column with cumulative percentages;
Developing a line chart with causes on the x-axis and cumulative percentages on the y-axis by interpolating the points;
Creating a bar chart on the same template with the x-axis associated with the causes and the y-axis with the corresponding percentages;
Identifying the point of intersection, with the plotted curve, of a line parallel to the x-axis and positioned at the cumulative value equal to 80% on the y-axis.
This results in a diagram called the Pareto Chart, which is used to determine the factors that have a major influence on a given phenomenon. The chart consists of a histogram of the percentage distribution of a phenomenon, ordered in descending order, alongside the graph of cumulative frequencies, the Lorenz Curve [
42]. The identified point separates the most important causes on the left from the less important ones on the right. The Pareto Principle has been used in this research to develop a model that would support the determination of indicators: the basic concept applied is that 80% of strategic goals can be represented by 20% of the indicators.
Firstly, the matrix in
Table 1 was integrated with a column that indicates the importance assigned to each strategic goal concerning the specific theme. The importance was rated on a scale from 1 to 5 (1 = Very low, 2 = Low, 3 = Medium, 4 = High, 5 = Very high). Secondly, it was chosen to differentiate the weight that describes the importance with which the indicators describe the theme itself, varying it depending on how the indicator itself pursues the strategic objective from theme to theme. The weight of each indicator in relation to the strategic objective is represented through the following symbols: the indicator can strongly represent the objective (●), moderately (□), or weakly (◊).
The coding for these three symbols is:
These complex relationships are succinctly expressed in the following summary table, where the example of the Building Quality theme is represented.
It worth noting that, in this study, scores were attributed on the basis of the authors’ knowledge with respect to the topics covered, which allows implementation of the methodology with subsequent modifications of these values at the discretion of the technician who adopts it, as well as the priorities of local governance and the priorities of occupants.
By using the information contained in the matrix, it was thus possible, starting from the importance assigned to strategic objectives and the weight attributed to each indicator based on the strategic objective itself, to determine a priority scale for the indicators. The absolute weight of the indicators was obtained by summing the products of the importance level of each objective and the value with which the indicator represents the objective itself using Equation (1), as follows:
where K
j is the Absolute Weight of the
j-th indicator (
j varies from 1 to n); n is the number of indicators;
di is the importance level of the
i-th objective,
di = 3, 4, 5;
vij is the value that describes how the indicator pursues the objective;
vij = 1, 3, 5; and
m is the number of objectives.
We can also obtain the Relative Weight to build the cumulative curve. This is calculated using Equation (2) as follows:
where K
j∗ is the Relative Weight of the
j-th indicator; K
j is the Absolute Weight of the
j-th indicator; and
n is the number of indicators.
In the graph in
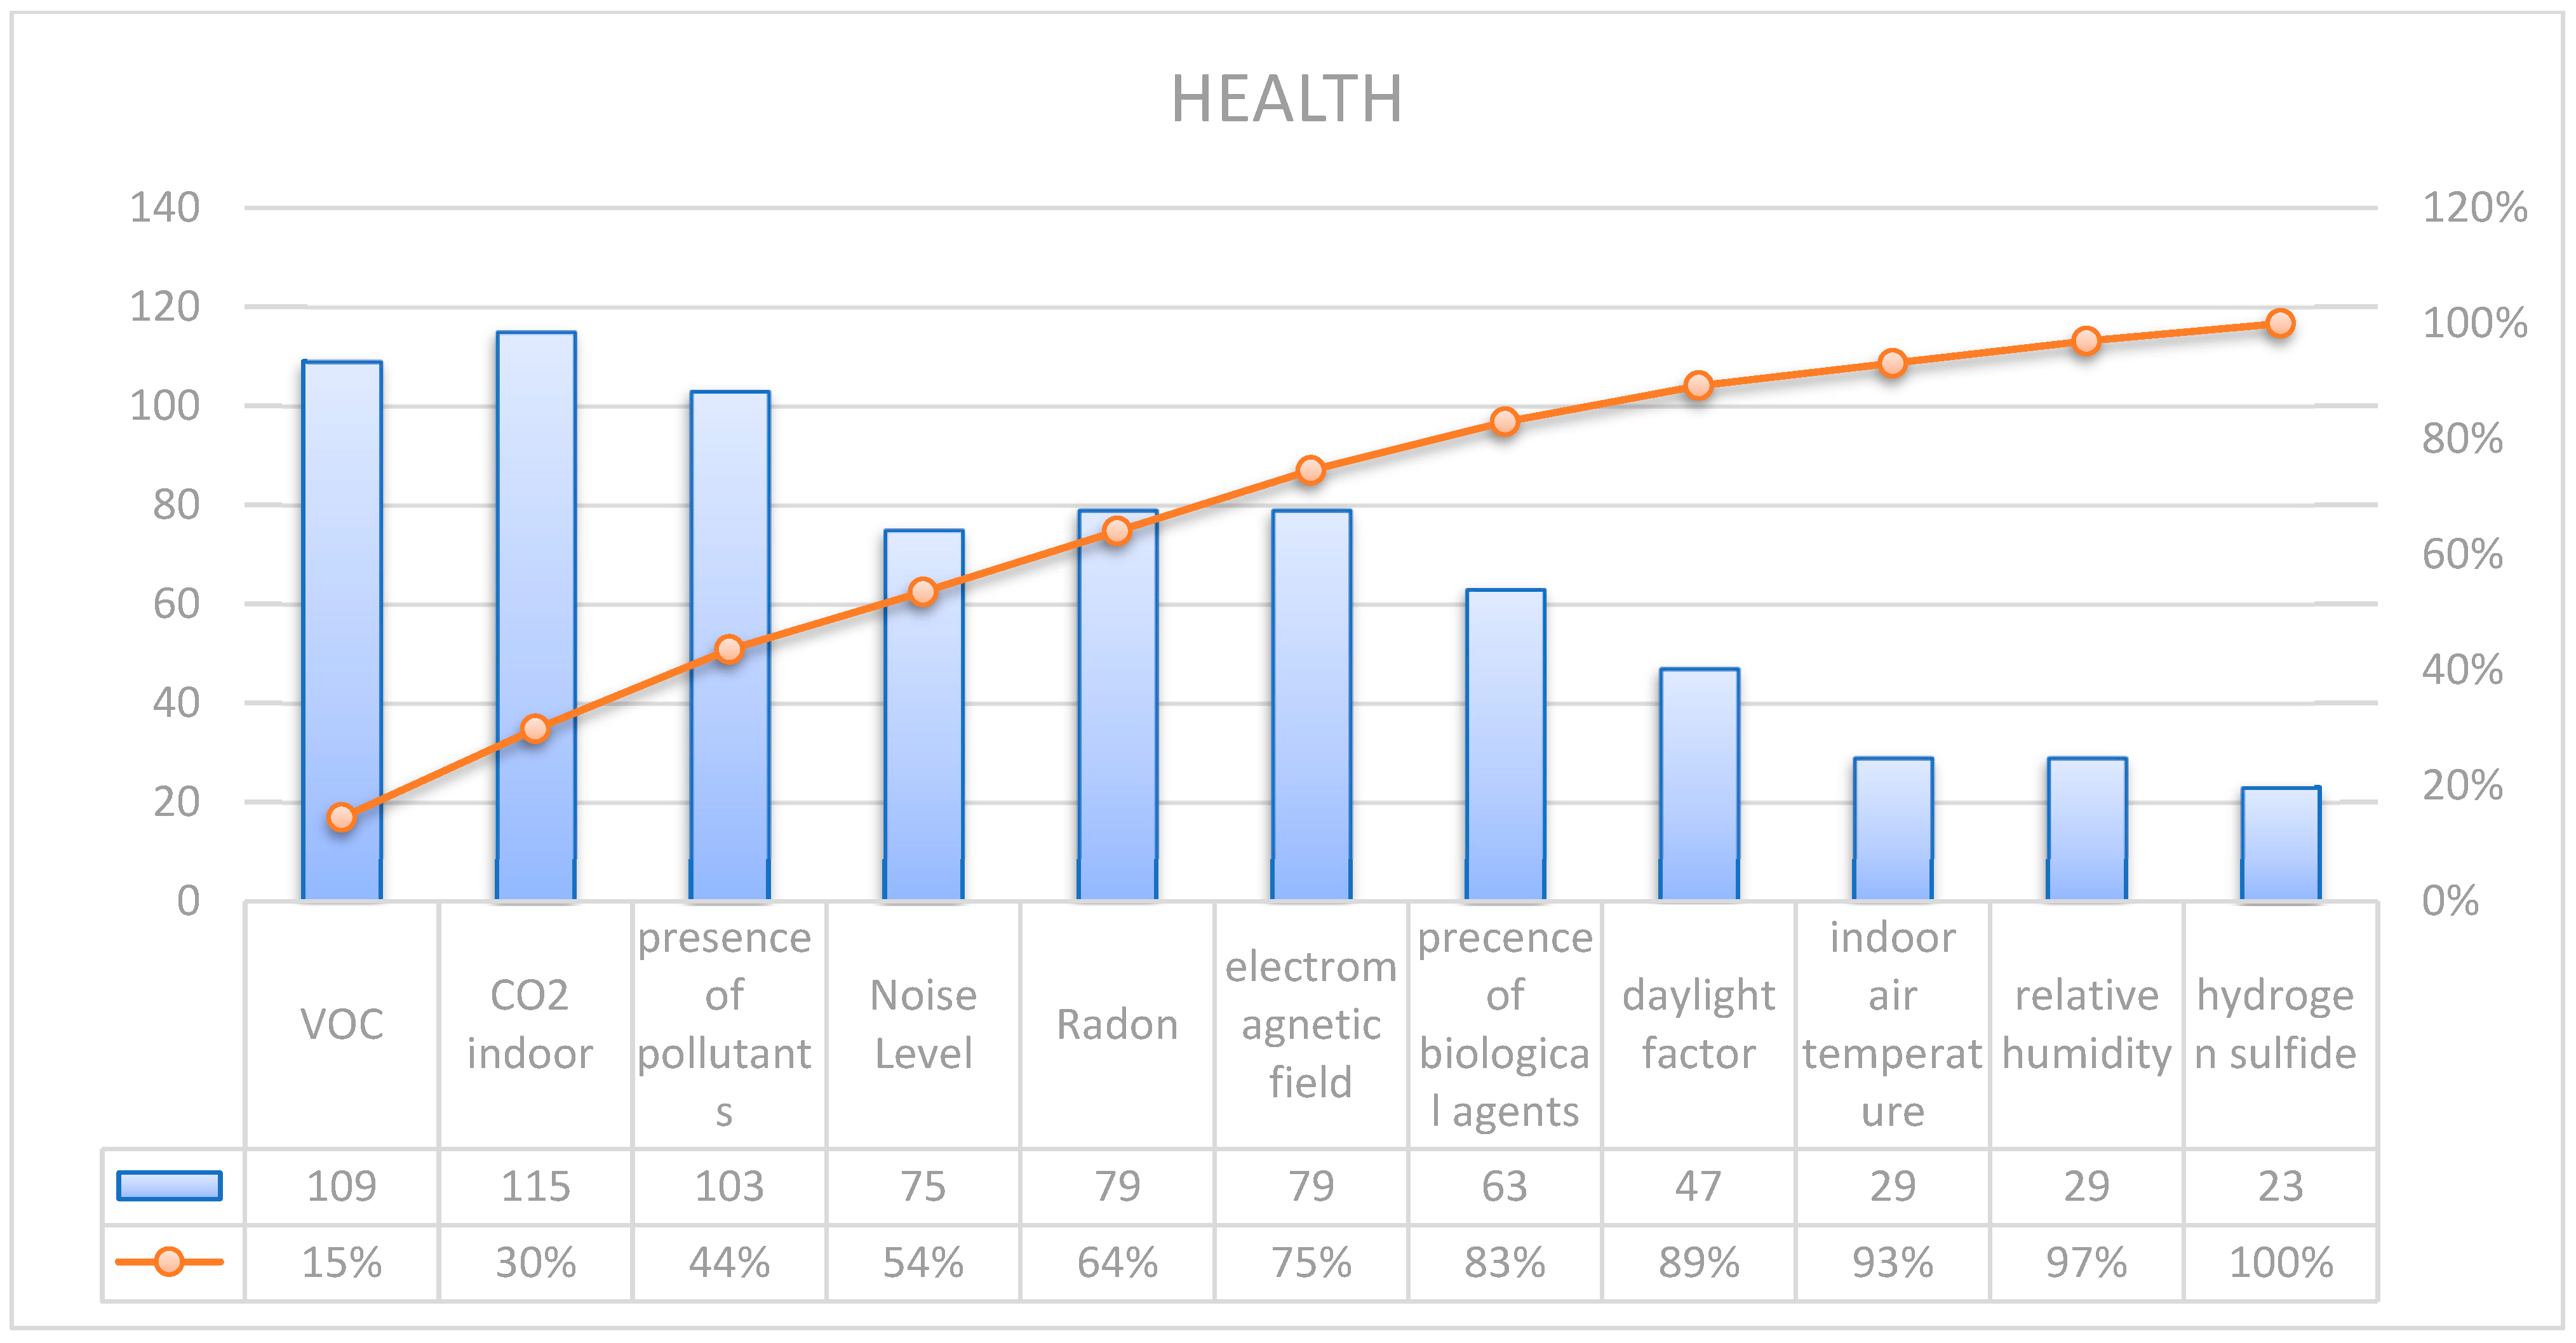
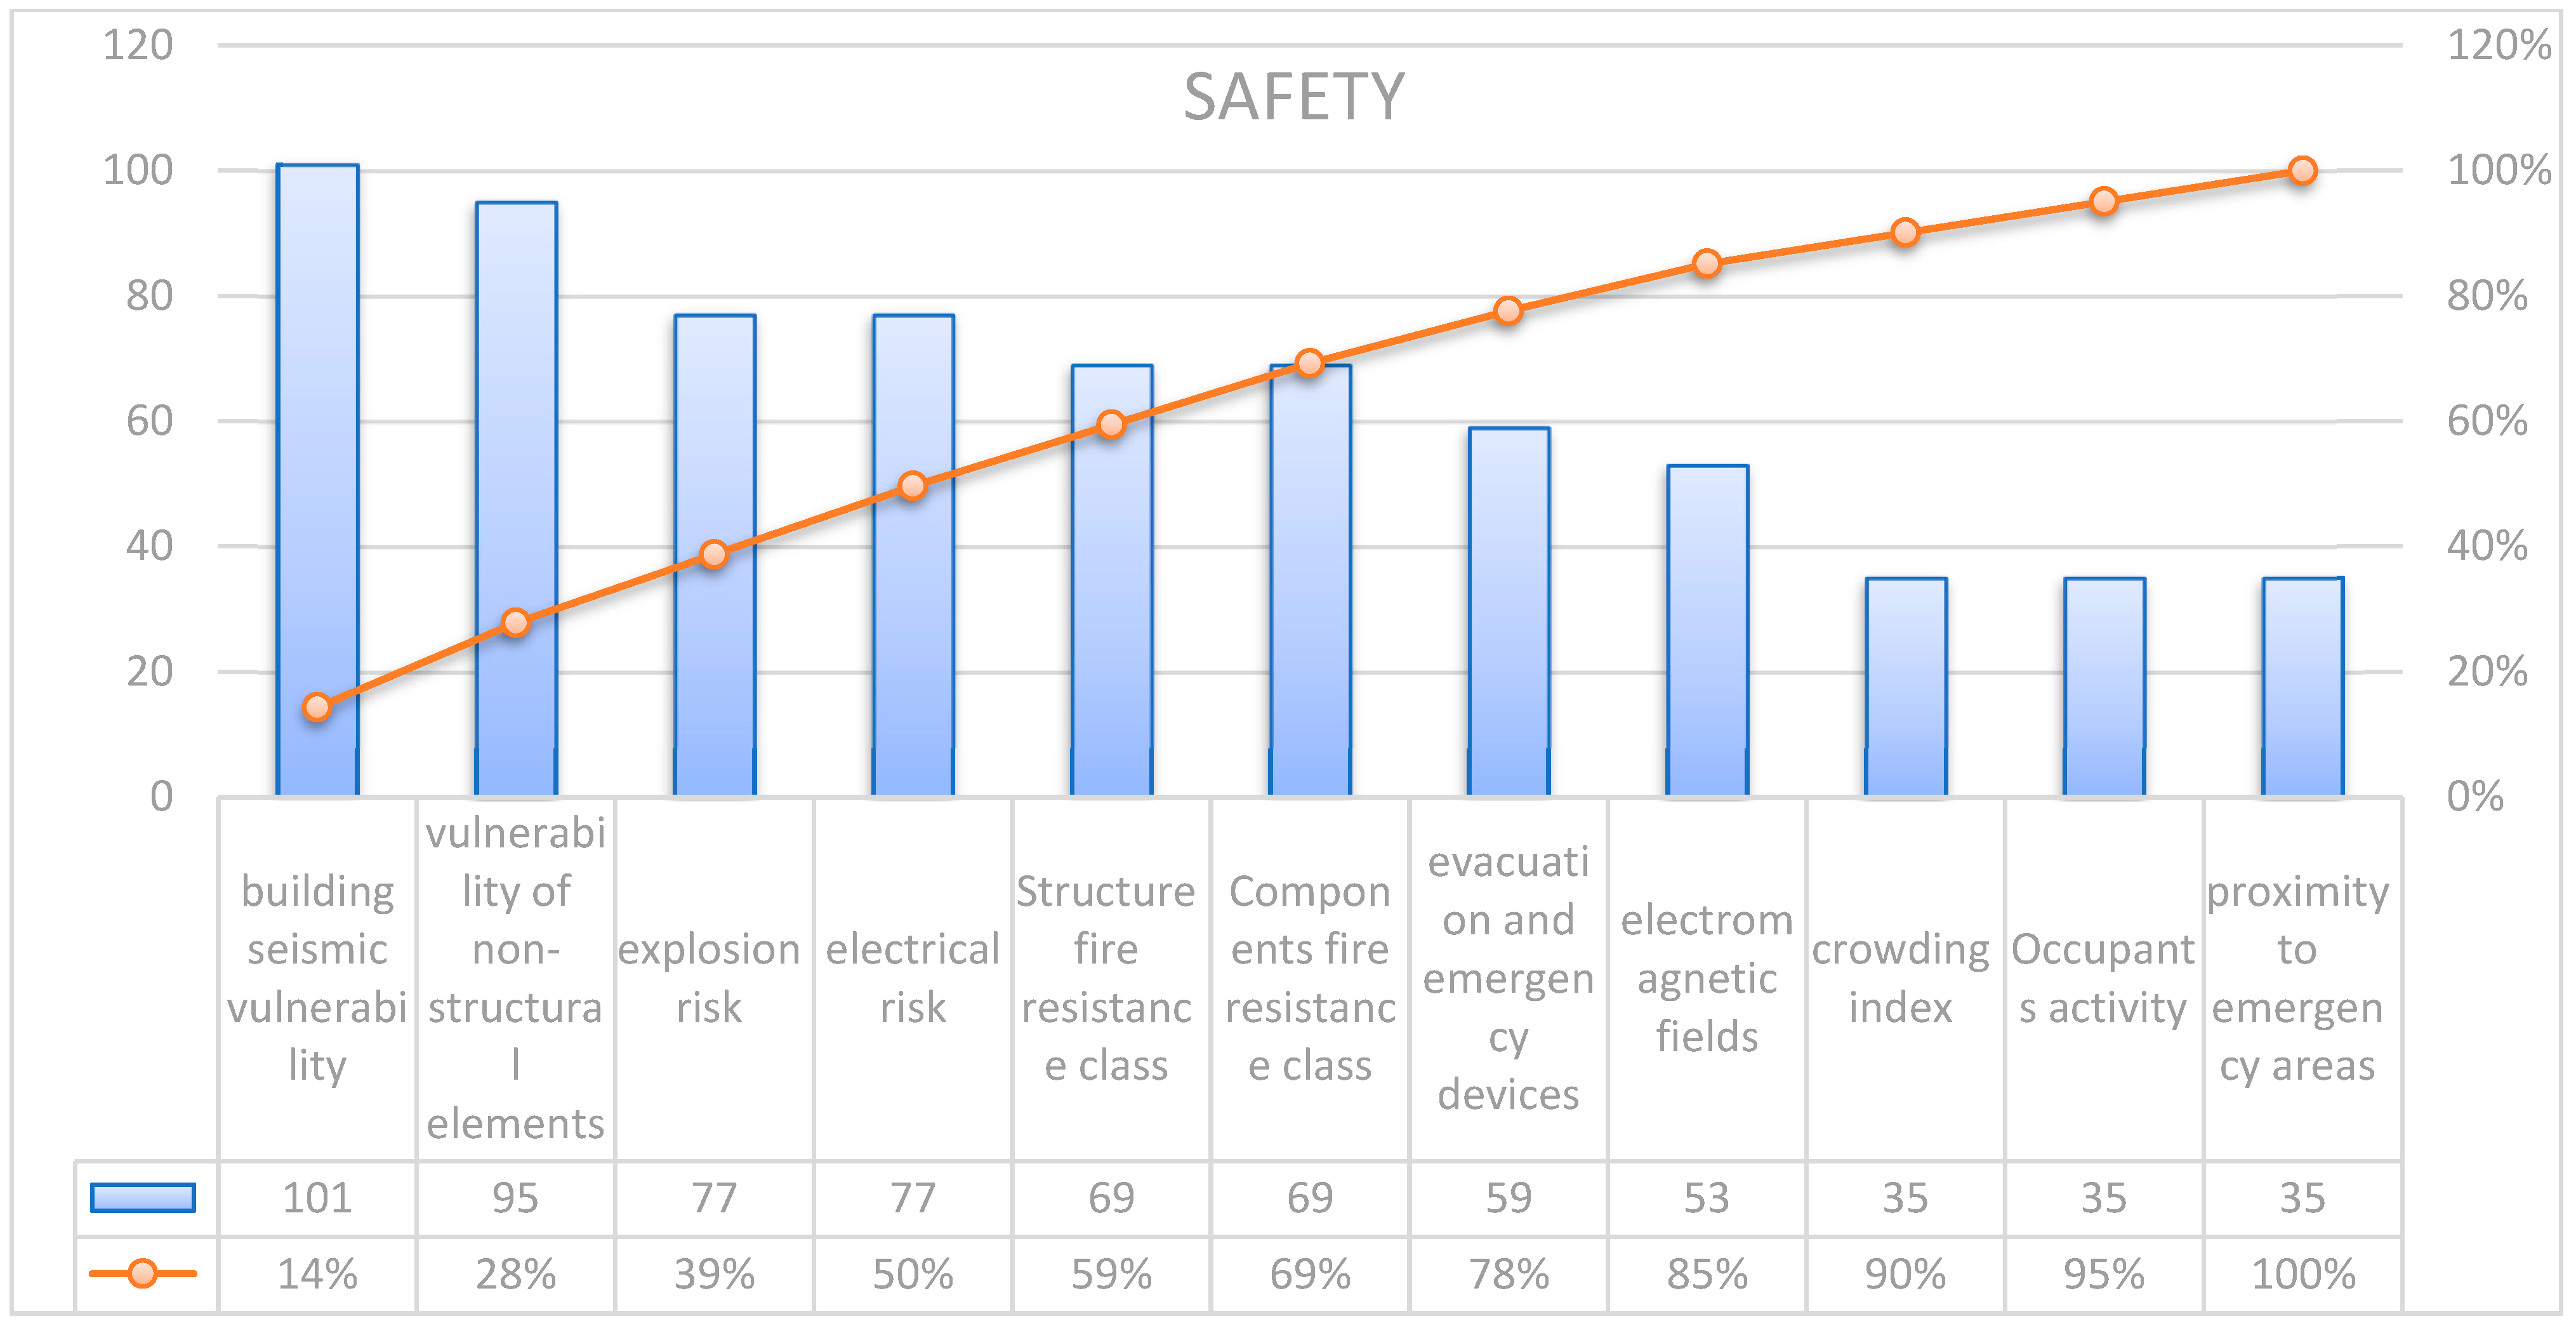
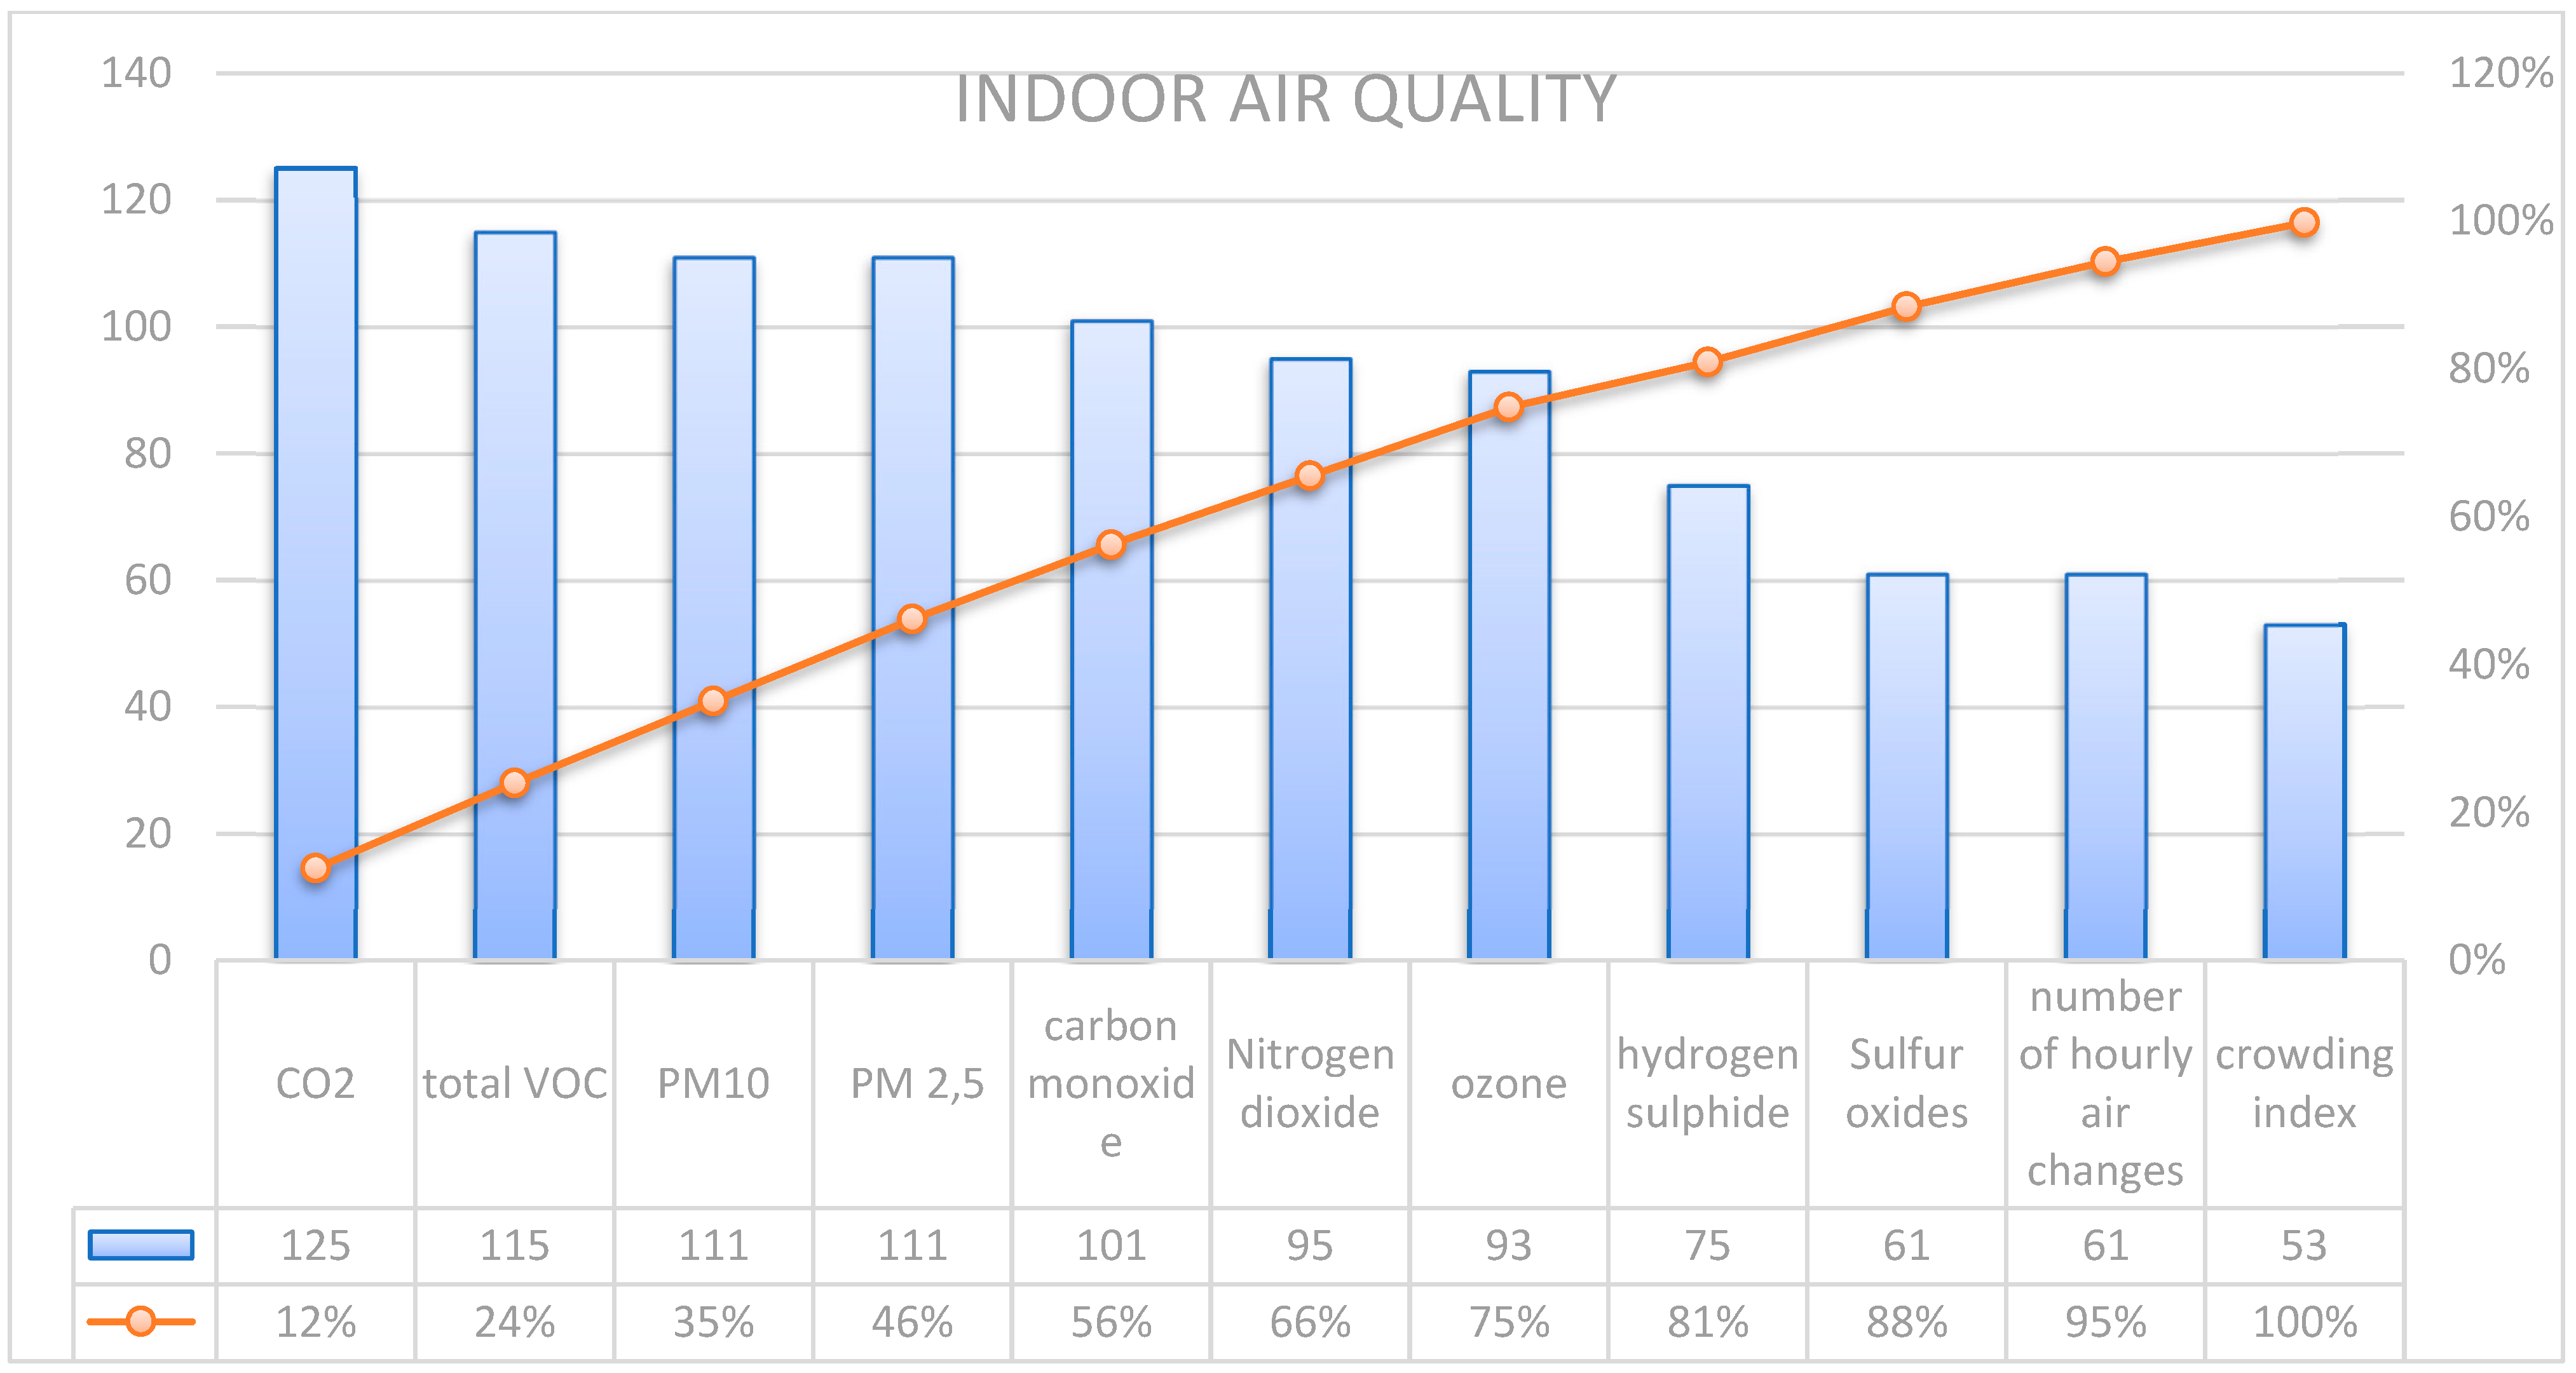
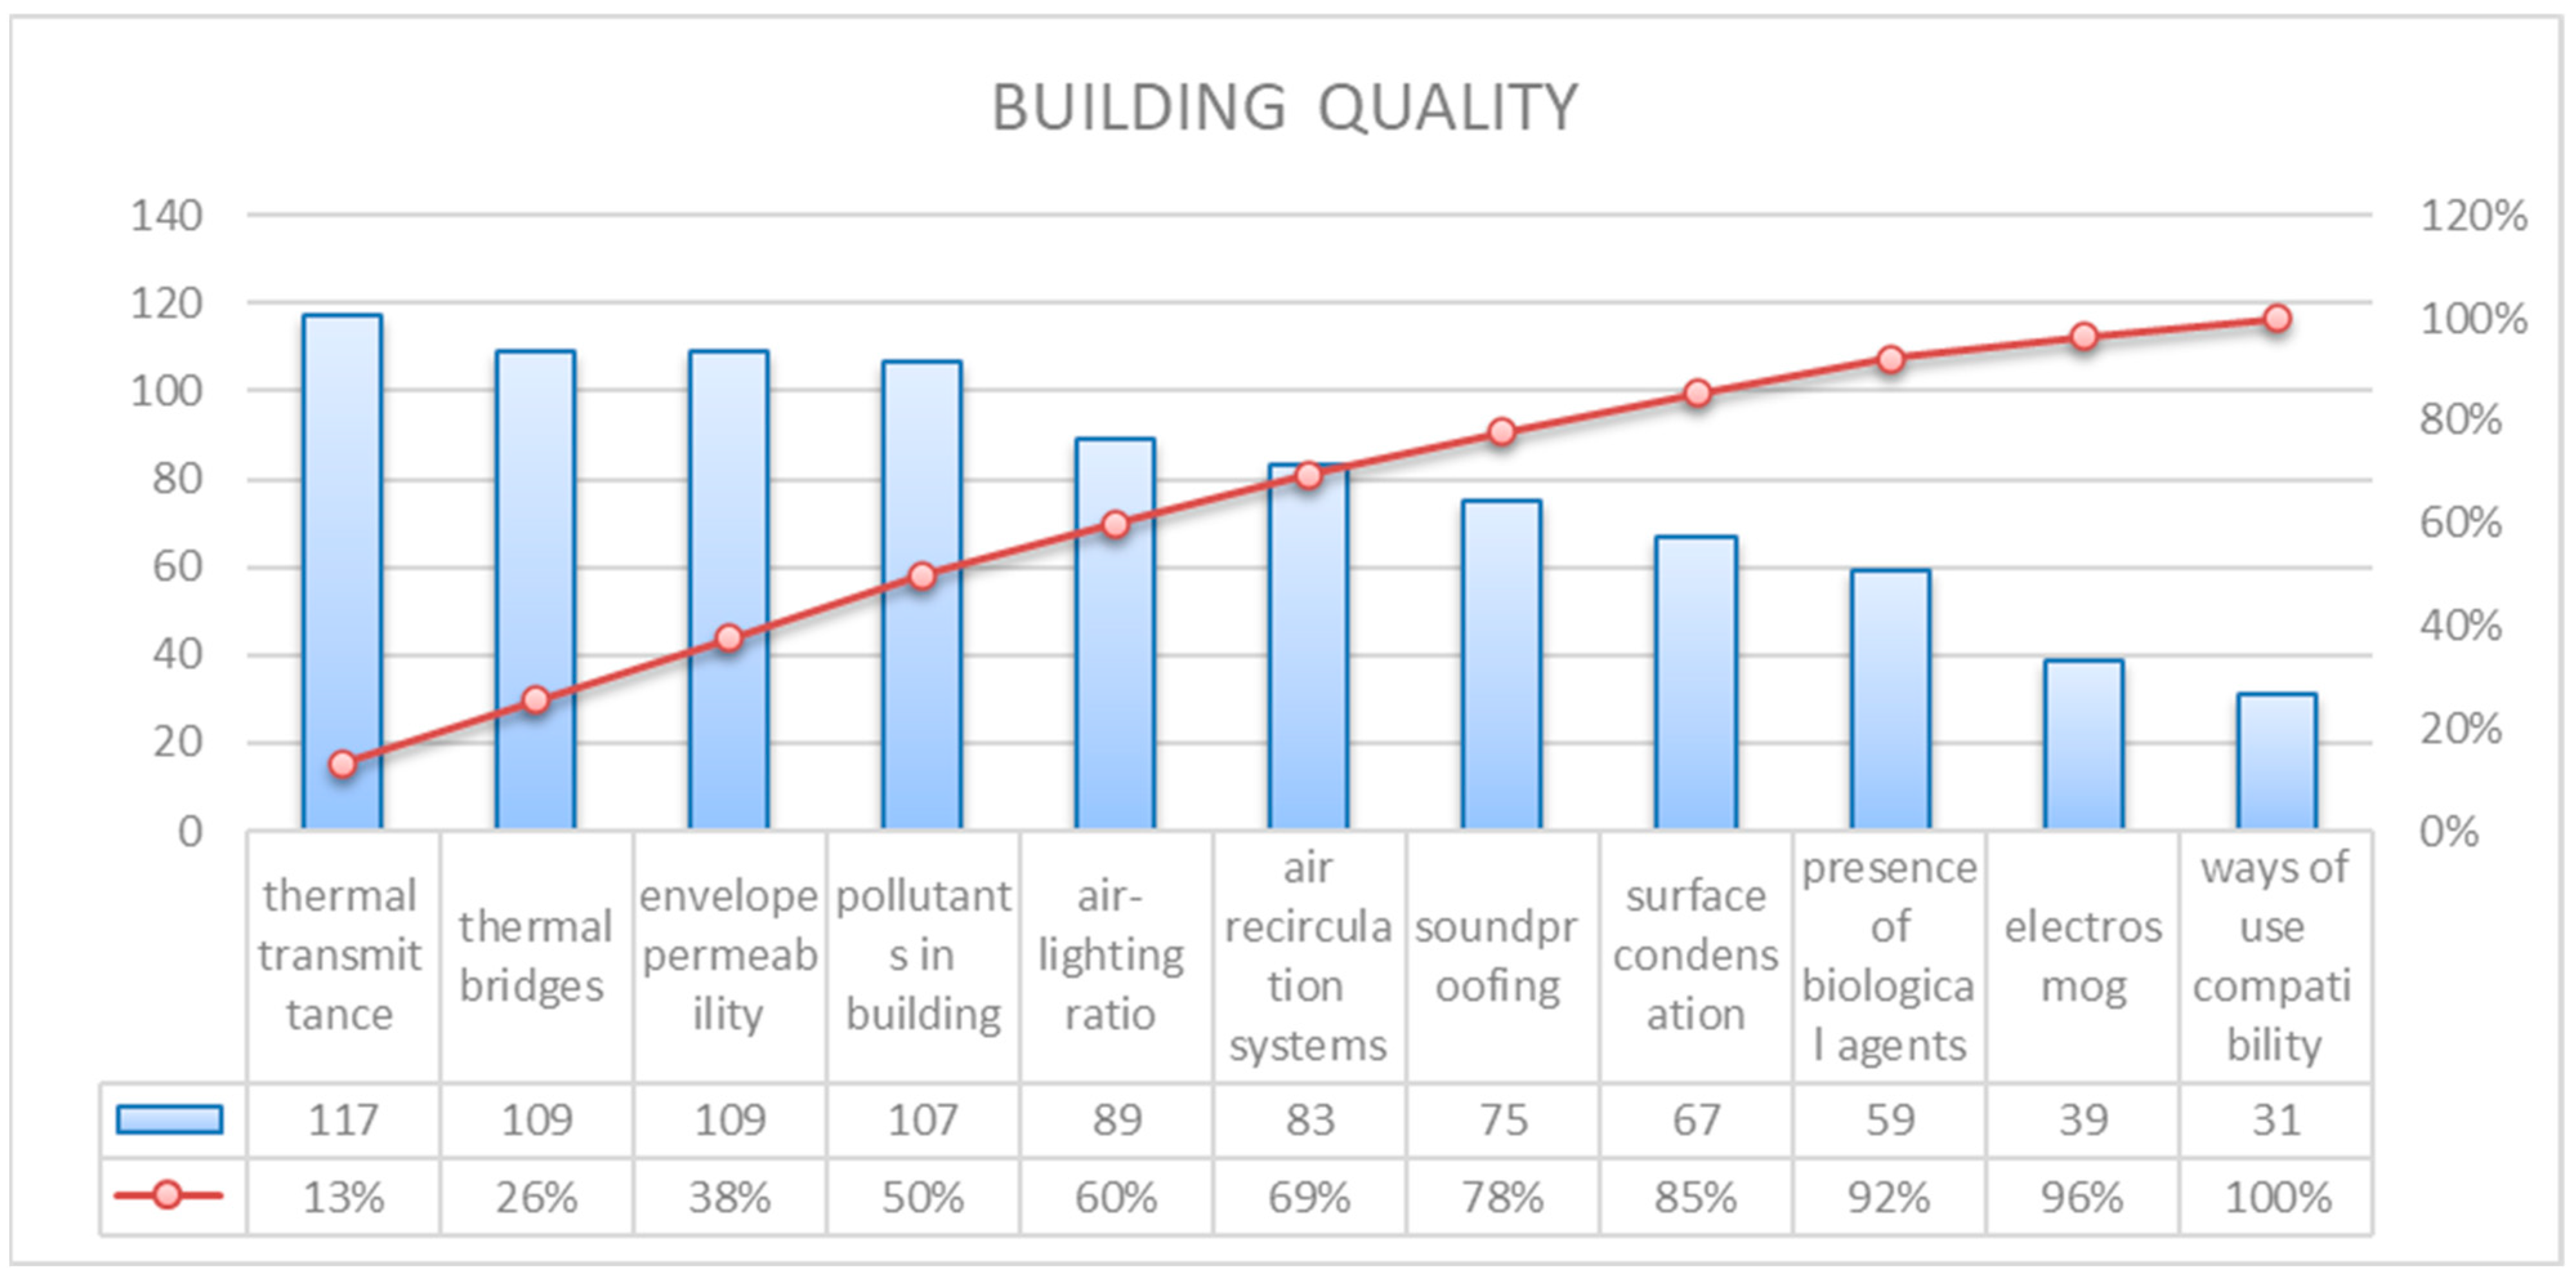
Figure 1, the bars display the percentage incidence of individual elements. It is evident that the taller bars are given by the most impactful elements overall, those that produce more effects. On the other hand, the red line shows the cumulative incidences of individual elements indicating how these elements collectively influence the whole. When the curve steepens, we are faced with a very effective element; when it flattens, it marks less relevant or negligible elements.
For each theme (see
Appendix A), the matrices in
Table 2 were developed, and the set was derived following the Pareto Analysis shown in
Figure 1. In
Appendix A, all the derived indicators for each theme are listed according to the described procedure: the indicators used to define Indoor Physiological Well-Being Index (IPW) are all indicators that describe and analyze the quality of confined spaces. These are objective indicators that unequivocally describe the progression of the phenomenon analyzed.
4. Results
Measuring the quality of confined spaces and consequently the level of indoor well-being is a complex and ambitious objective that poses significant methodological challenges. Issues may arise during the monitoring phase, particularly concerning the aggregation and interpretation of the abundant data and results. The main complexity, as mentioned, lies in the multidimensionality of the phenomenon.
Unlike in the reference method [
29], the authors chose to define a synthetic measure for each theme that, through an appropriate aggregation function, can capture the multiple aspects of the phenomenon investigated by the theme itself. It is believed that the system of elementary indicators, despite providing complete and exhaustive information, may be challenging to interpret due to its multidimensionality.
The objective pursued was to have, for each theme, a unique and one-dimensional quantification that encompasses the information, making it immediately visible and interpretable. This quantification is called the Synthetic Index for the Theme (SIT). This way, the observation of the phenomenon is simplified. The idea is precisely to make the data more accessible for reading and not to replace what has already emerged from the analysis of individual indicators.
However, there are many limitations to the use of the synthetic index in the literature, including the many components of arbitrariness that are necessarily introduced [
43]. There is a risk of drawing overly simplistic conclusions. During the definition of the synthesis function, the arbitrariness of the researcher plays a fundamental role; in fact, there are several possible choices to arrive at a synthetic index, ranging from descriptive statistical tools to the application of linear and non-linear functions. Despite the methodological limitations mentioned, synthetic indices are widely used to measure phenomena of economic, environmental, and social nature [
44].
4.1. The Development of SIT: A Linear Aggregation Method
To ensure that each theme analyzed can be represented in a synthetic manner, a linear method was chosen for aggregating the indicators. This choice depends on the fact that the selected indicators have the objective of expressing a quantitative value that is easily monitored and identifiable by all users of the monitoring system; in fact, this approach is aimed at the management of the built environment in order to promptly intervene on those parameters which, changing over time in relation to changes in boundary conditions, may not respect the safety of its occupants. Furthermore, this model is more flexible and can more easily be implemented by subsequent studies.
The methodology used to construct a synthetic index involves the following steps: definition of the phenomenon under study; selection of elementary indicators; standardization of elementary indicators; and weighting and aggregation of standardized indicators into one or more synthetic indices [
45].
In the case of SIT, the previous steps can be summarized as follows:
Definition of the theme. The concept to be measured should be analyzed clearly and unambiguously, elucidating all its constitutive aspects;
Selection of elementary indicators. The selection of elementary indicators, arising from the compromise between the need for non-substitutability and representativeness of each essential aspect of the concept, and the availability of data, occurred, as explained in the previous paragraph, through the Pareto Rule;
Standardization of elementary indicators.
Elementary indicators are often not comparable because they are expressed in different units of measurement (percentage, number, ratio). Standardization is the process that allows users to convert elementary indicators into pure or dimensionless numbers. The main methods of standardization include: for ranks, where the standardization is performed not on the value of the index but on its weight; for ratios, where the absolute values are divided by a reference base, such as the mean or maximum; for elative indices to the range of variation, where the absolute values are reported to a common interval; and for standardized deviations, where it is possible to resize elementary indicators so that they all oscillate within the same scale, transforming each indicator into a standardized variable.
A weighting of elementary indicators was then carried out, in order to match the measurement of the indicator to a clear judgment on a scale from 1 to 5: 1 is Not optimal; 2 is Mediocre; 3 is Sufficient; 4 is Good; and 5 corresponds to an Optimal rating.
Each score corresponds to a percentage interval corresponding to the measurement of the data, which is property of the indicator itself:
◊ = 1 Not optimal (0–20%) or (80–100%);
○ = 2 Mediocre (20–40%); or (60–80%);
□ = 3 Sufficient (40–60%);
■ = 4 Good (60–80%) or (20–40%);
● = 5 Optimal (80–100%) or (0–20%).
The choice in the first, second, fourth, and fifth weight of the interval depends on the positive or negative connotation assumed by the indicator. Where regulations and/or WHO 2010 guidelines provide legal limits, this interval has been divided into a percentage scale ranging from 0 to 100 on a proportion considering 0% = min (or min standard), 50% = max standard, and 100% = double the max standard. In the case where the standard does not define a minimum and a maximum but exclusively a standard, the reasoning remains unchanged, admitting 0% = min (or ½ standard), 50% = standard, and 100% = 2 times the standard. After taking measurements, it is possible to identify the interval in which they fall by performing the linear operation of the proportion 2 times max standard (or 2 standard): 100 = a:x, where a represents the value obtained through measurements and x represents the percentage value of the measurement. It should be noted that the standard or norm values may be numeric or descriptive.
At this point, it is possible to identify the Relative Weight of the j-th indicator with respect to the sum of the maximum attainable Absolute Values. It is calculated using Equation (3) as follows:
where K
j° is the Relative Weight of the
j-th indicator calculated with respect to the sum of the maximum attainable Absolute Values (AV), with AVmax = 7 × 5; K
jmax is the Maximum Absolute Value Attainable by each indicator, K
jmax = 5; K
j is the Absolute Weight of the
j-th indicator.
Regarding the aggregation functions, the most common procedure involves the use of a linear function. The aggregation method is the sum of the relative weights using Equation (4) as follows:
where K
j° is the Relative Weight of the
j-th indicator calculated with respect to the sum of the maximum attainable Absolute Values and SIT
i is the synthetic index for the
i-th theme. In this way, the synthetic index of the theme may be represented in a matrix, expressed as a percentage.
In the following
Table 3, the indicators of the Building Quality theme have been simulated and reported as an example of how the matrix works.
4.2. The Graphical Representation
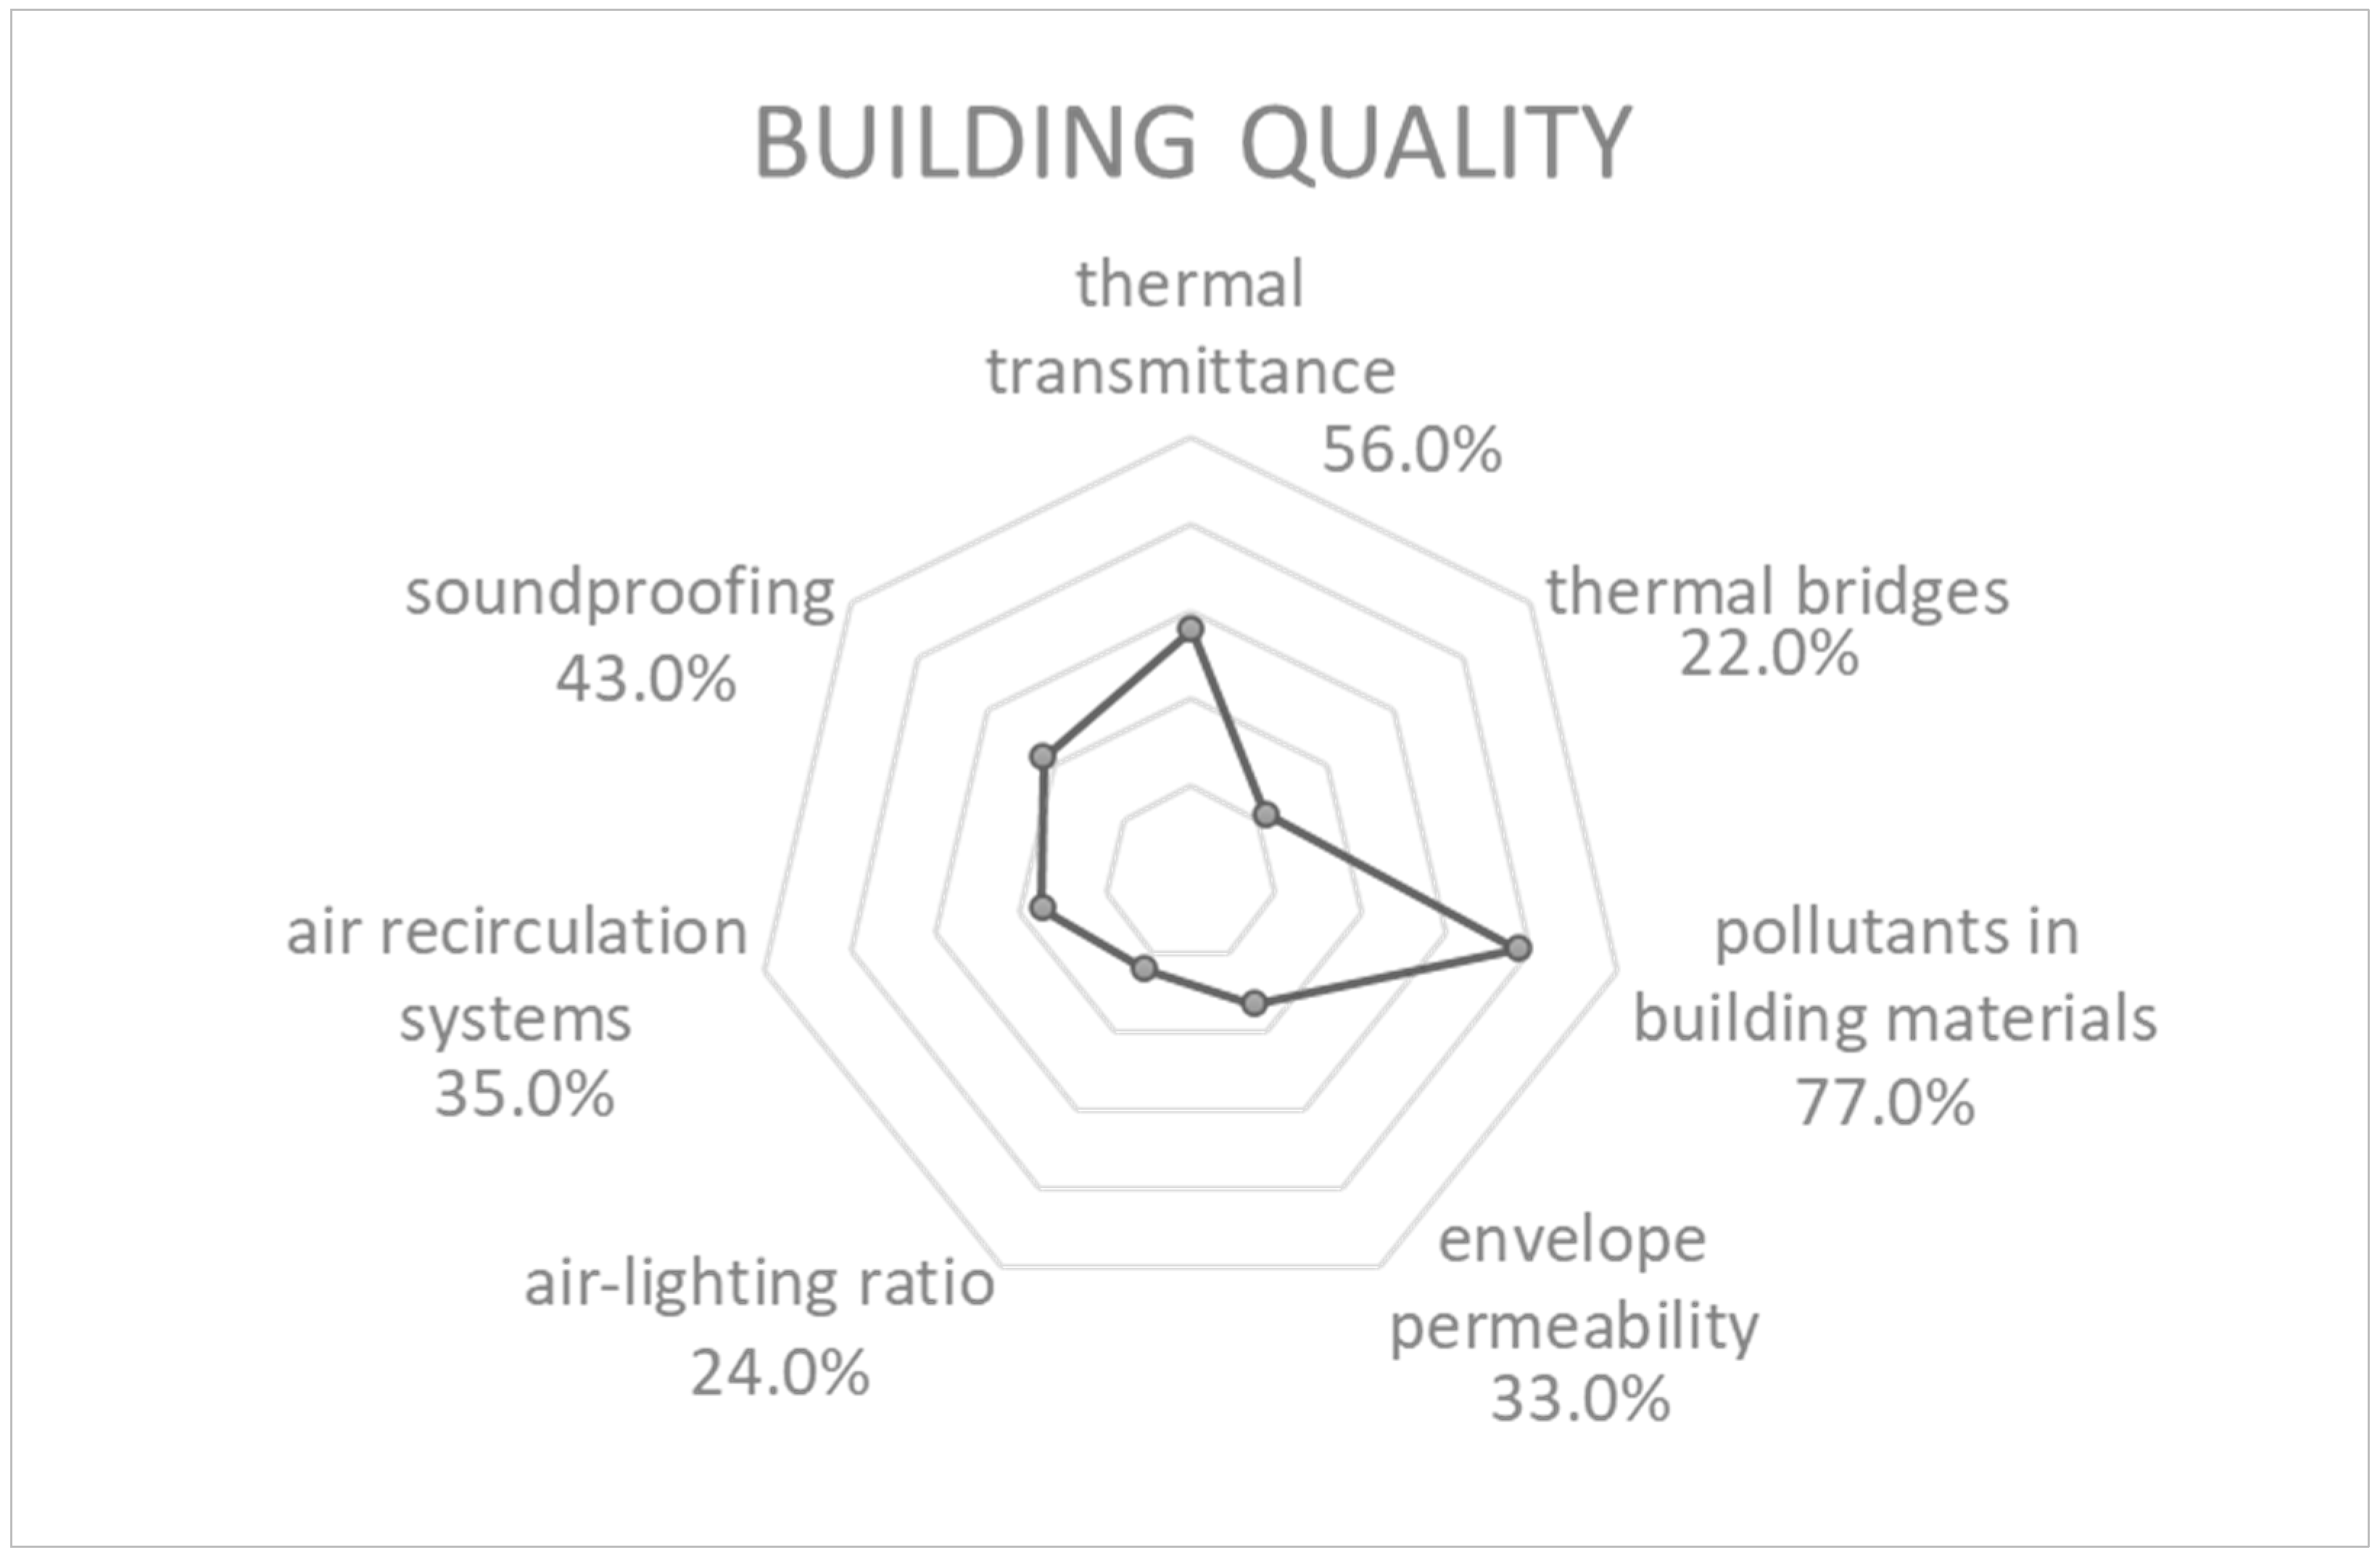
A graphical representation has been associated with the synthetic measure of the indicators to allow a quick and visual verification of the trend of the thematic area. This visualization is achieved through the radar chart. The radar chart or Kiviat diagram allows the simultaneous display of multiple series of data, with values distributed along Cartesian axes. As one can easily understand, this type of chart is very useful to visually analyze the direction taken by the observed indicators. Furthermore, the comparison between them is immediate.
In the following
Figure 2, the measure of the indicators of the Building Quality theme related to the simulation in
Table 3 has been shown as an example of how the radar chart works.
4.3. The Built Environment Quality Monitoring System
The final aim of the research was to achieve a one-dimensional quantification of the quality of the built environment for the physiological well-being of the occupants through a synthetic monitoring system of the previously identified indicators. This quantification is called Indoor Physiological Well-Being Index (IPW).
The operational procedures are those described for the identification of the synthetic index for each thematic area. A weighting of the thematic areas was performed: 1 is Not optimal; 2 is Mediocre; 3 is Sufficient; 4 is Good; and 5 corresponds to an Excellent rating.
Each judgment corresponds to a percentage interval derived from each theme analyzed:
◊ = 1 Not optimal (0–20%) or (80–100%);
○ = 2 Mediocre (20–40%) or (60–80%);
□ = 3 Sufficient (40–60%);
■ = 4 Good (60–80%) or (20–40%);
● = 5 Excellent (80–100%) or (0–20%).
The definition of the percentage interval to be associated with the thematic area is given, in this case, by the value of each SIT. The aggregation method is always that of the sum of relative weights:
where K
j° is the Relative Weight of the
j-th indicator calculated with respect to the sum of the maximum Absolute Values achievable, and IPW is the Indoor Physiological Well-Being Index. In the following
Table 4, the SIT values have been reported as an example of how the IPW matrix works.
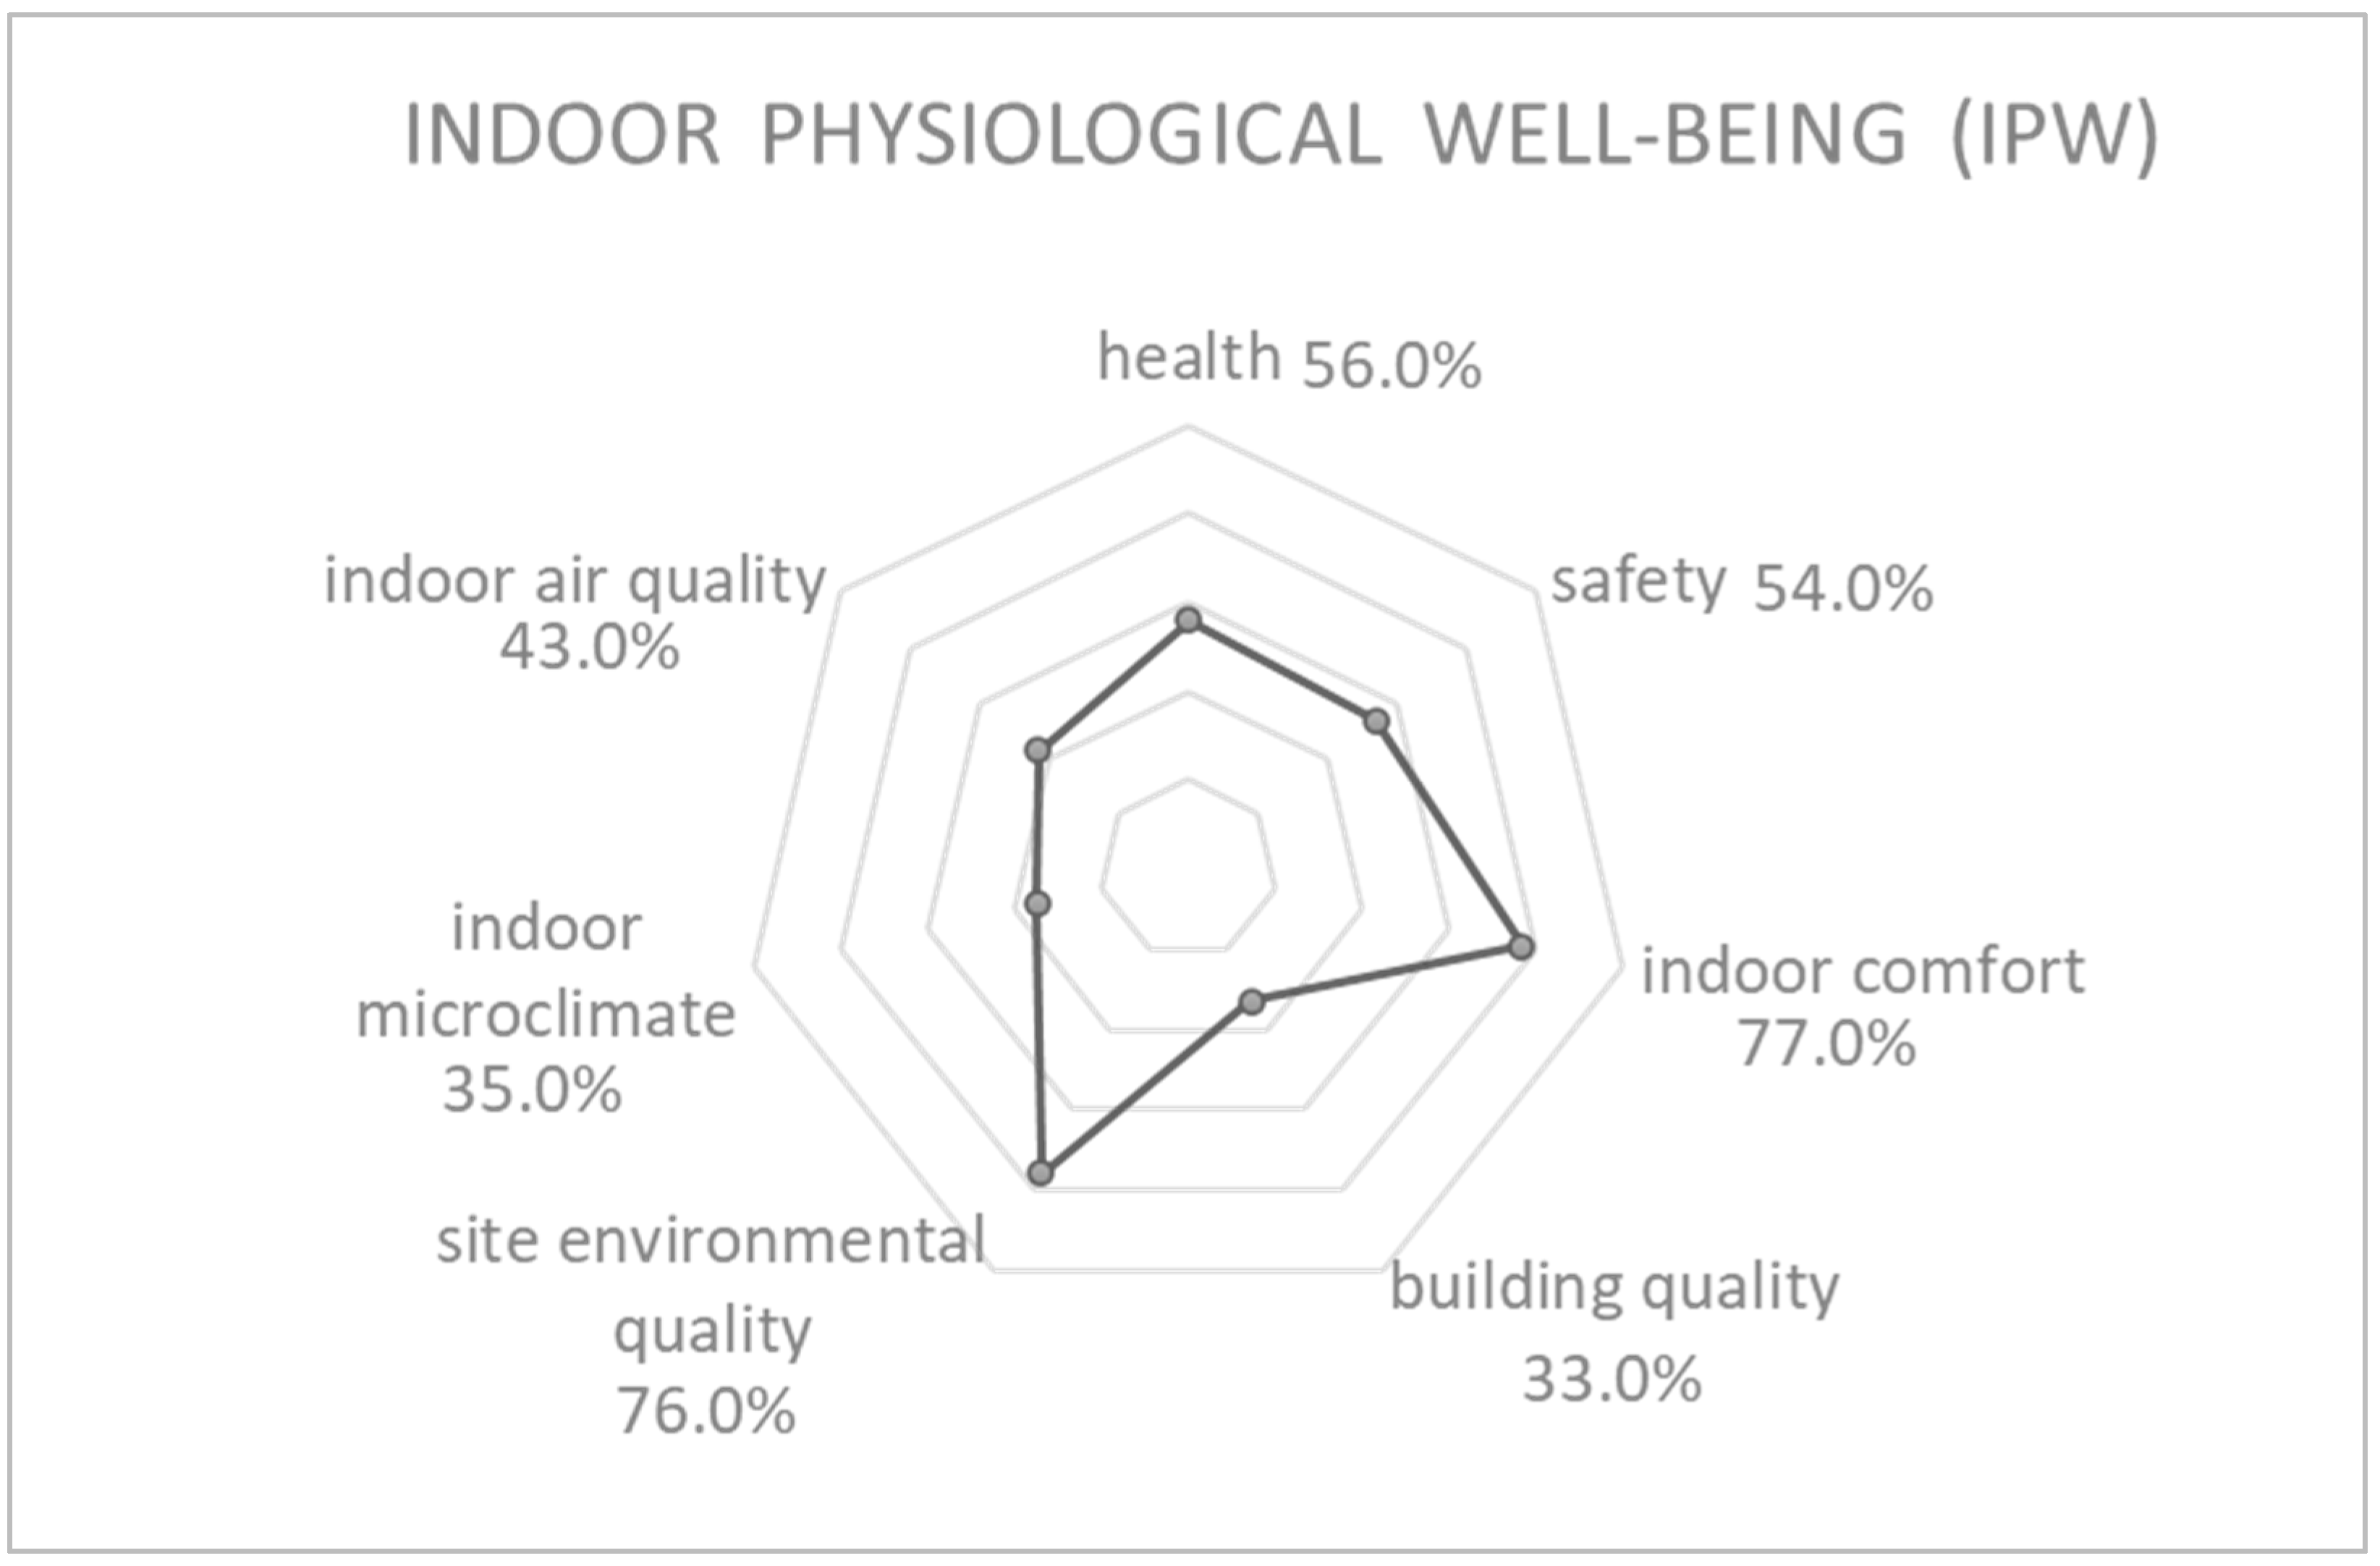
In this way, for individual themes, a graphical representation of the trend of the Indoor Physiological Well-Being Index is also presented here through the radar chart (
Figure 3). The percentage values of the individual themes are reported along the axes of this diagram.
The radar chart is a tool for clearly reading the level of indoor physiological well-being in relation to Built Environment Quality by showing it to occupants, technicians, and designers. The diagram shows the progress of each theme linked to indoor physiological well-being, allowing timely and precise corrective actions on the building. The tool also allows to provide a comprehensive reading of the built environment’s performance in relation to indoor physiological well-being.
5. Discussion
The definition of a methodology to describe and monitoring Built Environment Quality through an Indoor Physiological Well-Being Index offers users (governance, designers, and researchers) the opportunity to make use of an assessment and management system based on data specific and strong indicators resulting from accurate acquiring data. However, this index has not yet been empirically validated through real-world applications: in fact, in this contribution the focus is exclusively of methodological nature, the next developments of the research include the validation of the proposed monitoring system on real and diverse cases studies.
Assessment and management are activities that provide information and essentially concern all aspects of the process being examined, as they serve to measure the achievement or non-achievement of a standard or optimization. This tool is used to evaluate the often-variable performance and may offer suggestions for any procedural changes, leaving the basic structure and organization unchanged. Therefore, it is a way to document and investigate certain classes of phenomena through the systematic study of the development of a particular phenomenon, with the aim of observing the trend of variables over time. It is carried out in the form of periodic and regular surveys.
Monitoring serves as the basis for the evaluative process. It is used to investigate and understand the phenomenon to ensure that the evaluator reaches a synthetic judgment on the characteristics of the phenomenon, suggesting strategies to improve its state or condition if the objective is not achieved.
Today, exclusively monitoring the environmental quality of built environments is no longer an option: the need to establish goals, methods of achievement, and verification of results through indicators is a necessary condition to define indoor well-being. From this perspective, measuring all the factors involved is at the heart of monitoring process management. This allows users to identify the data that needs to be collected and analyzed, documenting the developments of ongoing activities, identifying strengths and weaknesses, and guiding improvement phases accordingly.
It is known that as the volume of data increases, managing systems becomes increasingly difficult. One of the main challenges encountered is distinguishing truly important measures from superfluous ones. In this regard, it was necessary to recognize the key indicators from those measures that were found to be superfluous and could be neglected. For this reason, the number of proposed indicators is reduced, keeping the ultimate goal in mind: representing the achieved result coherently and consistently with the investigated multidimensional system. Nonetheless, the authors recognize that a holistic view of well-being must include qualitative insights to gain a more comprehensive assessment [
46].
The design and execution of this investigation were the result of a multidisciplinary effort. Therefore, the design activity has to proceed by taking into account all the aspects involved. The main steps taken for the correct definition of the monitoring system are:
Definition of the objectives that indoor well-being must pursue;
Analysis of the research context;
Definition of indicators;
Survey design: the definition of the survey design primarily aims to address the need to determine the most suitable system to obtain the desired data. It is clear that, depending on the information of interest, it is necessary to refer to different typologies of surveys. Indeed, using an inappropriate survey could compromise the purposes of the research in whole or in part. Therefore, it is important to define the survey technique to be used for data collection.
Survey operational phases: with the expression “operational phases” we identify the entire part of the production cycle of a survey, which ranges from the measurement of the characteristics of interest on selected units to the availability of data for statistical analysis. In this context, we distinguish the following operational phases: Detection; Review; Statistical processing; Validation; and Diffusion.
The results dissemination, which might seem accessory, is of vital importance. The dissemination of results must take into account both the channel used and the characteristics of the users. Direct dissemination methods may be favored, where the means and ways of transferring information are managed by the producer, or indirect methods. In this case, the data dissemination phase is represented through the synthesis index and radar charts.
6. Conclusions
This paper thoroughly describes a new methodology to derive a synthetic Indoor Physiological Well-Being Index, not yet present in the literature. The main aim of this study is to relate various aspects of living in a confined environment, represented in the research by the seven themes, into a single set of information which is able to express unequivocally and synthetically the level of habitability of an environment in relation to the numerous data acquired about the system itself. Currently, indoor environmental quality only partially captures the properties of an environment in relation to its impact on the well-being of occupants.
The outputs of the presented work, being easy and immediately readable, can be used by occupants to monitor the living performance of their work and living environment. Technicians, designers, and governments can also manage them to implement strategies for enhancing the Built Environment Quality, aligning with the goals of the UN’s Agenda 2030. The methodology is also suitable to define predictive scenarios through the proper management of the elementary indicators described.
The proposed methodology is compatible with the support of new technologies for data acquisition and monitoring, facilitating the measurement of a large number of indicators considered in this work. Built environment monitoring with sensors calibrated according to the described methodology and supported by a suitable digital architecture is the subject of the next research development.
Although relying only on quantitative parameters can neglect important qualitative dimensions, such as occupant satisfaction, including further domains would have led to the adoption, already at this stage, of non-linear aggregation methods, complicating the reading of the outputs in relation to the buildings’ construction aspects that we wanted to highlight in this work. In any case, for a more complete interpretation of indoor well-being, both qualitative and quantitative aspects must be taken into consideration, with the disadvantage, however, of further burdening the methodology in the description of such a complex phenomenon.
