Article

Study on the Dynamic Evolution and Driving Forces of High-Quality Development of Coal Cities in China

School of Economics and Management, Anhui University of Science and Technology, Huainan 232001, China
*
Author to whom correspondence should be addressed.
Sustainability 2025, 17(4), 1707; https://doi.org/10.3390/su17041707
Submission received: 19 January 2025 / Revised: 15 February 2025 / Accepted: 16 February 2025 / Published: 18 February 2025

Abstract

:
To more intuitively demonstrate the locational distribution of spatial agglomeration of HQD (high-quality development) in China’s coal cities, this study uses the entropy value method, standard deviation ellipse, and geographic detector to investigate the law of dynamic evolution and driving factors of HQD in China’s coal cities from 2011 to 2020. The findings are as follows: (1) The HQD level of China’s coal cities is experiencing a positive trajectory, with the highest level of development in the east, followed by the regions located in the center and west of the country, and relatively low in the northeast. Throughout the “Twelfth Five-Year Plan” period, Suzhou made the greatest progress, while Fuxin had the greatest decline. Throughout the “13th Five-Year Plan” period, Xingtai and Handan made the greatest progress, while Qitaihe had the greatest decline. (2) The HQD level of China’s coal cities as a whole shows a northeast–southwest direction, the center of gravity shifts southward, indicating a concentration pattern. The eastern and central areas are oriented in a northwest–southeast direction; the center of gravity in the east shifts to the northwest, and the center of gravity in the middle shifts to the southeast; and both regions have a higher level of HQD in the east–west direction. The western and northeastern regions are in a northeast–southwest direction, with the center of gravity moving to the northeast: the western region shows a tendency toward diffusion, and the northeastern region shows an agglomeration trend. (3) Patent authorization per 10,000 people, foreign trade dependence, R&D investment intensity, and GDP per capita were important drivers for the HQD of China’s coal cities; The degree of government intervention is the best interaction factor, and the degree of opening to the outside world and the forest coverage rate are the best interaction objects.

1. Introduction

Being designated as a national resource security base, coal cities have significantly contributed to the economic development of China. With the expansion of the scale of resource extraction, coal cities are encountering difficulties such as resource depletion, ecological deterioration, economic recession, an increasing poverty population, and spatial layout fragmentation [1]. The report to the 19th National Congress of the Communist Party of China highlighted that China’s economy has transitioned from a phase of rapid expansion to a phase of HQD [2]. Throughout the duration of the “14th Five-Year Plan” period, the state re-emphasized the need to comprehensively apply macroeconomic policies, stimulate innovation and vitality, focus on perfecting institutional reforms, promptly address the obstacles in the development of the coal city transition, and rapidly form the endogenous impetus to promote its HQD [3]. It can be seen that HQD has become a new opportunity for the transformation and upgrading of coal cities. In addition, because different coal cities have different development backgrounds and patterns with significant spatial differences, the influence and stimulation of the external spatial environment make the HQD of coal cities full of challenges and diversity. Therefore, scientific assessment of the level of HQD of coal cities, objective analysis of their spatial concentration and distribution trends, and detection of the driving factors of their spatial differences are highly significant both in theory and practice to promote the HQD of coal cities.
In recent years, scholars’ research on HQD has gradually emerged as a prominent hub in the academic world. First, regarding the connotation of HQD, Jin believed that HQD was built on highly developed productive forces, which was an effective fit between the instrumental rationality of a market economy and the intrinsic truthfulness of economic development [4]. Ren and Wen believed that HQD with economic, social, and environmental connotations better represented the HQD needs of the new era [5]. Zhang et al. considered that HQD included the synchronized advancement of the five components, such as green and sustainable, to fulfill the growing demands of individuals for an improved quality of life [6]. Gao et al. interpreted it from the perspective of sustainable development theory, interpreting high-quality development as funny, fair, and sustainable [7]. Secondly, in the construction of an HQD index system, some scholars used a single index to measure it, such as Yu and Liu, and He and Shen used total factor productivity and its decomposition index as the index to measure HQD [8,9]. Hui et al. measured the level of industrial HQD using green total factor productivity [10]. These single indicators are simple to calculate, easy to obtain, and effective in measuring HQD, but they cannot reveal their full picture [11]. Some scholars have constructed evaluation index systems from a multidimensional perspective. For example, Yang and Wang, Li et al., and Wang and Chen constructed evaluation indexes guided by the new development concept [12,13,14]. Xin et al. created a comprehensive evaluation index system that encompasses four key aspects: economic vitality, innovation efficiency, green development, and quality of life [15]. Yang and Zhang built an HQD indicator system from the allocation of economic outcomes, the distribution of human capital and its dispersion, economic efficacy and stability, natural resources and the environment, and social circumstances [16]. Third, in terms of HQD evaluation methods, Wang and Chen used standard deviation ellipse and kernel density estimation to study the statistical properties of the distribution and dynamic evolution of HQD in four major regions of China [17]. Gao et al. used principal component analysis (PCA) to measure the high-quality development level of China’s Marine economy [18]. Qu et al. used the systematic clustering algorithm and Markov chain matrix to measure the level of HQD of provincial economies and their dynamic evolution [19]. Heng and Yan analyzed the dynamic evolution of the level of HQD in the logistics industry in China’s regions by utilizing the kernel density estimate and the gray correlation approach [20].
The issue of HQD in resource-based cities is both a focus of national and local governments and a hotspot in the academic world [21]. Numerous scholars, including Cao & Kang et al., have conducted research on the effects of the digital economy, supportive policies, environmental, institutional quality, and government innovation on the HQD of resource-type cities [22,23,24,25,26,27]. Scholars such as Liu and Zhang, Wu, and Xu et al. explored the driving mechanism and realization path of HQD in resource-based cities [3,28,29]. Cui et al. believe that economic growth and environmental regulation have a positive impact on the high-quality development of resource-based cities, while energy intensity has a negative impact [30]. Scholars such as Zhang and Zhang, Liu and Bian, and Cui et al. analyzed the level of HQD of resource-type cities and the factors influencing it from different perspectives [1,21,31]. Lu et al. measured the ecological position of HQD in 115 resource-type cities in China and analyzed it in time and space [32]. Xiao et al. used a panel smoothing transformation model to identify the level of economic HQD and its transformation law in resource-type cities in China [33]. Que and Wen studied the spatial governance of HQD of resource-type cities in coastal zones according to the perspective of cross-system impacts [34]. Ye et al. used the SD-FLUS comprehensive model to study the optimization of China’s land spatial pattern during the transformation of resource-based cities [35]. Liu et al. believe that the high-quality development of resource-based cities should adopt an environmental priority model, appropriately increase innovation input, and rationally allocate it [36].
Relevant scholars’ research on HQD has achieved fruitful results, providing an important reference for this study. However, there is a lack of investigation on expanding HQD to coal cities, especially research regarding the dynamics of their spatial distribution, which remains rare. Spatial distribution plays an important role in promoting the overall construction of coal urban spatial planning and the coordinated development of various elements. Given this, this study utilizes the entropy value method to measure the level of HQD of 40 typical coal cities from 2011 to 2020, applies the standard deviation ellipse to investigate their spatial agglomeration and location distribution characteristics, and employs geographic probes to analyze the driving factors of their spatial differentiation to provide reference ideas for coal cities to realize HQD.

2. Materials and Methods

2.1. Index Construction

HQD is the harmonization of efficient economic growth, socially inclusive development, and ecological environment enhancement, and the comprehensive embodiment of balancing economic, social, and environmental benefits [37]. Grounded in the ideals of scientific rigor, thoroughness, and a systematic approach, this study comprehensively draws on the relevant research results of Wang and Han, Wang and Cheng, Zeng and Duan, and Sri Jigme Leng and Mao [38,39,40,41,42]. By integrating these insights with the resource advantages of coal cities, an assessment index system for the HQD of coal cities is constructed from four facets: economic development, social progress, environmental protection, and resource security, as shown in Table 1.
Economic development can reflect the strength of economic development of a country or region and is the driving force of HQD in coal cities. This study measures the level of economic development from four aspects: industrial structure, technological progress, opening up, and economic growth. Regarding the composition of industries, the level of optimization of industrial structure in coal cities is examined by using sophisticated industrial infrastructure and optimizing industrial organization. Among these, the advanced industrial structure is quantified by the ratio of the value added by the tertiary industry to the value added by the secondary sector [43]. The rationalization of industrial structure is calculated by using the added value of the primary, secondary, and tertiary industries to calculate the Tel index, which is used to reflect the degree of optimization of the industrial structure. The formula is as follows [44]:
T L = i = 1 n ( Y i Y ) ln ( Y i L i Y L )
where Y i is the value added by industry i ; Y is the aggregate value contributed by the three industries; L i is the employment figure in industry i ; and L is the aggregate number of individuals in employment in the three industries. In terms of technological progress, the intensity of R&D expenditure and physical capital investment are used to measure innovation input, and the number of patent grants per 10,000 people and the Internet penetration rate are used to characterize innovation contribution. Regarding the topic of international engagement, the level of openness to global markets and the level of reliance on foreign trade are used to reflect the degree of linkage between inside and outside coal cities. Regarding the expansion of the economy, GDP growth rate and GDP per person are used to measure economic development and its stability.
Social progress means social fairness and harmony, which are the essential requirements for the HQD of coal cities. This study quantifies the level of social progress in three aspects: institutional innovation, public services, and residents’ lives. In terms of institutional innovation, the degree of government intervention and local financial strength are used to reflect the financial capacity of coal cities. In terms of public services, including the participation rate of basic pension insurance, the strength of education investment, the quantity of practicing physicians per 10,000 individuals, the area of urban roads per capita, the number of public library collections per capita, and the enrollment rate of pupils in general secondary schools relative to the total population, this study mainly measures the conditions of education, culture, sanitation, and medical care enjoyed by the people in coal cities. In terms of residents’ lives, the urbanization rate, urban registered unemployment rate, and per capita disposable income are used to reflect the urbanization level, employment status, and income and consumption levels of residents in coal cities.
Environmental protection implies a harmonious symbiotic relationship between human beings and nature and is an essential requirement for the HQD of coal cities. Coal cities have serious environmental pollution due to the long-term overexploitation and utilization of resources. In this study, the ecological security degree of coal cities is measured by selecting two evaluation indicators: environmental pollution and environmental governance. Among them, environmental pollution is represented by industrial wastewater emission intensity, industrial smoke (dust) emission intensity, and industrial exhaust gas emission intensity, which describes the emission reduction level of “three wastes” in coal cities. Environmental governance is characterized by three evaluation indicators: forest coverage, rate of comprehensive use of solid waste, and public green space per capita, reflecting the current state of ecological security protection in coal cities.
Resource security is crucial for the growth of nations and societies, serving as the fundamental base for the HQD of coal cities. The situation of depleting coal resources, shrinking production land, and decreasing population dividends is bound to have some hindering effects on the economic growth of coal cities. In this paper, coal resource abundance and coal resource dependence are chosen to reflect the degree of coal resource exploitation and utilization in coal cities. The per capita arable land area is utilized to depict the extent of land resources available, and the natural population growth rate and population density are used to gauge the level of human resources.

2.2. Research Methodology

2.2.1. Entropy Value Method

The entropy value method is a technique for assigning weights to indicators based on the amount of information provided by each observation, which can accurately represent the usefulness of the entropy value of the indicator information [45]. Compared with the expert comment method, the hierarchical analysis method, etc., this method better preserves the inherent information of the data and has strong objectivity. Therefore, this paper measures the level of HQD in coal cities with the help of the entropy value method [31]. The precise sequence of actions is as follows:
The initial stage is the standardization of indicators. Indicator standardization eliminates the differences in the scale of different indicators and ensures the comparability of the data in the analysis. Given r years, n cities, and m indicators,   X θ i j is the numerical or monetary worth of the j indicator for the i city in the θ year.
For positive indicators:
D θ i j = X θ i j X min X max X min
For negative indicators:
D θ i j = X max X θ i j X max X min
Among them,   D θ i j represents the standardized or normalized value, X m a x and X m i n represent the uppermost and lowermost values of the j indicator, respectively.
During the second phase, the contribution of the j is computed using a specific formula:
Q θ i j = D θ i j θ = 1 r i = 1 n D θ i j
During the third phase, the entropy value of j indicator is computed using the mathematical formula:
M j = k θ = 1 r i = 1 n Q θ i j ln Q θ i j
Among them, k is the constant, k = 1 ln ( r n ) > 0 .
During the fourth stage, the coefficient of variation of the j indicator is computed using the following formula:
S j = 1 M j
The weights of the indicators are determined in the fifth phase using the following formula:
W j = S j j = 1 m S j
The composite score for each indicator is computed in the sixth step using the specified formula:
E θ i = j = 1 m W j D θ i j
Among them, E θ i is for the level of HQD of coal cities. The larger E θ i is, the higher the level of HQD in those coal cities.

2.2.2. Standard Deviation Ellipse

The standard deviation ellipse method is a traditional approach for analyzing the directional properties of spatial distribution that is able to examine an element’s geographical distribution globally [46]. The method mainly describes the spatial distribution features and evolutionary processes of elements through basic parameters such as the extent of the spatial distribution of the ellipse, the center of gravity, the standard deviation of the long and short axes, and the azimuth angle. Among them, the area of the ellipse represents the extent of the geographical distribution range of the elements, and changes in the area indicate whether the elements are concentrated or spread out. The centroid of the ellipse demonstrates the central position of its components; the migration trajectory and law of the center of gravity respond to the overall spatial displacement of the components and their developmental orientation. The standard deviation of the minor and major axes indicates the degree of dispersion of the elements in the primary and secondary directions, and the orientation of the elongated axis indicates the primary pattern of the spatial arrangement of pieces. The primary trend of the spatial distribution of components is shown by the orientation of the minor axis. The standard deviation of the major and minor axes measures the extent of dispersion of items in the primary and secondary directions; the orientation of the elongated axis indicates the major trend of the spatial distribution of elements; the alignment of the shorter axis reflects the subordinate pattern of spatial dispersion of items; the greater the disparity between the major and minor axes, the more pronounced the directional nature of the components; and the ellipse azimuth angle indicates the major trend direction of element distribution. The calculation formula is:
Center of gravity:
X ¯ w = i = 1 n ω i x i i = 1 n ω i , Y ¯ w = i = 1 n ω i y i i = 1 n ω i
X -axis standard deviation:
σ x = j = 1 n ( ω i x ¯ i cos θ ω i y ¯ i sin θ ) 2 i = 1 n ω i 2
Y -axis standard deviation:
σ y = j = 1 n ( ω i x ¯ i sin θ ω i y ¯ i cos θ ) 2 i = 1 n ω i 2
Azimuth:
tan θ = i = 1 n ω i 2 x ¯ i 2 i = 1 n ω i 2 y ¯ i 2 + i = 1 n ω i 2 x ¯ i 2 i = 1 n ω i 2 y ¯ i 2 2 + 4 i = 1 n ω i 2 x ¯ i 2 y ¯ i 2 2 i = 1 n ω i 2 x ¯ i y ¯ i
Within the mathematical equation, n indicates the number of coal cities, i = 1,2 , , n . ω i is the spatial weight corresponding to the i city, and θ is the azimuth of the standard deviation ellipse; that is, the angle produced by the center of gravity with respect to the clockwise rotation in the north direction and the long axis. σ x ,   σ y are the standard deviations of the ellipse along the X and Y axes, respectively; that is, the standard deviation of the long axis and the standard deviation of the short axis.

2.2.3. Geographic Detector

The geographic detector is a statistical technique that can be used to detect spatially divergent features and reveal their drivers, with the advantages of a smaller sample size limitation and the ability to detect both numerical and qualitative data [47]. The basic idea is that if the spatial distributions of two variables converge, they are statistically correlated [48]. The method includes four detection methods: factor detection, interaction detection, risk detection, and ecological detection. Among them, factor detection is employed to assess whether a certain factor influences the disparity in the spatial distribution of indicators [49]. The formula is shown below:
q = 1 1 N σ 2 h = 1 L N h σ h 2
S S W = h = 1 L N h σ h 2
S S T = N σ 2
Among them, h = 1 , , L is the number of sample partitions, N and N h are the aggregate quantity of samples in the study area and the number of samples on stratum h , and σ 2 measures the variance of the region’s level of HQD. σ h 2 is the variance of stratum h . SSW and SST are Within Sum of Squares and Total Sum of Squares, respectively [48]. The values of q are in the range [0, 1], and the greater the magnitude of q , the greater the degree of influence of the influencing factors on the level of HQD, and vice versa.
Since the divergent characteristics of HQD in coal cities are not only affected by a single variable but are the result of the joint action of multiple variables [21], this study also introduces the interaction detection technique to identify the interaction between the driving factors. Interaction detection can assess the interaction of different independent variables on the dependent variable. In other words, it analyzes whether the joint effect of influencing factors X 1 and X 2 on the dependent variable Y is independent of each other or whether the joint effect of the two can enhance or weaken the explanatory capacity of the dependent variable Y . In addition, it determines the type of the joint effect and the potency of the explanatory capacity of the two by calculating the new q -value formed by the two-to-two interaction [50]. The type of interaction between the two parameters is displayed in Table 2.

2.3. Data Sources

The data elements included in this work are primarily categorized into two distinct groups: basic geographic map data and socio-economic statistics. The basic geographic map data are based on 1:4 million vector maps provided by the National Center for Basic Geographic Information, and geospatial matching of the level of HQD of each coal city is carried out with the help of Arc-GIS 10.7 software. Social and economic statistics are mainly derived from the China Urban Statistical Yearbook, China Environmental Statistical Yearbook, China Coal Industry Yearbook, China Demographic Statistical Yearbook, China Population and Employment Statistical Yearbook, Statistical Yearbook of China Science and Technology Statistics of provinces and cities, and Statistical Bulletin of National Economic and Social Development of different regions. For individual missing data, the interpolation method is used to make reasonable estimations to ensure the integrity and accuracy of the research data.

3. Results and Analysis

3.1. Entropy Value Method Analysis

The general state of affairs, as depicted in Table 3, is that the overall HQD index of coal cities shows a trend of steady improvement and obvious progress, but the general magnitude of HQD is low, and the idea of HQD still needs to be integrated into top-level design and comprehensive decision-making. By region, the mean value of HQD in the east rises from 0.247 in 2011 to 0.404 in 2020; in the center, it rises from 0.219 in 2011 to 0.333 in 2020; in the west, it rises from 0.226 in 2011 to 0.324 in 2020; and in the northeast, it rises from 0.228 in 2011 to 0.312 in 2020. It is worth noting that the level of HQD varies greatly among regions, with the average value of HQD in the east being significantly greater than the levels found in other areas, and the development momentum is better and has been in the lead. The development of the central and western parts of the country is not similar, and the northeast is relatively weak and uncompetitive. The reason is that the northeast region, as a traditional old industrial base of China, had been at the forefront of economic development and urban construction with the advantage of the coal industry, but with the depletion of resources, the economy has gradually fallen behind, and the level of HQD has been lowered. Clearly, there is still a significant distance to go to reduce the disparity in regional growth and foster synchronized regional progress.
Specifically, an analysis is conducted on the HQD process in coal cities based on the guidelines outlined in the national 12th and 13th Five-Year Plans. Throughout the duration of the “12th Five-Year Plan” era (2011–2015), the mean value of HQD ranged from 0.228 to 0.268, with small fluctuations and a mean yearly growth rate of 4.11%. Throughout the “13th Five-Year” era (2016–2020), the HQD level is between 0.279 and 0.341, at a consistent yearly growth rate of 4.97%, showing rapid growth, indicating that the HQD level of coal cities has been increasing under the guidance of the new development concept. In each stage of analysis, the 40 cities are categorized into three distinct groups: the progress group, the stability group, and the backward group. The progress group refers to the cities whose ranking in the last year of HQD level has progressed compared with the ranking in the first year; the stability group refers to the cities whose ranking in the last year of HQD level has not changed from the ranking in the first year; and the lagging behind group refers to the cities whose ranking in the last year has declined compared with the ranking in the initial year.
Throughout the duration of the “12th Five-Year Plan” era, the Progress Group included 22 cities. Huaibei improved by 11 places due to its continuous promotion of coal chemical synthetic materials base during this period, the expansion of the coal chemical industry chain, and the foundation it laid for the transformation and upgrading of the city. Wuhai actively developed advantageous characteristic industries, and the HQD level improved by nine places. After the transformation of Shuangyashan City, industrial development and employment were boosted, yielding good economic benefits and improving its HQD level by eight places. Pingxiang and Datong used their own resources to develop new energy and implemented effective measures to combine new energy development with urban planning and construction, and their HQD level improved by seven places. Zaozhuang and Huainan improved by six places each, due to the their excessive dependence on the coal industry, coupled with the scattered urban spatial structure, resulting in poor agglomeration efficiency and regional competitiveness weakening, indicating room for further progress. Other cities had smaller increases, and their progress was within five places. The stability group consisted of Zibo in the eastern region, which maintained its second-place ranking, indicating that Zibo’s economic strength and comprehensive strength have been continuously enhanced, maintaining a high and stable level of improvement. The backward group included 17 cities. Fuxin dropped by 20 places, Handan dropped by 18, Jixi dropped by 15. Fushun, Guangyuan, Baishan, and Shizuishan dropped by 13, 10, 9, and 6, respectively, and the other cities dropped by two to four places. With the depletion of coal resources, resource and environmental obstacles are gradually serious in these cities, and they are faced with problems such as a single industrial structure, a heavy task of supply-side structural reform, insufficient accumulation of capital and technology, and lack of scientific and technological support, resulting in a backward level of high-quality development.
During the era of the “13th Five-Year Plan”, the progress group included 17 cities, including Xingtai, Zaozhuang, and Xuzhou. Among them, Xingtai and Hangdan have made the greatest progress, rising 21 places, respectively. Loudi progressed by 20 places, Huainan rose 11 places, followed by Chifeng and Baishan, which rose nine places. These cities have optimized their industrial structure, accelerated industrial transformation and upgrading, increased energy efficiency, developed green and new energy, formed diversified industrial chains, and effectively improved their HQD level. Tangshan and Suzhou rose eight places, respectively. During this period, Tangshan attracted foreign investment and used its own funds to transform and develop environmentally friendly emerging industries and promote the HQD of the city. Suzhou vigorously developed renewable clean energy such as wind power, thermal power, and solar photovoltaic power generation, and made achievements in energy conservation and consumption reduction, providing a solid guarantee for HQD. Liaoyuan moved up six places. Liaoyuan has actively promoted the development of emerging industries, such as high-precision aluminum, new energy vehicles, and medicine, effectively resolving the development bottleneck. Zaozhuang rose by five places. The other cities are all within five points of progress. The stable group consisted of Jining, Shuozhou, Lvliang, and Dazhou, with no changes in rankings. Jining is ranked at No. 9, with an HQD level, while Shuozhou, Dazhou, and Lvliang have the lowest level of HQD and are located at No. 38, No. 39, and No. 40, respectively. The lagging group includes 19 cities, among which Qitaihe declined by 14 places, Yangquan declined by 13 places, Hegang and Shuangyashan declined by 12 places, Fuxin declined by 11 places, and Guangyuan and Liupanshui declined by 10 places, Datong and Wuhai declined by nine places, Fushun, Jiaozuo, and Ordos declined by seven places, and the rest of the cities declined by less than four places. Therefore, these cities need to optimize their industrial structure, strengthen the transformation of kinetic energy, and vigorously develop successor industries or alternative industries to avoid the phenomenon of the “resource curse”. Overall, the level of HQD in the 40 coal cities has improved to varying degrees, but the lagging group has risen slower than the progressing group and therefore ranks relatively low.
Further comparison of the average value of HQD and its ranking of the 40 coal cities from 2011 to 2020 reveals distinct regional differences. Among the eight cities in the east, there are six cities ranked in the top 20, including Xuzhou, Longyan, Jining, Zibo, Zaozhuang, and Tangshan, of which Zibo and Xuzhou are ranked 2nd and 4th, and Handan and Xingtai, although ranked 25th and 26th in the mean value, have made great progress throughout the duration of the “13th Five-Year Plan”, with a clear trend of catching up. The trend toward catching up is obvious. The cities in the eastern area have a rather high level of development, signifying that under the leadership of the new development concept, the eastern region has a good momentum of HQD and the quality of development is constantly improving. Within the central area, there are a total of 15 cities. Six cities are ranked in the top 20 in terms of mean value, among which Xinyu has the highest level of HQD and is ranked No.1; Pingxiang, Hebi, and Huaibei are ranked 7th, 10th, and 11th, respectively, and Jiaozuo and Datong are ranked the 14th and the 20th, respectively. However, Jincheng, Changzhi, Pingdingshan, Shuozhou, and Lvliang have a lower level of HQD, all of which are after 30th place, and the remaining four cities are ranked between 20th and 30th place, indicating that there is a significant difference between coal cities in the center area. The general degree of development in the west and center is not similar. Among the nine cities in the west, Erdos, Shizuishan, and Wuhai are ranked in the top, 3rd, 6th, and 12th, respectively; Guangyuan, Tongchuan, Yulin, and Liupanshui are in the middle, 17th, 21st, 24th, and 29th, respectively; and Chifeng and Dazhou are ranked in the 37th and 39th place, respectively. The overall progress of HQD in the western area is sluggish, the number of cities at the top of the list is small, and the gap with other regions is large, with a lot of room for upward mobility. Among the eight cities in the northeast, Fushun, Shuangyashan, Fuxin, and Baishan ranked 13th, 15th, 16th, and 18th, respectively, all in the top 20, while Hegang, Qitaihe, and Liaoyuan ranked after 30th. These cities may be affected by the eradication of outdated production capacity and faced with problems of industrial restructuring and upgrading. Their development speed has slowed down, and the level of HQD, although rising, has increased at a relatively small rate, leading to a continuous decline in their rankings despite the rise in HQD. The development tendency of HQD in the four major regions show clear differences, with the utmost level of advancement in the eastern region, followed by the center and the west, and relatively low in the northeast.

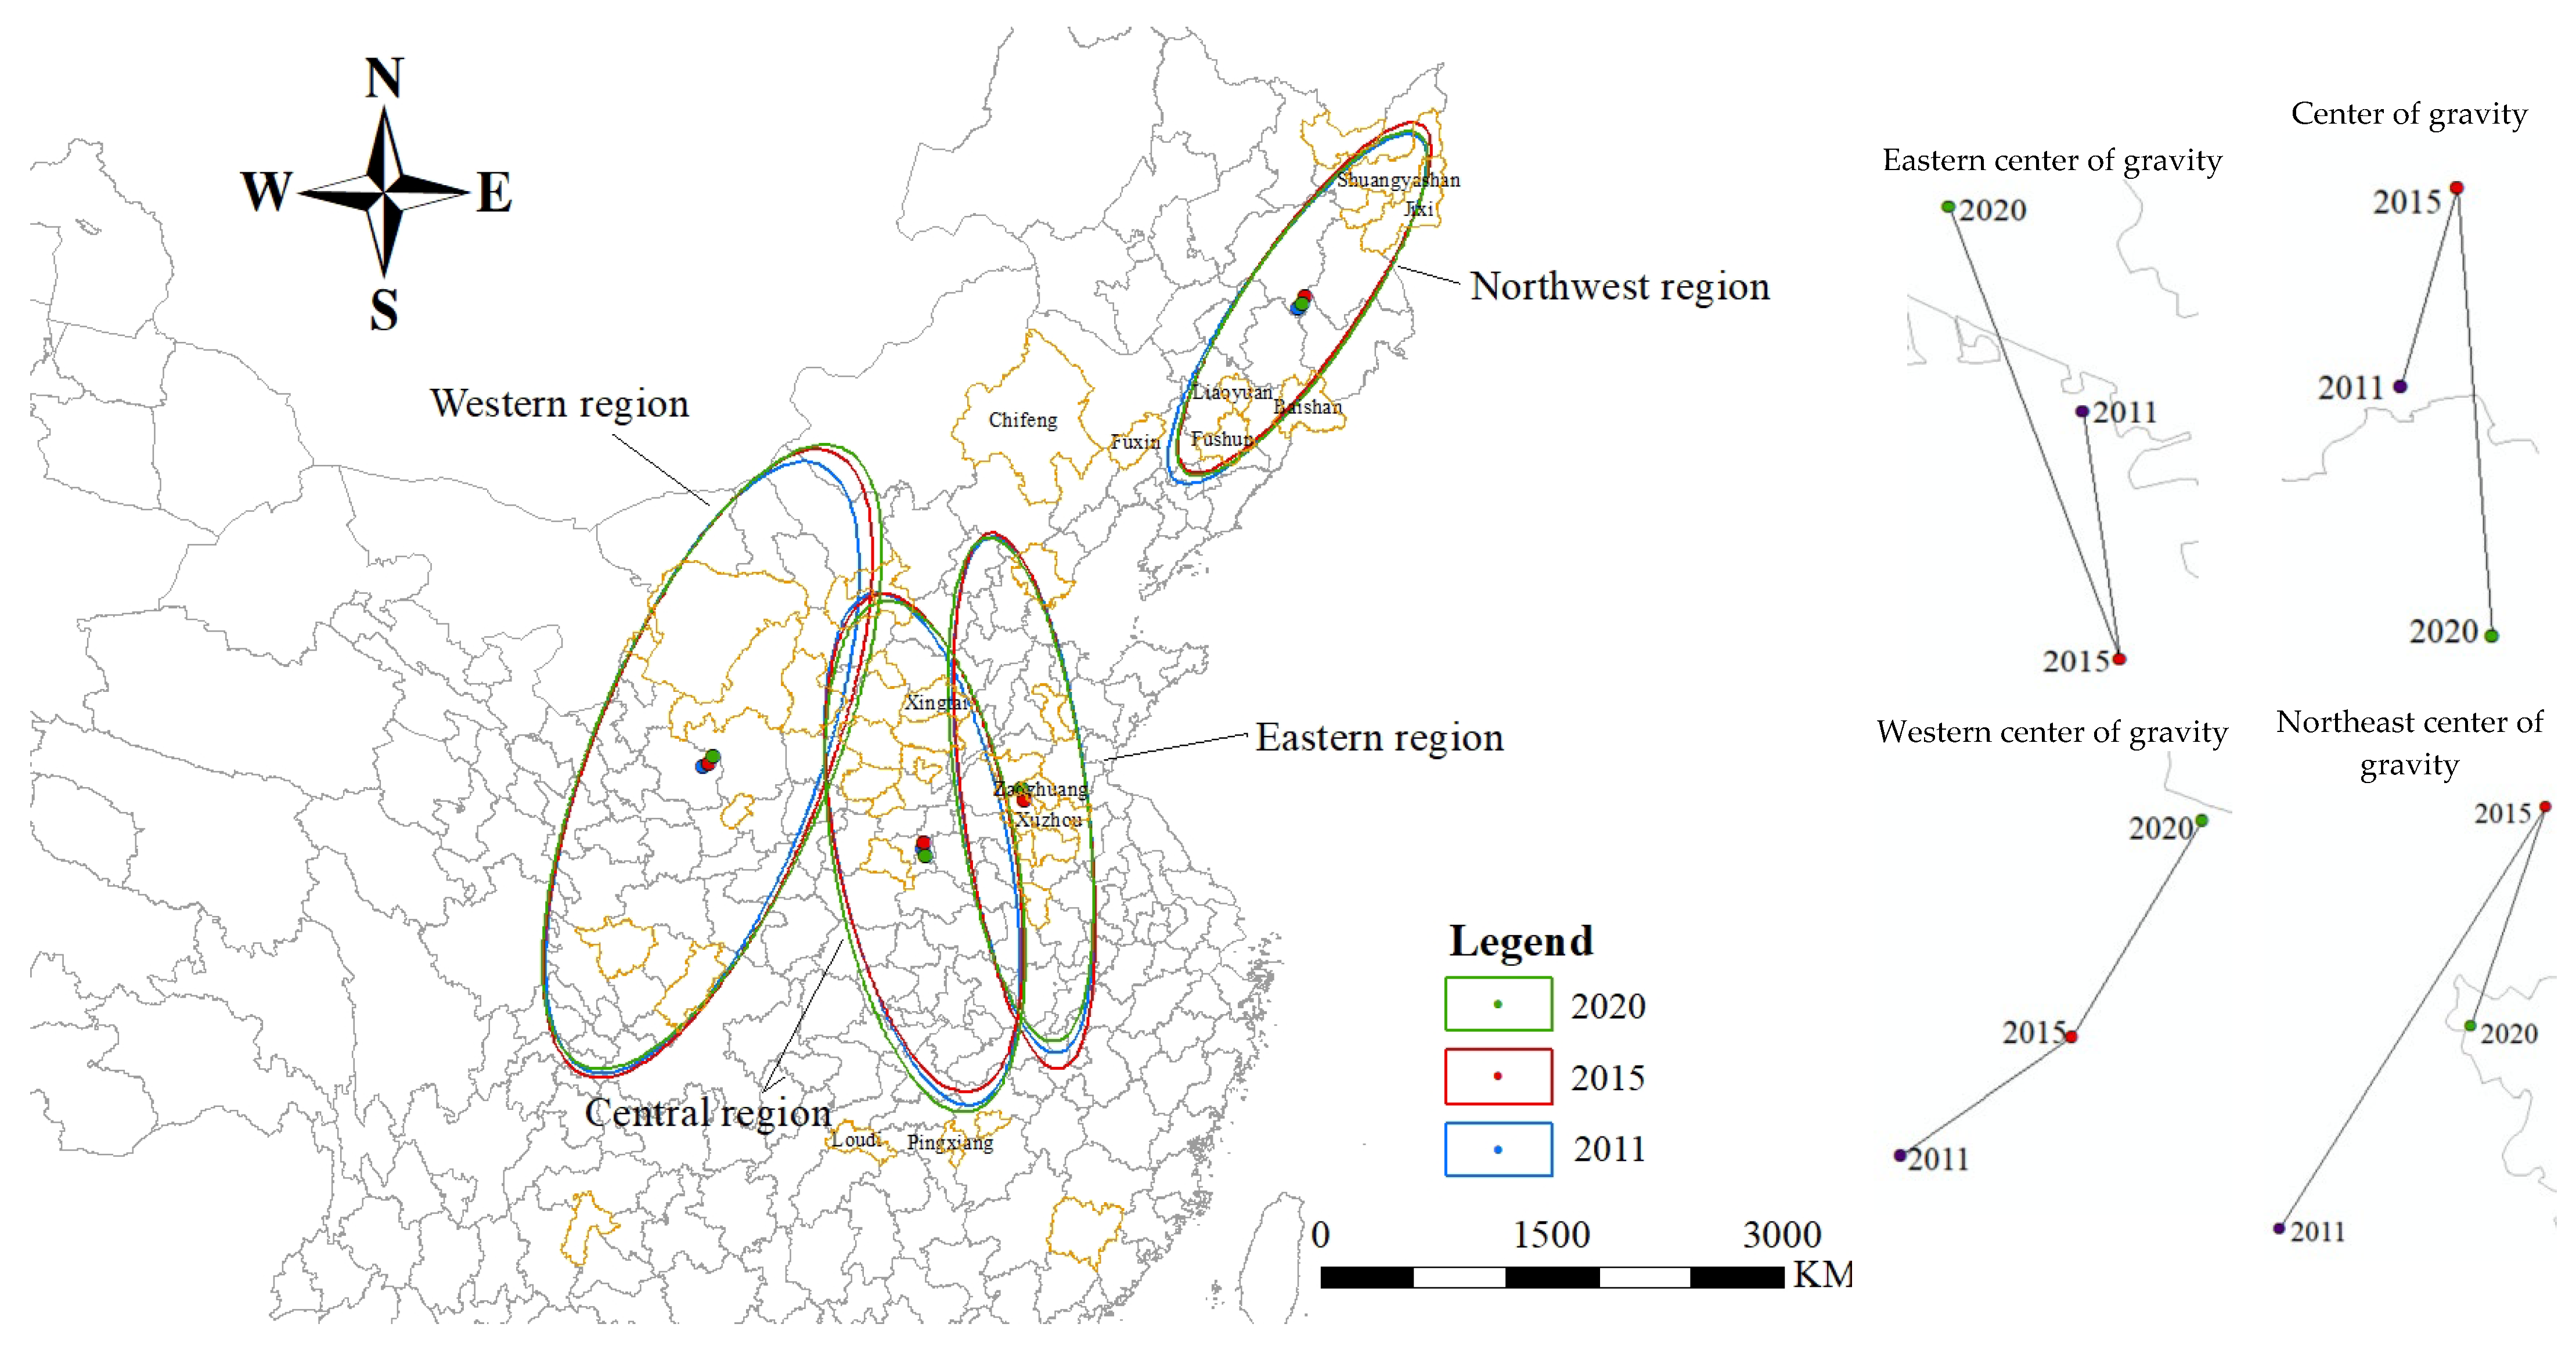
3.2. Standard Deviation Elliptic Analysis

With the help of ArcGIS 10.7 software, representative years were selected, and the standard deviation ellipse was used to quantitatively characterize the center of gravity, spread, direction, and overall spatial pattern of the spatial distribution of HQD in 40 coal cities from a global and spatial perspective.
As can be seen from Figure 1 and Table 4, from the shape of the ellipse distribution, its long axis is always larger than the short axis, and the difference is large, which confirms that the spatial distribution of the level of HQD of coal cities has obvious directionality. The geographic distribution pattern in the “Northeast–Southwest” direction is displayed, which aligns with the trajectory of China’s socioeconomic progress. Considering the viewpoint of the minor and major axes of the ellipse, the long axis’s standard deviation increased from 1067.458 km in 2011 to 1070.144 km in 2015 and then decreased to 1046.977 km in 2020, which means that the HQD level in this period shows a tendency to cluster in the main direction. The standard deviation of the short-axis measurements has been slowly decreasing from 527.802 km in 2011 to 522.472 km in 2020, indicating that the centripetal force of the distribution of the HQD level in coal cities has increased, and the clustering feature has been revealed. The expansion and contraction of the long axis (20.481 km) are larger than those of the short axis (5.330 km), indicating that the main pulling force of the HQD level of coal cities is in the north–south direction. Considering the azimuth of the ellipse, the azimuth is narrowed from 33.773° in 2011 to 32.588° in 2020, which means that the spatial pattern of the HQD level is shifted to the direction of “due south–due north” due to the rapid improvement of the HQD level of the southeast of the ellipse in Loudi and Pingxiang, so that the ellipse has a weak “due north” direction. There is a weak “due south–due north” moving trend. From the trajectory of the center of gravity of the ellipse distribution, within the timeframe of the “12th Five-Year Plan”, the center of gravity of the spatial distribution of HQD level shifted southwestward from the border of Xingtai, Hebei Province, in 2011, moved northeastward, then migrated southwestward again, and landed in Xingtai City in 2014. This indicates that the level of HQD of the southern coal cities is overall higher than that of the north in the north–south direction. Because the cities of Cebu, Huainan, and Huaibei, located in the southern part of the center of gravity, are developing rapidly in this period, the development’s center of gravity is shifted towards the southern region. Throughout the 13th Five-Year Plan era, the center of gravity moved in the direction of southwest, then northeast, and then southwest again, showing a trend toward the south. This signals a decline in the level of superior development in the northeast and a shift in the central focus toward the south. The reason for this is that the northeast region is currently undergoing a transition from traditional to modern forms of renewable energy, specifically focusing on green and yellow energy sources. The economic structure is still based on a single, traditional industry with overcapacity, and emerging industries are insufficient to drive development, leading to a lower level of development and lack of new economic growth points. From the coverage of the ellipse, the location of the ellipse is more and more to the east, and the area first increased from 1,769,825.182 km2 in 2011 to 1,771,050.920 km2 in 2015, and then decreased to 1,718,341.169 km2 in 2020, showing a general trend of contraction, indicating that the level of HQD of the coal cities has become more clustered in the spatial spread of the scope. This reflects the degree of advanced development in coal cities, which has become more concentrated in their spatial spread.
To further explore the direction of spatial distribution and dynamic characteristics of the level of HQD of coal cities, the spatial evolution process in the east, central, west, and northeast was analyzed locally, as shown in Figure 2 and Table 4.
From the elliptical distribution pattern, the HQD level of coal cities in the eastern region shows a “northwest–southeast” spatial distribution pattern. Regarding the major and minor axes, the long axis gradually lengthens, increasing from 632.368 km in 2011 to 656.376 km in 2015, which shows a trend of dispersion of the HQD level in the main direction during this period, and then decreasing to 617.587 km in 2020, which means that the level of HQD shows a trend of contraction in the main direction in this period. The short axis decreases from 154.279 km in 2011 to 152.410 km in 2015 and then increases to 158.453 km in 2020, showing a tendency of contraction and then dispersion, which is due to the rapid increase in the HQD level of Zaozhuang and Xingtai, which pulls the HQD in the direction of “east–west” and expands the short axis. This is due to the rapid increase in the level of HQD in Zaozhuang and Xingtai, which pulls the HQD in the “east–west” direction and expands the short axis. In terms of the azimuth angle, it shrinks slightly from 172.620° in 2011 to 172.214° in 2020, showing a small counterclockwise rotation of the ellipse, which indicates that the spatial distribution pattern of HQD level has a weak tendency to shift to the “east–west” direction. In terms of the area of the ellipse, it gradually increases from 306,394.641 km2 in 2011 to 314,164.054 km2 in 2015, and then narrows down to 307,338.350 km2 in 2020. Although the distribution range fluctuates, the overall trend of expansion means that the scope of HQD levels in the eastern region has been expanded. In terms of the spatial center of gravity, it moves 15.174 km to the southeast from 2011 to 2015 and 29.532 km to the northwest from 2015 to 2020, with the point of equilibrium moving from within Xuzhou City to within Jining City, showing an overall trend of moving to the northwest due to the rapid development of Xingtai City, which is located in the eastern region.
From the elliptical distribution pattern, the level of HQD of coal cities in the central area shows a spatial distribution pattern oriented in the northwest–southeast direction. Regarding the major and minor axes, the long axis shrinks from 633.222 km in 2011 to 615.067 km in 2015, and then grows to 628.433 km in 2020, and the short axis progressively expands from 208.5 km. The short axis gradually expands from 208.544 km in 2011 to 223.771 km in 2020. 44 km in 2011 to 223.771 km in 2020, and the expansion and contraction amplitude of the short axis (15.227 km) is greater than that of the long axis (4.790 km), indicating that the main force driving the level of HQD comes from the east–west direction rather than the north–south direction. From the perspective of the azimuth angle, the ellipse azimuth angle rises slowly from 168.640° in 2011 to 170.197° in 2020, indicating that there is a weak movement of the spatial distribution pattern to the “north–south”, which means that the HQD level of Pingxiang and Loudi, located in the south direction, is gradually rising and marginally more than that of the northeastern region. From the perspective of the ellipse area, the ellipse area is gradually expanding from 414,782.677 km2 in 2011 to 441,713.095 km2 in 2020, indicating that the scope of the HQD level is gradually spreading. In terms of the spatial center of gravity, the center of gravity moves 15.744 km to the northeast from 2011 to 2015 and 33.228 km to the southeast from 2015 to 2020, with an overall shift to the southeast, signifying that the situation of HQD is better in the coal cities located in the southeastern part of the central area.
From the elliptical distribution pattern, the HQD level of coal cities in the western region shows a “northeast–southwest” spatial distribution pattern. In terms of the short and long axes, the short axis of the west region gradually increases from 277.323 km in 2011 to 291.078 km in 2020. The short axis expands, while the long axis increases from 789.422 km in 2011 to 815.631 km in 2015, and then decreases to 814.286 km in 2020. The magnitude of the elongation and compression of the major axis (24.864 km) is larger than the expansion and contraction amplitude of the short axis (13.755 km), signifying that the level of HQD of coal cities in the western region shows a spatial distribution pattern of “Northeast–Southwest”. In terms of azimuth, the azimuth of the ellipse increased from 21.053° in 2011 to 22.920° in 2020, indicating that the spatial distribution shows a shift towards “due east–due west”, which means that the level of HQD located in the due east direction is slightly higher than that in the southwest. Regarding the area of an ellipse, it progressively rises from 687,656.150 km2 in 2011 to 744,499.714 km2 in 2020, indicating that the ellipse coverage expands outward, and the level of HQD of coal cities in geospatial space shows a tendency of expansion and decentralization, and the spatial spillover effect is highlighted. The center of gravity moved 20.973 km to the northeast from 2011 to 2015 and moved 21.309 km to the northeast from 2015 to 2020, mainly due to the HQD of Chifeng pulling the center of gravity of the development of the western region.
Judging from the elliptical distribution pattern, the HQD level of coal cities in the northeastern area shows a “northeast–southwest” spatial distribution pattern. In terms of the long and short axes, the long axis gradually shrinks from 512.020 km in 2011 to 500.730 km in 2020, indicating that Shuangyashan, Jixi, Fushun, and Fuxin, which are located near the long axis, have slower development speeds, and their HQD level shows a contraction trend in the main direction. The degree of shrinkage of the long axis (11.290 km) is greater than the degree of expansion of the short axis (0.795 km). This suggests that there is a decline in the overall HQD level of the northeast region. In terms of azimuth, the rotation angle fluctuates and shrinks from 35.387° in 2011 to 34.753° in 2020, and the relatively small degree change implies that the level of HQD is relatively stable in space. From the ellipse area, the standard deviation ellipse area first decreased from 221,291.840 km2 in 2011 to 216,473.111 km2 in 2015, and then increased to 217,665.654 km2 in 2020, showing an overall contraction trend, indicating that the spatial directionality of the HQD level of the northeast region tends to strengthen. Regarding the spatial center of gravity, from 2011 to 2015, the center of gravity moved 42.202 km to the northeast, and then 18.442 km to the southwest from 2015 to 2020, and overall, the center of gravity shifted to the northeast. This is mainly due to the movement of the center of gravity pulled by the HQD of Shuangyashan and Hegang in the Northeast from 2011 to 2015 and the migration of the center of gravity pulled by the HQD of Liaoyuan and Baishan in the Northeast from 2015 to 2020.

3.3. Geo-Detector Analysis

There are several differences in the explanatory power of different driving factors, leading to noticeable variations in the level of HQD in different coal cities. This study analyzed the effect of 33 evaluation indicators on HQD levels. Before factor detection, the driving factors are discretized and categorized with the help of quintiles of natural breakpoints in the ArcGIS 10.7 software. Subsequently, detectors are used to detect the impact of every individual aspect and its interaction on the level of HQD in coal cities. To improve the results of the “12th Five-Year Plan” and the “13th Five-Year Plan”, four sets of data, namely 2011, 2015, 2016, and 2020, were selected for detailed comparative examination.

3.3.1. Analysis of Single-Factor Detection Results

Table 5 gives the q-value of each driver in the study period of 2011–2020. From the q mean value, the factors that have a greater degree of influence on the level of HQD in coal cities are, in order: the number of patents granted per 10,000 people (X5) > foreign trade dependence (X8) > GDP per capita (X10) > disposable income per capita (X22) > intensity of investment in R&D (X3) > rationalization of the industrial structure (X2) > per capita area of urban roads (X17) > per capita area of public green space (X28) > public library collection per capita (X18) > urbanization rate (X20) > investment intensity in education (X14) > internet penetration rate (X6) > basic pension insurance participation rate (X13) > coal resource dependence (X30) > government intervention degree (X11). It can be seen that technological progress, openness to the outside world, social livelihood, and coal resources in coal cities are the main aspects that affect the level of HQD.
Regarding economic development, the number of patents authorized per 10,000 people (X5) and foreign trade dependence (X8) are important drivers affecting the HQD of coal cities. The q-values of both show a slow upward trend, from 0.309 and 0.381 in 2011 to 0.693 and 0.516 in 2020, respectively. The number of patents authorized per 10,000 people (X5) has the highest q-mean value in the last 10 years, which indicates that technological progress has the strongest explanatory power for the HQD of coal cities, followed by the level of openness. Because technological progress is conducive to the allocation of innovative resource elements, promotes the diffusion of professional technology, optimizes industrial structures, improves the ecological environment, and has a good economic impact. Moreover, the large scope, wide field, and level of opening to the outside world help introduce advanced management experience, knowledge, and technology, expanding new economic growth models for coal cities. GDP per capita (X10) is an effective factor to measure the economic status of coal cities, and its q-value increases and then decreases, but always maintaining a significant influence. The intensity of R&D investment (X3) first decreases and then slowly increases, indicating that technological innovation further becomes an innovative catalyst for economic expansion. The rationalization of industrial structure (X2) first increases and then decreases, showing a fluctuating growth trend, indicating that coal cities are cultivating new industrial growth poles and forming an innovative paradigm of industrial progress. This promotes the HQD of coal cities and increases their explanatory capacity.
On the social progress front, per capita disposable income (X22), a direct factor reflecting residents’ quality of life, has shown an “N”-shaped trend of growth, signifying that the influence of income on HQD has increased. The q-value of the urbanization rate (X20) fluctuates from 0.138 to 0.223, as a reasonable urbanization rate can help guide the efficient distribution and flow of factors and improve the convenience and happiness of residents’ lives. The strength of education investment (X14) and urban road area per capita (X17) show a pattern of ascending and subsequently descending, but they always maintain significant influence. Because talent cultivation is a long-term process of action affected by the policy system, its effect on improving the level of HQD in coal cities is slow, but there is still a certain knowledge spillover effect. Convenient city transportation can save enterprises money on transportation costs and strengthen the connection and cooperation between coal cities and other cities. The rate of participation in basic pension insurance (X13) and the number of public library collections per capita (X18) show an overall decreasing trend, from 0.366 and 0.314 to 0.062 and 0.217, respectively, but their overall mean values are ranked at 13th and 9th places, indicating that they are the key factors for the HQD of coal cities, but their influences are gradually decreasing. The degree of government intervention (X11) shows a growing trend from 0.105 to 0.360, indicating that the policy support of the local government has a beneficial influence on the HQD of coal cities. Due to coal cities being typical resource-oriented cities, they need the government’s significant attention and strong support.
Regarding the preservation of the environment, the q-value of public green space per capita (X28) increased from 0.284 to 0.365, which shows that increasing environmental regulation has a synergistic effect on the economic operation of coal cities and promotes HQD. During the 13th Five-Year Plan period, the q-value decreased from 0.366 to 0.129, with an overall decreasing trend, but its average value ranked 8th, indicating that the driving force of the ecological environment to improve the HQD of coal cities has weakened, but the HQD of coal cities cannot be achieved without a livable urban environment, and the ecological well-being of the residents can only be enhanced by strengthening environmental management.
In terms of resource security, the q-value of coal resource dependence (X30) increases and then decreases, with an average value of 0.212 ranking in the middle, signifying that the proportion of the coal industry declines over time and its influence weakens. The HQD of coal cities needs to continue to improve the degree of technological innovation based on making full use of the leading industries, constantly improving the industrial structure, and taking the ecological and diversified route of sustainable development is the way to go.

3.3.2. Analysis of Interaction Detection Results

The HQD of coal cities results from the joint action of many factors, and this study further utilizes the interaction detector to detect the interactions among the determining factors.
The outcomes of the interaction detection of the factors affecting the HQD of coal cities in 2020 are shown in Figure 3. Among the interaction terms, 53.03% produce two-factor enhancement, meaning the intensity of the joint effect is greater than the maximum value of the two-factor; 39.96% show nonlinear enhancement, where the intensity of the joint effect is greater than the sum of the intensity of the two-factor alone; 6.63% show one-factor nonlinear weakening, i.e., the intensity of the joint effect is greater than the minimum value of the two-factor but smaller than the maximum value of the two-factor; and 0.38% show nonlinear attenuation, where the strength of the joint action is smaller than the minimum value of the two-factor.
Specifically, X4, X6, X7, X11, X26, X31, and X32 interacted with each of the other factors more than a single factor independently, producing either two-factor enhancement or nonlinear enhancement, both of which are enhancement-type effects. Among these, about 71.88% of the interaction between X11 and other factors indicated two-factor enhancement, 65.63% of the interaction terms between X7, X26, X31, and other factors indicated two-factor enhancement, and 50% of the interaction terms between X4 and X32 and other factors showed two-factor enhancement effects. It can be seen that X11 is the optimal interaction factor for the level of HQD of coal cities, indicating that moderate government intervention in the operation of the market economy can effectively combine the functions of the government and the market, promote the attainment of the most efficient distribution of resources, and enhance resource utilization efficiency. Next, in the nonlinear augmentation effects, the interaction strength of X2 with X27, X3 with X21, X3 with X27, X8 with X19, X23 with X17, X26 with X11, and X29 with X22 is 0.9, indicating that the factor interaction explanatory power of the factors in the seven sets of interaction terms is all higher, and they have an important driving role. In particular, X7 alone has an intensity of about 0.2, and X27 alone has an intensity of about 0.3, but the interaction between the two is the most significant, with an intensity of 1, demonstrating the effect of “1 + 1 > 2”, which reflects that the economy and the environment are excellent interaction objects. Finally, in the weakening effect, although the intensity of X5 and X10 is greater when they act alone, 21.88% of the interaction between X5 and other factors shows one-way nonlinear weakening. In addition, there are six groups in the interaction of X10 with other factors that produce a single-factor nonlinear attenuation effect, among which the weakest effect of the interaction of X10 and X12 and X10 and X28 is 0.2. While the strength of the interaction of X9 and X14, X13 and X30 is 0.1, which exhibits nonlinear attenuation, it can be further illustrated that the HQD of coal cities is a systematic project that cannot be driven by a single factor alone but requires the orderly linkage and cooperation of multiple factors, and the relevant government departments should fully consider the effects of different influencing factors, formulate a differentiated development strategy, and improve the level of HQD of coal cities.

4. Conclusions and Discussion

4.1. Conclusions

This study constructed an HQD indicator system for coal cities from four facets: economic development, social progress, environmental protection, and resource security, and drew the following conclusions by analyzing the characteristics of its spatiotemporal pattern evolution and identifying its driving factors:
The two-stage ranking showed that within the timeframe of the 12th Five-Year Plan, the mean yearly rate of increase of the level of HQD in coal cities was 4.11%. Throughout the 13th Five-Year Plan era, the mean yearly rate of increase was 4.97%. The overall ranking of eastern cities was relatively advanced, indicating that the development of HQD in the east was in good shape under the leadership of the emerging paradigm of development. The spatial difference between coal cities in central China was significant, and cities such as Xinyu and Pingxiang had become important hubs for pulling the HQD of coal cities in central China. The overall HQD in the west was slower, with fewer top-ranking cities, and there was ample opportunity for further enhancement. The northeast may have been affected by the removal of outdated production capacity and facing industrial transformation upgrading and other issues; the pace of development had slowed down, and the level of HQD had risen, but the increase was relatively small, resulting in a continuous decline in its ranking.
From the standard deviation ellipse analysis, the pattern of distribution in space and time of coal cities showed an overall “northeast–southwest” direction, with a weak trend of “south–north” movement. The geographic center of the distribution showed a trend of relocating to the south, signifying that the level of HQD of the southern coal cities was higher than that of the northern coal cities in the north–south direction. The major and minor axes of coal cities were slowly shrinking, signifying that the centripetal force of the distribution of the HQD level of coal cities was increasing and the clustering characteristics were showing. The ellipse area showed an overall trend of contraction, indicating that the HQD level of coal cities was more aggregated in the spatial distribution range. Among them, the HQD level in the eastern region of the nation was distributed in a “northwest–southeast” direction, with the point of equilibrium shifting to the northwest. The ellipse showed a tendency of shifting to the “east–west” direction, with the major and minor axes showing a north–south contraction and an east–west expansion, reflecting the increase of the HQD level of coal cities in the east–west direction. The level of HQD in coal cities had increased. The ellipse area as a whole showed an expanding trend, meaning that the scope of HQD level in the east had expanded. The HQD level in the central part of the country showed a “northwest–southeast” distribution, with the point of equilibrium moving to the southeast as a whole. The major and minor axes showed a trend of expansion in the east–west direction and contraction in the vertical direction, indicating that the main force driving the HQD level came from the east–west direction instead, rather than the north–south direction, and the ellipse area was also gradually expanding. The level of HQD in the west showed a “northeast–southwest” distribution pattern, with the center of gravity moving to the northeast, and the ellipse shifting in the east–west direction. The expansion and contraction of the long axis was larger than that of the short axis, indicating that the level of HQD in the west was developing faster in the north–south direction than in the east–west direction. The long axis was larger than the short axis, indicating that the development speed of HQD in the north–south direction was larger than that in the east–west direction. The ellipse area was characterized by diffusion, and the spatial spillover effect was obvious. The level of HQD in the northeast showed a “northeast–southwest” distribution, with the center of gravity shifting to the northeast as a whole, and the expansion amplitude of the long axis was larger than the expansion amplitude of the short axis, indicating that the level of HQD in the northeast showed a trend of north–south aggregation and convergence, and the ellipse area showed an overall contraction trend, indicating that the spatial directionality of the level of HQD in the northeast had a tendency to be strengthened. The overall contraction trend of the ellipse area specifies that the spatial directionality of the level of HQD in the northeast had a trend of strengthening.
According to the results of geo-detectors, the spatial differentiation characteristics of HQD in coal cities result from a combination of factors. The number of patents granted per 10,000 people, foreign trade dependence, GDP per capita, disposable income per capita, R&D investment intensity, industrial structure rationalization, urban road area per capita, and coal resource dependence were the key driving factors of HQD in coal cities. After the interaction of any factor, 53.03% of the interaction terms produced two-factor enhancement, 39.96% showed nonlinear enhancement, 6.63% showed one-factor nonlinear weakening, and 0.38% showed nonlinear weakening. The degree of government intervention was the optimal interaction factor for the level of HQD in coal cities, and the degree of openness to the outside world and forest cover were excellent interaction objects.

4.2. Discussion

According to the findings of this study, the following policy suggestions are proposed on how to promote the HQD of coal cities:
Identify the city’s development orientation and formulate reasonable policies. During the course of realizing HQD in coal cities, the state should deeply implement relevant policies, establish effective policies such as resource development compensation mechanisms, ecological compensation mechanisms, and declining industry assistance mechanisms, provide sufficient policy and financial support, and formulate all-around HQD-level enhancement policies [29]. For coal cities with different levels of high-quality development, it is necessary to select and formulate strategies suitable for their own development according to local conditions. For coal cities with better development, it is necessary to strengthen the efficient use of resources, transfer more power of resource allocation to the market, and promote urban economic operation and green technology innovation through improving the market environment to further achieve high-quality development. For coal cities with lagging development, to reduce their dependence on resources, the government should introduce relevant preferential policies, actively serve industrial adjustment, support the development of strategic new industries, and pay attention to the comprehensive development of urban industries.
Breaking down regional boundaries and narrowing regional disparities. General Secretary Xi Jinping pointed out that “we should actively promote the innovation of institutions and mechanisms for regional development, optimize the layout of urban agglomerations, and optimize regional development”. It can be seen that implementing a localized or region-specific coordinated development strategy has become a crucial approach for solving the issue of imbalanced and inadequate development. First, from the national strategic level, it is necessary to develop strategies for regional cooperation and interaction in order to facilitate the exchange of elements in both directions, improve total factor productivity, and synergistically enhance the level of HQD in different regions [12]. Secondly, we should maximize the influential role of the eastern region to realize “high with low” through docking and advocating for policies to form an integrated development pattern of the eastern part of the country to drive the central part of the country and the central part to drive the western part of the country. Finally, we should continue to implement the strategies of western development, northeastern revitalization, and the rise of central China, increase the support for coal cities in the western and northeastern regions, promote the orderly transfer of industries, enhance the effectiveness of allocating resources, and realize synergistic development between regions and cities [29].
Create a power source for HQD and enhance the comprehensive strength of coal cities. By strengthening ecological construction and environmental protection, the foundation of HQD of the city is strengthened; by consolidating resource security, the characteristics of HQD of the city are highlighted; by cultivating new growth poles of industry, the power of HQD of the city is strengthened; and by opening up both internally and externally, the vitality of HQD of the city is enhanced [1]. Emphasis should be placed on improving investment in technological innovation, optimizing industrial structures, encouraging the industrial development of circular and ecological economies, realizing the green development of industry through technological innovation, and reducing the impact on the environment. The government should introduce relevant financial policies, strengthen macro-control according to local conditions to guide the settlement of emerging industries, and attract innovative talents through independent entrepreneurship to promote urban development [51]. Simultaneously, it should also increase investment in infrastructure construction, improve the standard of factors, enhance the coal cities’ ability to capitalize on technology and talent elements, attract foreign investment, and create a good soft environment for the HQD of coal cities [28].

Author Contributions

Conceptualization, L.S.; methodology, L.S.; software, X.H.; validation, X.H.; formal analysis, L.S.; investigation, L.Y.; resources, X.H.; data curation, X.H.; writing—original draft preparation, L.S.; writing—review and editing, L.S.; visualization, L.Y.; supervision, L.Y.; project administration, L.S.; funding acquisition, L.S. and L.Y. All authors have read and agreed to the published version of the manuscript.

Funding

This research was funded by the Scientific Research Foundation for High-level Talents of Anhui University of Science and Technology (2024yjrc29), the National Natural Science Foundation of China (71704002), and the Anhui Province Philosophy and Social Science Planning project (AHSKY2022D125).

Institutional Review Board Statement

Not applicable.

Informed Consent Statement

Not applicable.

Data Availability Statement

The data used to support the findings of this study are available from the corresponding author upon request.

Conflicts of Interest

The authors declare no conflicts of interest.

References

  1. Zhang, G.X.; Zhang, J.Y. Spatio-temporal evolution of high-quality development of resource-based cities in the Yellow River Basin. China Popul. Resour. Environ. 2023, 33, 124–133. [Google Scholar]
  2. Chen, Z.X.; Qing, M. Research on the measurement of the high-quality development level of China’s urban agglomerations and its temporal and spatial convergence. J. Quant. Tech. Econ. 2022, 39, 42–60. [Google Scholar]
  3. Liu, D.; Zhang, Q. Dynamic mechanism and realization path of resource-based cities’ high-quality progress. Acad. Exch. 2022, 5, 96–107. [Google Scholar]
  4. Jin, B. Study on the “high-quality development” economics. China Ind. Econ. 2018, 4, 5–18. [Google Scholar]
  5. Ren, B.P.; Wen, F.A. The criteria, determinants and ways to achieve high quality development in China in the new era. Reform 2018, 4, 5–16. [Google Scholar]
  6. Zhang, J.K.; Hou, Y.Z.; Liu, P.L.; He, J.W.; Zhuo, X. The goals and strategy path of high-quality development. Manag. World 2019, 35, 1–7. [Google Scholar]
  7. Gao, Y.; Cheng, L.; Ren, Y.; Hu, Y.; Chen, L.; Tian, J. High-quality development in industrial parks: New narrative and pathway to sustainable development from a policy perspective in China. Resour. Conserv. Recycl. 2025, 215, 108111. [Google Scholar] [CrossRef]
  8. Yu, H.L.; Liu, Y.P. High-quality development in ethnic areas from perspective of total factor productivity. J. South-Cent. Minzu Univ. (Humanit. Soc. Sci.) 2022, 42, 121–131. [Google Scholar]
  9. He, X.Y.; Shen, K.R. Modernized economic system, total factor productivity and high quality development. Shanghai J. Econ. 2018, 6, 25–34. [Google Scholar]
  10. Hui, S.P.; Wang, X.H.; Shan, J.R. Research on the driving path and driving effect of China’s industrial high-quality development. Shanghai J. Econ. 2021, 10, 53–61. [Google Scholar]
  11. Wei, M.; Li, S.H. Study on the measurement of economic high-quality development level in China in the new era. J. Quant. Tech. Econ. 2018, 35, 3–20. [Google Scholar]
  12. Yang, Y.F.; Wang, Q. Research on construction of evaluation index system for high-quality development of regional economy in China in the new era. China Soft Sci. 2024, S1, 182–190. [Google Scholar]
  13. Li, Y.; Li, L.; Liu, J.X. Measurement of China’s inter-provincial level of high-quality development. Stat. Decis. 2022, 38, 93–97. [Google Scholar]
  14. Wang, L.J.; Chen, M.D. Measurement on high-quality economic development level in China. Stat. Decis. 2023, 39, 87–91. [Google Scholar]
  15. Sun, X.; Fang, S.; Zhang, S. High-quality economic development in huaihe economic zone level measurement and evaluation. J. Math. 2021, 2021, 6615884. [Google Scholar] [CrossRef]
  16. Yang, Y.W.; Zhang, P. Logic, measurement and governance in China’s high-quality economic development. Econ. Res. J. 2021, 56, 26–42. [Google Scholar]
  17. Wang, S.W.; Chen, X.K. Measurement, spatial distribution and dynamic evolution of the high-quality development level of China’s regional economy. Stat. Decis. 2023, 39, 90–96. [Google Scholar]
  18. Gao, S.; Sun, H.; Wang, R. Audit evaluation and driving force analysis of marine economic development quality. Sustainability 2022, 14, 6822. [Google Scholar] [CrossRef]
  19. Qu, X.E.; Ma, H.L.; Wang, X.F. Comprehensive evaluation of the level of high-quality development of provincial economies. Stat. Decis. 2022, 38, 98–103. [Google Scholar]
  20. Heng, C.; Yan, Z. Regional logistics industry high-quality development level measurement, dynamic evolution, and its impact path on industrial structure optimization: Finding from China. Sustainability 2022, 14, 14038. [Google Scholar] [CrossRef]
  21. Cui, D.; Bu, X.Y.; Xu, Z.; Li, G.P.; Wu, D.T. Comprehensive evaluation and impact mechanism of high-quality development of China’s resource-based cities. Acta Geogr. Sin. 2021, 76, 2489–2503. [Google Scholar]
  22. Cao, J.B.; Kang, C.Y. The threshold effect of digital economy to promote the high-quality development of resource-based cities in China. Resour. Sci. 2023, 45, 2234–2247. [Google Scholar] [CrossRef]
  23. Zhang, Y.; Chen, T.F.; Chen, H.B.; Pan, J.H. Implementation effect of supporting polices on the high-quality development of resource-exhausted cities. China Popul. Resour. Environ. 2022, 32, 46–56. [Google Scholar]
  24. Gao, Z.G.; Li, M.R. Research on the Influence of system quality and government innovation support on the high-quality economic development of resource-based cities in the Yellow River Basin—Based on the supply-side perspective. Soft Sci. 2021, 35, 121–127. [Google Scholar]
  25. Xin, C.H.; Lai, X.F. Does the environmental information disclosure promote the high-quality development of China’s resource-based cities? Sustainability 2022, 14, 6518. [Google Scholar] [CrossRef]
  26. Gao, H.G.; He, M.X.; Xu, Y.Y.; Nie, A.R. Impact of environmental target constraints on high-quality economic development of resource-based cities. Resour. Sci. 2024, 46, 1976–1995. [Google Scholar]
  27. Wang, J.M.; Ding, H. Environmental regulation and high-quality economic development in resource-based cities. Stat. Decis. 2022, 38, 108–112. [Google Scholar]
  28. Wu, K. Exploring the path of high-quality development of resource-based cities in Chinese contexts. J. Nat. Resour. 2023, 38, 269–270. [Google Scholar] [CrossRef]
  29. Xu, J.; Ge, X.C.; Wang, X.; Jia, Q. Mechanism and path of high-quality transformation development of resource-based cities from the perspective of two-wheel drive of demand and supply. Soc. Sci. Guangxi 2020, 12, 53–61. [Google Scholar]
  30. Cui, Y.; Li, L.; Lei, Y.; Wu, S. The performance and influencing factors of high-quality development of resource-based cities in the Yellow River basin under reducing pollution and carbon emissions constraints. Resour. Policy 2024, 88, 104488. [Google Scholar] [CrossRef]
  31. Liu, J.; Bian, Z.Q. Research on the measurement of economic high-quality development level of resource-based cities—Based on the new development concept. Inq. Into Econ. Issues 2022, 1, 92–111. [Google Scholar]
  32. Lu, Z.H.; Wu, Y.P.; An, S.W.; Zhang, Y.; Zhu, J.H. The measurement and spatiotemporal evolution analysis of an ecological niche for the high-quality development of resource-based cities in China. Sustainability 2022, 14, 12846. [Google Scholar] [CrossRef]
  33. Xiao, X.D.; Liu, Y.B.; Li, R.Z. The identification of high-quality economic development level of coal resource-based cities and its transformation in China: A case study of 30 coal cities. J. Nat. Resour. 2023, 38, 563–575. [Google Scholar] [CrossRef]
  34. Que, Q.H.; Wen, C.X. Spatial governance of coastal resource-based cities for high-quality development: From the perspective of cross-system impact. J. Nat. Resour. 2023, 38, 255–268. [Google Scholar] [CrossRef]
  35. Ye, Y.; Qin, Y.; Yu, R.; Wu, Q. Optimization of Chinese land spatial pattern in the transformation process of resource-based cities: A case study in Tongling City, China. Sci. Rep. 2024, 14, 6092. [Google Scholar] [CrossRef]
  36. Liu, S.; Jiang, G.; Chang, L.; Huang, C. Construction and simulation of high-quality development of China’s resource-based cities driven by innovation based on system dynamics. Int. J. Environ. Res. Public Health 2023, 20, 4812. [Google Scholar] [CrossRef]
  37. Zhang, G.J.; Wang, Y.Z.; Chen, Y.; Zhou, C.S. Spatiotemporal characteristics and differentiation mechanism of high-quality development of urban agglomerations in China. Geogr. Res. 2022, 41, 2109–2124. [Google Scholar]
  38. Wang, J.K.; Han, Q. Spatial-temporal pattern of the coupling coordination of urban economy-society-environment in China. Econ. Geogr. 2021, 41, 193–203. [Google Scholar]
  39. Wang, R.; Cheng, J.H. Coupling analysis of economy, society and resource environment in the Yangtze River Delta city cluster under the perspective of high-quality development. Acad. Forum 2019, 42, 54–60. [Google Scholar]
  40. Zeng, X.G.; Duan, C.R. Performance evaluation and differential analysis on green transformation of coal resource-exhausted cities in China. China Popul. Resour. Environ. 2018, 28, 127–135. [Google Scholar]
  41. Si, R.J.M.L.; Mao, P. Empirical analysis of the influence of natural resources on regional economic growth: Based on the sample of key coal cities in China from 2000 to 2016. J. Nat. Resour. 2019, 34, 2491–2503. [Google Scholar]
  42. Wu, S.; Ma, X.; Zhang, X.; Chen, J.; Yao, Y.; Li, D. Investigation into hydrogen induced fracture of cable bolts under deep stress corrosion coupling conditions. Tunn. Undergr. Space Technol. 2024, 147, 105729. [Google Scholar] [CrossRef]
  43. Shi, Y.L.; Zhao, Y.F.; Xiao, E.L. Research on the coupling and coordination of industrial structure upgrading, science and technology innovation and high-quality economic development. Stat. Decis. 2024, 40, 119–124. [Google Scholar]
  44. Gan, C.H.; Zheng, R.G.; Yu, D.F. An empirical study on the effects of industrial structure on economic growth and fluctuations in China. Econ. Res. J. 2011, 46, 4–16. [Google Scholar]
  45. Yang, H.F.; Zhang, H.L. Evaluation of the coupled and coordinated relationship between ecological protection and high-quality economic development in the Yellow River Basin. Stat. Decis. 2022, 38, 114–119. [Google Scholar]
  46. Wang, S.J.; Li, J.F. Balanced characteristics and obstacle factors of high-quality green development in Yangtze River Delta urban agglomeration. J. Nat. Resour. 2022, 37, 1540–1554. [Google Scholar] [CrossRef]
  47. Li, H.; Han, Y. Analysis on the spatial-temporal evolution characteristics of PM-(2.5) and its influencing factors in the Yellow River Basin. World Reg. Stud. 2022, 31, 130–141. [Google Scholar]
  48. Wang, J.F.; Xu, C.D. Geodetector: Principle and prospective. Acta Geogr. Sin. 2017, 72, 116–134. [Google Scholar]
  49. Chen, M.H.; Wang, Z.; Xie, L.X.; Li, Q. The spatiotemporal pattern evolution and formation mechanism of high-quality development in central China. Acta Geogr. Sin. 2023, 78, 859–876. [Google Scholar]
  50. Lv, D.S.; Wang, J.; Cheng, Z. Spatio-temporal coupling and driving factors of digital economy, ecological protection and high-quality development in the Yellow River Basin. Inq. Into Econ. Issues 2022, 8, 135–148. [Google Scholar]
  51. Sun, L.Y. Study on Heterogeneity and Convergence of High-Quality Development of Coal Cities; Anhui University of Science and Technology: Anhui, China, 2023. [Google Scholar]
Figure 1. Standard deviation ellipse of the level of HQD in coal cities.
Sustainability 17 01707 g001
Figure 2. Standard deviation ellipse of the high-quality development level of coal cities.
Sustainability 17 01707 g002
Figure 3. Driver interaction detection results for 2020.
Sustainability 17 01707 g003
Table 1. Coal cities HQD evaluation index system.
Primary IndicatorsSecondary IndicatorsTertiary IndicatorsAttributes
Economic developmentIndustrial structureIndex of advanced industrial structure X1+
Industrial structure rationalization index X2
Technological progressR&D investment intensity X3+
Physical capital input intensity X4+
Patents granted per 10,000 people X5+
Internet penetration rate X6+
Open to the outside worldOpenness to the outside world X7+
External trade dependence X8+
Economic growthGDP growth rate X9+
GDP per capita X10+
Social progressInstitutional innovationsDegree of government intervention X11
Local financial strength X12+
Public servicesBasic pension insurance participation rate X13+
Strength of education investment X14+
Number of practicing physicians per 10,000 people X15+
Number of hospital beds per 10,000 people X16+
Urban road area per capita X17+
Public library collection per capita X18+
Number of students in general secondary schools as a percentage of population X19+
Resident lifeUrbanization rate X20+
Urban registered unemployment rate X21
Disposable income per capita X22+
Environmental protectionEnvironmental pollutionIndustrial wastewater emission intensity X23
Industrial fume (dust) emission intensity X24
Industrial waste gas emission intensity X25
Environmental governanceComprehensive utilization rate of solid waste X26+
Forest coverage rate X27+
Public green space per capita X28+
Resource securityCoal resourcesCoal Resource Abundance X29
Coal resource dependence X30
Land resourcesPer capita arable land area X31+
Population resourcesNatural population growth rate X32
Population density X33
+: Forward indicator; −: Negative indicator.
Table 2. Methods for judging interactions.
Basis of Interaction JudgmentType of Interaction
q X 1 X 2 < min q X 1 , q X 2 Nonlinear weakening (Weaken, nonlinear)
min q X 1 , q X 2 < q X 1 X 2 < max q X 1 , q X 2 Single-factor nonlinear attenuation (Weaken, uni-)
q X 1 X 2 > max q X 1 , q X 2 Two-factor enhancement (E.bi-)
q X 1 X 2 = q X 1 + q X 2 Independent
q X 1 X 2 > q X 1 + q X 2 Nonlinear enhancement (E.nln-)
Table 3. Two-stage ranking of the level of HQD of coal cities.
ProvincesMunicipalities2011201520162020Change in Ranking
2011–2015
Change in Ranking
2016–2020
Average Value and Ranking in
2011–2020
Eastern regionJiangsuXuzhou0.2910.3140.3430.468−240.350/4
FujianLongyan0.2590.3350.3540.3934−20.333/5
ShandongJining0.2480.2840.3050.383−200.304/9
Zibo0.3070.3490.3640.4450−10.367/2
Zaozhuang0.2080.2610.2750.372650.273/19
HebeiXingtai0.1770.2330.2530.3793210.260/26
Tangshan0.2560.2980.3010.423180.317/8
Handan0.2300.2370.2470.367−18210.261/25
Total city average value0.2470.2890.3050.404---
Central regionJiangxiXinyu0.3840.3440.3630.430−2−10.376/1
Pingxiang0.2270.2900.3120.454740.320/7
AnhuiSuzhou0.1620.2610.2610.3442080.253/30
Huainan0.2120.2610.2580.3416110.267/22
Huaibei0.2240.2940.3080.37411−40.300/11
HunanLoudi0.1830.2270.2460.354−3200.257/27
ShanxiDatong0.2240.2830.2900.3147−90.271/20
Shuozhou0.1940.2310.2220.277−300.231/38
Yangquan0.2220.2630.2690.2924−130.255/28
Changzhi0.2000.2390.2480.302−230.243/34
Jincheng0.2170.2560.2510.299−110.252/32
Lvliang0.1760.1820.1880.254−200.206/40
HenanPingdingshan0.1930.2410.2460.2802−20.243/36
Jiaozuo0.2270.2750.2910.3312−70.284/14
Hebi0.2400.3020.3020.3555−30.301/10
Total city average value0.2190.2630.2700.333---
Western regionGuizhouLiupanshui0.1940.2500.2610.2853−100.254/29
ShanxiTongchuan0.2110.2570.2780.3373−40.270/21
Yulin0.2150.2570.2600.312220.262/24
NingxiaShizuishan0.2850.2880.3030.389−640.321/6
SichuanDazhou0.1810.2070.2160.256−300.212/39
Guangyuan0.2640.2680.2670.297−10−100.276/17
Inner MongoliaWuhai0.2260.2920.3070.3489−90.296/12
Chifeng0.1690.2280.2390.305390.238/37
Erdos0.2880.3500.3700.3874−70.354/3
Total city average value0.2260.2660.2780.324---
Northwest regionnLiupanshuiHegang0.2020.2500.2640.2832-120.253/31
Qitaihe0.1810.2240.2720.294−3−140.243/35
Shuangyashan0.2360.3190.3050.3208−120.281/15
Jixi0.2330.2450.2590.310−1520.266/23
LiaoningFushun0.2920.2680.2700.307−13−70.294/13
Fuxin0.2510.2450.2740.304−20−110.277/16
JilinLiaoyuan0.2010.2500.2580.319260.251/33
Baishan0.2290.2510.2670.359−990.275/18
Total city average value0.2280.2570.2710.312---
Table 4. Quasi-differential elliptic parameters for the level of HQD of coal cities.
YearArea of an Ellipse (km2)Long-Axle Standard Deviation (km)Short-Axle Standard Deviation (km)Center of Gravity Longitude Point (°E)Center of Gravity Latitude Point (°N)Azimuth
(°)
Whole entity20111,769,825.1821067.458527.802116.14436.72733.773
20151,771,050.9201070.144526.842116.14336.71433.377
20201,718,341.1691046.977522.472116.12436.57932.588
Eastern region2011306,394.641632.368154.279116.90534.913172.620
2015314,164.054656.376152.410116.90334.776172.566
2020307,338.350617.587158.453116.84135.035172.214
Central region2011414,782.677633.222208.544113.95734.014168.640
2015418,522.016615.067216.630114.02534.139169.172
2020441,713.095628.433223.771114.01633.840170.197
Western region2011687,656.150789.422277.323108.31336.17721.053
2015726,873.726815.631283.720108.48636.25021.969
2020744,499.714814.286291.078108.61536.39322.920
Northwest region2011221,291.840512.020137.610127.98844.19135.387
2015216,473.111508.041135.668128.31044.39334.653
2020217,665.654500.730138.405128.18944.27934.753
Table 5. The q-value of each driver of the HQD of coal cities.
Dimension Driving Force20112020Average Value
Economic developmentIndustrial structureIndex of advanced industrial structure X10.0630.0480.035
Industrial structure rationalization index X20.2370.2530.323
Technological progressR&D investment intensity X30.4980.3300.330
Physical capital input intensity X40.1630.2080.179
Patents granted per 10,000 people X50.3090.6930.500
Internet penetration rate X60.3030.1970.254
Open to the outside worldOpenness to the outside world X70.3000.1630.196
External trade dependence X80.3810.5160.423
Economic growthGDP growth rate X90.0860.0090.119
GDP per capita X100.3210.3410.377
Social progressInstitutional innovationsDegree of government intervention X110.1050.3600.200
Local financial strength X120.2730.0570.192
Public servicesBasic pension insurance participation rate X130.3660.0620.231
Strength of education investment X140.2520.1050.259
Number of practicing physicians per 10,000 people X150.2580.1790.149
Number of hospital beds per 10,000 people X160.1370.0310.112
Urban road area per capita X170.1380.3420.307
Public library collection per capita X180.3140.2170.261
Number of students in general secondary schools as a percentage of population X190.0340.1270.078
Resident lifeUrbanization rate X200.1380.2230.260
Urban registered unemployment rate X210.1700.1130.106
Disposable income per capita X220.3120.4130.343
Environmental ProtectionEnvironmental pollutionIndustrial wastewater emission intensity X230.0970.1080.088
Industrial fume (dust) emission intensity X240.0340.0620.112
Industrial waste gas emission intensity X250.0670.1460.129
Environmental governanceComprehensive utilization rate of solid waste X260.1640.3640.164
Forest coverage rate X270.0480.2710.193
Public green space per capita X280.2840.1290.286
Resource securityCoal resourcesCoal resource abundance X290.0940.2180.179
Coal resource dependence X300.1480.0810.212
Land resourcesPer capita arable land area X310.1690.1340.159
Population resourcesNatural population growth rate X320.0360.2840.168
Population density X330.1090.3010.156
Disclaimer/Publisher’s Note: The statements, opinions and data contained in all publications are solely those of the individual author(s) and contributor(s) and not of MDPI and/or the editor(s). MDPI and/or the editor(s) disclaim responsibility for any injury to people or property resulting from any ideas, methods, instructions or products referred to in the content.

