Article

Multi-Scenario Land Use Change Dynamic Simulation and Carbon Stock Assessment of Man–Nature in Border Mountainous Areas

1
School of Economics and Trade, Guangxi University of Finance and Economics, Nanning 530003, China
2
School of Public Administration, Guangxi University, Nanning 530004, China
*
Author to whom correspondence should be addressed.
Sustainability 2025, 17(4), 1695; https://doi.org/10.3390/su17041695
Submission received: 16 December 2024 / Revised: 23 January 2025 / Accepted: 27 January 2025 / Published: 18 February 2025

Abstract

:
As an important gateway for China’s foreign exchanges, the border areas of Guangxi face irrational land use issues that impact local ecology, the economy, national security, and international relations. With global attention on climate change, “carbon peaking”, “carbon neutrality”, and ecosystem carbon storage, this study focuses on the border area, using natural resource, socio-economic, and transportation factors. Through the PLUS and In VEST models, it predicts carbon storage under multiple scenarios. (1) The results show that from 2000 to 2020, forest land, water bodies, and other land types decreased, while construction land and cropland increased. Land use changes accelerated over time, with significant urban expansion into cropland and forest areas, reflecting rapid socio-economic development. (2) For 2030, the following projections were made: Under natural development, construction land expands significantly, forest land declines, and urbanization spreads outward. Under urban development, construction land grows fastest, forest and grassland decline sharply, and infrastructure reduces other land types. Under sustainable development, reductions in forest and grassland are mitigated, construction land grows moderately, and water bodies remain stable, achieving a balance between humans and nature. (3) Compared to 2020, ecosystem carbon storage declines across scenarios. Annual decreases are 513,223.13 tons (natural), 5,469,327.95 tons (urban), and 500,214.24 tons (sustainable). Sustainable development is crucial for achieving “dual carbon” goals. This study emphasizes ecological priority, strict cropland protection, and controlled construction land, offering sustainable land management strategies to ensure rational land use and border security.

1. Introduction

Land is the most fundamental resource support for the progress and development of human society, an indispensable space carrier for human activities, and provides necessary raw material production for human beings. Therefore, land plays a pivotal role in the development track of human society and affects the way of life and future trend of human beings [1].With the rapid development of social economy, human demand for land resources also shows a continuous rising trend, and major cities have strengthened the development and utilization of land resources, and the development speed of land resources has also accelerated. However, rapid development and utilization have also brought a series of negative effects. Among them, the most prominent problems are the contradiction between land supply and demand, the gradual loss of production functions, and the serious deterioration of ecological environment, such as land desertification, soil erosion, sharp decline of forest resources, and endangered rare species, which have brought serious negative impacts on human survival and development [2]. At present, global climate change and issues such as “carbon peak” and “carbon neutrality” have gradually attracted wide attention, and the carbon storage of ecosystems has attracted great attention. Therefore, how to improve the sustainable utilization level of China’s land resources has important practical significance.
In 1995, the International Geosphere Biosphere Program (IGBP) and the International Human Factors of Global Environmental Change Program (IHDP) jointly put forward the land use/cover plan, which clearly took the principle research, law exploration, and model construction of LUCC as the three core research priorities [3]. After entering the 21st century, the rapid development of 3S technology provides strong technical support for revealing the spatio-temporal evolution law of land use/cover change, which enables a number of engineering examples to be carried out smoothly. For example, Veldkamp A et al. conducted an in-depth study on the dynamic change in land use in Costa Rica, South America [4]. Richard Furumo, Van Marle, Damien A, and other researchers have conducted in-depth research on land use change in the Amazon rainforest [4] Ye Daifu et al. [5] conducted an in-depth study on the interrelation between man-land relationship and sustainable development system and achieved remarkable results. Jiang Liwei selected Wuyuer River as their research target, and based on the data of 1980, 1995, 2000, and 2010, the L-THIA model was used to simulate and analyze the hydrological effects of land use/cover change in the catchment area of Yi’an Station, and the results showed that land use change had obvious effects on runoff. Chen Baiming et al. [6] discussed in-depth the index system of sustainable land resource use, and concluded that the organic integration, mutual feedback, and interdependence of the three kinds of research is key to ensuring that the index system of sustainable land use is scientific, systematic, and practical. Wang et al. [7], taking Shuangtai River Estuary National Nature Reserve as their research object, conducted an in-depth study on land use/cover change from 1984 to 2013 and analyzed the driving force behind it. The study found that social, economic, and other factors had a greater impact on the Shuangtai River Estuary National Nature Reserve. The driving effects of different social and economic conditions on land use/cover change are obviously different.
At present, the widely used forecasting models in the world can be roughly divided into two main categories, namely, the quantitative prediction model and spatial prediction model; each model has its unique applicability and limitations, but both are indispensable analysis tools in the simulation and prediction of land use change. The Markov chain model has significant advantages in the research of land type change, especially in the analysis of land type change quantity. The model also has obvious shortcomings in spatial prediction ability [8]. With its excellent adaptability, strong learning ability and accurate mapping ability, an artificial neural network (ANN) has shown significant advantages in the modeling and prediction of multi-variable nonlinear systems [9], and has been widely used in land science in recent years. The system dynamics model performs well in analyzing regional, dynamic, and systematic land use change processes, and can flexibly simulate land use demand under various scenarios [10]. The CLUE-S model, as a dynamic simulation model of spatial change in multiple land types based on empirical statistics, performs well in simulating the competitive relationship between different land types. However, it is worth noting that this model is more suitable for large-scale simulation research, while its effect may not be satisfactory for small-scale simulation research. Therefore, in practical applications, the specific scale and needs of the research should be fully considered to decide whether to adopt the CLUE-S model. In contrast, the cellular automata (CA) model shows its excellent performance in spatial computing, which can simulate the evolution process of complex dynamic systems more accurately and provide a powerful tool for spatial simulation research [11]. The FLUS model has excellent performance in handling the relationship between various driving factors, and can simulate the interaction of different land types in different regions with high accuracy [12]. However, the deficiency of the FLUS model is that it fails to fully take into account the possible spatial autocorrelation in land use data, which makes it very difficult to conduct simulations in the case of significant local autocorrelation. In response to the above problems, the PLUS model jointly developed by China University of Geosciences and the High Performance Spatial Computing Intelligence Laboratory (HPSCIL) is proposed to solve the above problems. Based on the CA model framework, using the integrated LEAS module and the base CARS model, the PLUS model provides researchers with a deep understanding of the potential land use conversion rules. Moreover, it plays a decisive role in land use decision-making and provides a powerful basis for decision-making. In the study of Lv Jing et al. [13], the PLUS model was used to predict the future spatial distribution of cultivated land in the Tumen River basin. The results show that GDP, road traffic, slope, and rainfall are the key factors affecting the change in cultivated land in this region. Compared with the FLUS model, the PLUS model shows a higher level of simulation accuracy and simulation ability, which provides a new powerful tool for simulating complex dynamic systems of land use change.
Previous studies have explored the influencing factors of land use between man and nature and their sustainable management strategies, focusing on macro-scales such as provinces, cities, and city clusters. However, studies on less-developed mountainous areas in Western China, especially border areas, are relatively weak. Therefore, more in-depth studies should be conducted to promote rational land use and sustainable development in these areas and to promote economic prosperity and social progress in border areas. As an important gateway for China’s foreign exchanges, the land use situation in Guangxi border area not only affects the local ecology and economy but also has a close relationship with national security and international relations. At present, with the advancement of economic development and the intensification of population migration, the border areas of Guangxi are faced with increasingly serious land use problems. Political, economic, environmental, and other backgrounds have led to the irrational use and unbalanced development of land resources. Therefore, the rational use and sustainable management of land resources are crucial to the development of Guangxi border areas. Through the study of land use change simulation and sustainable management in the border areas of Guangxi, in order to improve the efficiency of land use, it is necessary to optimize and adjust the existing land use mode, integrate land resources, and develop them efficiently and reasonably, so as to maximize the potential of land and realize the economical and intensive use of land resources. While realizing sustainable development, border land security can be maintained, scientific basis can be provided for government decision-making, rational utilization and sustainable development of land resources can be promoted, and economic prosperity and social progress of Guangxi border areas can be promoted.

2. Research Methods and Technical Routes

2.1. Research Methods

2.1.1. Dynamic Attitude of Land Use

Single Land Use Dynamics

The single index factor of dynamic attitude of land use can reflect the change amplitude of land type in a certain period and can also reflect the dynamic change in the region. In the same block, the greater the single dynamic attitude value, the more frequent the regional transformation between the block and other blocks, and the greater the change. The formula is as follows:
K = U b U a U a × 1 Τ × 100 %
where K represents a single dynamic attitude of a certain ground class; the absolute value of K can accurately reflect the rate of change in the area of a specific land type, and the positive or negative sign of K is used to indicate whether the area of the land use type is increasing or decreasing; U b is the area of the class at the end of the study; U a is the area of the class at the beginning of the study; and T is the time interval, expressed in years.

Comprehensive Land Use Dynamic Attitude

The comprehensive dynamic attitude of land use is used to reveal the overall change trend of land use types in the whole study area during the study period. The greater the absolute value of TY, the more frequent the transformation of various land types in the region. The formula is as follows:
T Y = a = 1 n Δ T Y a b 2 a = 1 n T Y a × 1 D × 100 %
In the formula, TY represents the dynamic value of comprehensive land use. Among them, T Y a b represents the absolute value of area conversion from type a to type b; and T Y a represents the area of species a at the beginning of the study. D is the study duration, expressed in years.

2.1.2. PLUS Model

In contrast to the previous land use models, which are mainly linear, the PLUS model adopts the more advanced land use expansion analysis strategy module (LEAS) and the cellular automaton model (CARS), which combines the random seed generation mechanism and the threshold decline mechanism. The PLUS model first uses the LEAS module to generate the development probability atlas of various types of land use and then uses the CARS module to accurately simulate the future land use change in the study area. The PLUS model design can not only better reveal the change mechanism of various land use types, but also has outstanding performance in simulation effect and precision.

Selection of Driving Factors

On the basis of consulting a large number of the relevant literature and materials, according to the above selection principles and combined with the actual situation of the study area, 13 impact factors in 3 main aspects, including natural environmental factors, social and economic factors, and traffic network factors, were selected (see Table 1 Borderland land use drivers and implications).

Processing of Driving Factors

Before analyzing the driving factor, the driving factor data and land use data need to be spatialized. Firstly, the distance from the water area, distance from the county government, distance from the first grade road, distance from the second grade road, distance from the third grade road, and distance from the railway are analyzed, respectively, and the grid data diagram of the distance factors is obtained. The slope is extracted from the raster surface by elevation using ArcMap10.7 software. Finally, all the data are exported to the raster format named in English to obtain the driving force factor raster data graph (Figure 1).

Simulation Results and Accuracy Test

According to the land use status data of the study area in 2010, the development probability data of six types of land from 2010 to 2020 generated by the LEAS module were put into the CARS module. Parameters of the CARS model were set, domain weight, transfer matrix, and land use demand of various types of land used in 2020 were, respectively, input, and land use types of the study area in 2020 were simulated, as shown in Figure 2.
Kappa coefficient not only reflects the accuracy of the drawing but also reflects the user’s accuracy. It is an important test standard for evaluating the coincidence between the predicted data and the actual monitoring results. It has been widely used by scholars and is regarded as the core index for evaluating the overall accuracy of simulated images. The formula is as follows:
K a p p a = P b P c 1 P c
In the formula, P b represents the proportion of the number of grids whose simulation results are consistent with the actual land use situation; P c represents the desired accuracy in random cases; the Kappa coefficient ranges from 0 to 1. With the decrease in the value, the accuracy of the simulation will also decrease. On the contrary, when the value is 1, the accuracy of the simulation is high.
The Kappa coefficient calculated according to the formula is 0.7841, and the Kappa coefficient exceeds the threshold value of 0.75 (Table 2). Therefore, the simulation results are successful, and the simulation accuracy is high, which indicates that the PLUS model can effectively simulate the change in the spatial pattern of land use in Guangxi border area in the future.

2.1.3. In VEST Model

The In VEST model is suitable for assessing the service function and economic value of an ecosystem. The model covers several key areas, including soil and water conservation, habitat quality, water conservation, carbon storage, etc. In the carbon storage module of the In VEST model, four major carbon pools are mainly considered: above-ground biochar, groundwater biochar, soil carbon, and dead organic carbon pool.
The carbon module tool is mainly used for the in-depth assessment of the carbon storage and potential carbon sink capacity of the ecosystem. The core function of this module is to accurately quantify the carbon absorption capacity of the ecosystem. Combined with modern geographic information system technology, it can accurately estimate the carbon storage of the ecosystem in the study area. The accuracy of calculating carbon stocks is highly dependent on the accuracy of land use data and the completeness of local carbon pool data. In terrestrial ecosystems, carbon storage mainly depends on four basic carbon pools: above-ground carbon pool, underground carbon pool, soil carbon pool, and carbon pool of dead organic matter. The formula is as follows:
C t o t a l = C t o t a l 1 + C t o t a l 2 + + C t o t a l n C t o t a l i = ( C a b o v e i + C b e l o w i + C s o i l i + C d e a d i ) × A i
where C d e a d i is the carbon density of dead organic matter, C s o i l i is the carbon density of soil, C b e l o w i is the carbon density of underground organic matter, C a b o v e i is the carbon density of above-ground organic matter, A i is the area of the land use type, C t o t a l i is the carbon storage of one land use type i, and C t o t a l is the total carbon storage of all land use types in the region.
In the assessment of ecosystem carbon storage, carbon density data of different land uses and cover types are obtained by classifying and summarizing relevant data. In view of the differences in carbon density data across the country, the carbon pool data of neighboring research areas in previous studies should be considered first when selecting carbon density, and the nationwide data should be appropriately referred to. Especially for those data similar to the land use/cover type in the study area, this paper mainly referred to the research results of Fang Jingyun, Rong Jian, Wu Peijun, Li Min, Chen Zhuan et al. [14] during the research process. The selection results of carbon density values are shown in Table 3.

2.2. Technical Route

The technical route of the article is outlined in Figure 3:

3. Overview and Data of Study Area

3.1. Research Overview

Guangxi Border area is located in the southwest of Guangxi Zhuang Autonomous Region, including Chongzuo City Longzhou County, Ningming County and Daxin County, Fangchenggang City Fangcheng District and Dongxing City, Baise City Napo County and Jingxi City, and eight other counties (cities and districts), with latitudes and longitudes from 20°46′ north to 23°25′, and from 105°50′ east to 108°22′ east. It borders Debao County and Phu Ninh County in the north, Quang Ninh and four other provinces of Vietnam in the west and south, and Long An and Fu Sui and four other counties in the east. The border between China and Vietnam stretches as long as 1020 km here, forming a unique border style, specific location, and scope, as shown in Figure 4. The terrain of Guangxi border region is low in the southeast and high in the northwest. In the southeast, the terrain gradually becomes low, mostly low mountains and hills with gentle slopes, belonging to the subtropical monsoon climate region, with long summers and short winters, distinct dry and wet seasons, sufficient light, abundant rainfall, short frost period, and an average annual temperature of about 21.5 °C. The average annual rainfall ranges from 1215.7 to 1898.6 mm. At the same time, in terms of biodiversity, there are a wide variety of plants and animals, and many rare plants such as golden-flower tea, corbicula, and golden-lily were included in the national protection list. At the same time, the study area is also the habitat of a variety of precious animals, including pangolins, pythons, and white-headed langurs [15].

3.2. Data Sources and Processing

3.2.1. Data Source

The research data (Table 4) were obtained by referring to relevant studies on CNKI and combining the experience of the former. The data of land use types in the first and third phases were obtained from GlobeLand30 (global geographic information public product); the second is the geospatial data cloud; the third is the national geographic information resources directory service system; the fourth is the National Tibetan Plateau Scientific Data Center, the National Earth System Science Data Center, and China Resources and Environmental Science and Data Center; and the seventh is Guangxi Statistical Yearbook.

3.2.2. Data Processing

In this study, the secondary land use data in 2000, 2010, and 2020 were reclassified into six primary land categories: cultivated land, forest land, grassland, water area, construction land, and other land. Convert all vector data to raster, and unify resolution, data type, and coordinates to keep data consistent. Eight factors, such as distance from water, distance from county government, and distance from railway, were converted, and Euclidean-style distance analysis was carried out by ARCGIS to measure them, so as to keep their spatial ranges consistent [16].

4. Result Analysis

4.1. Analysis of Spatial–Temporal Evolution of Land Use in Border Areas

4.1.1. Analysis of Land Use Structure Change

The current situation of land use in the three phases of 2000, 2020, and 2020 (Figure 5 and Table 5) is analyzed. The land use is mainly forest land, which is distributed in the mountains with higher elevation in the north and central and southern seas (Napo County, Jingxi City, Ningming County, and Fangcheng District), followed by cultivated land grassland, which is distributed in the central Daxin County, Longzhou County, and Pingxiang City.
As shown in Table 5, the overall structure of land use types in Guangxi border areas from 2000 to 2020 was mainly forest land, cultivated land, and grassland. In 2000, the proportion of land use types of forest land, cultivated land, and grassland was 69.78%, 25.68%, and 3.21%, accounting for 98.67% in total. Before and after 2020, the area proportion changes are 66.46%, 28.52%, and 3.33%, and the three types of areas together account for 98.31% of the total area, indicating that the overall change in forest land, cultivated land, and grassland area is more active. Among them, the area of forest land decreased by 59,080.68 hm2, while the area of cultivated land increased greatly by 50,554.53 hm2.
Secondly, from the perspective of the range of land use change, the area of forest land, water area, and other land in Guangxi’s border areas showed a trend of continuous decrease from 2000 to 2020, while the area of cultivated land, grassland, and construction land showed a trend of fluctuating increase. The area of forest land, water area, and other land use decreased by 59,080.68 hm2, 3118.23 hm2, and 137.16 hm2, respectively. The area of forest land decreased by the most, which was 3.32%, followed by other land use, which decreased by 0.01%. Construction land and cultivated land increased by 9676.71 hm2, 50,554.53 hm2 by 0.54% and 2.84%, indicating that urban development occupies forest land, water area, and other land, and the expansion trend of urban construction is becoming more prominent.
In summary, through the in-depth analysis of the land use structure in the border areas of Guangxi from 2000 to 2020, a significant trend of change is observed. In the past two decades, the area of forest land, water area, and other types of land have decreased, while the area of cultivated land, grassland, and construction land has shown an increasing trend [17].

4.1.2. Dynamic Attitude Analysis of Land Use

In order to deeply explore the change in land use area in border areas, the above calculation formula is used to process and calculate the data of three time nodes in 2000, 2010, and 2020, respectively, and the results of single dynamic attitude and comprehensive dynamic attitude in different periods and land types are obtained, as shown in Table 6 and Figure 6.
As shown in Figure 6 and Table 6, the single land use dynamic attitude shows that the construction area increases rapidly, from 0.24% during 2000–2010 to 12.55% during 2010–2020. It can be seen that the social and economic development of the border area is accelerated, the population is growing rapidly, and the scale of urban construction is constantly expanding to the surrounding areas. The area of cultivated land and forest land decreased rapidly; from 2000 to 2010, the decrease rate was 0.25% and 0.06%, respectively. From 2010 to 2020, the reduction rate increased to 1.39% and 0.53%, respectively. The results of comprehensive land use dynamic attitude in Table 6 show that the speed of land use change in the border areas of Guangxi is accelerating, and the impact of social and economic activities on land use is also gradually increasing. From 2000 to 2010, the dynamic attitude of comprehensive land use in the border areas of Guangxi was 0.08%, and the change rate was relatively flat. However, from 2010 to 2020, the dynamic attitude of comprehensive land use increased to 0.40%. The rapid rate of change in the overall land use type is clearly related to the increase in human activities.

4.2. Land Use Change Simulation

4.2.1. Multi-Scenario Simulation of Future Land Use

After simulating the land use situation of the study area in 2020, it was found that the simulation effect was very good, indicating that the PLUS software (version invest 3.14.2), combined with 13 driving factors and related parameters, could accurately simulate and study the spatial distribution of land use in the border area. Based on the land use data in 2020, combined with PLUS software and driving factors and related parameters, the spatial distribution of land use in 2030 in the study area was simulated. Since land use change involves a variety of complex factors, there are many possibilities for future land use spatial pattern change. The future land use spatial change in border areas is set into three scenarios: the natural development scenario, the urban development scenario, and the sustainable development scenario; through the simulation of these three scenarios, we hope to understand the changes in the future spatial pattern of land use in border areas more comprehensively, and provide valuable references for policy makers and planners.

Natural Development Scenario

In the natural development scenario, land use change is mainly influenced by the natural environment and social and economic development in the study area without any intervention of land development policies. It is assumed that land use types in the border areas will continue to follow the change rules of previous years during the period from 2020 to 2030. Based on the land use data of the border areas in 2000, 2010, and 2020, the Markov chain in the PLUS software is used for prediction, and the expected demand of various types of land use in the border areas in 2030 is obtained based on the transfer probability matrix.

Urban Development Scenario

The urban development scenario is based on the natural development scenario and combined with the rapid economic development stage of the border area, the water area of the study area is set as a restricted conversion area, and it is clear that in the process of urban development, the rational use and protection of water resources should be made, the ecological balance and sustainable development should be promoted, and the probability of converting arable land, forest land, and grassland into construction land should be increased by 20%. Reduce the transfer probability of construction land to cultivated land, forest land, grassland, water area, and other land by 30%, the target demand result of each land use type in border areas by 2030.

Sustainable Development Scenario

Based on the context of natural development, taking into account the importance of ecological protection, and introducing nature reserves as key areas to restrict land conversion, the probability of converting forest land and grassland into construction land is reduced by 20%. In order to reduce the damage to natural ecosystems, the probability of converting water area into construction land is correspondingly reduced by 40%, so as to maintain the original state of water area. While the probability of transferring to cultivated land is increased by 40%, which helps to stabilize and protect agricultural land, the probability of converting other land into construction land is increased by 40%. The adjustment allows a certain degree of land development but also needs to consider the ecological impact. The probability of converting construction land into grassland is increased by 10%, which helps to increase the green cover of the surface and promote ecological restoration. It can simulate a land use pattern that pays more attention to ecological protection and sustainable development and balance the relationship between economic development and environmental protection [18].

4.2.2. Multi-Scenario Analysis of Future Land Use

The Markov chain-PLUS model is applied to simulate and analyze the spatial pattern of land use in border areas, and land use change situations under three different scenarios are discussed: natural development, urban expansion, and sustainable development. According to the land use change situations in border areas of Guangxi under different scenarios, the change in land quantity, the degree of expansion, and the specific scene setting are analyzed. Arc Map10.7 software was used to produce land use type result maps under three scenarios (see Figure 7), and land use type area changes under natural development scenarios, urban development scenarios, and sustainable development scenarios were calculated (see Table 7). Increased activity related to the various scenarios.
As can be seen from Figure 7 and Figure 8, Table 7, the land use structure of Guangxi border areas in 2030 mainly depends on cultivated land, forest land, and construction land under different scenarios. The land use types in this region have undergone various changes, and the scale of the changes is obviously different. The area of forest land and grassland land shows a decreasing trend in general, while the area of cultivated land has increased, and the area of water, construction land, and other types of land has also increased.
Under the natural development scenario, all types of land use are transferred according to the original trend. Among them, the area of construction land has the most significant growth, with an increase of 4825.62 hm2 compared with 2020. The area of cultivated land has also increased, with an increase of 53,101.17 hm2. In addition, the area of grassland, water area, and other land increased by 742.86 hm2, 727.11 hm2, and 6.12 hm2, respectively. Combined with Figure 8, it can be seen that the construction land continued to expand outward in the urban center, resulting in the occupation of cultivated land and forest land in the neighboring urban areas.
In the urban development scenario, compared with the other two scenarios, construction land has the fastest expansion speed and the largest increase in area, with an increase of 8252.19 hm2. By comparing the land use type area of the study area in 2020 and 2030, it is found that construction land is mainly concentrated in Napo County, Jingxi City, and Pingxiang City. The area of other land increased by a small amount, while the area of forest land and grassland decreased the most, among which the area of forest land decreased the most significantly, reaching 60,420.51 hm2, while the area of grassland decreased by 2314.8 hm2. These decreased forest lands and grasslands were mainly located in Napo County and Jingxi City, indicating that under the urban development scenario, the area of forest land and grassland decreased by 2314.8 hm2. Construction land mainly relies on traffic road construction and residential construction, resulting in an increase in construction land, which further reduces the land area other than construction land.
Under the sustainable development scenario, compared with the other two scenarios, the decline rate of forest land and grassland is somewhat moderate. In particular, the decrease rate of forest land area is less, decreasing by 58,571.1 hm2 and 2124.82 hm2. Meanwhile, the increase rate of construction land is moderate, increasing by only 440.1 hm2, indicating that construction land has reduced the encroachment on surrounding land. The water area is basically the same as the actual area in 2020, showing relatively stable performance. Agricultural land and ecological land are protected to a certain extent, which is conducive to the coordinated development of man and nature. The area of cultivated land increased the most, reaching 56,010.55 hm2, with the new cultivated land mainly distributed in Fangcheng district and Dongxing City, and the remaining county town also increased a little, so that grain production id guaranteed, helping to promote the sustainable development of man and nature.
To sum up, there are obvious differences in the changes in different regions under different scenarios, which have different impacts on the development of the study area. In the natural development scenario, all types of land use develop freely, and the direction of change in different regions is basically the same as that in 2020, but the actual situation of the study area is not taken into account in land use change. In the scenario of urban development, traffic roads and towns are rapidly developing outwards. Although the economic level of cities has improved, the coordinated development of human beings and nature is facing severe challenges. Under the scenario of sustainable development, land types with high ecological value, such as forest land, grassland, and water area, are protected to a certain extent, and the encroachment of construction land on surrounding agricultural land is reduced, which improves the ecosystem of the study area to a certain extent. Therefore, before simulating and forecasting land use change in the study area, it is necessary to comprehensively consider the actual situation of the region and clarify the development goals of the city. At the same time, the land constraint conditions under the three scenarios should be comprehensively considered, and all kinds of land use types should be used scientifically and rationally to promote the sustainable development of human and nature in the region [19].

4.3. Analysis of Change in Carbon Stocks from 2000 to 2020

4.3.1. Analysis of Carbon Storage Changes in Each Land Use Type

During the period from 2000 to 2020, the carbon stock within the border area’s ecosystem exhibited a trend of initially ascending and subsequently descending, as depicted in Figure 9 and Table 8. Nevertheless, the overall tendency was downward, with an average annual reduction reaching as high as 251,523.32 tons. In terms of the proportion of carbon stocks among different land use types, forest land topped the list, trailed by arable land, followed successively by grassland, construction land, water areas, and other types of land. From 2000 to 2010, there was a marginal increase, whereas from 2010 to 2020, a significant decline was witnessed. This implies that in the early phase, human activities exerted a relatively feeble influence, with natural environmental elements taking the lead, thus driving the upward trend of carbon stocks. As time progressed, human activities intensified conspicuously, triggering pronounced alterations in the regional land use structure and further inflicting a detrimental impact on the local carbon stocks.
When analyzing the variation in carbon stocks across different land categories, it was evident that the carbon stocks of arable land, grassland, and construction land demonstrated a marked upward trajectory, while those of forest land, water areas, and other land types presented a distinct downward slope. The principal cause lies in the fact that construction land and arable land are the primary loci of intensive human activities. For instance, the expansion of urbanization encroaches upon the arable land, forest land, water areas, and other land surrounding urban areas. Additionally, human reclamation efforts also appropriate adjacent forest land and grassland, leading to a notable augmentation of arable land and construction land and, in turn, a consequent shrinkage of forest land, water areas, and other land. Evidently, human activities have a deleterious effect on regional carbon stocks. Consequently, in future development blueprints, emphasis should be placed on the protection of the natural environment to augment the carbon sequestration capacity impact on the overall carbon storage was limited.

4.3.2. Analysis of Temporal Evolution of Carbon Storage

After integrating the future LUCC simulation data and carbon density data with the PLUS model and using the In VEST model, the carbon storage prediction results of three different scenarios in the future—natural scenario, urban development scenario and sustainable development scenario—are obtained. As shown in Table 9, from 2000 to 2020, the carbon storage of the ecosystem in the border area has declined year by year. The average annual reduction is as high as 251,523.32 t, which undoubtedly poses a huge challenge and potential threat to the global efforts to achieve carbon neutrality. In order to effectively slow down or even reverse the negative trend, border areas must actively take action to implement targeted measures, including promoting green and low carbon development. Reduce carbon emission intensity and promote the recovery and growth of carbon storage by optimizing industrial structure and improving energy utilization efficiency. In addition, it is also necessary to strengthen the management of carbon emissions, strictly control the total amount of carbon emissions, and take practical and effective measures to deal with the problem of carbon emissions. At the same time, actively promote the steady development of carbon market, which is crucial to ensure the harmony and stability of human living environment and promote sustainable economic development in the future.
In the case of natural development, the ecosystem carbon storage in the border area showed a trend of gradual decline. According to the forecast results of the In VEST model, under the natural development scenario, the total carbon storage in the border areas in 2030 is predicted to reach 252,477,986.16 t, which is a decrease of 5,132,231.26 t compared with 2020, and an average annual decrease of 513,223.13 t, showing an adverse trend of carbon storage decline during this period [20].
Compared with the natural development scenario and the sustainable development scenario, the carbon storage in the urban development scenario declines more rapidly. In 2030, the ecosystem carbon storage in the border area will reach 252,140,889.47 t, with an average annual decline of 5,469,327.95 t. In this scenario, due to the continuous expansion of construction land in the border area, with arable land, forest land, and grassland occupied in large quantities, the rise in construction land is accelerated. This phenomenon will have a negative impact on the ecological balance and stability of the region, as well as the social and economic development of mankind.
Compared with the natural development scenario and urban development scenario, the decline rate of carbon storage in the sustainable development scenario is relatively slow. In 2030, the ecosystem carbon storage in the border area will reach 252,608,075.03 t, with an average annual decline of 50,214.24 t, which indicates that the ecosystem carbon storage in the sustainable development scenario has a tendency to mitigate adverse changes. According to the data shown in Table 9, although the ecosystem carbon storage in the border area has not recovered to the 2010 level by 2030, the recovery of ecological carbon sink shows a positive trend under the current situation. Although the recovery rate is relatively slow, the overall trend is good. It is essential to alleviate the urgency of climate change, and it also plays a positive role in promoting the realization of sustainable development.

4.3.3. Analysis of Spatial Evolution of Carbon Stocks

Figure 10 shows the spatial distribution pattern of carbon storage in the study area under different scenarios in 2000, 2010, and 2020. Through comparison and analysis of the spatial distribution of carbon storage under different time and scenarios, it can be observed that in different years, carbon storage in 2010 is at the highest level, followed by that in 2000. In 2020, carbon storage is relatively low. In the same year, the carbon storage under the sustainable development scenario is the most prominent, followed by the natural development scenario, and the carbon storage under the urban development scenario is relatively low, especially in the central and southern parts of the study area. In addition, the carbon storage difference among the three different scenarios gradually increases, showing a clear trend of change.
Through comparative analysis of the spatial pattern of carbon stocks in different scenarios, it is found that the spatial distribution of carbon stocks changes significantly. In the scenario of sustainable development, it can be found in Figure 10 that the central and southern regions of the border areas, especially Ningming County, have a very high forest coverage rate; Daxin County is rich in water resources, and Longzhou County has a high coverage rate of cultivated land and grassland. Therefore, high-carbon storage areas are concentrated in this region, and there are also high-carbon storage areas in the northern region, but the distribution is relatively scattered. Under the promotion of ecological protection policies, the area of high-carbon density land such as cultivated land, forest land, and grassland has expanded, while the area of construction land with low carbon density was effectively controlled, indicating that the sustainable development and construction of ecosystem carbon storage has achieved results.
In the natural development scenario, it can be found from Figure 10. that the distribution of high-carbon reserves in the border areas is similar to that in the sustainable development scenario. Although the carbon reserves in the coming decades are slightly less than those in the sustainable development scenario, it can be observed that the high-carbon reserves in the central and southern parts of the country (Daxin County, Ningming County, and Dongxing City) decrease relatively slowly. In the north (Jingxi City and Napo County), the high-carbon storage area has not been replaced by a large number of people. Although the area of ecological land is growing and its carbon density is high, the growth rate is relatively slow. In view of this, in order to effectively enhance the carbon sink capacity of the ecosystem, more active and powerful measures should be taken.
In the scenario of urban development, it is observed that the scope of high-carbon reserves in the central and southern parts of the border area is gradually reduced in combination with Figure 10, and the phenomenon of scattered distribution of low carbon reserves appears in the concentrated areas (Ningming County), which is obvious in the edges of urban settlements in the study area. As time goes by, the contradiction between land use and urban land use becomes increasingly prominent in the process of urbanization. The encroachment of construction land on forest land and cultivated land is serious, and the original dense high-carbon storage area is decreasing, and the overall transformation is toward a low carbon storage area. Combined with the discussion in Chapter 4, it is found that in the urban development scenario, a large number of ecological land is occupied and transformed into construction land, and construction land belongs to low carbon reserves, while the ecological land belongs to high-carbon reserves. Therefore, the situation of continuous decline of carbon reserves is relatively serious, which has a great impact on the realization of carbon neutrality and the promotion of carbon cycle [21].

5. Conclusions and Prospect

5.1. Conclusions

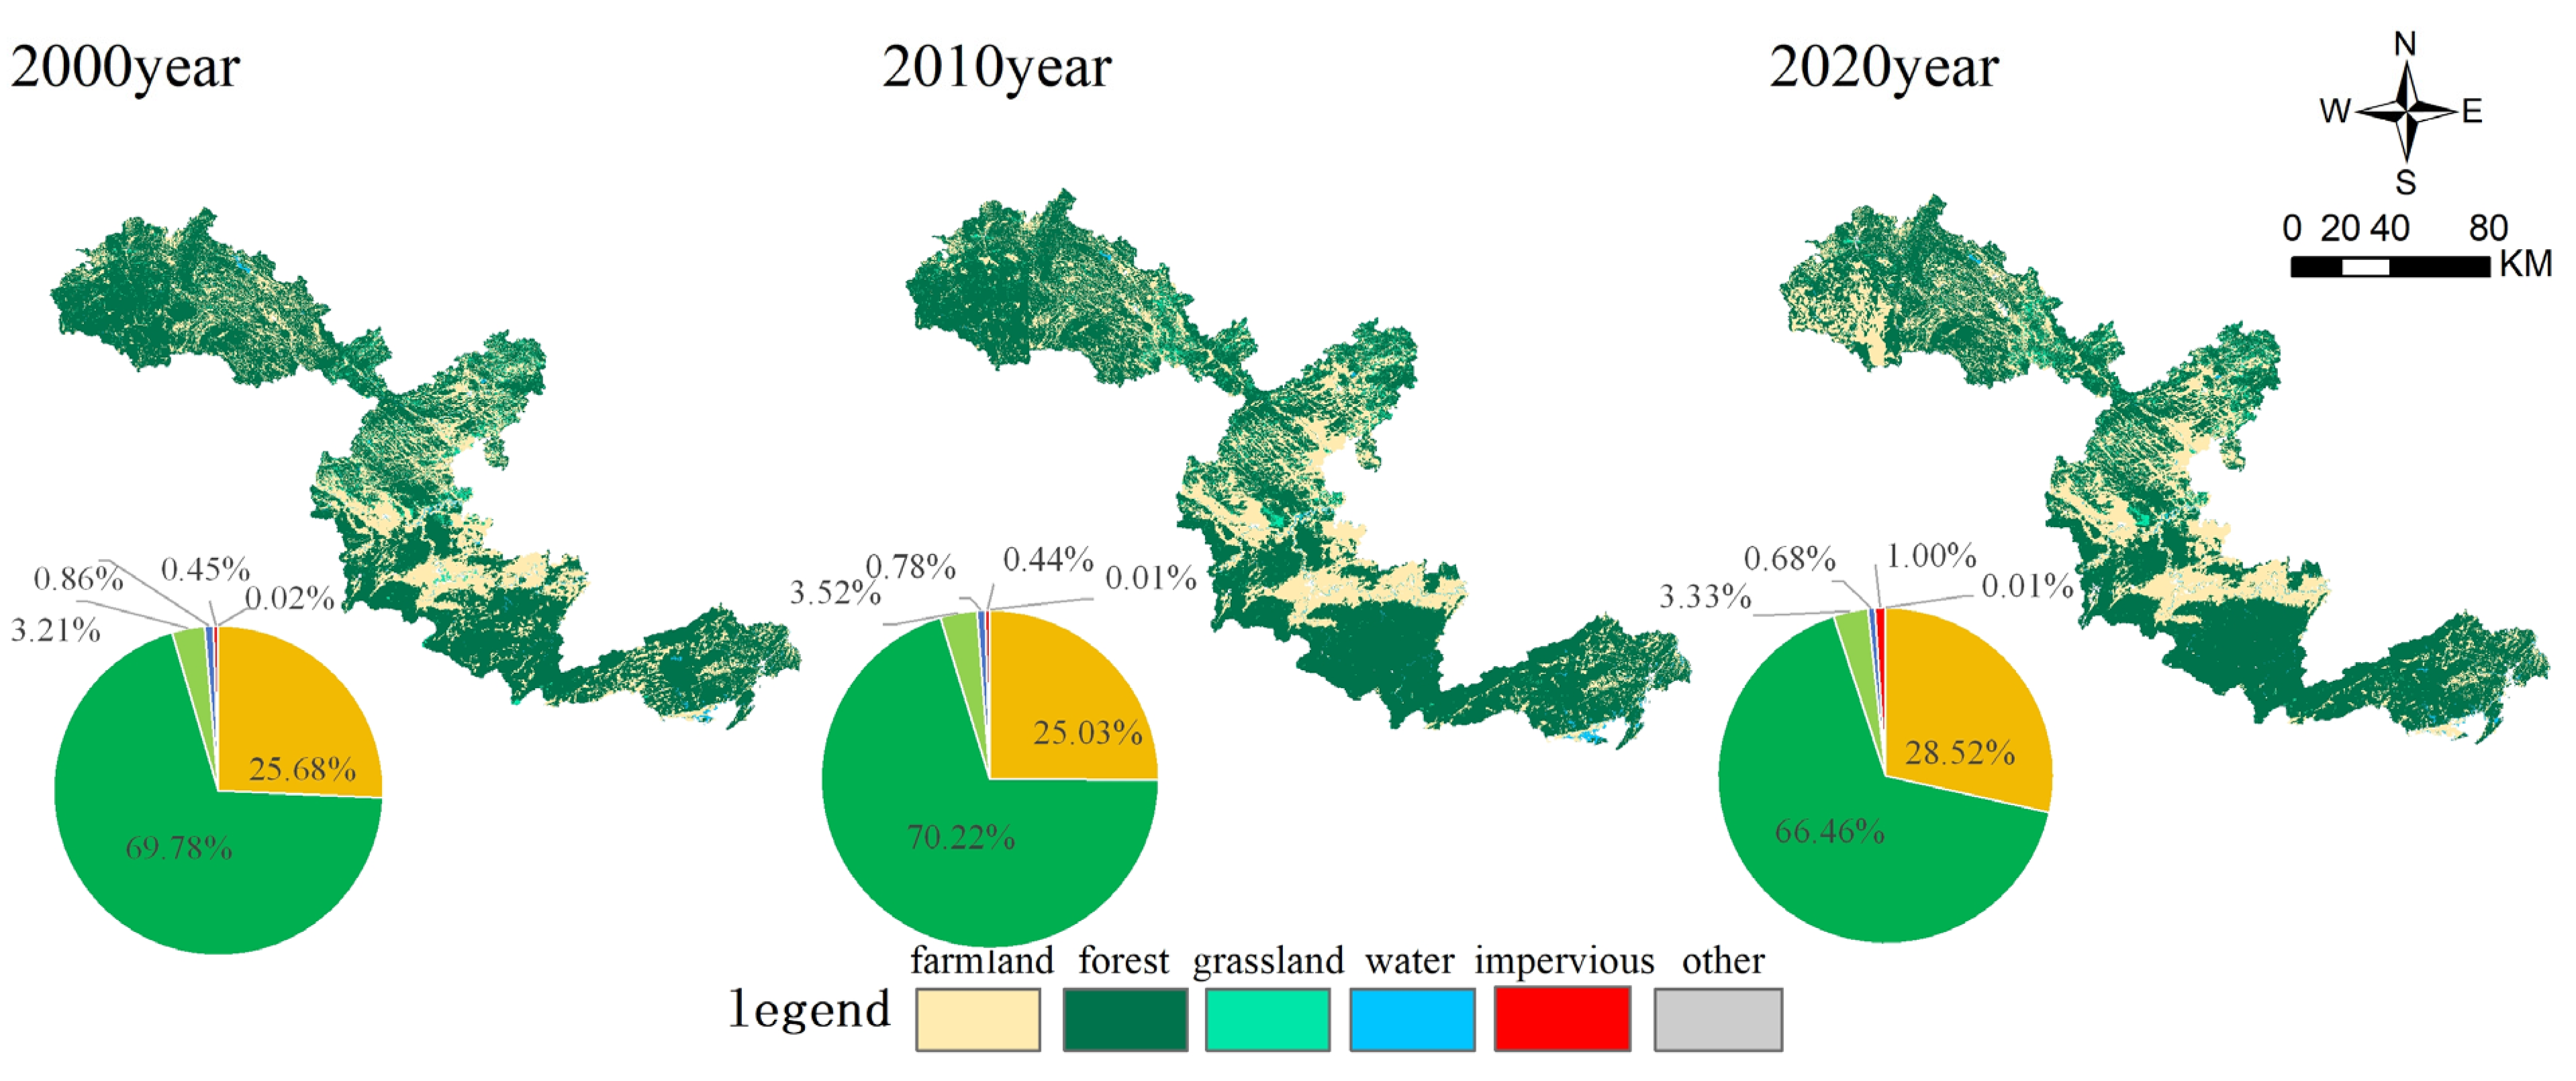
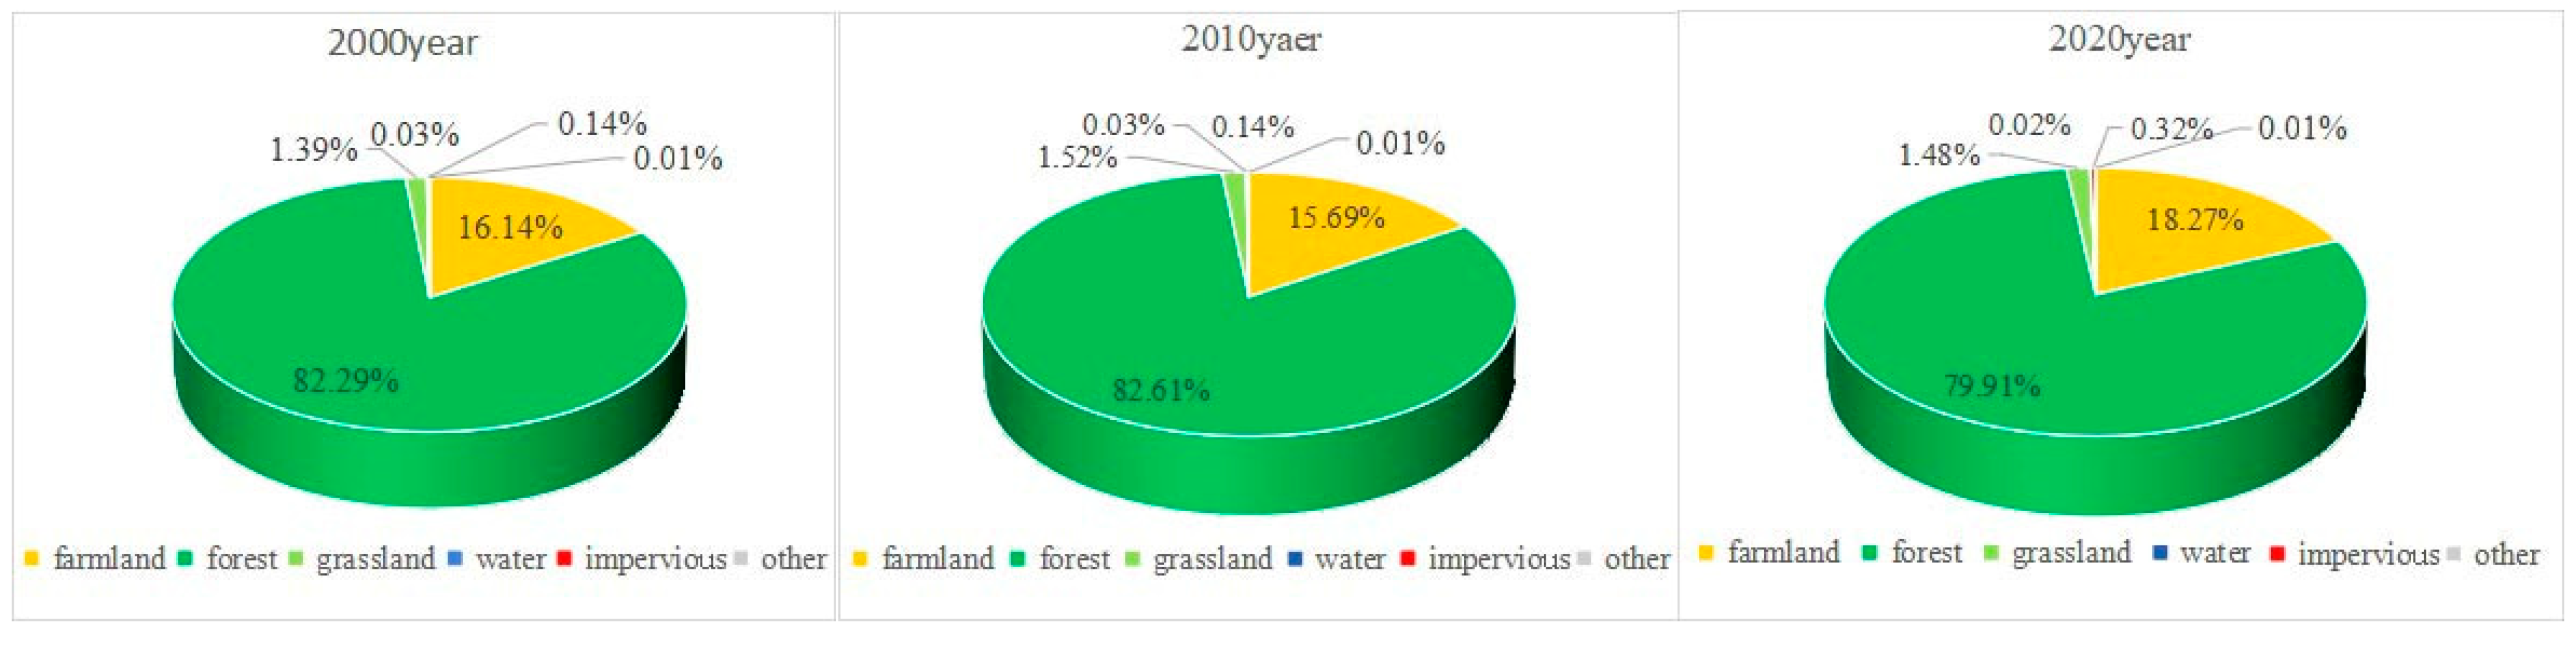
(1) The overall structure of land use types in the Guangxi border area is dominated by forestland, cropland, and grassland, which account for 98% of the total. From 2000 to 2020, forestland, water areas, and other land types showed a decreasing trend, while construction land and cropland exhibited an increasing trend. This indicates that urban development has occupied forestland, water areas, and other land types, with the trend of urban expansion becoming increasingly evident.
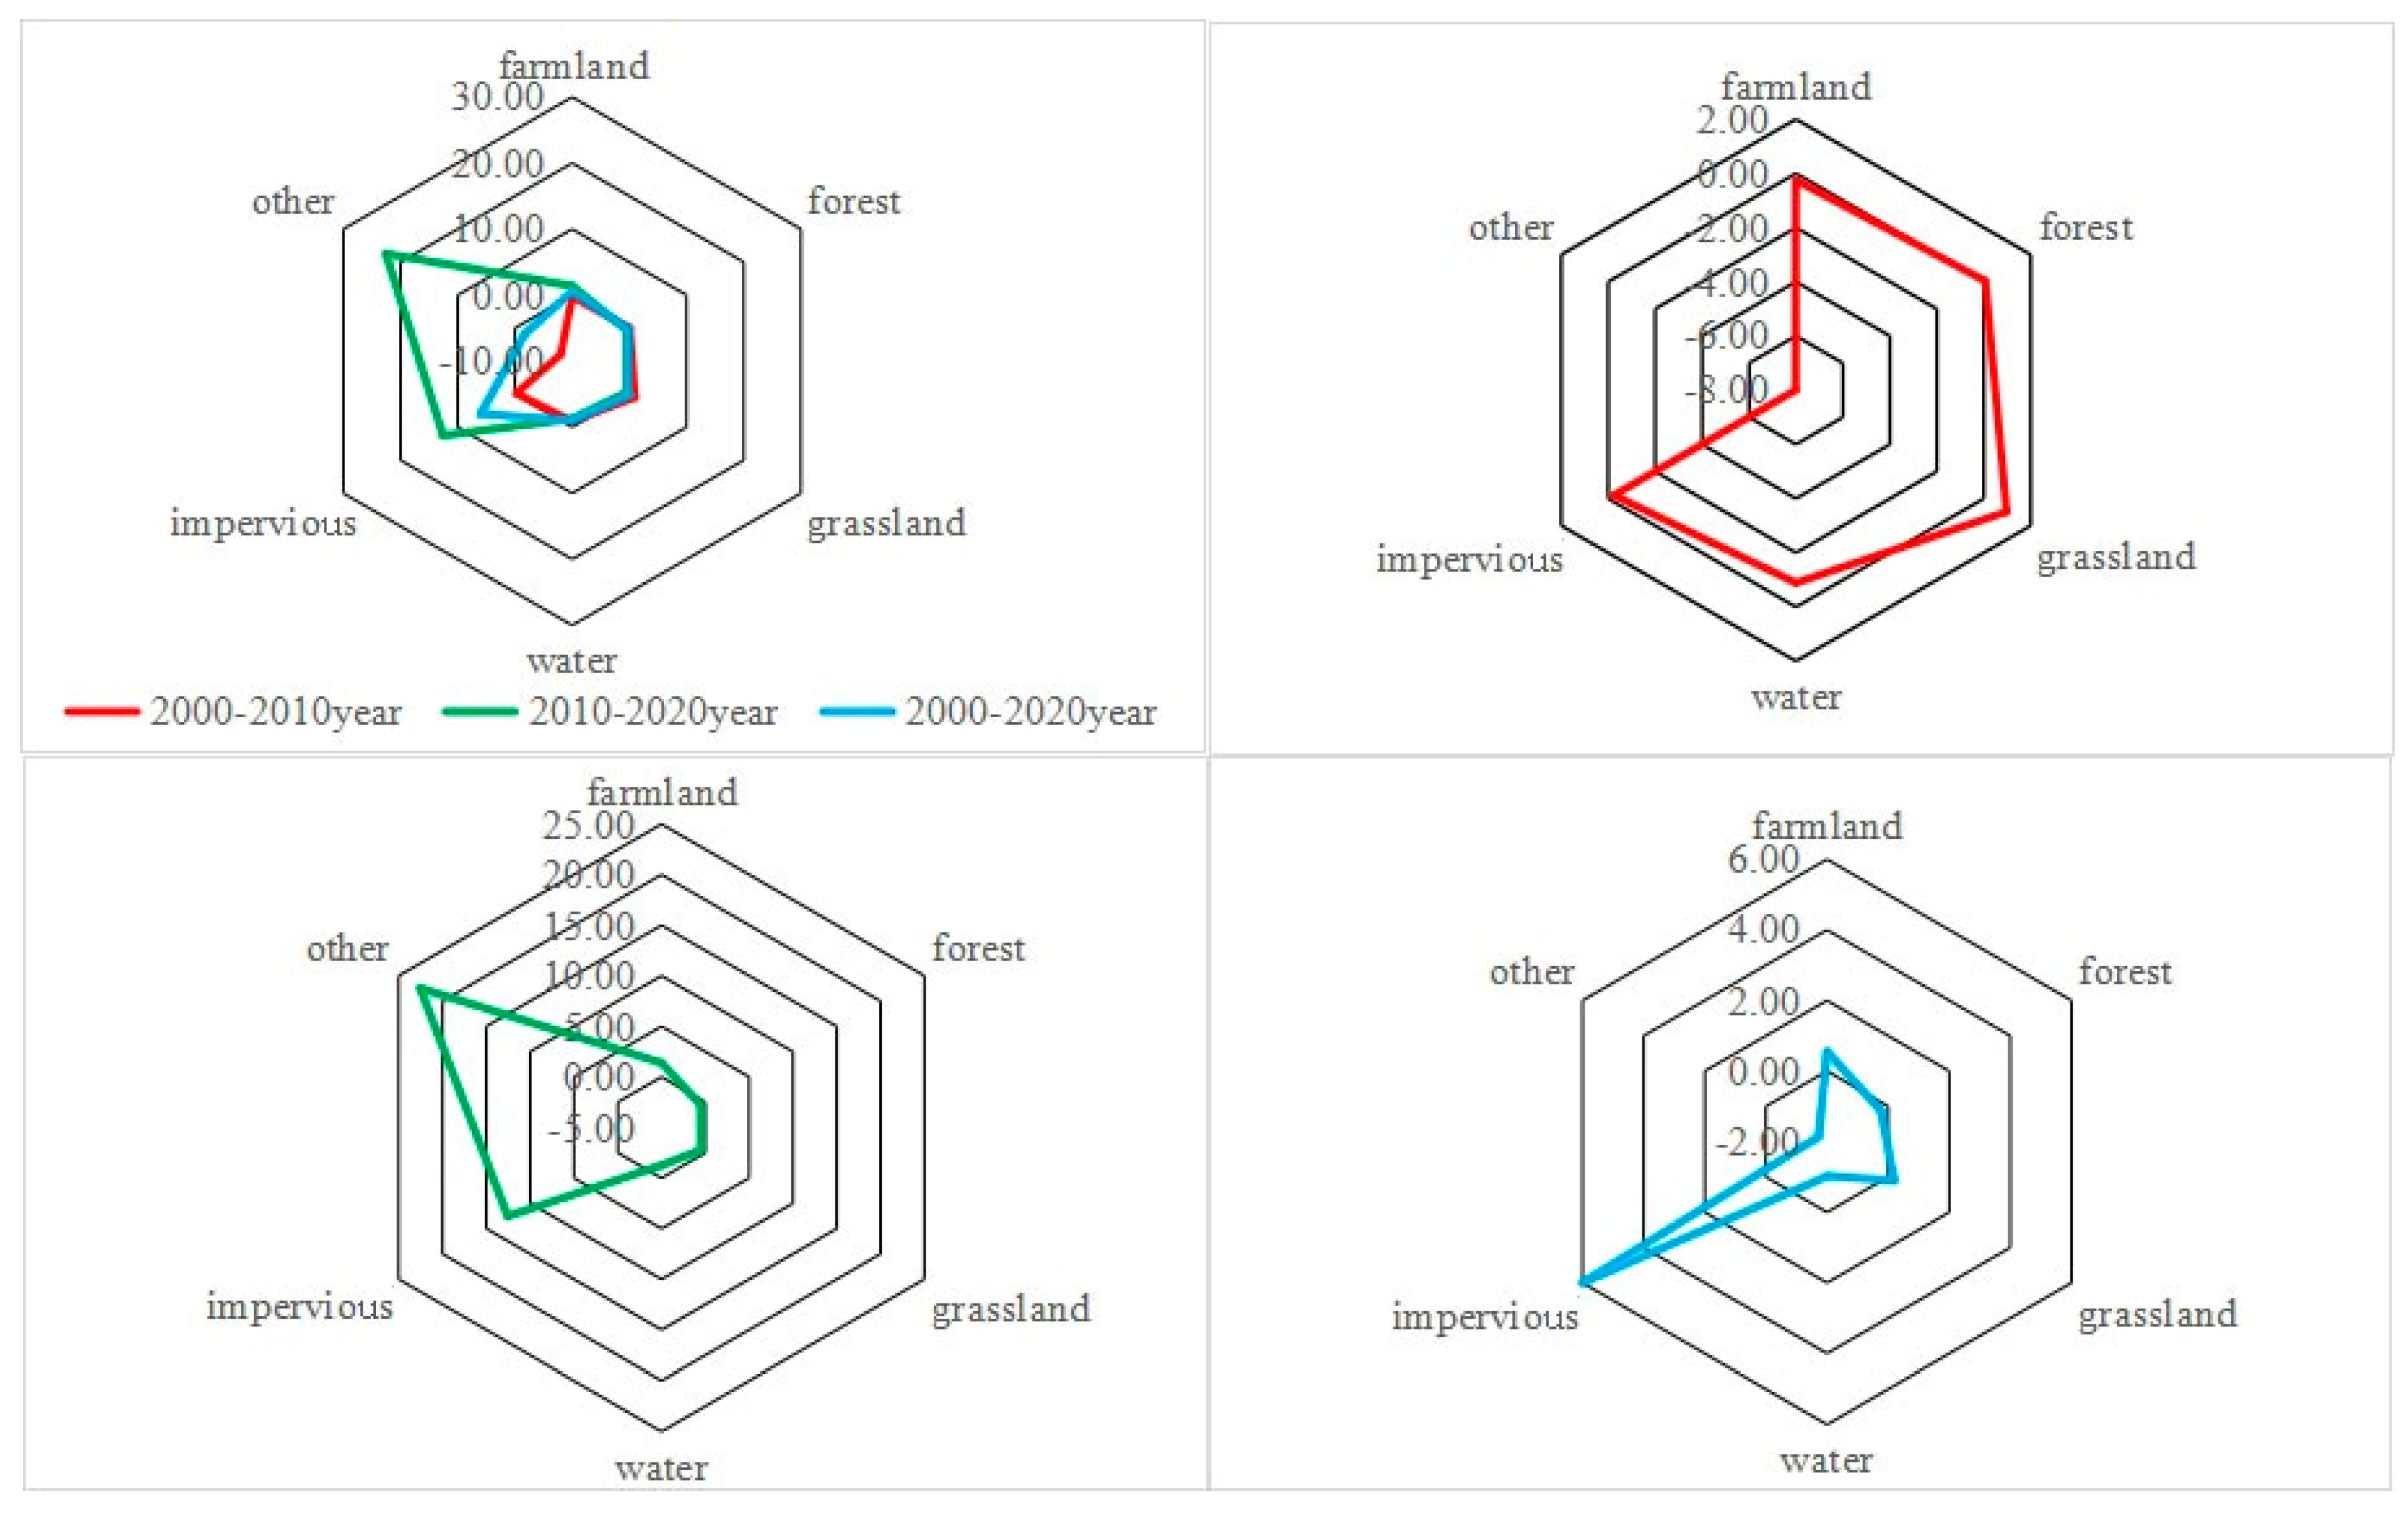
From the perspective of comprehensive land use dynamics, changes were relatively stable from 2000 to 2010, while they accelerated significantly from 2010 to 2020. This reflects a shift in the socio-economic development of the border region from slow growth to rapid development, intensifying the trend of urban expansion and highlighting the growing impact of human activities in the area.
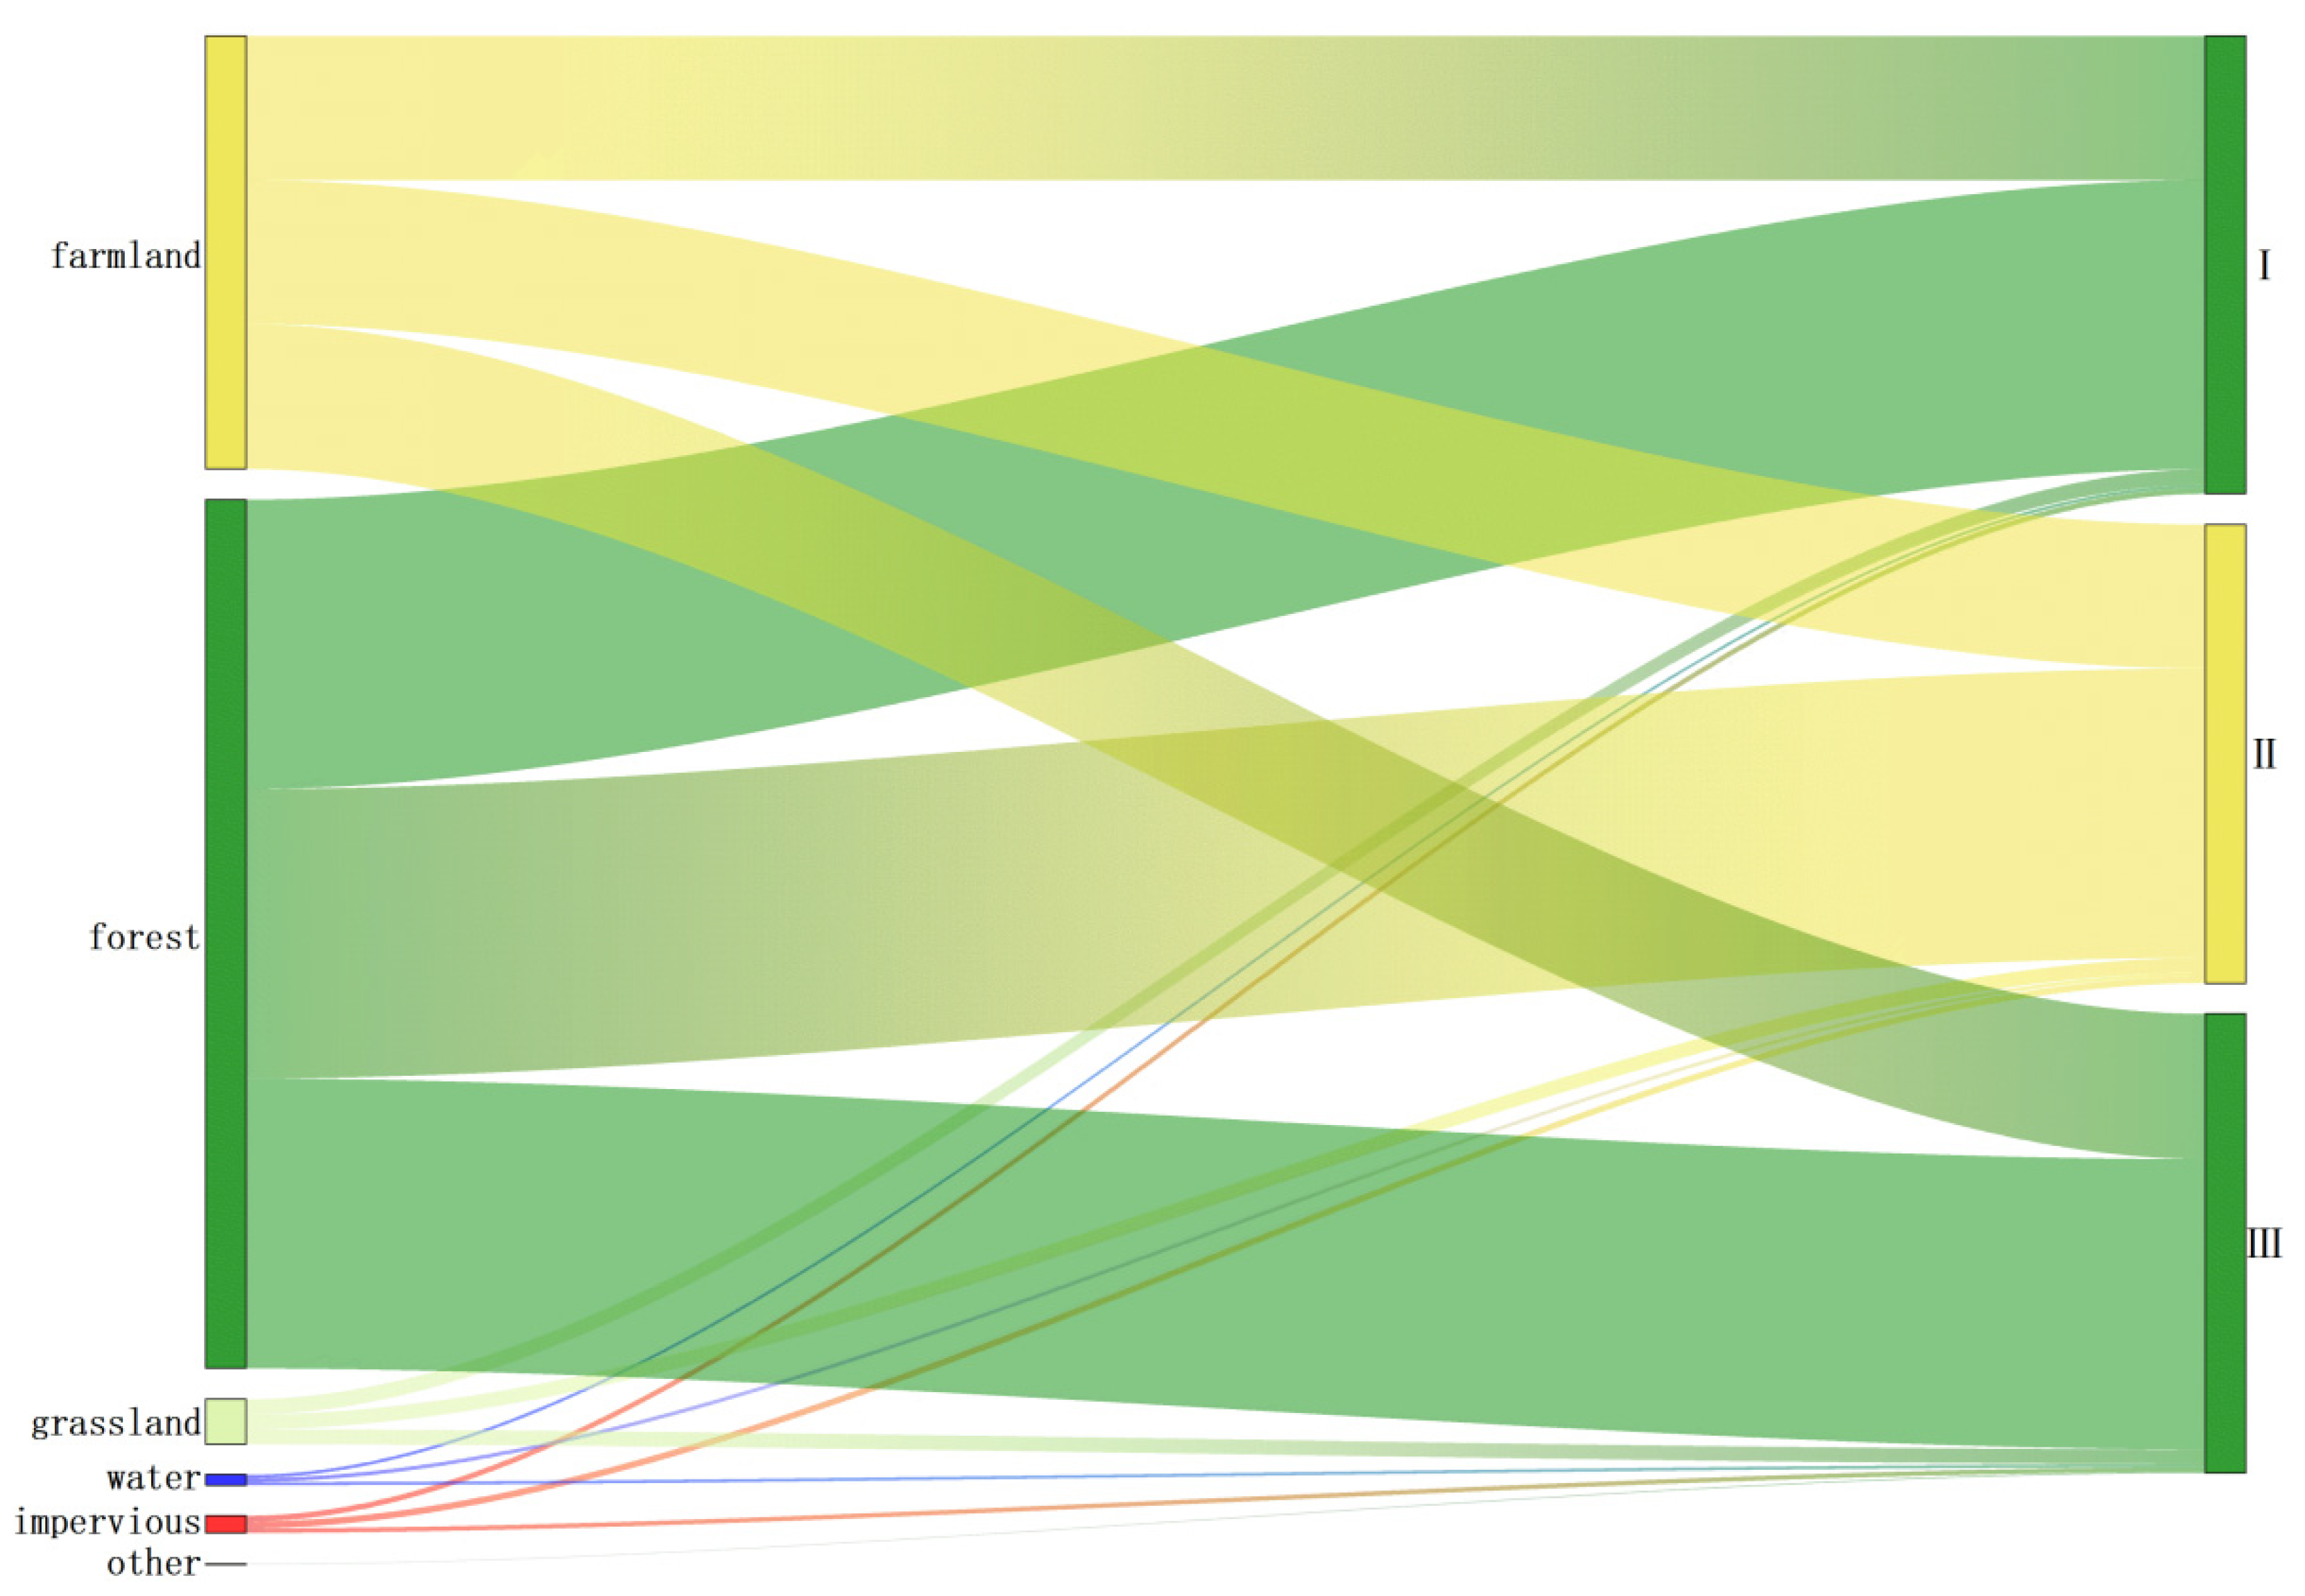
Based on the land use transition matrix, the changes in construction land and forestland are the most significant. The growth of construction land mainly comes from the conversion of forestland, cropland, and grassland, indicating that urban expansion has occupied large areas of surrounding cropland and forestland.
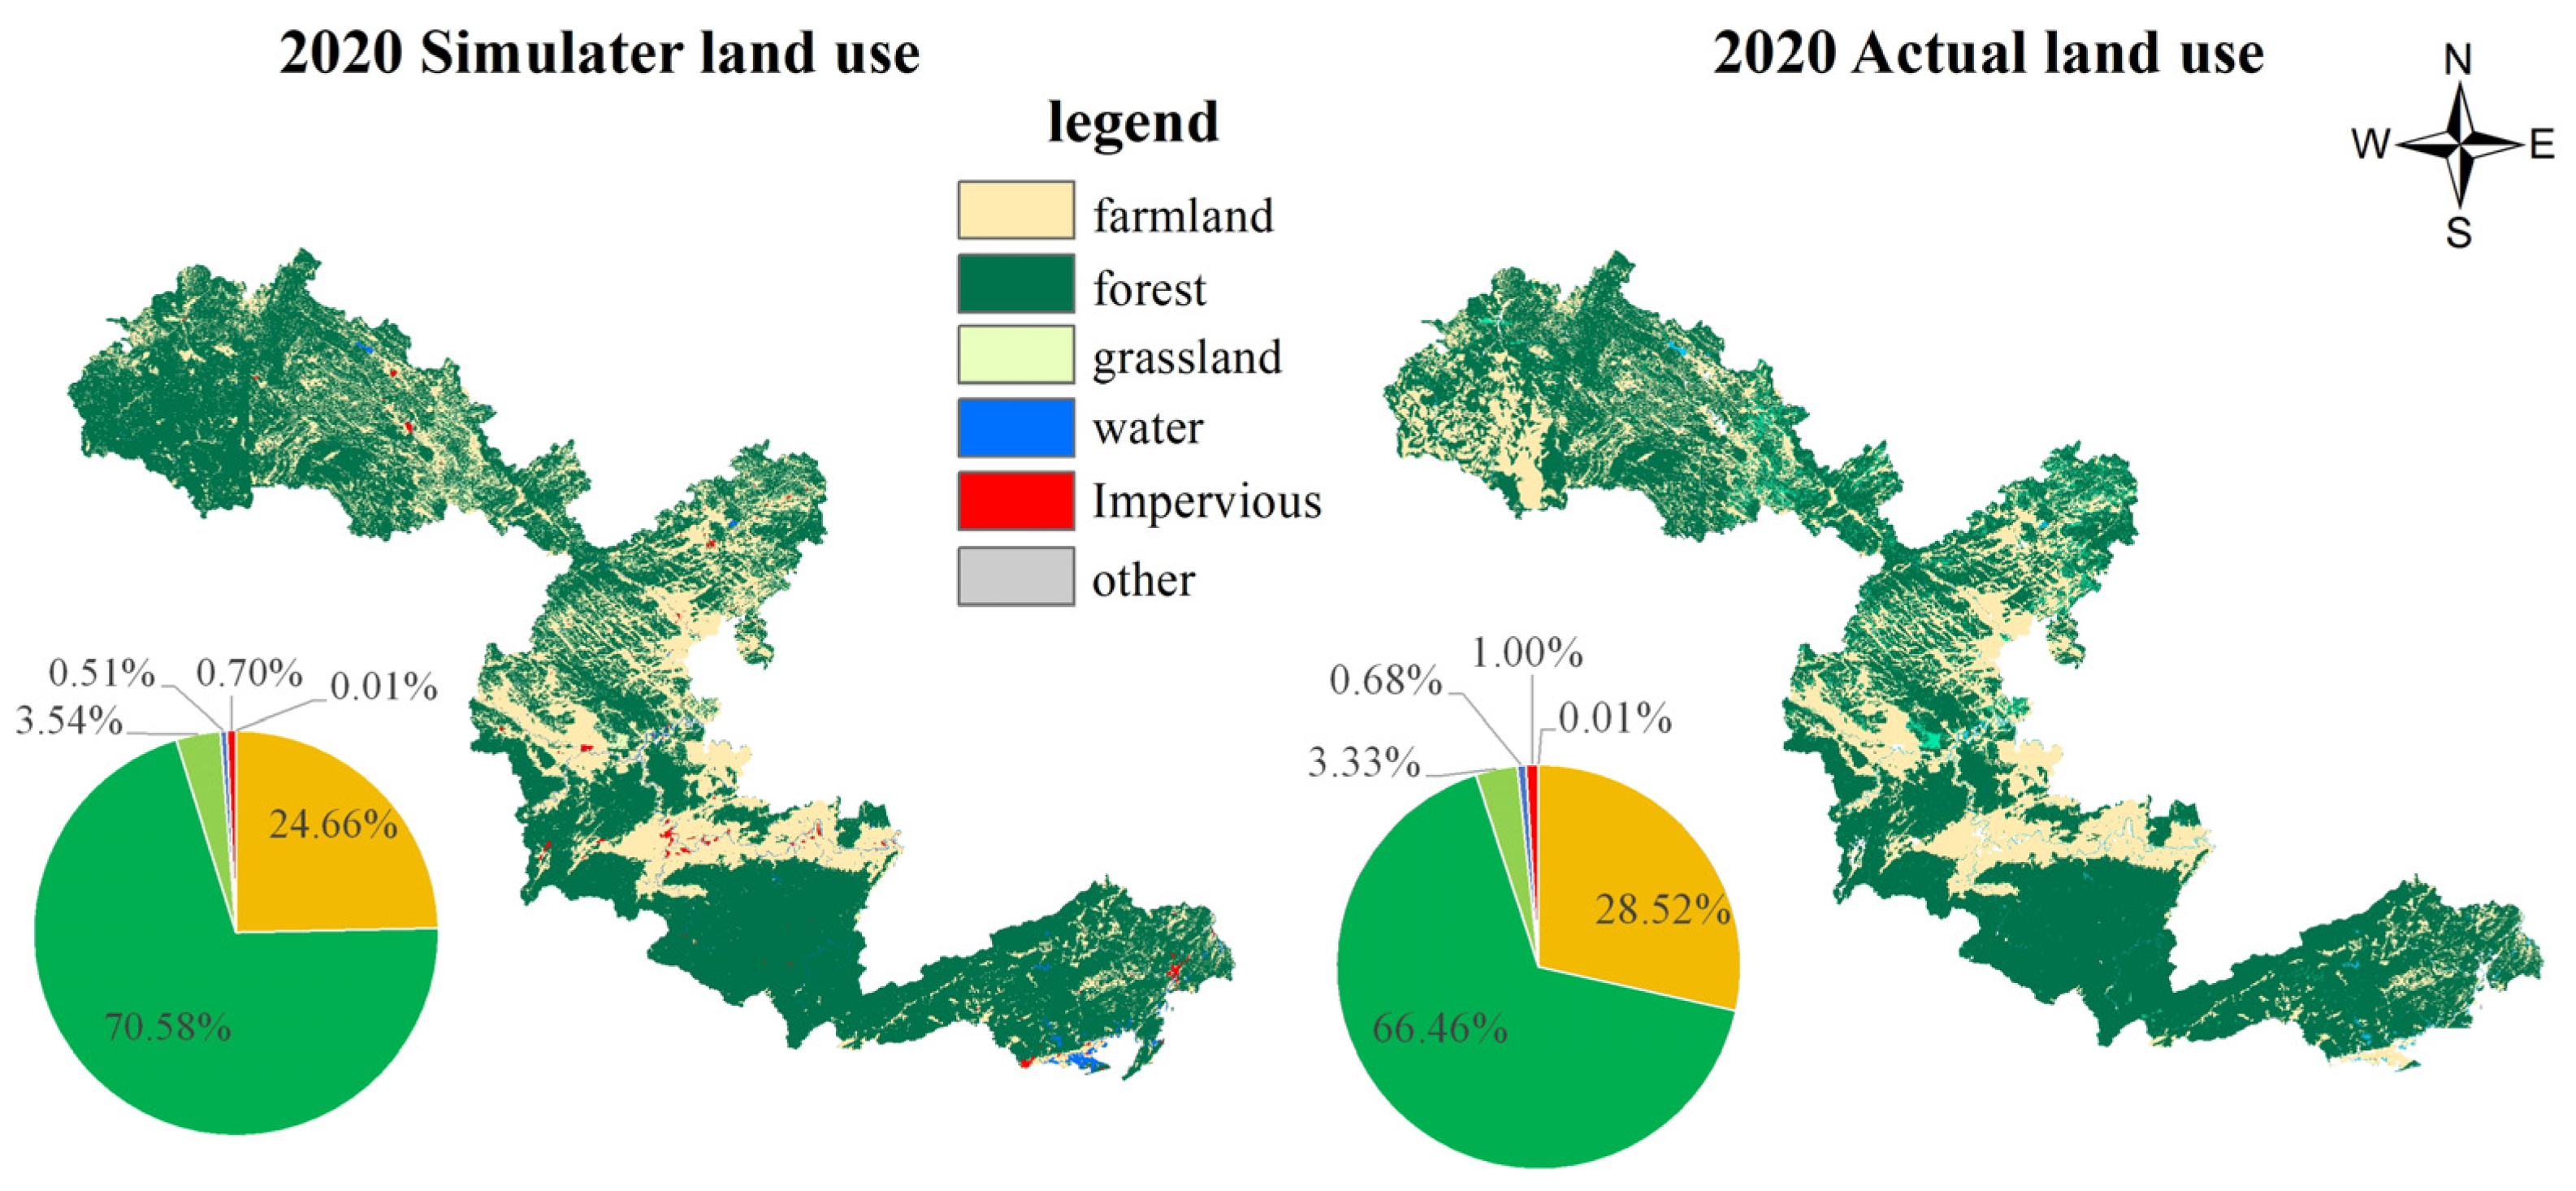
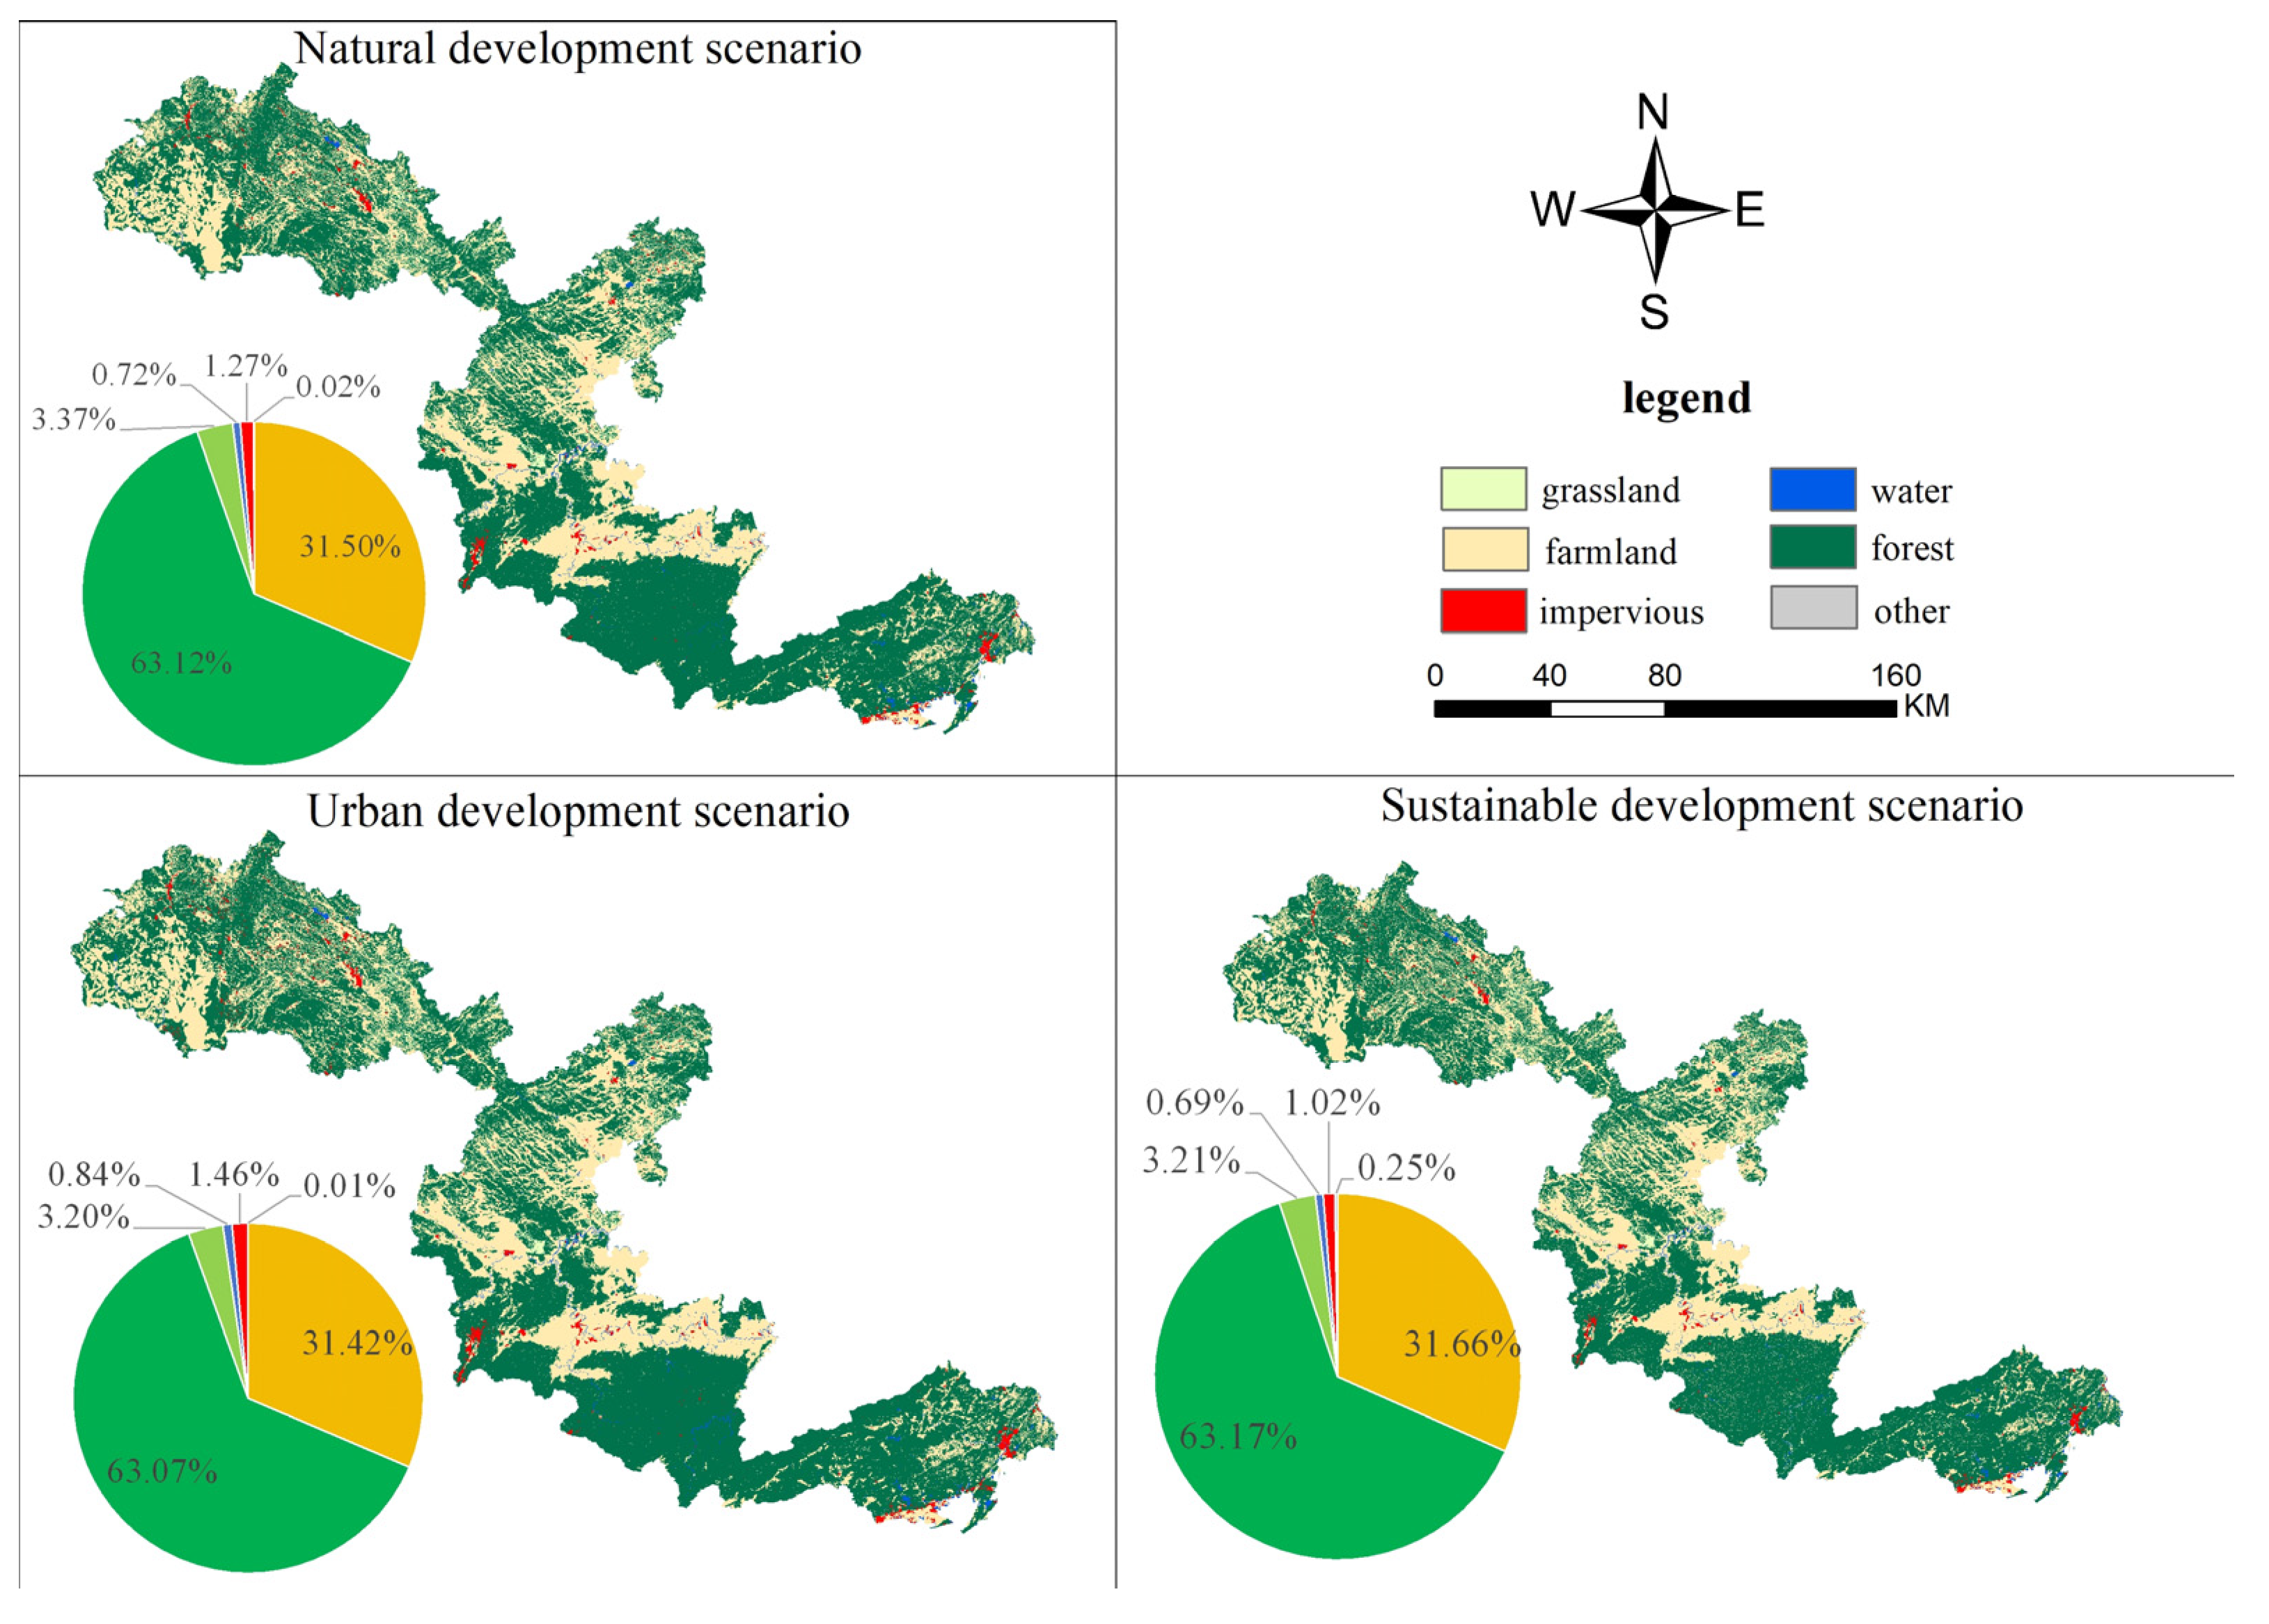
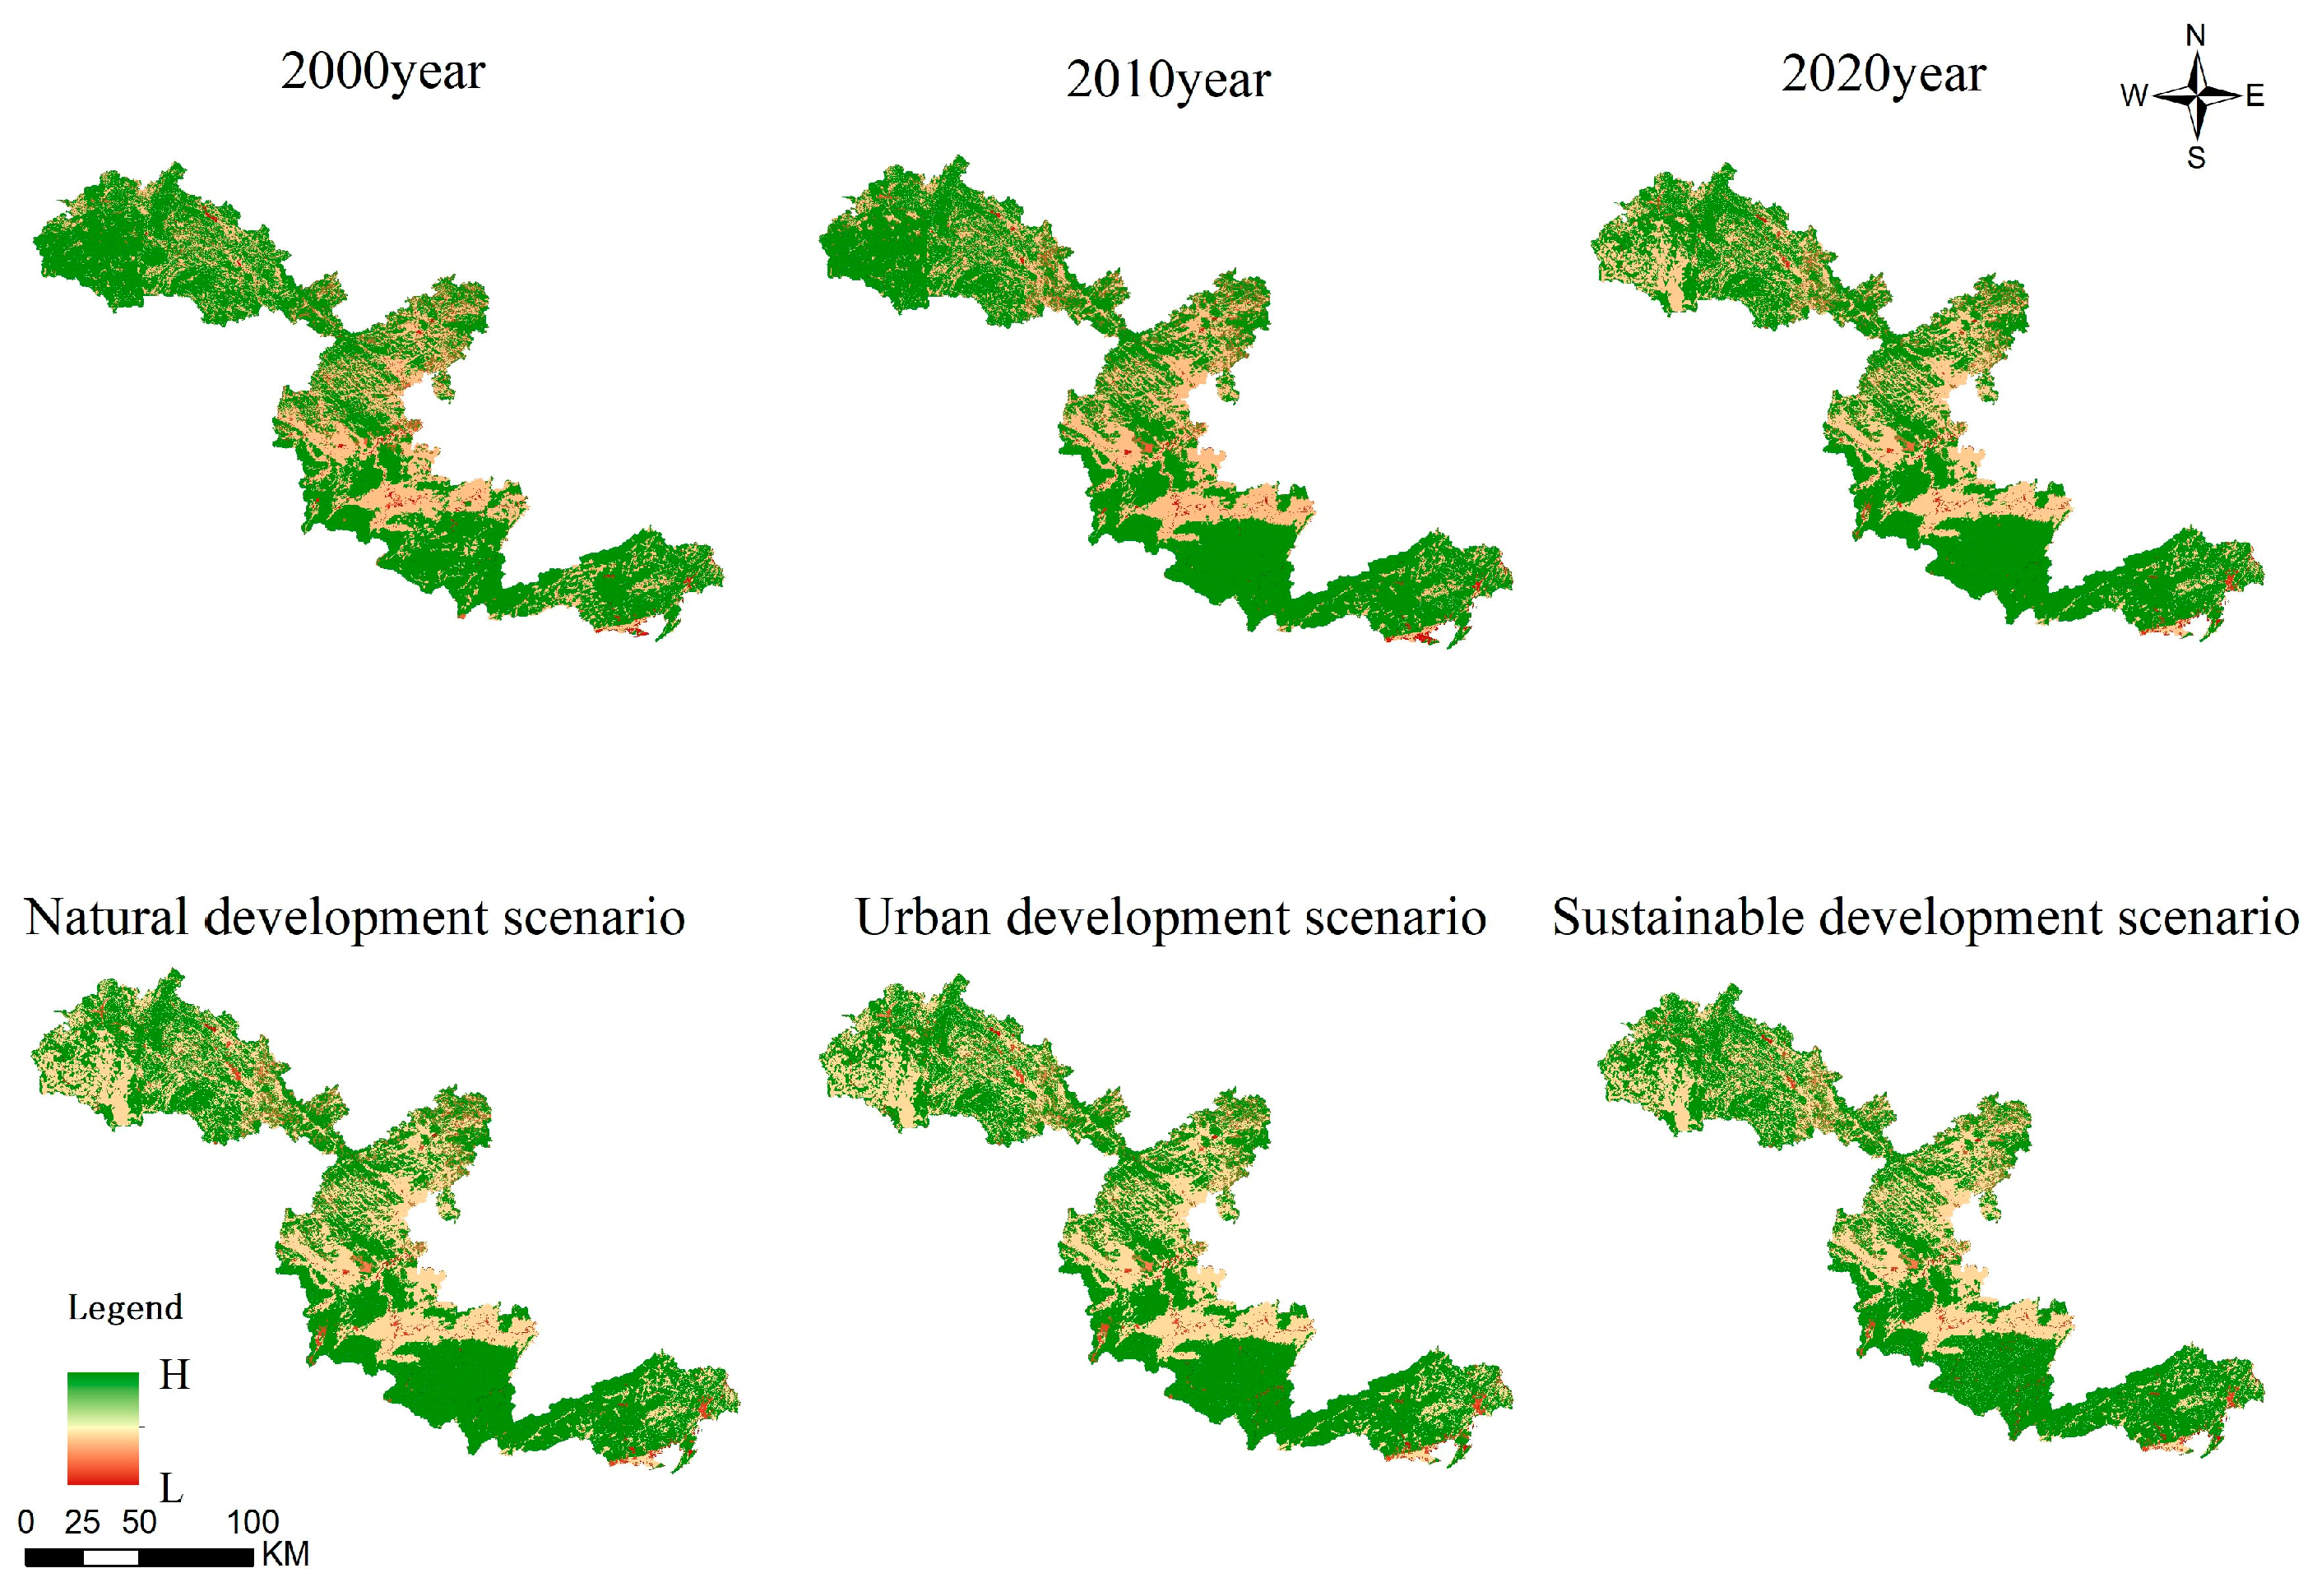
(2) Using 2020 land use data as a baseline, future land use in the Guangxi border region was simulated under three scenarios: natural development, urban development, and sustainable development [22].
Under the natural development scenario, compared to 2020, the area of construction land showed the most significant increase, rising by 4825.62 hectares. Forestland experienced the largest decline, decreasing by 59,402.88 hectares. Grassland, water areas, and other land types increased by 742.86 hectares, 727.11 hectares, and 6.12 hectares, respectively. This suggests that under this scenario, construction land continues to expand outward, occupying cropland and forestland in urban surrounding areas.
Under the urban development scenario, construction land expanded at the fastest rate, increasing by 8252.19 hectares, primarily concentrated in Napo County, Jingxi City, and Pingxiang City. Other land types showed minimal increases, while forestland and grassland experienced the largest declines, mainly in Napo County and Jingxi City. This indicates that under the urban development scenario, construction land expansion is driven by infrastructure projects such as road and residential construction, further reducing the area of non-construction land types.
Under the sustainable development scenario, the decline in forestland and grassland was more moderate, with forestland decreasing by 58,571.1 hectares and grassland by 2124.82 hectares. Construction land also showed a much slower growth, increasing by only 440.1 hectares. This indicates the reduced occupation of surrounding land types by construction land. Water areas remained relatively stable, maintaining similar levels to historical data, which is conducive to harmonious development between humans and nature. Notably, cropland increased the most, by 56,010.55 hectares, primarily in Daxin County, ensuring food production and promoting sustainable development.
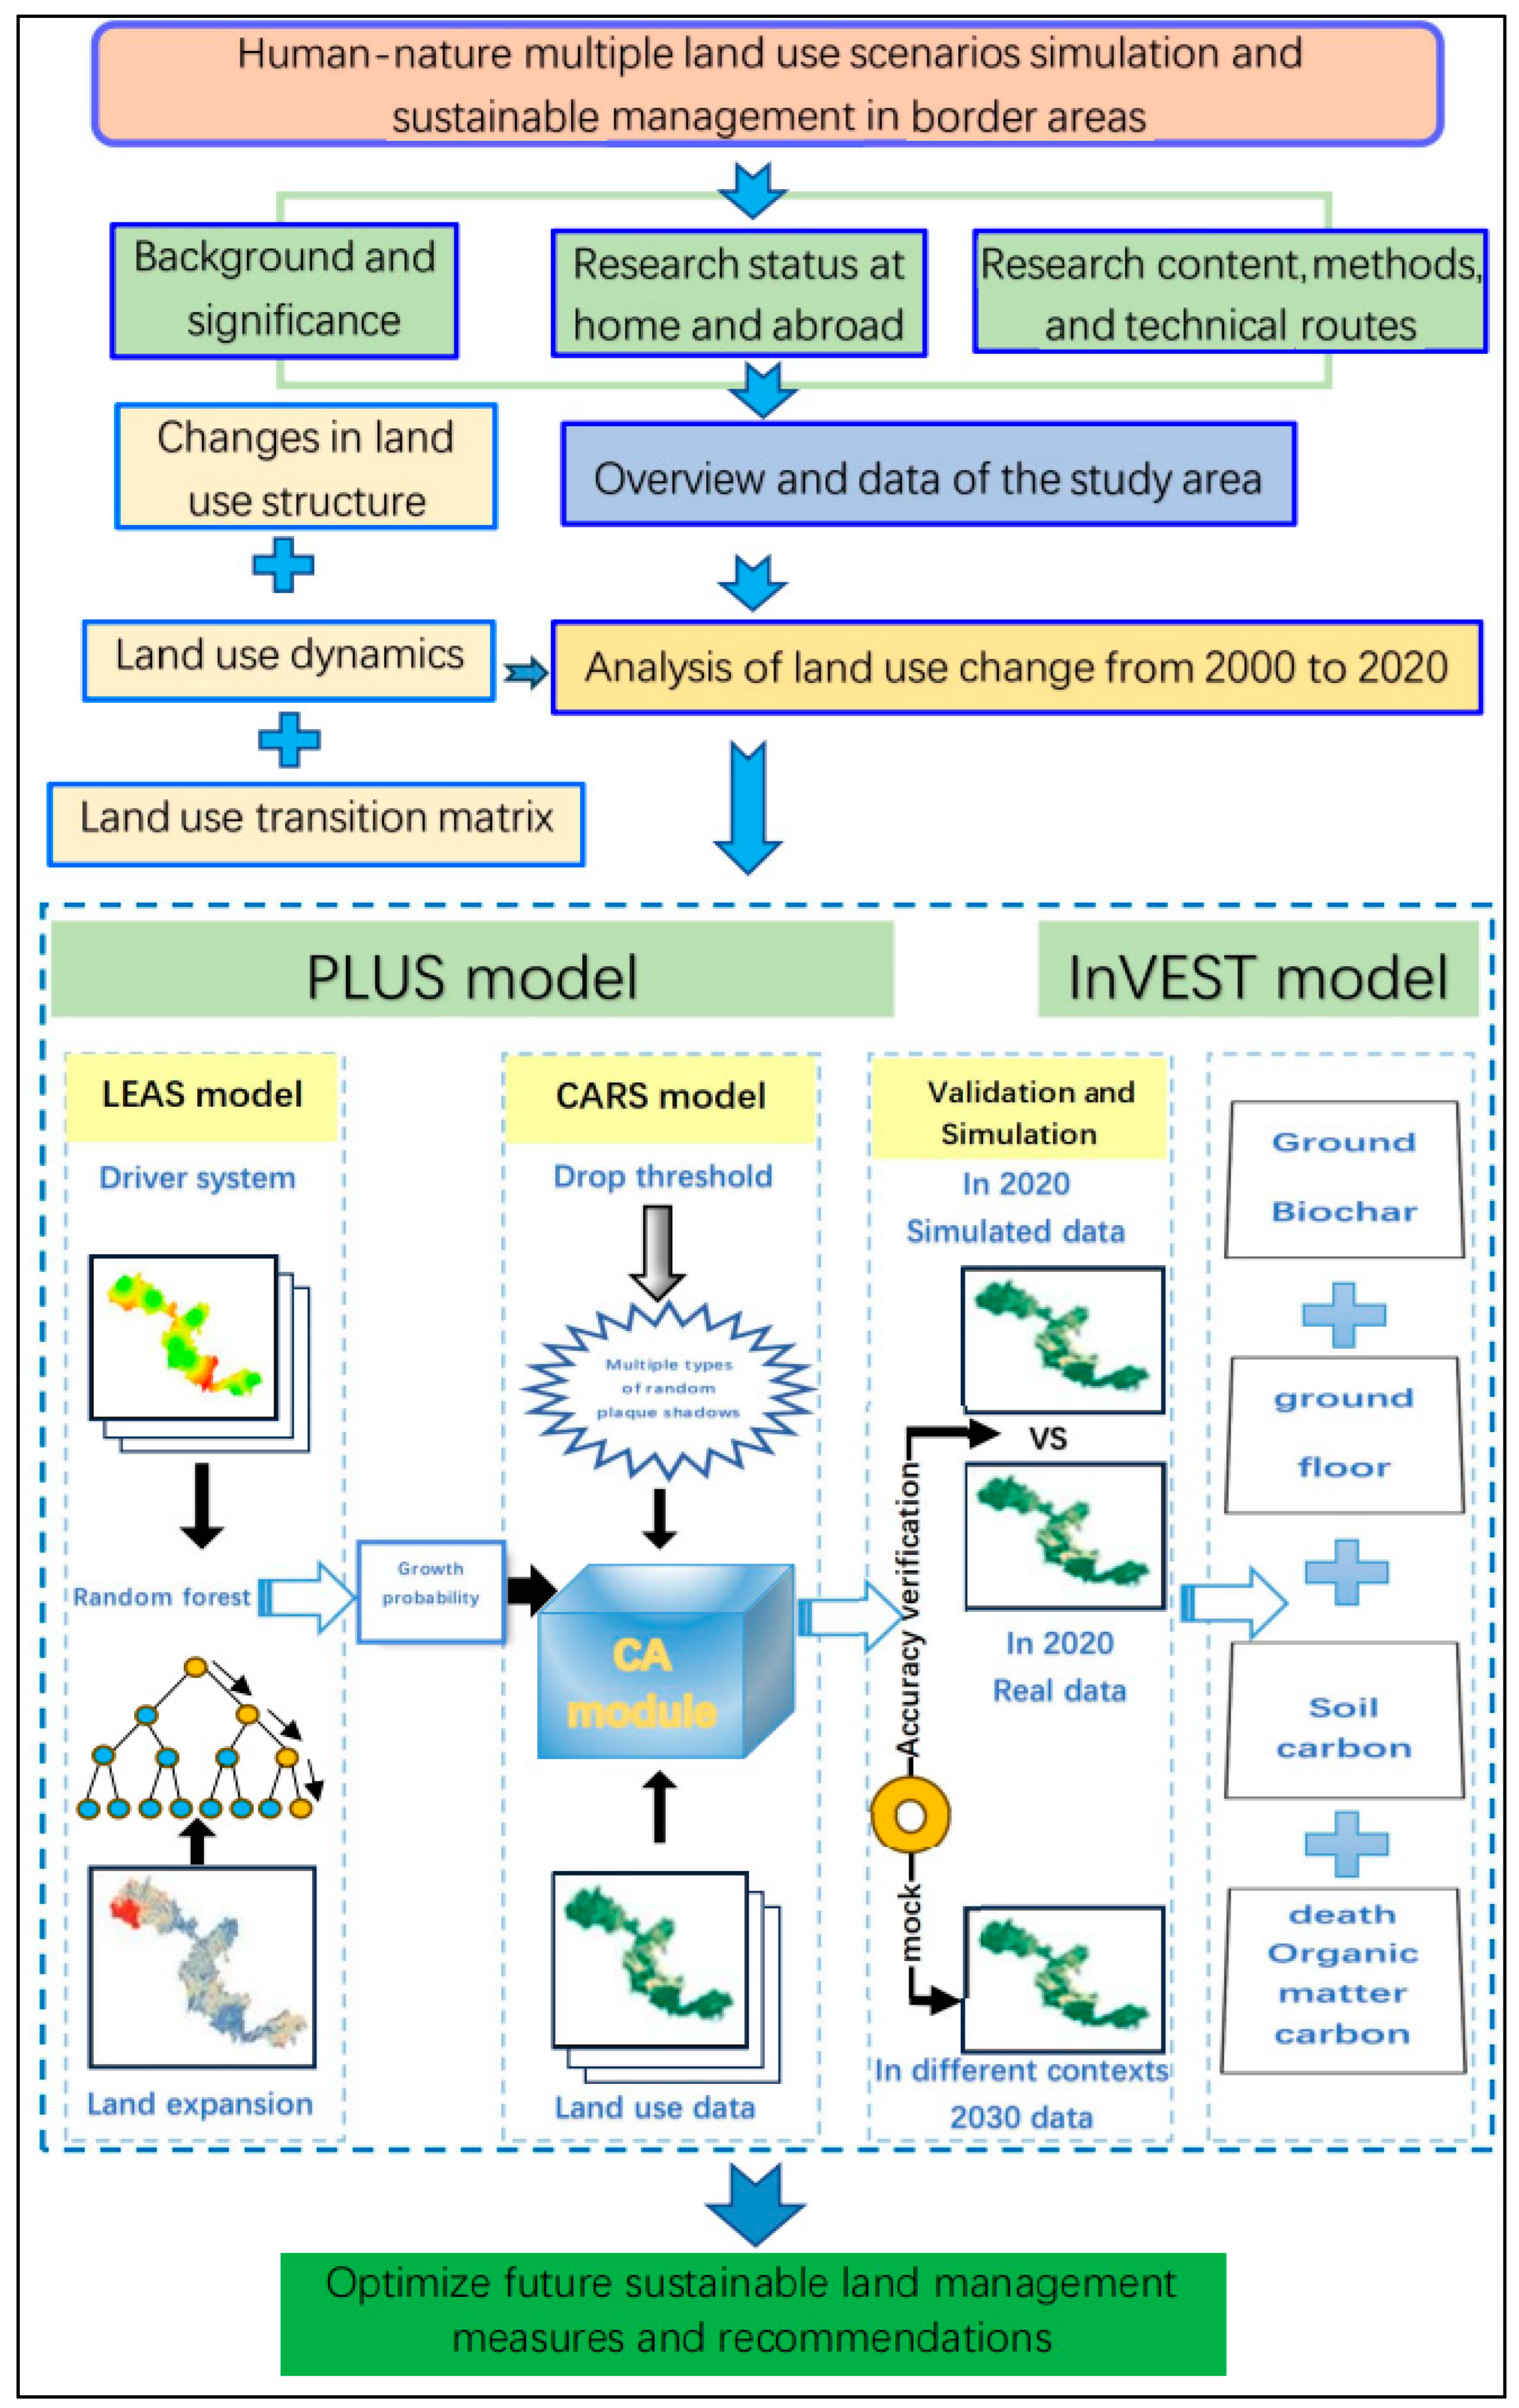
(3) Using the PLUS-InVEST model, carbon storage was predicted under the three scenarios: natural development, urban development, and sustainable development. From 2000 to 2020, ecosystem carbon storage in the border area declined annually, with an average annual reduction of 251,523.32 tons.
Under the natural development scenario, ecosystem carbon storage in the border area shows a gradual downward trend. According to InVEST model predictions, total carbon storage in 2030 is estimated at 252,477,986.16 tons, with an average annual decrease of 513,223.13 tons compared to 2020.
Under the urban development scenario, ecosystem carbon storage in 2030 is expected to decrease to 252,140,889.47 tons, with an average annual reduction of 5,469,327.95 tons. The continuous expansion of construction land in the border area leads to the significant occupation of cropland, forestland, and grassland, posing serious negative impacts on ecological balance, stability, and socio-economic development in the region.
Under the sustainable development scenario, ecosystem carbon storage in 2030 is projected to reach 252,608,075.03 tons, with an average annual decrease of 500,214.24 tons. The recovery of ecological carbon sinks shows a positive trend, albeit at a relatively slow rate, but the overall trend is improving. This plays a crucial role in achieving sustainable development and addressing climate change.
In future land resource planning, the border area should prioritize the sustainable development scenario, focusing on the protection and quality improvement of cropland resources while optimizing land use structures. This approach aims not only to ensure the sustainable utilization of cropland but also to enhance the carbon sink capacity of ecosystems. Such planning strategies will contribute to achieving the dual goals of sustainable land resource development and ecological environmental protection [23].

5.2. Insufficient

(1) In the PLUS model, the parameter setting of transfer matrix and domain factor has a crucial impact on the simulation effect. The parameters set in this paper are mainly based on the land use change transfer status of Guangxi border area from 2010 to 2020, combined with the study of a large number of relevant literature, and through calculation and repeated debugging and verification, they are highly subjective. Therefore, future research should pay more attention to the optimization and improvement of the model, and realize the adaptive adjustment of parameters, so as to obtain a better simulation effect.
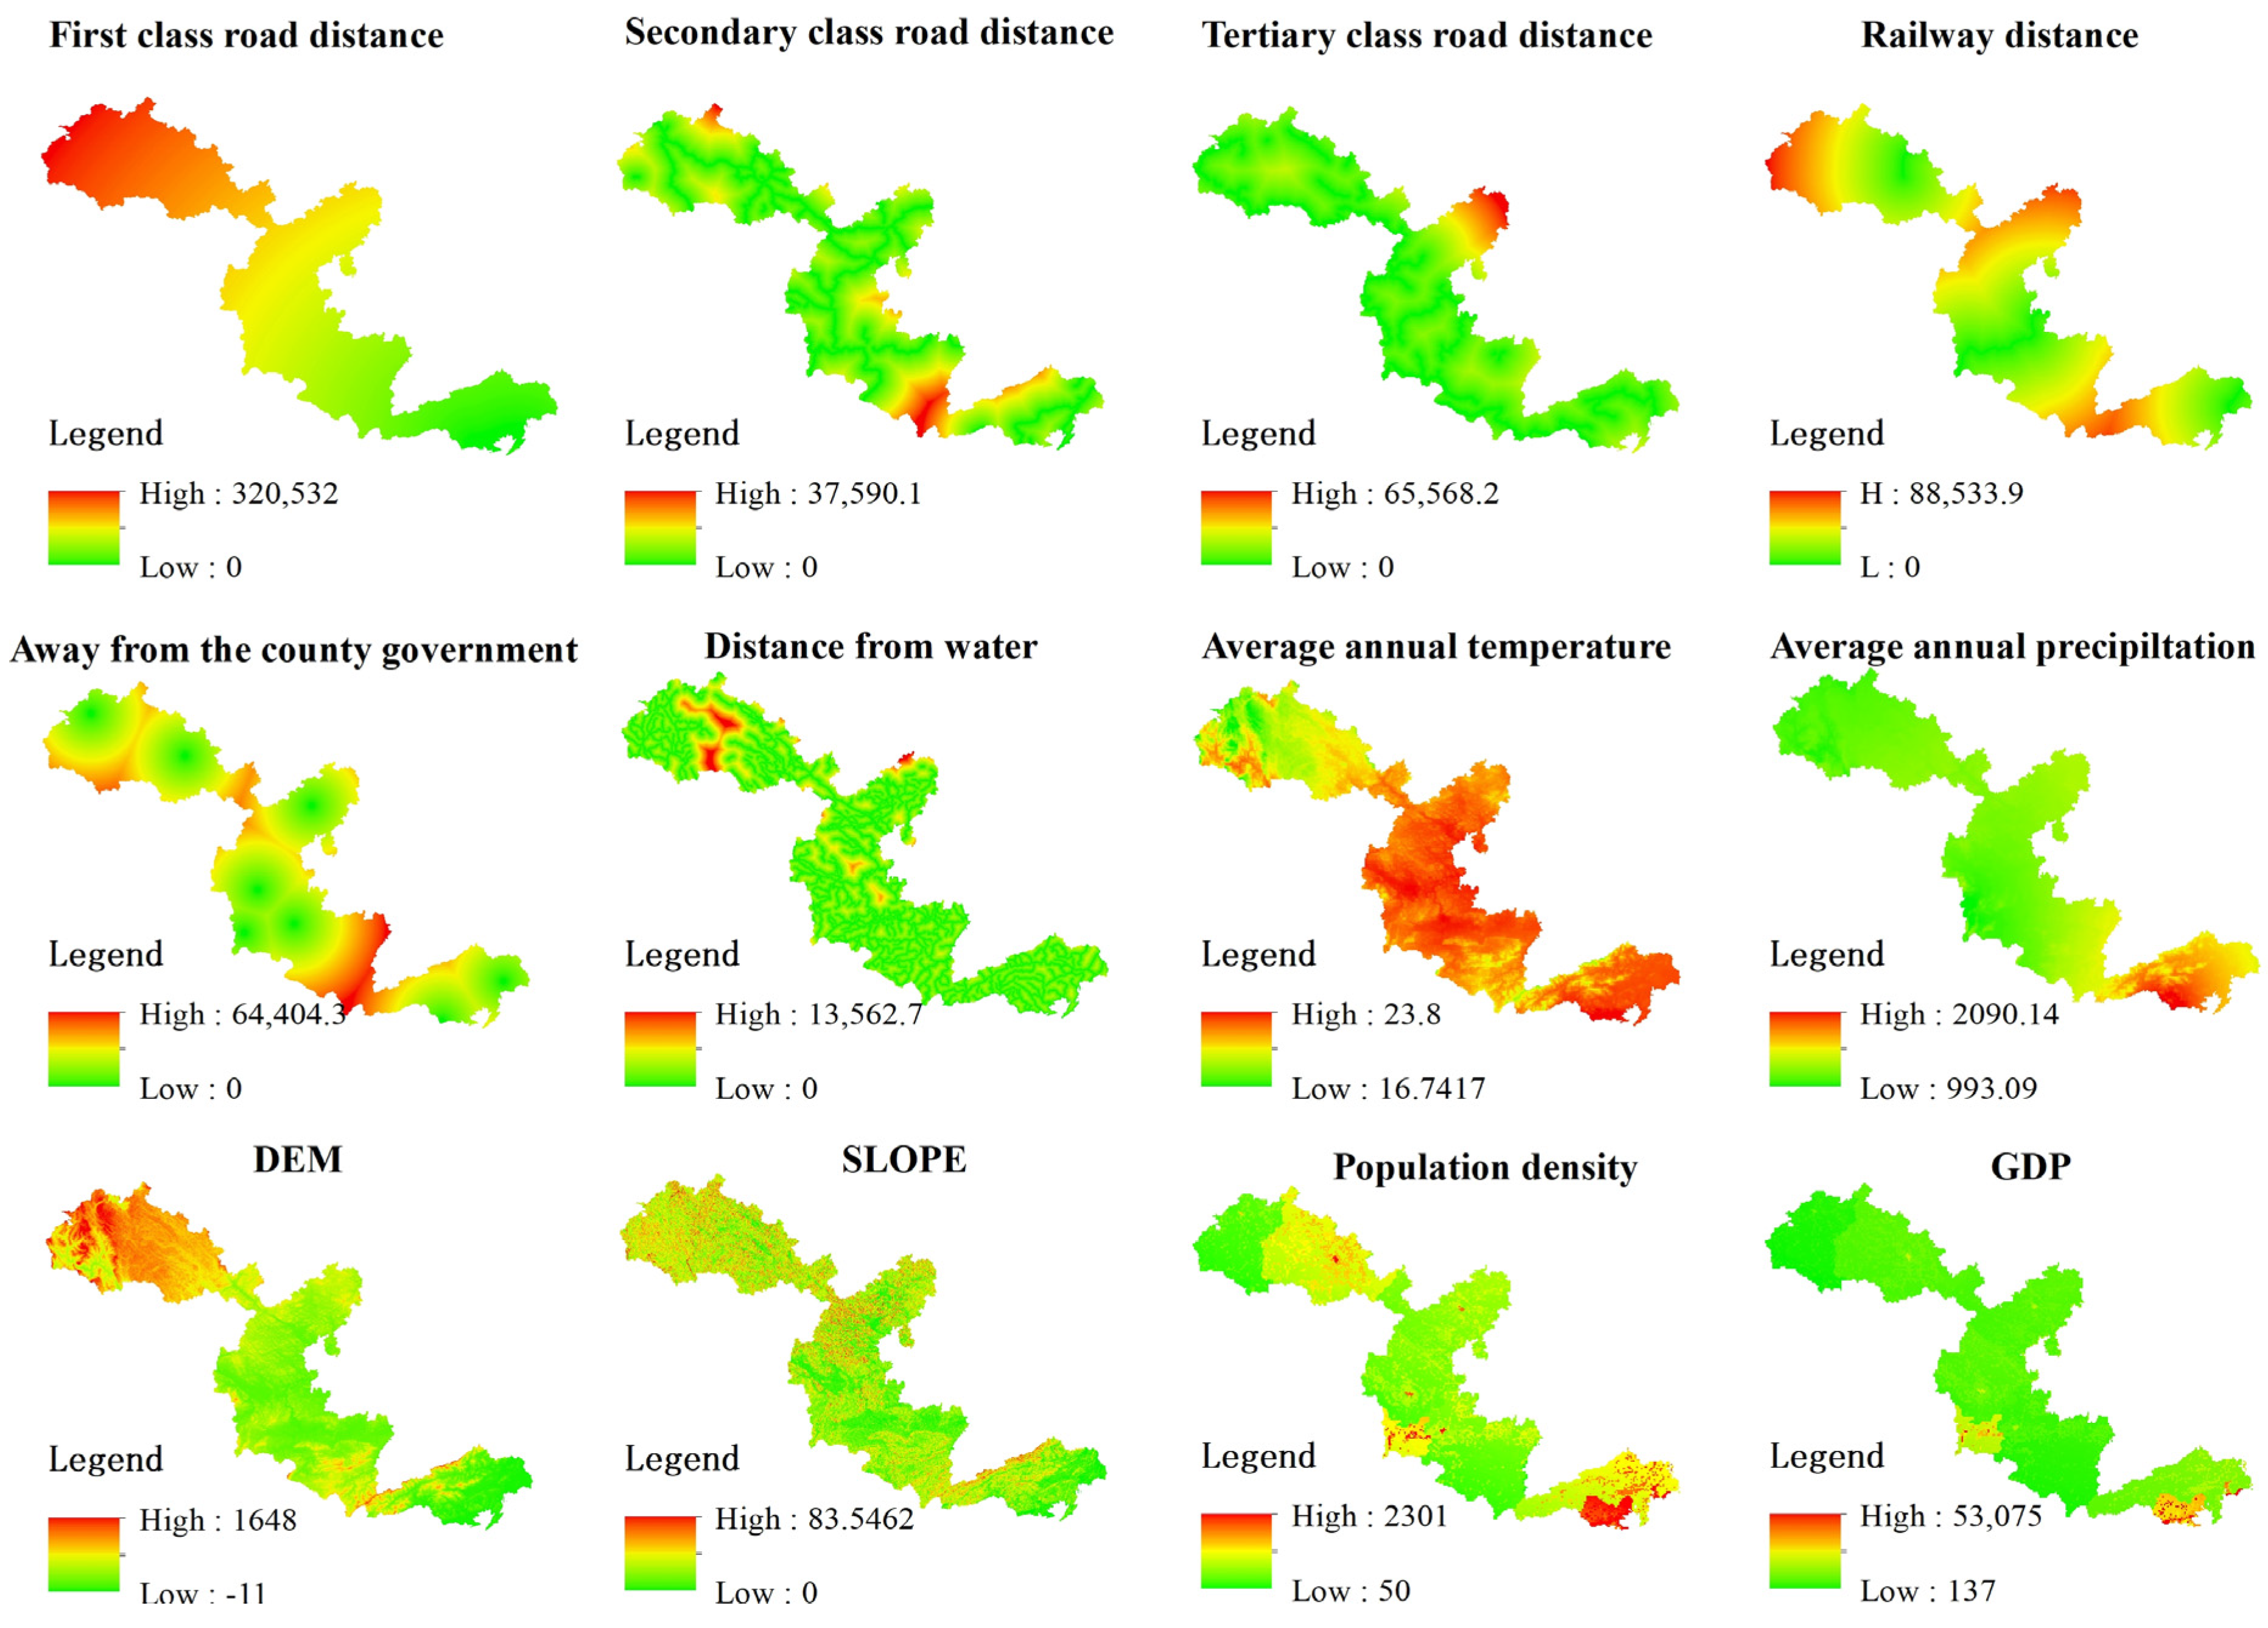
(2) Among the factors affecting land use change in a certain region, there are many complex and diversified driving factors. In order to have a more comprehensive and in-depth understanding of the role of driving factors, these factors should be selected and considered in a diversified way, which will not only help analyze and screen out the driving factors with significant influence, but also further improve the accuracy of the model and more accurately simulate the future land use pattern of the region. Although this paper has selected driving factors covering natural environmental factors, social and economic factors, and traffic network factors, due to the difficulty of obtaining some data, all relevant factors were not comprehensively considered. In future studies, it is necessary to further improve data collection and dig into other driving factors that may affect land use/cover change to achieve more comprehensive and accurate simulation and analysis.
(3) In the In VEST model, the carbon density data used in the present paper mainly rely on the reference of the past literature, and the data lack field sampling and measurement data as support. In addition, the carbon density of different land types will change dynamically with time, which is not fully considered in the model calculation. In the calculation process, the model often ignores the influence of vegetation growth and the internal structure of land use on carbon storage value, which will lead to errors in the spatio-temporal variation rule of carbon storage to a certain extent. Future studies should strengthen the exploration and application of new learning methods and combine field sampling and investigation to determine carbon density more accurately, along with Improving the accuracy and reliability of model prediction [24].

5.3. Measures and Suggestions

5.3.1. Give Priority to Ecological Coordination of Land Resources

To resolutely implement the strategy of giving priority to ecological development, regional land management must be guided by ecological functions, and every effort should be made to promote the comprehensive protection of the life community of “mountains, rivers, forests, fields, lakes and grasslands”. In the process of territorial space development, priority should be given to protecting the ecological security of nature reserves in Guangxi border areas. Strictly restricting or even prohibiting industrial development facilities and urban and rural construction activities in the ecological protection zone is essential. In addition, it is necessary to uphold the concept of a community of life of mountains, rivers, forests, fields, lakes, and grasslands, and fully implement integrated protection and restoration measures for mountains, rivers, forests, fields, lakes, grasslands, and sand to reduce conflicts and contradictions in the process of land use.
According to the results of the sustainable development scenario study, the increase in cultivated land area is the most prominent, and its wide distribution covers almost the entire study area, providing a strong guarantee for food production, and at the same time, woodland, grassland, and water are also protected. Under the ecological protection development mode, the land management and control mode should be adjusted according to the resource advantages of different regions. For areas with scarce water resources and lagging agricultural development, ecological environmental protection should be the primary task, focusing on the development of agriculture with local characteristics. Take Daxin County with abundant water resources as an example, it should make full use of its water resource advantages. By focusing on the development of sugarcane and high-quality rice industries, Ningming County, Napo County, and Jingxi City can use their terrain advantages to protect forest land and improve forest coverage rate, so as to achieve both ecological and economic benefits. Agricultural development in ecological development mode regions must be built on the basis of protecting ecological environment and ensuring sustainable development. Local governments should take full account of regional environmental advantages and climatic conditions, and on this basis vigorously develop agricultural products with local characteristics. At the same time, they should actively introduce advanced farming technologies suitable for local conditions and carry out targeted practical technical training to change traditional farming methods, so as to effectively improve the quality and output of agricultural products. In addition, local governments should continue to optimize food varieties, carefully cultivate characteristic industries, and ensure steady growth of farmers’ economic income. When tapping agricultural potential, they must pay attention to the choice of development methods, resolutely avoid damage to the ecological environment, and prioritize the healthy and sustainable use of agricultural resources through active development of ecological agriculture to realize the harmonious coexistence of ecology and economy [25].

5.3.2. Strictly Observe Red Line of Cultivated Land in Border Areas

The border areas of Guangxi, especially the cultivated land resources in the border areas, need to implement strict control measures to maintain the stability and security of the border land. In view of the situation of farmland occupied by various non-agricultural construction, strict control and scientific guidance must be adopted, and the compensation system for farmland occupied by non-agricultural construction must be resolutely implemented. In the process of promoting the protection of cultivated land, we should adhere to planning as the core orientation to effectively ensure the stability of the quantity and quality of permanent basic farmland; in the preparation and implementation of territorial spatial planning, we must strictly control the occupation of cultivated land from the source of construction activities and resolutely implement the principle of “balance of occupation and compensation, quality priority”, to ensure that the importance of cultivated land protection will not be lost. At the same time, in order to consolidate the food security foundation for stable economic development, including promoting land consolidation, reclamation, and soil pollution control measures, the aim must be to improve the quality of cultivated land and enhance the reserve of cultivated land resources, thereby enhancing ecological benefits and providing strong support for sustainable development. In the process of urban development, if it is necessary to increase construction land, it should avoid occupying the designated basic farmland as far as possible to ensure food security and the sustainability of agricultural production.

5.3.3. Control the Total Amount of Construction Land and Improve the Utilization Rate of Construction Land

In order to effectively control the total amount of construction land and revitalize the stock of construction land in rural and urban areas, efforts must be made to improve the level of economical and intensive use of land. According to the in-depth analysis of the forecast results of the urban development scenario in 2030, it is found that with the continuous expansion of construction land, other types of land, especially agricultural land and ecological land, will inevitably be occupied. In order to effectively alleviate the problem, it is necessary to optimize and adjust the land use structure and layout of the stock construction land to improve the utilization efficiency of space resources. By guiding the construction development direction of the stock space and deeply tapping the space resource potential of the construction land, the efficient and intensive utilization of construction land resources can be promoted, so as to realize the sustainable utilization and development of land resources. At the same time, in the process of promoting urban construction, the government must attach great importance to the planning and layout of green infrastructure and the realization of efficient use of land resources and enhance the carbon sink function of the ecosystem in the aspects of improving forest coverage rate, vigorously promoting green travel, energy saving, environmental protection building materials, etc., so as to achieve the national goal of “carbon neutrality”. It is of great practical significance to promote sustainable development [26].

Author Contributions

Conceptualization, Z.W. and L.L.; methodology, D.L.; software, Q.W.; validation, Z.W. and Z.W.; formal analysis, Z.W.; investigation, Z.W.; resources, L.L.; data curation, L.L.; writing—original draft preparation, Q.W.; writing—review and editing, D.L.; visualization, Z.W.; supervision, Z.W.; project administration, Z.W.; funding acquisition, L.L. All authors have read and agreed to the published version of the manuscript.

Funding

Spatial–Temporal Coupling Mechanism of Border Welfare Ecology and Livelihood Transformation from the Perspective of Ecological Civilization (72364001) (National Natural Science Foundation); Evaluation of Ecological Effects of Land Use Change in Karst Area of Guangxi and Study on Spatiotemporal Dynamic Security, 2018KY0522, Guangxi Department of Education; and Study on the Coupling Mechanism between Ecology and Farmers’ Livelihood in China-Vietnam Border Region (2024XKA03).

Institutional Review Board Statement

Not applicable.

Informed Consent Statement

Not applicable.

Data Availability Statement

No new data were created or analyzed in this study. Data sharing is not applicable to this article.

Conflicts of Interest

The authors declare no conflict of interest.

References

  1. Liu, J.; Zhang, Z.; Zhuang, D. Spatiotemporal characteristics and causes of land use change in China in the 1990s. J. Geogr. Sci. 2003, 13, 1–12. [Google Scholar]
  2. Huang, Q.; Shi, P.; He, C. Simulation of land use change under future drought scenario in northern China. Acta Geogr. Sin. 2006, 61, 1299–1310. [Google Scholar]
  3. Xiao, C. Evaluation of Ecosystem Service Value Based on Land Use Change Simulation. Ph.D. Thesis, Southeast University, Nanjing, China, 2021. [Google Scholar] [CrossRef]
  4. Zhao, X. Analysis of the Interaction between Urban Man—Land Relationship and Sustainable Development. Urban Dev. Stud. 2019, 26, 56–62. [Google Scholar]
  5. Jiang, L. Effects of Land Use and Cover Change on Runoff in Wuyuer River Basin. Master’s Thesis, Harbin Normal University, Harbin, China, 2015. [Google Scholar]
  6. Chen, B.; Zhang, F. Theory and method of index system of sustainable land use in China. J. Nat. Resour. 2001, 16, 197–203. [Google Scholar]
  7. Wang, D.; Hu, K.; Ma, P. Analysis of land use/cover change and its driving force in Shuangtai Hekou Nature Reserve during 30 years. Res. Oceanogr. 2015, 33, 51–61. [Google Scholar]
  8. Zhang, L.; Li, J. Identifying priority areas for biodiversity conservation based on Marxan and InVEST mode. Landsc. Ecol. 2022, 37, 3043–3058. [Google Scholar] [CrossRef]
  9. Wang, Y.; Li, X.; Zhang, Q.; Li, J.; Zhou, X. Projections of future land use changes: Multiple scenarios—based impacts analysis on ecosystem services for Wuhan city, China. Ecol. Indic. 2018, 94, 430–445. [Google Scholar] [CrossRef]
  10. Veldkamp, A.; Fresco, L. CLUE—CR: An integrated multi—scale model to simulate land use change scenarios in Costa Rica. Ecol. Model. 1996, 91, 231–248. [Google Scholar] [CrossRef]
  11. Furumo, R.P.; Aide, M.T. Characterizing commercial oil palm expansion in Latin America: Land use change and trade. Environ. Res. Lett. 2017, 12, 024008. [Google Scholar] [CrossRef]
  12. van Marle, M.J.E.; Field, R.D.; van der Werf, G.R.; de Wagt, I.A.E.; Houghton, R.A.; Rizzo, L.V.; Artaxo, P.; Tsigaridis, K. Fire and deforestation dynamics in Amazonia (1973–2014). Glob. Biogeochem. Cycles 2017, 31, 24–38. [Google Scholar] [CrossRef] [PubMed]
  13. Arvor, D.; Tritsch, I.; Barcellos, C.; Jégou, N.; Dubreuil, V. Land use sustainability on the South—Eastern Amazon agricultural frontier: Recent progress and the challenges ahead. Appl. Geogr. 2017, 80, 86–97. [Google Scholar] [CrossRef]
  14. Wang, Z.; Gao, Y.; Wang, X.; Lin, Q.; Li, L. A new approach to land use optimization and simulation considering urban development sustainability: A case study of Bortala, China. Sustain. Cities Soc. 2022, 87, 104135. [Google Scholar] [CrossRef]
  15. Liu, X.; Liang, X.; Li, X.; Xu, X.; Ou, J.; Chen, Y.; Li, S.; Wang, S.; Pei, F. A future land use simulation model (FLUS) for simulating multiple land use scenarios by coupling human and natural effects. Landsc. Urban Plan. 2017, 168, 94–116. [Google Scholar] [CrossRef]
  16. Du, L.; Dong, C.; Kang, X.; Qian, X.; Gu, L. Spatiotemporal evolution of land cover changes and landscape ecological risk assessment in the Yellow River Basin, 2015–2020. J. Environ. Manag. 2023, 332, 117149. [Google Scholar] [CrossRef] [PubMed]
  17. García-Ontiyuelo, M.; Acuña-Alonso, C.; Valero, E.; Álvarez, X. Geospatial mapping of carbon estimates for forested areas using the InVEST model and Sentinel—2: A case study in Galicia (NW Spain). Sci. Total Environ. 2024, 922, 171297. [Google Scholar] [CrossRef] [PubMed]
  18. Wang, C.; Luo, J.; Qing, F.; Tang, Y.; Wang, Y. Analysis of the Driving Force of Spatial and Temporal Differentiation of Carbon Storage in Taihang Mountains Based on InVEST Model. Appl. Sci. 2022, 12, 10662. [Google Scholar] [CrossRef]
  19. Jing, L.; Jin, R.; Wang, J.; Zhang, P.; Zhu, W. Driving factors analysis and future prediction of cultivated land based on PLUS: A case study of Tumen River Basin. Bull. Soil Water Conserv. 2019, 39, 203–212. [Google Scholar]
  20. Lu, J. Research on Optimal Allocation of Land Use in Guangxi Border Area Based on Grey Linear Programming and FLUS Model. Master’s Thesis, Nanning Normal University, Nanning, China, 2019. [Google Scholar]
  21. Yuan, X. Scenario Simulation of Land Use Change and Landscape Ecological Risk in Wuhan Based on PLUS Model. Master’s Thesis, Donghua University of Science and Technology, Shanghai, China, 2022. [Google Scholar] [CrossRef]
  22. Wu, P.; Liu, X.; Li, X. Impact assessment of urban expansion on terrestrial ecosystem carbon storage based on InVEST model and cellular automata: A case study of Guangdong Province. Geomat. Inf. Sci. Wuhan Univ. 2016, 32, 22–28, 36. [Google Scholar]
  23. Rong, J. Study on Water Production and Carbon Sequestration Service Functions of Xijiang River Basin Ecosystem Based on InVEST Model in Guangxi. Master’s Thesis, Guangxi Normal University, Guilin, China, 2017. [Google Scholar]
  24. Huang, Y. A Study of Land Use Change and Scenario Simulation of Youyang County Based on CA—Markov Model. Master’s Thesis, Southwest University, Chongqing, China, 2013. [Google Scholar]
  25. Li, M. Research on Ecosystem Service Function Evaluation Based on InVEST Model. Master’s Thesis, Beijing Forestry University, Beijing, China, 2016. [Google Scholar]
  26. Chen, Z.; Liu, X. Spatiotemporal change of carbon storage and multi—scenario simulation prediction based on InVEST—PLUS model: A case study of Jiangxi Province. Shanghai Land Resour. 2019, 40, 146–153. [Google Scholar]
Figure 1. Grid map of each land use driving factor in border area.
Sustainability 17 01695 g001
Figure 2. Comparison of land use simulation and current situation in border areas.
Sustainability 17 01695 g002
Figure 3. Technology roadmap.
Sustainability 17 01695 g003
Figure 4. Schematic diagram of Guangxi border area.
Sustainability 17 01695 g004
Figure 5. Spatial distribution map of border land use types in Guangxi in Phase III.
Sustainability 17 01695 g005
Figure 6. Dynamic attitude of land use in border areas of Guangxi.
Sustainability 17 01695 g006
Figure 7. Simulation map of land use types in Guangxi border areas under multi-scenario development.
Sustainability 17 01695 g007
Figure 8. Area changes in land use types in border areas under different scenarios.
Sustainability 17 01695 g008
Figure 9. Carbon storage ratio of land use types in border areas from 2000 to 2020.
Sustainability 17 01695 g009
Figure 10. Spatial distribution of carbon stocks in border areas from 2000 to 2030.
Sustainability 17 01695 g010
Table 1. Borderland land use drivers and implications.
Data TypeDriving FactorDescription
Natural environment dataElevation (DEM)The elevation value of each grid
slopeThe slope value of each grid
Distance from waterThe distance of each grid center from the nearest body of water
Average annual temperatureAverage annual temperature of each grid
Average annual precipitationAverage annual precipitation for each grid
Soil typeSoil type for each grid
Socio-economic dataPopulation densityPopulation density of each grid
GDPGDP of each grid
Distance from county governmentThe distance of each grid center from the nearest county government
Traffic network dataDistance from railwayThe distance between the center of each grid and the nearest railway
Distance from grade 1 roadThe distance between the center of each grid and the nearest grade 1 road
Distance from secondary roadsThe distance of each grid center from the nearest secondary road
Distance from grade 3 roadsThe distance between the center of each grid and the nearest three-level road
Table 2. Kappa coefficient accuracy classifications.
KappaAccuracy Level
Kappa ≤ 0.4Low precision
0.4 < Kappa ≤ 0.75Medium precision
Kappa > 0.75High precision
Table 3. Carbon density of land use types in study area (t/hm2).
Land Use TypeAbove-Ground Carbon DensitySubsurface Carbon DensitySoil Carbon DensityCarbon Density of Dead Organic Matter
plowland13.57 2.56 75.52 1.00
woodland58.30 14.58 97.50 3.50
meadow3.01 13.53 46.50 1.00
waters2.80 2.40 0.00 0.00
construction land11.45 0.93 34.33 0.00
other land3.40 0.00 22.63 0.00
Table 4. Table of data classifications and sources.
SortDataData Source
Land use dataLand use classification data for border areas in 2000GlobeLand30 (global geographic information public goods)
Land use classification data for border areas in 2010GlobeLand30 (global geographic information public goods)
Land use classification data in border areas in 2020GlobeLand30 (global geographic information public goods)
Natural environment dataElevation (DEM)Geospatial data cloud
slopeBased on DEM data extraction
Distance from waterNational geographic information resources directory service system
Average annual temperatureNational Tibetan Plateau Scientific Data Center
Average annual precipitationNational Earth System Science Data Center
Soil typeResource Environmental Science and Data Center
Socio-economic dataPopulation densityResource Environmental Science and Data Center
GDPResource Environmental Science and Data Center
Distance from county governmentNational geographic information resources directory service system
Traffic network dataDistance from grade 1 roadNational geographic information resources directory service system
Distance from secondary roadNational geographic information resources directory service system
Distance to tertiary roadNational geographic information resources directory service system
Distance to railwayNational geographic information resources directory service system
Table 5. Area and proportion of land use types in Guangxi border areas.
Land TypeThe Year 2000The Year 2010The Year 2020
Area/hm2RatioArea/hm2RatioArea/hm2Ratio
plowland457,491.8725.68%445,907.5225.03%508,046.428.52%
woodland1,242,985.5969.78%1,250,762.4970.22%1,183,904.9166.46%
meadow57,110.223.21%62,658.813.52%59,355.453.33%
waters15,259.860.86%13,902.30.78%12,141.630.68%
construction land8064.540.45%7866.990.44%17,741.251.00%
other land397.620.02%80.010.00%260.460.01%
Table 6. Dynamic attitude of land use in border areas of Guangxi.
Land Type2000–20102010–20202000–2020
Single Dynamic Attitude %Single Dynamic Attitude %Single Dynamic Attitude %
plowland−0.251.390.55
woodland0.06−0.53−0.24
meadow0.97−0.530.20
waters−0.89−1.27−1.02
construction land−0.2412.556.00
other land−7.9922.551.72
comprehensive dynamic attitude %0.080.400.18
Table 7. Amount of change in area of land use types under each scenario in border area in 2030 (hm2).
Land TypeThe Year 2020The Year 2030Land Use Change in 2020–2030
Scenario IScenario IIScenario IIIScenario IScenario IIScenario III
plowland508,046.4561,147.57559,686.69564,056.5553,101.1751,640.2956,010.15
woodland1,183,904.911,124,502.031,123,484.41,125,333.81−59,402.88−60,420.51−58,571.1
meadow59,355.4560,098.3157,040.6557,230.64742.86−2314.8−2124.81
waters12,141.6312,868.7414,978.9712,244.41727.112837.34102.78
construction land17,741.2522,566.8725,993.4418,181.354825.628252.19440.1
other land260.46266.58265.954403.346.125.494142.88
Table 8. Total carbon stocks by land use type in border areas, (t) 2000–2020.
Land TypeCarbon Stocks in 2000Proportion (%)Carbon Stocks in 2010Proportion (%)Carbon Stocks in 2020Proportion (%)
plowland42,386,621.87 16.1441,313,331.84 15.6947,062,302.34 18.27
woodland216,130,327.29 82.29217,482,574.61 82.61205,850,070.8 79.91
meadow3,657,338.71 1.394,012,670.44 1.523,801,123.25 1.48
waters79,351.27 0.0372,291.96 0.0362,712.47 0.02
construction land376,694.69 0.14367,467.13 0.14828,374.36 0.32
other land10,350.05 0.002082.66 0.005634.19 0.00
all262,640,683.88 100263,250,418.64 100257,610,217.4 100
Table 9. Estimates of carbon stocks under multiple scenarios (t).
YearThe Actual Development Scenario of the Past PeriodNatural Development ScenarioUrban Development ScenarioSustainable Development Scenario
2000262,640,683.88
2010263,250,418.64
2020257,610,217.42
2030 252,477,986.16 252,140,889.47 252,608,075.03
Disclaimer/Publisher’s Note: The statements, opinions and data contained in all publications are solely those of the individual author(s) and contributor(s) and not of MDPI and/or the editor(s). MDPI and/or the editor(s) disclaim responsibility for any injury to people or property resulting from any ideas, methods, instructions or products referred to in the content.

