Article

Two-Way Causality Between Economic Growth and Environmental Quality: Scale in the New Capital of Indonesia

1
Faculty of Economics and Business, Universitas Mulawarman, Samarinda 75119, Indonesia
2
Department of Geomatics Technology, Politeknik Pertanian Negeri Samarinda, Samarinda 75131, Indonesia
3
Faculty of Mathematics and Natural Sciences, Universitas Mulawarman, Samarinda 75117, Indonesia
*
Author to whom correspondence should be addressed.
Sustainability 2025, 17(4), 1656; https://doi.org/10.3390/su17041656
Submission received: 18 December 2024 / Revised: 10 February 2025 / Accepted: 14 February 2025 / Published: 17 February 2025
(This article belongs to the Special Issue Theory and Practice of Sustainable Economic Development)

Abstract

:
The world is still facing an old challenge, e.g., environmental change. In many nations, including developing countries such as Indonesia, spurring economic growth is considered the best way to overcome many things. Indonesia is moving the center of the Indonesian Capital City (IKN). By opening up new space through the consideration of equitable economic development toward a green environment, this study is designed to investigate the impact of economic growth on environmental quality and vice versa. The object of analysis is directed at Penajam Paser Utara (PPU) as the new IKN center and four other IKN buffer areas in East Kalimantan, including (1) Paser, (2) Balikpapan, (3) Samarinda, and (4) Kutai Kartanegara. This study uses panel data regression and linear trends. The data elaborated is economic growth based on Regional Domestic Product (GRDP), which is proxied, and environmental quality, as reflected by the Environmental Quality Index (IKLH), during the 2017–2023 period. Referring to the method implemented, there is significant positive causality between the two in the selected IKN areas. Through the linear trend model, it is found that there is a tendency for changes in the data analyzed based on constant time. This study can be an instrument for practical policy making and a breakthrough in the development of a scientific discipline that studies the relationship between economic growth and environmental quality in two directions.

1. Introduction

One of the signals for assessing success in economic development is economic growth [1]. As is known, economic growth is seen by many countries as a measure of government performance in driving prosperity [2]. However, because natural resources are becoming increasingly depleted, attention to the intensity of economic growth also requires the consideration of environmental sustainability. Environmental sustainability is seen as a universal topic that is always interesting to highlight. Inclusive economic growth is a spillover effect of comprehensive environmental governance [3,4]. As an illustration, the majority of developed countries save resources by employing appropriate technology to realize a green economy. This policy is the main attribute in reducing environmental damage. On the one hand, poor and developing countries that rely on nature are actually more expansive in exploiting nature to realize economic growth. Inefficient management causes contradictions in the resources exploration framework according to basic sectors in each region.
Holistically, the relevance of economic growth to environmental sustainability has been widely discussed in several past publications. As an illustration, research from Yang et al. [5] reveals the connection between economic growth and environmental protection in China. With decoupling terminology, it is found that there is a strong correlation between economic growth and the environment, so the environmental pressure at regional and domestic levels is decreasing. The paper written by Alam and Kabir [6] investigates the interaction between Gross Domestic Product (GDP) per capita and environmental sustainability in Southeast Asia and East Asia. In parallel, increasing GDP per capita has implications for pollution efforts, but there are mixed results (negative or positive) for eco-efficiency efforts. The hypothesis in the Kuznets Curve has been partially proven to have a partial impact on the environment, although not comprehensively. Anwarya [7] highlighted the connection between economic development and ecological sustainability. This paper centers on the role of environmental protection spending in bridging the effects of GDP per capita on carbon emissions per capita in several countries selected for identification. First, GDP per capita significantly influences carbon emissions per capita. Second, spending on environmental protection moderates the significant relationship between GDP per capita and carbon emissions per capita. Then, Obiora et al. [8] explained that increasing economic growth causes environmental sustainability in developing markets to be threatened. In this case, the mitigation of carbon emissions at all levels increases due to the position of domestic credit in the private sector, such as (1) the combustion, (2) buildings, (3) transportation, and (4) electricity industries, which are increasingly developing. Cumming and von Cramon-Taubadel [9] stated that the effect between economic growth and environmental sustainability is negative, where global ecological degradation triggers changes in income and population growth that are increasingly far from sustainable. In the context of the international and national economy, economic growth that is not balanced with a prime ecosystem balance will result in a resource crisis that will actually have a negative impact on environmental sustainability.
The government has been relocating the capital of Indonesia since 2024. Under the regulations contained in Law Number: 3 of 2022, the relocation of the Indonesian Capital City (IKN) from Jakarta to East Kalimantan is a fundamental urgency. Apart from solving social problems, economic and environmental aspects are crucial considerations in relocating IKN. Examples are environmental and economic sustainability. The environment is the first factor behind the move, as Java Island is known as the area with the highest population density in Indonesia, along with high environmental degradation, compared to other islands. A bad environment creates less than optimal access to health. The second factor is economic. The population density in Java also triggers economic competition, especially competition in labor-intensive fields. Even though the government’s budget for development spending on the island of Java is relatively more dominant than in other regions, the tight competition for human resources has made it difficult for the majority of unskilled workers to find employment opportunities based on adequate wage standards. Only skilled workers with skills that match the company’s wishes have the opportunity to occupy professional positions. On the basis of the above, the environmental and economic objectives of the IKN project are expected to overcome the clean water crisis, reduce environmental pollution by switching to clean energy, equalize infrastructure gaps, end poverty and unemployment, provide jobs, attract investment to open decent housing, and support widespread improvement in welfare [10,11,12,13].
Figure 1 is a map of the distance of the movement of Indonesian IKN from Jakarta to the East Kalimantan region. In its progress, IKN began by building a central government building. Other development mechanisms, such as supporting facilities, are being implemented in stages. The initial transfer process for IKN also coincides with the celebration of the proclamation of independence for the Republic of Indonesia on 17 August 2024. Administratively, the area used as the center of IKN is Sepaku District, which is located in Penajaman Paser Utara (PPU). The transfer distance from Jakarta to IKN is ± 1300 km, and, considering the population explosion factor in the old capital reaching around 11 million people, it is necessary to move to areas with low populations, such as IKN, which has 170 thousand people. With so many foundations for relocating IKN and, at the same time, seeing the obstacles from global polemics, such as the economy and the environment, which absolutely need to be highlighted, it is necessary to sharpen the analysis.
The key to successful economic and environmental development in IKN is how to realize impressive economic growth with population productivity and the correct use of resources. Rosyadi et al. [15] estimated that the future needs of residents in the IKN area for electricity and water consumption will increase rapidly. At the same time, the current reality shows that energy-generating units such as gas, water, and electricity in the IKN zone are increasing in line with high demand. It is feared that the growing energy production capacity will actually have a drastic impact on climate change [16].
The usefulness of the proposed study is to predict the link between economic growth and environmental quality in two directions in the IKN center and IKN buffer areas during the 2017–2023 period. The aim of this study was to build academic ideas and become the foundation for professional decision making through two dynamic premises between economic growth and environmental quality and vice versa. The scope of the proposed activities focuses on five regions, where the IKN centers are PPU, Paser, Balikpapan, Samarinda, and Kutai Kartanegara. Meanwhile, the identification period is 2017–2023.
In previous editions, there is a positive reaction from economic growth to the environment [17,18,19,20,21,22,23,24,25,26]. It was also found that there was an inverse relationship between the environment and economic growth in a negative direction. Malaysia, the Republic of Korea, and Kazakhstan are valuable lessons that are relevant. Contextually, the development of new capital cities in three countries in Asia is motivated by economic and environmental principles through adequate actions. These three countries in Asia are valuable lessons that are relevant. Malaysia, the Republic of Korea, and Kazakhstan are regions with outstanding natural resources but have development disparities. A modern new capital involves rigor in planning, infrastructure investment, and governance. This development model transforms better in rebalancing the economy and reducing environmental damage [27]. Although studies linking the relationship between economic growth and environmental quality and environmental quality to economic growth are not new, studies with samples in IKN have never been carried out. In this way, the originality of this study through the modification of different objects provides an opportunity to generate new ideas to be developed in the next agenda.

2. Literature Review

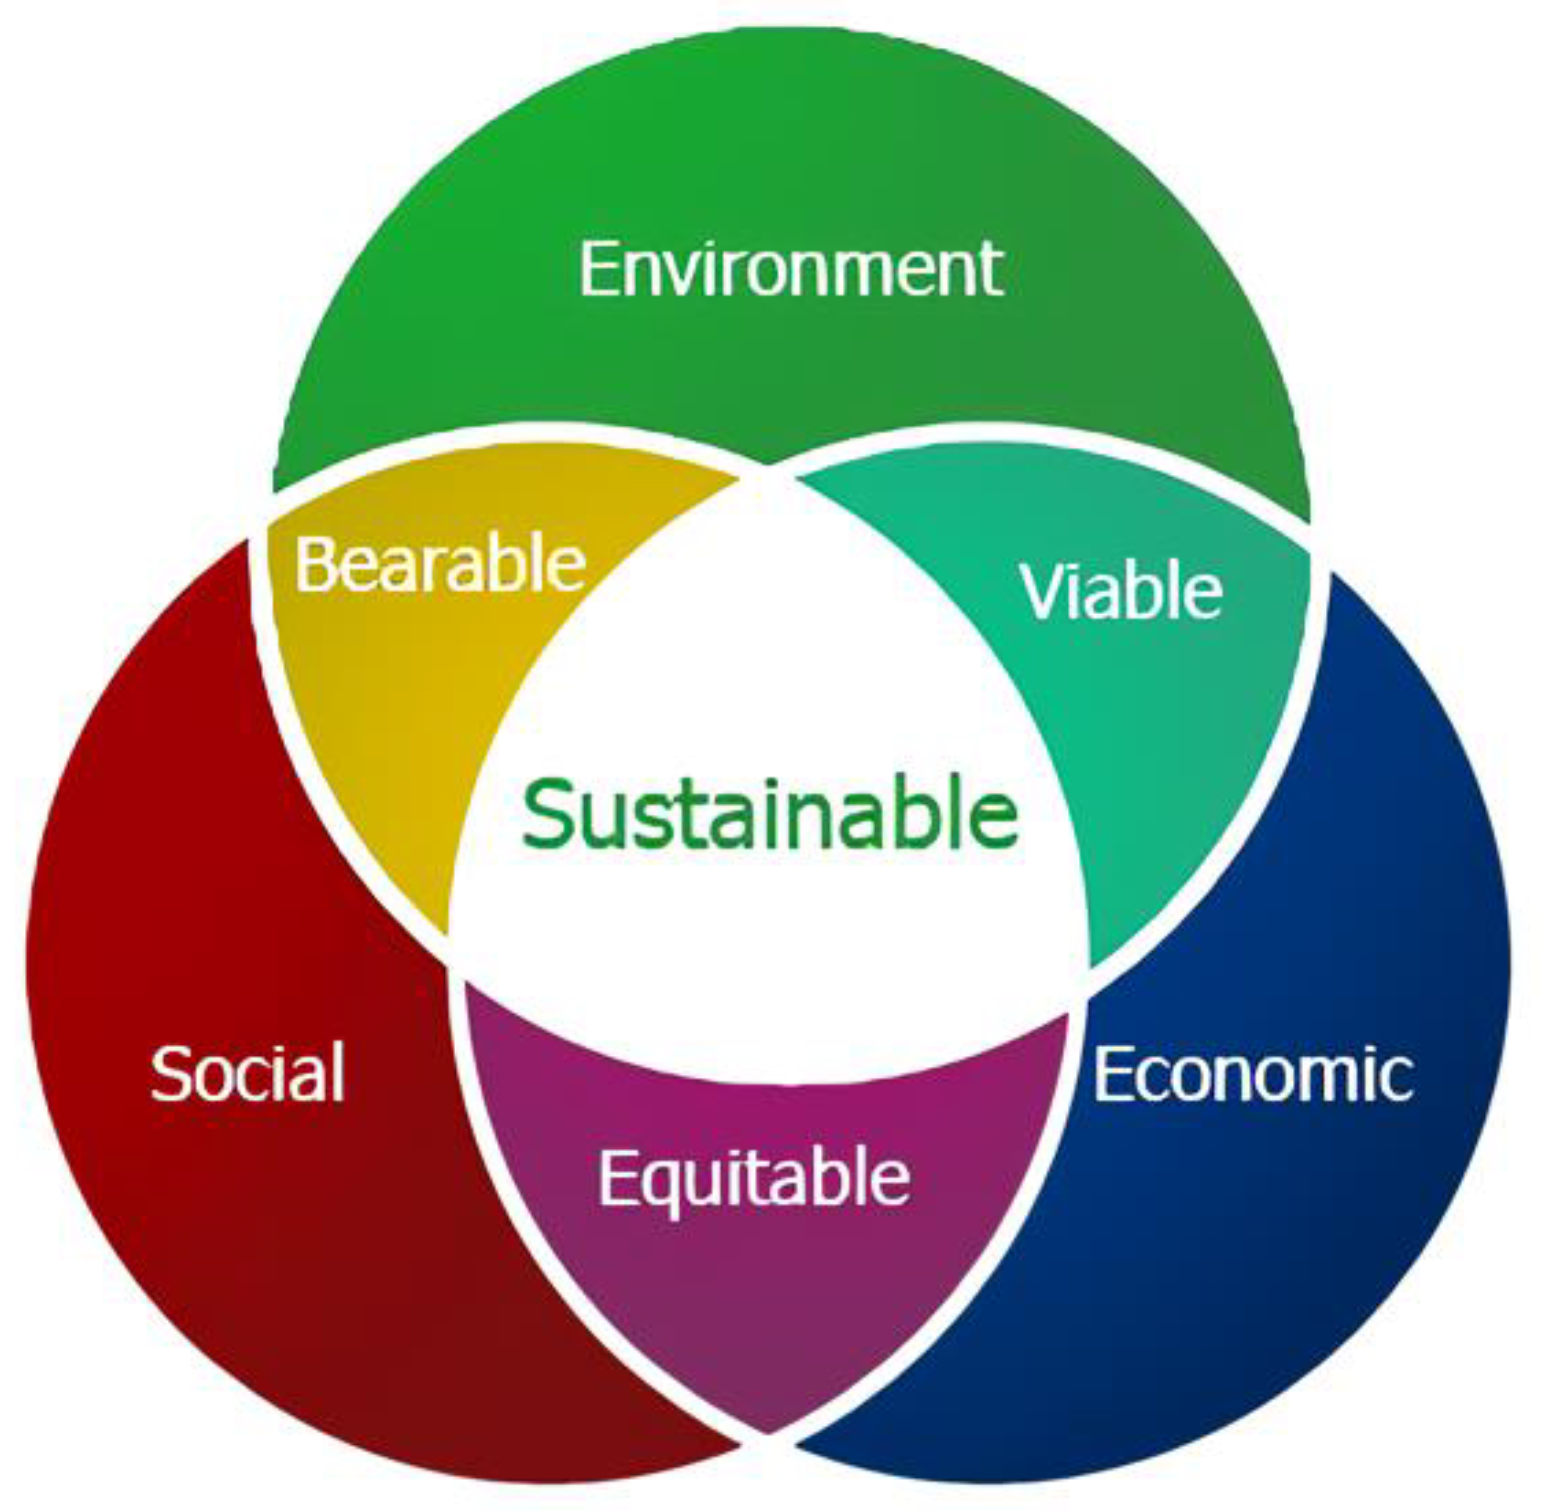
2.1. Sustainable Development

Sustainable development speaks of a development process that emphasizes meeting current needs without sacrificing meeting the needs of future generations, including the environment [28]. Sustainable development must ensure the use and preservation of the environment so that environmental quality is maintained [29,30]. Langhelle [31] explains that development can be said to be sustainable if social justice has been realized across generations. Viewed from a more specific segment, sustainable development is a global design to preserve ecosystem functions and capabilities [32]. Implicitly, practices in sustainable development also cover society, business, urban/rural areas, and land by minimizing the impacts caused by human routines.
Figure 2 illustrates three clusters in sustainable development, including (1) the social cluster, (2) economic cluster, and (3) environmental cluster. Social clusters rely on guarantees of social services, social justice, and wealth distribution. Economic clusters initiate stable economic growth by restructuring production techniques to save resources, especially energy. The environmental cluster is tasked with maintaining the comfort and safety of the living environment. The four pillars of sustainable development include (1) a long-term perspective, (2) an integrative approach, (3) respect for diversity, and (4) equity and social justice. First, a long-term perspective involves planning the efficient use and management of resources. Second, an integrative approach involves development that is guided by the reciprocal relationship between humans and the environment. Third, respecting diversity is oriented toward preventing discriminatory behavior toward cultural diversity and maintaining biodiversity. Fourth, equality and social justice are carried out to ensure that there is no inequality of resources in the present and future, for example, gender equality and the equal distribution of land.
For conditions like Indonesia, sustainable development is concentrated on four factors: (1) tourism resources, (2) marine resources, (3) mining resources, and (4) forestry resources. These four factors are considered to have vital consequences and can influence the continuation of sustainable development because the resource potential and dependence on economic livelihoods are quite dominant compared to other sectors. The sustainable development of tourism resources prioritizes environmental balance in tourist attractions, expanding employment opportunities, revitalizing regional development that supports economic activities, optimizing the country’s foreign exchange and the volume of foreign tourist visits, and fostering a sense of love for the surrounding environment. The sustainable development of marine resources involves fishing methods with nets or other types of environmentally friendly fishing gear, prohibiting the use of chemical poisons, explosives, etc., to catch fish, selecting fish targets to reduce the possibility of catching protected fish, observation and supervision of endangered fish, and conserving coral rocks and mangrove forests. The sustainable development of mining resources prioritizes replanting deforested forests, prohibits deforestation, implements a selective logging system, tightens regulations through logging for every forest felling, and enforces heavy sanctions for those who violate forest management [34].

2.2. Economic Growth

Economic growth is articulated as an increase in output per capita in the long term [35,36]. This means that there is an increase in the accumulation of residents’ income in a country or region in a certain period [37]. As explained at the beginning, economic growth is a symbol of a nation’s prosperity. From a macro perspective, there are three trends in economic conditions, i.e., negative trends, stagnant trends, and positive trends [38]. If the economic growth trend is negative (minus), then an area is affected by a recession, or a welfare contraction occurs. Meanwhile, the trend of stagnant economic growth (less than 3%) per year indicates that a region is experiencing a slowdown in national consumption and production. The positive economic growth trend (more than 3%) actually detects that there is a significant increase in household and domestic income and expenditure.
On a national scale, economic growth is calculated based on Gross Domestic Product (GDP), while on a regional scale, economic growth is calculated using Gross Regional Domestic Product (GRDP). Both GDP and GRDP are calculated using three factors, i.e., production, income, and expenditure. These three factors also produce the same numbers in projecting the rate of economic growth. Generally, GDP and GRDP data are displayed based on two components: (1) current prices/ADHB and (2) constant prices/ADHK. ADHB economic growth reflects the final added value of services and goods according to the prices prevailing per period. Economic growth in this category is also a basis for viewing economic structure and shifts. ADHK economic growth functions to diagnose the economy from period to period according to the added value of services and goods seen from the prices prevailing in a particular period as a basis. The economic growth indicator is a percentage (%), while GRDP and GDP refer to nominal units (Rupiah/IDR).
In Indonesia, economic growth is divided into the following seventeen sectors: (1) agriculture, forestry, and fisheries; (2) mining and quarrying; (3) processing industry; (4) procurement of electricity and gas; (5) water supply, waste management, waste, and recycling; (6) construction; (7) wholesale and retail trade, repair, and maintenance of cars and motorbikes; (8) transportation and warehousing; (9) provision of accommodation and food and drink; (10) information and communication; (11) financial and insurance services; (12) real estate; (13) company services; (14) government administration, defense, and mandatory social security; (15) educational services; (16) health services and social activities; and (17) other services. Below is the formulation of economic growth in the form of national income:
G N P = C + I + G + X M + T
where GNP (Gross National Product), C (Household consumption), I (Investment), G (Government consumption), X (Export), M (Import), and T (Tax).

2.3. Environmental Preservation

The meanings of conservation and environment are often used interchangeably in the corridors of environmental management, but these two words are very different. Conservation is interpreted as a solution to protect the environment through the responsible use of natural resources, while preservation is the protection of the environment from dangerous human activities. For example, forest conservation usually involves environmentally friendly logging procedures to minimize deforestation. In this phase, conservation will set aside part or even all of the forest to protect it from development activities.
Issues related to climate change related to human and environmental interactions are currently being highlighted. A growing number of studies are strengthening the understanding of what can be carried out to stimulate and reverse the effects of extreme environmental conditions through individual awareness. In psychology, there is a limited synthesis of what drives pro-environmental behavior, from various stigmas to concrete actions. Correspondingly, Kothe et al. [39] revealed that most research focuses on applying protection motivation theory through systematic mapping to simulate and change pro-environmental behavior.
One of the initial indications to describe the environmental situation at a regional level in a certain period is the Environmental Quality Index (IKLH). The IKLH is an element of environmental management in Indonesia that combines the Environmental Performance Index (EPI) and the concept of environmental sustainability. The IKLH can describe and evaluate the performance of environmental improvement programs. Apart from that, as information material in the policy making process related to environmental management and protection. The IKLH score and the three composites in the IKLH are grouped into the following six statuses: (1) Alert if 30 ≤ IKLH > 40; (2) Very poor if 40 ≤ IKLH > 50; (3) Not good if 50 ≤ IKLH > 60; (4) Moderate if 60 ≤ IKLH > 70; (5) Good if 70 ≤ IKLH > 80; and (6) Superior if IKLH > 80. The formula for the IKLH on a regional and national scale is written as follows:
I K L H r e g = 40 % × I K T L + 30 % × I K U + ( 30 % × I K A )
I K L H N a s = i = 1 38 R e g i × P o p n a s i + T A n a s i P o p p r o v + T A p r o v 2
where IKLH (Environmental Quality Index), Reg (Regional), Prov (Province), IKTL (Land Cover Quality Index), IKU (Air Quality Index), IKA (Water Quality Index), Nas (National), Pop (Population), and TA (Total Area).

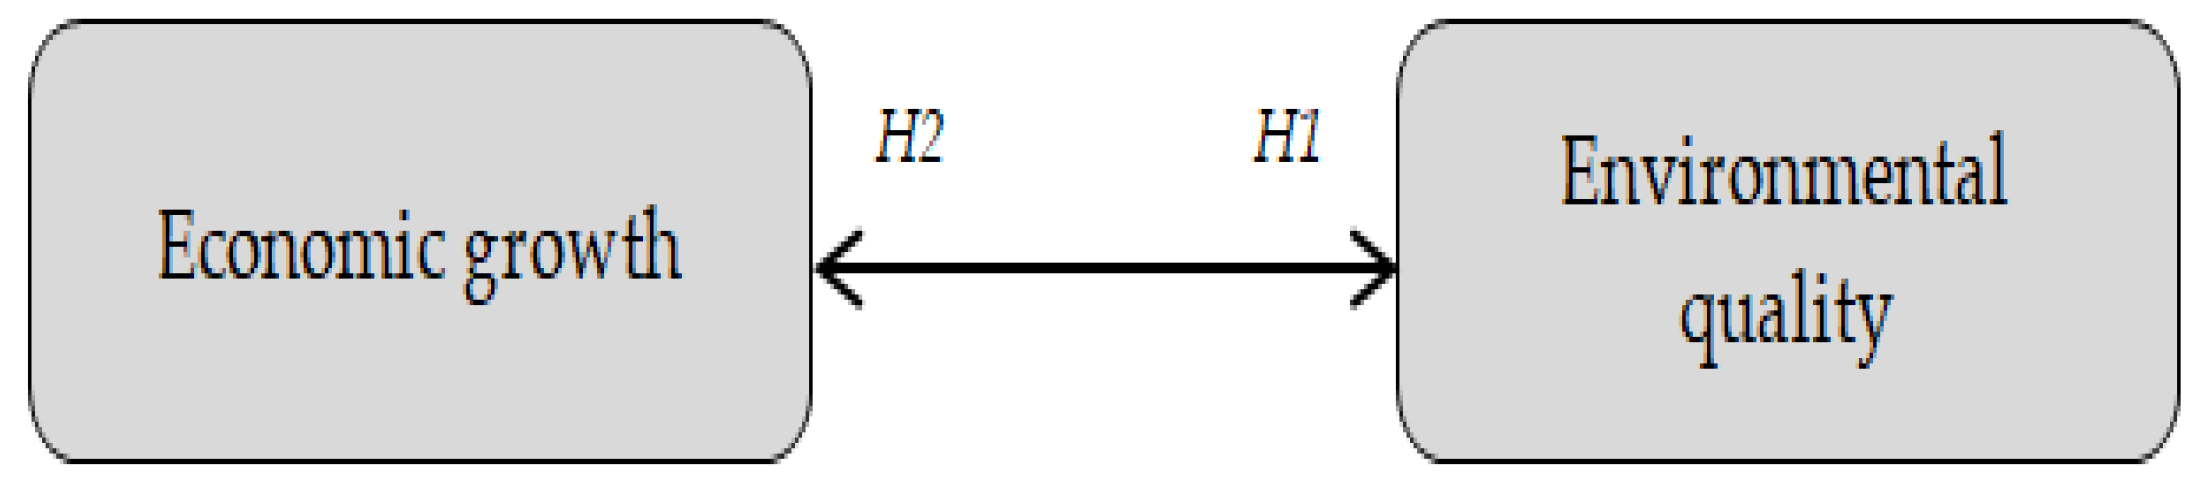
2.4. Conceptual Development

One theory that deepens the relationship between economic growth and the environment is that up to a certain point, GDP will worsen the environment. Yet, after moving to a post-industrial revolution economy, it seemed to increasingly lead to a decline in environmental quality [40]. Furthermore, since the 1980s, the US and UK have been able to reduce CO2 emissions. In general, growth in global emissions actually comes from developing countries [41,42]. For example, in China, industry and coal are the biggest driving sources in changing the characteristics of domestic CO2 emissions, reaching 79.83%. Multi-stage energy intensity is able to mitigate excessive energy consumption toward low carbon emissions [43]. In other cases, when economic growth is emphasized, it results in pollution from wood and coal commodities. Interestingly, with higher incomes, economies can navigate cleaner technologies to limit pollution. Arrow et al. [44], who researched economic growth and carrying capacity, observed different spaces in the “U”-shaped curve, where the environmental costs of economic activities triggered an overlap. The findings confirm that environmental costs are borne by other countries, future generations, and poor people. Incentive funds cannot solve the constraint.
The conflict between economic growth and the environment today is sharper than in previous eras. Indeed, the relationship between economic growth and ecosystem sustainability has been reviewed in much of the literature, but the results remain controversial. This experience brings together a broad perspective to integrate economic growth and environmental degradation into specific references in highlighting the polemics of deforestation and carbon emissions. A simple identification is based on the Environmental Kuznets Curve (EKC), which places an “inverted U” pattern in the relationship between per capita income and environmental quality. Specifically, the analysis is useful for determining the impact of progressive world economic integration on the relationship between economic growth and environmental degradation. Hasid et al. [45] showed an inverse relationship between income growth and carbon emissions. However, this evidence does not apply to the context of forest change. On the other hand, the direct relationship between increasing the degree of integration in the global economy can trigger environmental degradation.
Basically, the environment also depends on economic growth. Apart from the effect of economic growth on the environment, there is a synergy between the environment and economic growth, as illustrated by several studies that discuss the relationship of the environment to the sustainability of economic growth [46,47,48,49,50,51]. Today, the world’s view of environmental sustainability and economic development has shifted. From what was initially conservative, it is now transitioning to a more transformative path. Environmental sustainability and economic development have been correlated with each other. In fact, the majority of economically developed countries are aware of environmental sustainability issues. By grouping countries based on developing and advanced economic predicates, it can be seen that developing countries with natural resource prospects that are more dominant than developed countries have a negative environmental sustainability cycle. Meanwhile, the application of two hypotheses, e.g., the Kuznets Curve and Maslow’s Hierarchy of Needs for case studies in developed countries, can be accepted in channeling the principles of environmental sustainability into economic development. Wise management of resources can automatically reduce environmental degradation to create sustainable economic development in Pakistan. Through a friendly environment, economic growth will run harmoniously to direct intelligent steps in controlling the use of the earth’s limited resources. By limiting responsible environmental exploitation, it is possible to achieve productivity in economic systems and activities.
Environmental sustainability cannot be separated from economic growth. As an illustration, there are nine countries in Eastern Europe where the validity of the decoupling hypothesis shows an asymmetric pattern between environmental sustainability and economic growth. In addition, there is a strong cointegration of environmental benefits and economic growth in the long term, but, in the short term, economic growth causes environmental degradation due to the use of fossil fuels, thus creating dirty industries. From a different scope, sustainable development triggers controversy that invites debate. Does it boost economic growth, or does it start from protecting the environment? Opponents of environmental protection assume it should not come at the expense of individual freedoms and rights, including economic growth. In contrast, environmental protection advocates are concerned with limiting global resources for future generations, even at the expense of economic growth. Most individual freedoms in eleven post-Soviet countries are predicted to have a high level of preference for protecting economic growth and the environment. Concern for environmental sustainability has been demonstrated by several areas in China through which the Yangtze River flows by creating massive pollutant emission reduction schemes that must be followed by companies operating in the industrial sector. One form of this commitment is reducing wastewater and carbon emissions per unit of industrial output to produce mutually beneficial environmental and economic resilience.
The dynamics between economic growth and environmental quality have been widely discussed in various scientific papers, where there is a two-way causality between the two [52,53,54,55,56,57]. Economic growth replicates increases in real output (GDP). Therefore, with increasing accumulation and consumption, there tends to be a burden on the environment. The environmental impact of economic growth is responded to by increased consumption of non-renewable resources, global warming, excessive levels of pollution, and the potential loss of environmental habitats. However, it is understood that not all economic growth causes environmental damage. As real incomes increase, residents have a greater ability to devote resources dedicated to stopping the harmful effects of pollution and protecting the environment. Rapid technology-driven economic growth can offer more efficient output with lower levels of pollution. Based on the theoretical arguments and empirical studies above, the framework for existing research was developed as follows:
Through Figure 3, two hypothetical expectations that can be proposed are explained as follows:
H1. Economic growth can affect environmental quality.
H2. Environmental quality can affect economic growth.
Figure 3. Framework.
Sustainability 17 01656 g003

3. Methodology

3.1. Sample Data

The data material is secondary. The data were collected from government agencies authorized to provide data. Data about economic reports are selected from various series. Data objectivity concerns economic growth and environmental quality. The study sample focuses on five regions in East Kalimantan, including (1) Paser, (2) PPU, (3) Balikpapan, (4) Samarinda, and (5) Kutai Kartanegara. This place was chosen because it is important in supporting IKN development. Prawitasari et al. [58] argue that there is a vital partnership between PPU, which is a relocation zone, and the surrounding area, where Paser plays its role as a residential area, Balikpapan is a logistics and transportation center, Samarinda is a cultural and historical development area, and Kutai Kartanegara is a peripheral area to supply local food needs. Thus, this is a logical reason for many groups to highlight the role of the five locations above.
The data entities used in this study are economic growth and the environment. The intended economic growth is based on constant GRDP data (percent), while environmental quality is based on IKLH data (index). Table 1 and Table 2 describe the data observed over a period of seven periods. Substantively, the average economic growth data in both IKN and the four regions around IKN is positive throughout 2017–2019 and 2021–2023. Even in four regions, namely Paser, Balikpapan, Samarinda, and Kutai Kartanegara, the average economic growth is above the national level. In PPU, the average economic growth is actually below the national level. PPU’s negative economic growth performance is an accumulation of the COVID-19 pandemic in 2020. In particular, environmental quality data represents varying scores in the IKN and four buffer areas during 2017–2023. Uniquely, environmental data in 2021 show that for all areas, it is light green, but the status is good. The average score for environmental quality in Indonesia is 73.16 points in the good category. Even though they are both classified as good, the environmental quality at PPU (77.79 points), Balikpapan (73.83 points), and Kutai Kartanegara (79.53 points) is above the national level. In comparison, the environmental quality in Paser (68.82 points) and Samarinda (68.78 points) is actually below the national average or moderate.

3.2. Variables

Two main variables were set to support this study. Both economic growth and environmental quality play a role as independent variables and dependent variables to explain causality between one another. Operationally, economic growth variables are extracted from GRDP data on the basis of constant prices, while environmental quality is based on IKLH. Table 3 details the variable composition. Referring to the variable entities collected, this study was inspired by similar research [17,18,19,20,21,22,23,24,28]. The data duration only focuses on the contemporary period of six years in PPU as the central area and the four IKN support zones mentioned above.

3.3. Analysis Method

The first method for processing data is operated by panel data regression. This method functions to tabulate data quantitatively. Panel data regression is operated via computer software called IBM-SPSS. Methodologically, panel data regression is directed at the Ordinary Least Square (OLS) model. OLS-based panel data regression combines cross-section and time series data. There are two flows in regression data analysis. First, descriptive statistics and correlation have the aim of recapitulating variations in variable data and correlation coefficients. The value of the coefficient has an interpretation based on five classes, e.g., no correlation (0), weak correlation (−0.3 ≤ r < 0 or 0 < r ≤ 0.3), moderate correlation (−0.7 ≤ r < −0, 3 or 0.3 < r ≤ 0.7), strong correlation (−1 ≤ r < −0.7 or 0.7 < r ≤ 1), perfect positive correlation (+1), and perfect negative correlation (−1). Second, a two-way panel data regression was carried out to test the empirical relationship between economic growth and environmental quality and vice versa. Logarithm (log) was used to simplify the units of account for variables. Below is the basic equation in panel data regression:
Y i t = α + k = 1 K β k X k i t + μ i t
where Yit (the dependent variable is the ith observation unit and the tth time), α (intercept), K (the number of independent variables), X k i t (value of the kth independent variable for the ith cross-section and tth year), βk (slope coefficient), and μit (error in the ith observation unit and tth year).
Based on the econometric function above, the study variables are transformed into statistical symbols as follows:
Y E g = α 1 + l o g β 1 X E q + μ 1
l o g Y E q = α 2 + β 2 X E g + μ 2
where YEg (economic growth as dependent variable), α1 (constant in first regression), β1 (beta coefficient in the first regression), XEq (environmental quality plays a role as an independent variable), μ1 (residuals in the first regression), YEq (environmental quality is the dependent variable), α2 (constant in second regression), β2 (beta coefficient in the second regression), XEg (economic growth is the independent variable), μ2 (residuals in the second regression), and log (double log).
The second method for processing data uses linear trends. A linear trend is a trend (down and up) in the long term, such as an average change over time. The average shift can decrease or increase. There are two outcomes in this model, where, if the average change decreases, it is called a negative trend; if the average change tends to increase, then there is a positive trend. In terms of quantification, the type of linear trend that is applied is a linear trendline graph to highlight shifts in straight line data. A linear trend is a pattern in an independent variable with a period of the highest power of one. Linear trend describes the linear relationship between the independent variable and the dependent variable. Moreover, a linear trendline tries to find a straight line that best fits the pattern of growth or decline of the data over time. The use of a linear trendline allows us to analyze a linear pattern and predict how the data will change in the future based on existing trends. The linear trend has the form of a straight-line equation as follows:
Y = α + β X
where Y (periodic data or trend value); X (time period); α (Constant of Y, if X = 0); and β (coefficient on X with slope).
To determine the trendline, first look for the α and β values. By knowing the values of both, a trendline can be created. Technically, linear trendline graphs also predict the strength of the model built with the output in the form of the coefficient of determination (r2). Because the correlation score (r) has a range of −1 ≤ r ≤ 1, then r2 has a range between 0 ≤ r ≤ 1. The r2 score has a range of 0 ≤ r ≤ 1, which can be converted into a percentage. The equation function on r2 is explained below:
r 2 = S S x y 2 S S x 2 . S S y 2
where r2 (coefficient of determination), SS (sum of squares), x (independent variable), and y (dependent variable).

4. Results and Discussion
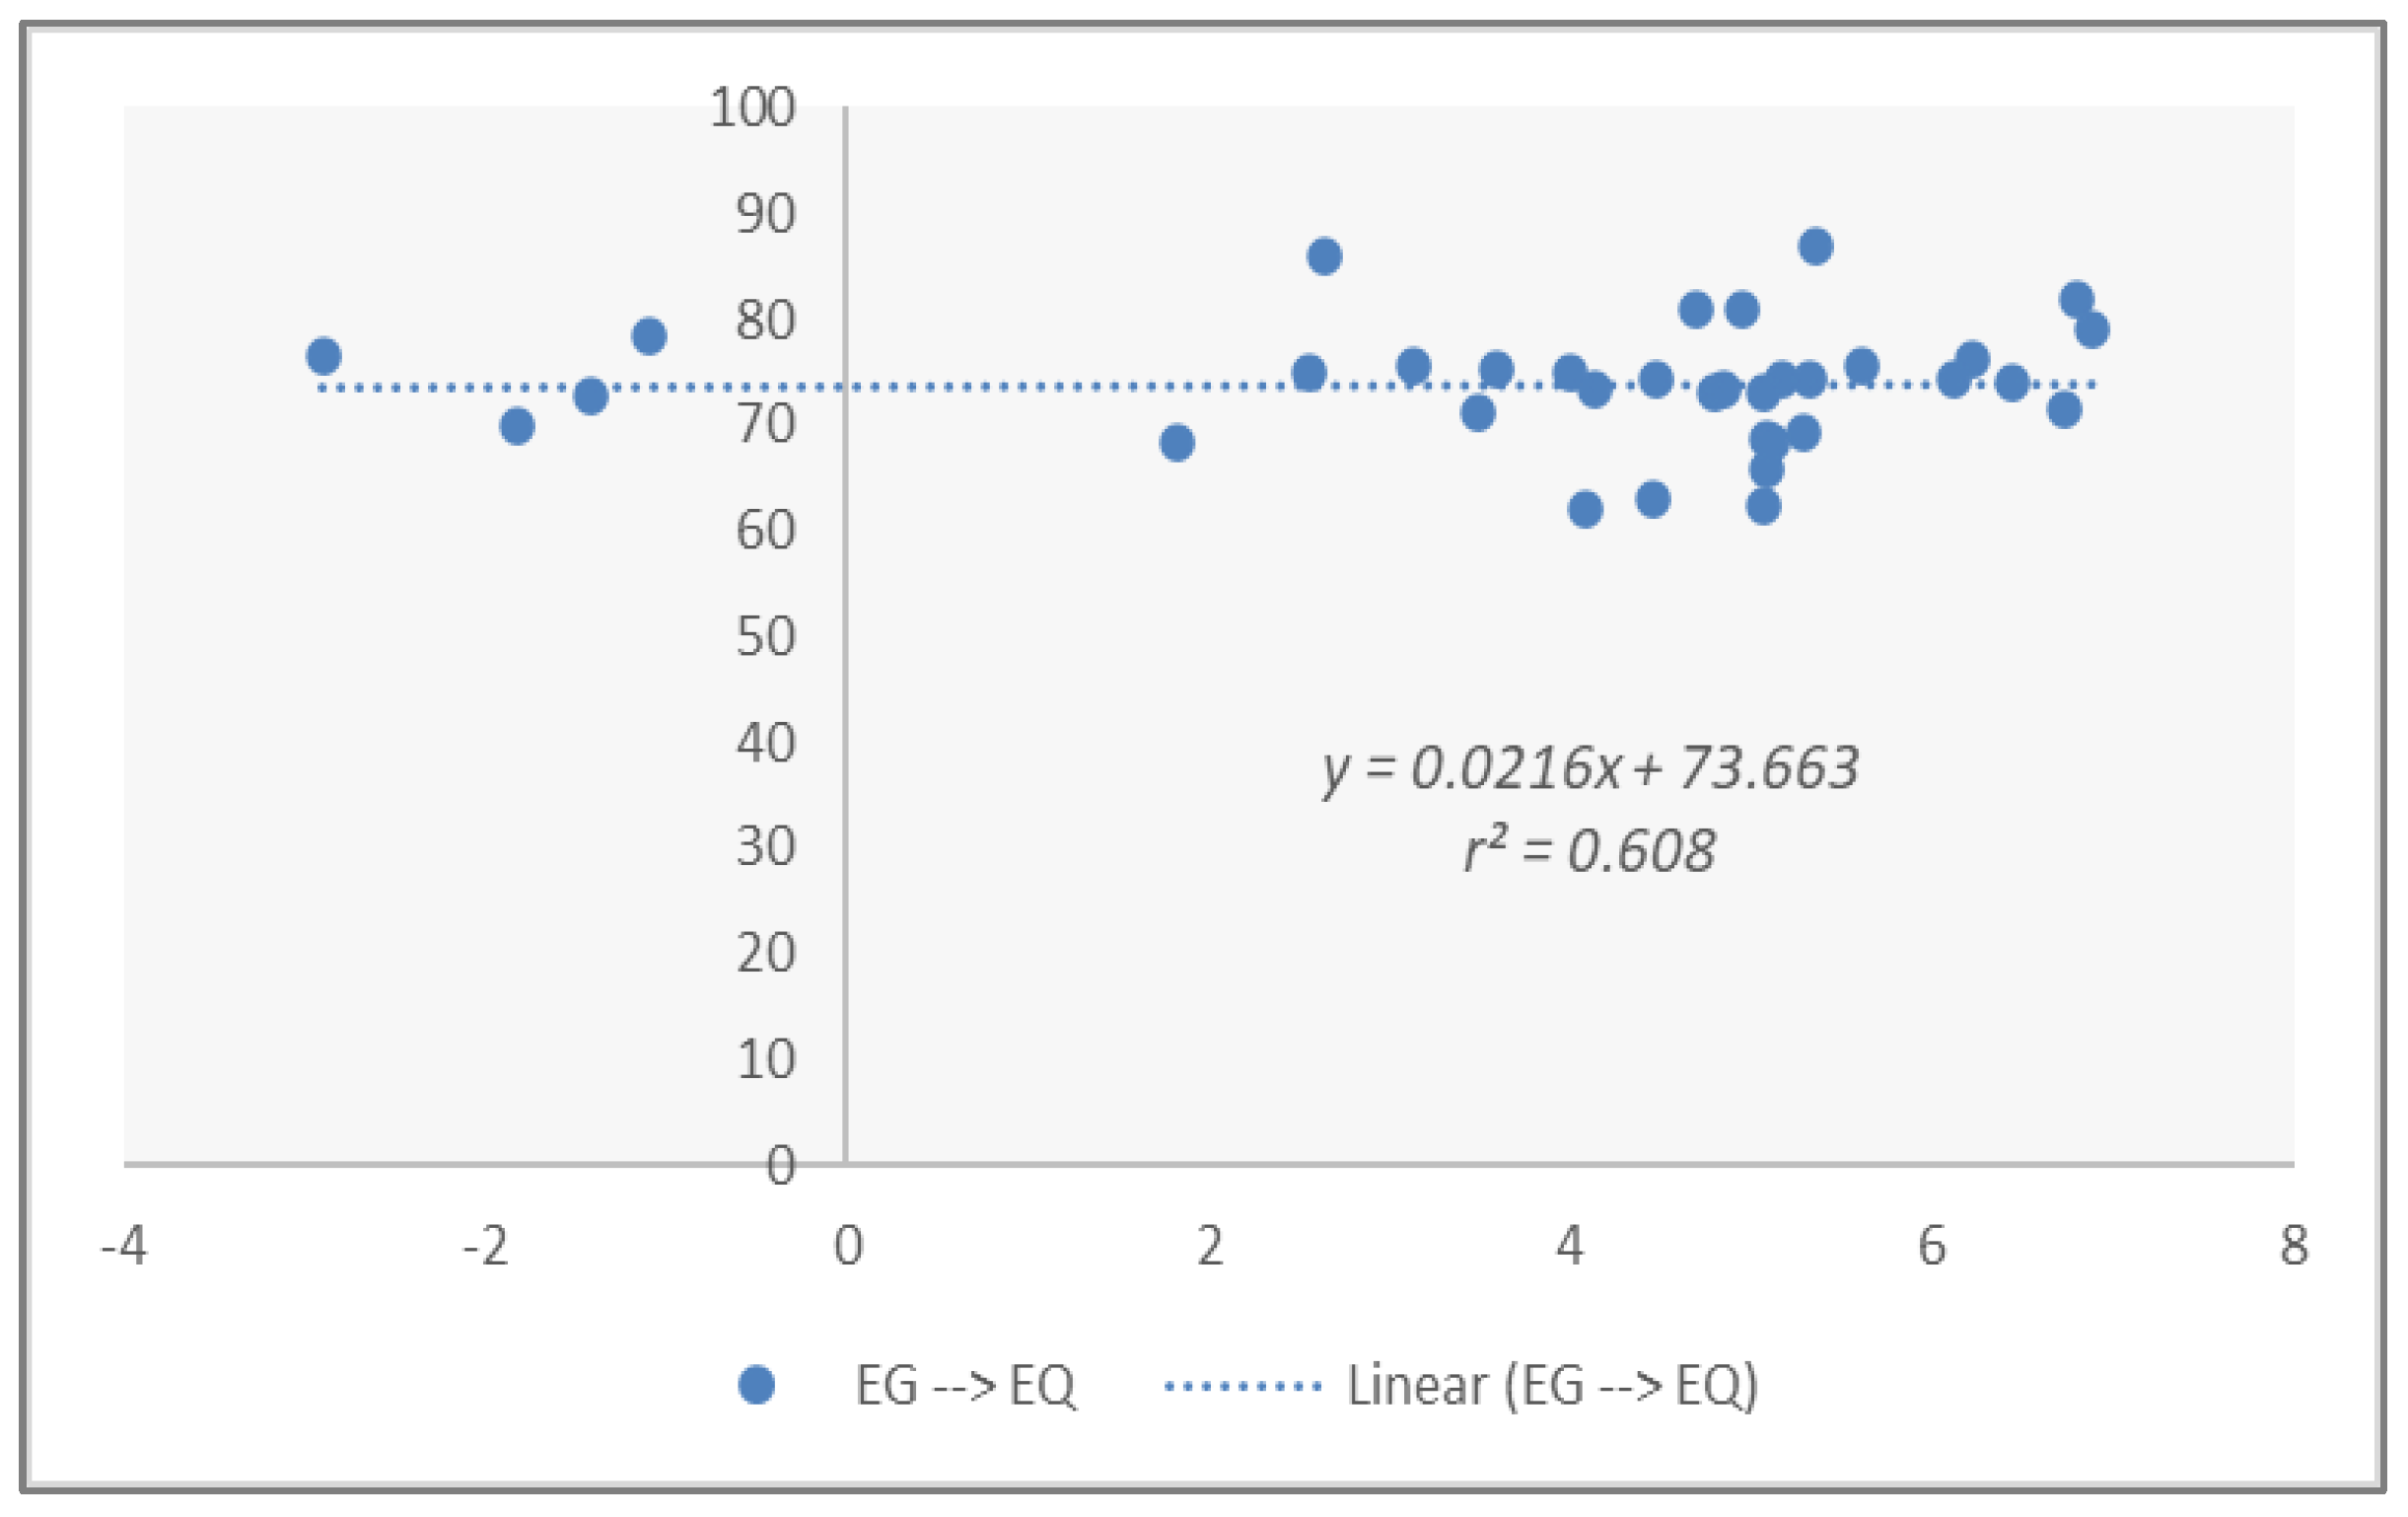
4.1. Main Findings

The orientation of this study is that PPU is the center of IKN, with four regions as IKN buffers, including Paser, Balikpapan, Samarinda, and Kutai Kartanegara. Through the panel data regression method, two main findings were obtained. First, descriptive statistics and correlation were obtained. Specifically for correlation, this study uses two types of correlation, e.g., parametric correlation (Pearson) and non-parametric correlation (Kendall’s tau and Spearman’s rho). Of these two qualifications, parametric correlation is a correlation analysis carried out on parametric data to examine the relationship between variables. Parametric correlation analysis is often also called the Pearson coefficient. Non-parametric correlation is a statistical technique adapted to measure the relationship between two variables without assuming a normal distribution of data. Non-parametric correlation is also known as non-linear correlation. Table 4 displays descriptive statistics based on four dimensions, i.e., mean, median, maximum, minimum, and standard deviation (SD).
In economic growth, the mean score is 4.05, the median score is 4.84, the maximum score is 6.89, the minimum score is −2.90, and the SD score is 2.45. This is different from environmental quality, where the mean score is (73.75), median score (74.17), maximum score (86.88), minimum score (61.94), and SD score (5.80). Based on a degree of probability below 1% (p < 0.01), the Pearson correlation explains that there is a very strong and significant interaction between economic growth and environmental quality or vice versa with a coefficient (r = 0.959) and probability (p = 0.009). But, through a probability level below 5% (p < 0.05), both Kendall’s tau correlation and Spearman’s rho correlation, it is concluded that there is a significant moderate interaction between economic growth and environmental quality and vice versa with a coefficient (r = 0.580; r = 0.587) and probability (p = 0.016; p = 0.037).
Second, Table 5 recapitulates the panel data regression in the two-way relationship between economic growth and environmental quality and vice versa. Referring to model 1, economic growth has a significant positive impact on environmental quality. This is proven by a probability degree of 1% (p < 0.01), whether constant, partial, or simultaneous, and economic growth has an effect on environmental quality with t-statistics and constant probability (t = 37.909; p = 0.000), t-statistics and partial probability (t = 3.052; p = 0.009), and F-statistics and simultaneous probability (F = 4.065; p = 0.003). Then, environmental quality also has a significant positive impact on economic growth, constantly, partially, and simultaneously. With a probability level of 5% (p < 0.05), environmental quality is able to influence economic growth with t-statistics and constant probability (t = 8.693; p = 0.043), t-statistics and partial probability (t = 2.693; p = 0.027), and F-statistics and simultaneous probability (F = 2.485; p = 0.023). The standard error value in model 1 (SE = 5.883) is higher than in model 2 (SE = 3.767).
Linear trend analysis based on linear trendline graphs from both models is visualized in Figure 4 and Figure 5. In model 1, Figure 4 confirms that the data are identified with varying trends. Most of the data experiences positive trend changes with a tendency at the top right, while a small portion of data for several years is grouped at the top left (negative trend). In other words, the data material used is suitable for analysis. The performance in model 1 is quite good. Kurniawan et al. [61] state that r2 is looking at the proportion of variation in the dependent variable that can be predicted from the independent variable. The function r2 provides a measure of how well the observed results are replicated by the model based on the proportion of total variation in the results explained by the model. The five patterns in r2 correspond to the coefficient interval, and the influence levels include 0–19.99% (very weak), 20–39.99% (weak), 40–59.99% (moderate), 60–79.99% (strong), and 80–100% (very strong). The coefficient of determination in model 1 (r2 = 0.608) falls within the coefficient interval between 60 and 79.9%, so economic growth has a strong influence on environmental quality. With an r2 value of 60.8%, the remaining 39.2% are elements not discussed in model 1.
Slightly different from the linear trend in model 1, the linear trendline graph in model 2 shows that although the majority of the data is also in the top right position, a small portion of the data is actually clustered in the bottom right. Most of the average changes in data vary or experience an abnormal trend (from positive to negative). This indicates that there is a shift in environmental quality data toward economic growth, which tends to decline. The coefficient of determination in model 2 (r2 = 0.562) is in the coefficient interval between 40 and 59.99%, where the environment has a moderate influence on economic growth. Figure 5 also justifies that with an r2 value of 56.2%, the other 43.8% are confounding factors outside model 2.

4.2. Implications

With the presence of IKN, economic growth has had an impact on environmental quality in recent periods. The existing phenomenon indicates that when economic growth increases, environmental quality is still well maintained in the short term. Yet, in the long term, increasing economic growth will bring negative risks to environmental quality.
The trade-off between consumption and non-renewable resources suggests that to increase consumption, the opportunity cost will result in a smaller supply of non-renewable resources. Throughout the last century, the rate of global economic growth has caused a decline in the availability of natural resources, such as logging and demand for wood to clear agricultural land; depletion of gas, coal, and oil; over-exploitation of fishing; extinction of species; and fragile biodiversity.
The validity of the Kuznets Curve for some characteristic pollutants is visible but is refuted for less visible and more diffuse pollutants (such as CO2). The “U” shape favors pollutants but not natural resource stocks. It is claimed that economic growth has not reversed the trend to reduce the quantity of non-renewable resources and the proportion of consumption. Reducing pollution in one country will actually encourage the outsourcing of pollution to other countries, for example, importing coal from developing countries. Garbage is also one of the root causes of environmental pollution. Shallow insight into waste handling can bring new disasters, such as pollution. Indonesia has complex challenges regarding waste. There is overlap in determining policies. Often, discrepancies are found between waste management and control across organizations. Overall, apart from domestic waste, excessive waste imported from certain countries is difficult to recycle. The paper and plastic waste that has piled up at the Final Processing Site (TPA) cannot yet be recycled skillfully. These two types of waste are imported from outside Indonesia to meet industrial needs but tend to ignore environmental sustainability.
The argument on the relationship between economic growth and the environment involves several versions. Chakravarty and Mandal [62], Grossman and Krueger [63], Priyagus [64], and Yang et al. [65] argue that economic growth always leads to environmental damage. Uniquely, there are some who clarify that consistent economic growth can bring improvements and have an impact on stability [9,66]. In the next model, it is believed that the free market will not solve the problem due to uncertainty about air quality and the accumulation of other spillover effects on future generations. The impact of existing environmental pollution cannot be handled by the current price mechanism.
During 2017–2023, the results of the investigation detected that environmental quality drives economic growth in a positive direction. These findings signal that the more environmental quality is improved, the more it will have a significant effect on economic growth in the short term. However, there is a negative potential for economic growth if the environmental quality in IKN is ignored. Poor environmental quality will spur a slowdown in economic growth in the long term. Along with the current development of excessive needs, the environment was very essential in previous decades, especially when entering the industrial revolution. Experience from the 19th century to the 20th century shows that the exploitation of oil and coal was used as an energy source in every industrial investment to stimulate economic growth [67,68]. In the conservative economic literature, it is widely accepted that resource access tends to be expansive, whether renewable or non-renewable energy [69].
Despite its popular historical perception at that time, many observers and scholars saw that the environment was “two opposing sides of a coin”. In reality, the natural environment provides economic growth through its positive contribution to national income. This also poses a threat to long-term economic growth because it can damage other sectors [70]. This weakness can trigger severe poverty, authoritarian regimes, social conflict, and even civil war. This side effect is called the “crowding out effect”, describing countries that are rich in natural resources but have a fragile financial system and institutional structure, but does not bring industrial growth as expected. Based on many studies from previous publications, it is reasonable to say that natural resources are considered nothing more than a curse rather than a blessing [71].
The environment enjoyed by humans today comes from natural resources. There is a connection between the environment and economic growth, which is a multidisciplinary discussion. The environment is a criterion for assessing the sustainability of development for many countries [72,73]. Sachs and Warner [74] prove that economic growth in countries rich in natural resources is much lower than in countries with few natural resources. This anomaly is known as the “natural resource curse” based on a compilation of literature that consistently applies various econometric scenarios [75,76,77].
EKC’s research history is rich, with most studies highlighting the link between economic growth and the environment and vice versa, as visualized in Table 6. Based on an empirical review of a cross-section of publications from 2020 to 2024, similarities with existing research were found. The scattered investigations from across cases fall into two points. The first is the investigation of the effect of economic growth on the environment. The second is the investigation of the effect of the environment on economic growth. Wulandari and Hayati [78] concluded that economic growth and environmental degradation in Indonesia from 1981 to 2017 had a significant integration. An increase in economic growth triggers structural damage in the long run. Economic growth has a one-way causality on CO2 emissions. Liu et al. [21] related GDP per capita to terrestrial carbon sequestration capacity within the scope of low-income, lower-middle-income, and upper-middle-income countries in the tropics during 1995–2018. They concluded that GDP per capita significantly affects terrestrial carbon sequestration capacity in low-income and lower-middle-income countries, but there is an insignificant impact on countries with upper-middle income levels. Raihan et al. [79] investigated the potential of economic growth on CO2 emissions in Malaysia from 1990 to 2019. The empirical findings show that an increase in economic growth is positively associated with CO2 emissions.
Leonardo et al. [80] examined the probability between economic development and environmental degradation in Indonesia through time series data during 1980–2021. Based on the EKC hypothesis model, economic growth in the early stage contributes to increased environmental degradation. Yet, the opposite is true after the turning point, where economic growth actually reduces ecological degradation. Humbatova et al. [81] analyzed the effect of economic growth on the ecological environment in Azerbaijan and Hungary for the period 1997–2022. In both Azerbaijan and Hungary, the quantity of economic growth had a significant effect on environmental pollution. Osuntuyi and Lean [82] initiated a study by linking economic growth and environmental damage in 92 countries during 1985–2018. The study findings show that economic growth is a long-term alternative to environmental degradation and vice versa in upper-middle and high-income countries but not for low-income and lower-middle-income countries. Dardouri and Smida [83] studied the relationship between GDP and ecological footprint in the G7 countries Germany, Japan, UK, USA, Canada, France, and Italy for the period 1961–2018. Under the “U”-shaped Renewable Kuznets Curve (RKC), GDP has positive implications for environmental degradation in both the short and long term. Yu et al. [84] examined the prospects of economic growth and environmental pollution in 230 Chinese cities. During 2004–2019, economic growth significantly worsened regional environmental pollution. This was because economic growth targets were overly ambitious and tended to maintain the economic growth position at the expense of the environment. At the same time, environmental regulations were relaxed, hindering sustainable environmental governance.
Acheampong and Opoku [85] navigated the connection between environmental degradation and economic growth of 140 countries during 1980–2021. In line with this, greater environmental degradation activities triggered a slowdown in economic growth. Xu et al. [86] calculated the impact of trade-offs between the environment and the economy. In this context, environmental variables are represented by carbon volatility, while economic variables use inflation rate indicators. In addition, a comprehensive investigation was directed based on the EKC framework in the carbon market of mainland China with three representative regions in the pilot projects of Shenzhen, Guangdong, and Hubei as the study objects from 2013 to 2022. In the pilot stage, inflation does not affect carbon returns, which contradicts the EKC model. After the threshold was added to the regression model, inflation had a linear impact on carbon returns. In the analysis sample in Guangdong and Shenzhen, the findings show an anomalous “inverted U”-shaped relationship between inflation and carbon returns, while a “U”-shaped relationship occurs in Hubei.
Environmental sustainability requires attention to encouraging inclusive economic circulation without the excessive depletion of resources [87,88,89,90]. In cases across nations, including European Union countries, the relevance of economic growth to environmental quality is reflected in government programs [85,91]. Policies such as minimizing waste and emissions, ensuring more efficient production processes, using environmentally friendly products and services, and promoting energy-efficient products can influence environmental sustainability in the future. These policies are expected to encourage economic growth, which will provide broad benefits (such as increasing living standards). Also, high economic growth can bring changes to the environment, such as the use of natural resources, waste, and pollution in recycled products. Strategic steps have also been taken by the Indonesian government by involving economic stakeholders in implementing a green economy through renewable energy, organic agriculture, social forestry, and ecotourism [92].
Amidst the challenges toward sustainable development, Indonesia is taking concrete steps through the green growth movement [93]. This policy includes using natural capital responsibly, reducing pollution, and optimizing opportunities to increase social prosperity. Building an exponential green economy is carried out by encouraging the efficiency of natural resource consumption costs while maintaining economic productivity. For example, Indonesia includes two pillars from the Sustainable Development Goals (SDGs) to realize sustainable green economic growth by 2030. These two pillars are SDG 7: “To Ensure that Everyone has Access to Affordable, Reliable, Sustainable, and Modern Energy” and SDG 1: “To End Poverty in all forms by 2030”. There are three indicators from the two SDGs that synergize with each other: first, for SDG 7, pillar 7.2.1: renewable energy mix and 7.3.1: primary energy intensity; second, in SDG 1, pillar 1.4.1: percentage of households and vulnerable people with mains electricity sourced from the State Electricity Company (PLN) and non-PLN electricity. The renewable energy mix is targeted to reach 10–16%, and primary energy intensity is targeted to decrease by 1% per year or the equivalent of 463.2 barrels of oil, while 40% of the lower-middle-income population is targeted to have complete access to lighting (100%). This evidence was validated by the study by Suparjo et al. [94], where primary energy, renewable energy mix, and primary electrical lighting sources integrated into SDG’s policies have a significant multiplier effect on green economic growth. The findings above clearly indicate that the three indicators based on the two SDGs pillars are valuable instruments in prioritizing the achievement of a green economy without sacrificing social prosperity, especially environmental aspects.

5. Conclusions

This study aims to test the two-way causality between economic growth and environmental quality. The data material was investigated for seven periods by adopting panel data regression and linear trends. As a result, it was found that economic growth in the area around IKN triggered environmental quality in a significant and positive way. Also, environmental quality has a significant positive impact on economic growth. Statistically, it can be interpreted that there is a strong model in the relationship between economic growth and environmental quality. In the second model, economic growth is influenced by environmental quality, with a moderate relationship. Both economic growth and environmental quality both influence each other and have a real impact. The strength of the closest relationship is economic growth to environmental quality compared to environmental quality to economic growth.
The analysis findings based on panel data regression and linear trends will be a follow-up for stakeholders, especially the government. Ideally, economic development in IKN and the surrounding buffer areas must coexist with environmental principles. The government has a preference for making policies that pay attention to environmental impacts as a consequence of accelerated economic growth. The government needs to determine alternative strategies to ensure inclusive economic growth while maintaining environmental sustainability. Inclusive economic growth is economic growth that maintains a balance with environmental quality. The weakness of this study lies in the limited data units and variables. For future research, we can consider the weaknesses of existing research by expanding the method.

Author Contributions

Conceptualization, N.N.; methodology, D.C.D.; software, A.K.; validation, S.S. and W.W.; formal analysis, N.N., D.C.D. and W.W; investigation, S.S. and A.K.; resources, N.N.; data curation, A.K.; writing—original draft preparation, N.N., D.C.D., S.S. and W.W.; writing—review and editing, D.C.D. and A.K.; visualization, N.N., S.S. and W.W.; supervision, A.K. and W.W.; project administration, D.C.D.; funding acquisition, N.N. and S.S. All authors have read and agreed to the published version of the manuscript.

Funding

This research received no external funding.

Institutional Review Board Statement

Not applicable.

Informed Consent Statement

Not applicable.

Data Availability Statement

The data used to support the findings of this study are available from the corresponding author upon request.

Conflicts of Interest

The authors declare no conflicts of interest.

References

  1. Soliyev, I.I.; Ganiev, B.B. Key factors influencing economic development. Eur. J. Res. Dev. Sustain. 2021, 2, 12–16. [Google Scholar]
  2. Mumford, K.J. Prosperity, sustainability and the measurement of wealth. Asia Pac. Pol. Stud. 2016, 3, 226–234. [Google Scholar] [CrossRef]
  3. Kamah, M.; Riti, J.S.; Bin, P. Inclusive growth and environmental sustainability: The role of institutional quality in sub-Saharan Africa. Environ. Sci. Pollut. Res. Int. 2021, 28, 34885–34901. [Google Scholar] [CrossRef] [PubMed]
  4. Krysovatyy, A.; Ptashchenko, O.; Kurtsev, O.; Ovagim, A. The concept of inclusive economy as a component of sustainable development. Probl. Ekorozwoju 2024, 19, 164–172. [Google Scholar] [CrossRef]
  5. Yang, Z.; Gao, W.; Li, J. Can economic growth and environmental protection achieve a “win-win” situation? Empirical evidence from China. Int. J. Environ. Res. Public Health 2022, 19, 9851. [Google Scholar] [CrossRef]
  6. Alam, M.S.; Kabir, M.N. Economic growth and environmental sustainability: Empirical evidence from East and South-East Asia. Int. J. Econ. Fin. 2013, 5, 86–97. [Google Scholar] [CrossRef]
  7. Anwarya, W. Exploring the relationship between economic growth and environmental sustainability. J. Manag. Adm. Provis. 2022, 2, 26–36. [Google Scholar] [CrossRef]
  8. Obiora, S.C.; Zeng, Y.; Li, Q.; Asiedu-Ayeh, E.; Nneji, G.U.; Bamisile, O. The economic growth and environmental sustainability nexus: A metanalysis of three economic types. J. Environ. Plan. Manag. 2021, 65, 2556–2586. [Google Scholar] [CrossRef]
  9. Cumming, G.S.; von Cramon-Taubadel, S. Linking economic growth pathways and environmental sustainability by understanding development as alternate social-ecological regimes. Proc. Nat. Aca. Sci. USA 2018, 115, 9533–9538. [Google Scholar] [CrossRef]
  10. Fitriadi, F.; Priyagus, P.; Darma, D.C. Assessing the economic feasibility of tourism around IKN: Does it beyond the SDG standards? Indones. J. Tour. Leis. 2023, 4, 153–173. [Google Scholar] [CrossRef]
  11. Jiuhardi, J.; Hasid, Z.; Darma, S.; Priyagus, P.; Darma, D.C. Towards the new national capital (IKN) in Indonesia: Premises and challenges of food security. Anuário Inst. Geociências 2024, 47, 55638. [Google Scholar] [CrossRef]
  12. Priyagus, P.; Rahmawati, R.; Darma, D.C. “Not viral, not popular”: What is the format for the development of iKN? In a participatory planning lens. Plan. Malays. 2024, 22, 166–183. [Google Scholar] [CrossRef]
  13. Rahmawati, R.; Rohmah, M.; Ulfah, Y.; Juwita, R.; Noor, M.F.; Arifin, Z. Becoming a viewer again? Optimizing educational tour at IKN Nusantara to encourage community enthusiasm. J. Perspekt. Pembiayaan Dan Pembang. Drh. 2023, 11, 159–174. [Google Scholar] [CrossRef]
  14. Syaban, A.S.N.; Appiah-Opoku, S. Unveiling the complexities of land use transition in Indonesia’s new capital city IKN Nusantara: A Multidimensional Conflict Analysis. Land 2024, 13, 606. [Google Scholar] [CrossRef]
  15. Rosyadi, R.; Hasid, Z.; Purwadi, P. Energy operations for resident and its implications for economic growth: Indonesia’s new capital city as a case study. Int. J. Energy Econ. Policy 2023, 13, 1–8. [Google Scholar] [CrossRef]
  16. Lestari, D.; Hasid, Z.; Busari, A.; Ananda, A.A. Multiplier effect of energy infrastructure on GRDP: Horizon in 3 production areas in East Kalimantan–Indonesia. Int. J. Energy Econ. Policy 2022, 12, 127–136. [Google Scholar] [CrossRef]
  17. Adejumo, O.O. Environmental quality vs economic growth in a developing economy: Complements or conflicts. Environ. Sci. Pollut. Res. Int. 2020, 27, 6163–6179. [Google Scholar] [CrossRef]
  18. Cialani, C. Economic growth and environmental quality: An econometric and a decomposition analysis. Manag. Environ. Qual. 2008, 18, 568–577. [Google Scholar] [CrossRef]
  19. Donkor, M.; Kong, Y.; Manu, E.K.; Ntarmah, A.H.; Appiah-Twum, F. Economic growth and environmental quality: Analysis of government expenditure and the causal effect. Int. J. Environ. Res. Public Health 2022, 19, 10629. [Google Scholar] [CrossRef]
  20. Indriana, I.; Ismail, N.A.; Rahmat, S.R. Gross domestic regional product, population and environmental quality: Analysis of 33 provinces in Indonesia. J. Appl. Bus. Tax. Econ. Res. 2021, 1, 51–65. [Google Scholar] [CrossRef]
  21. Liu, X.; Li, X.; Shi, H.; Yan, Y.; Wen, X. Effect of economic growth on environmental quality: Evidence from tropical countries with different income levels. Sci. Total Environ. 2021, 774, 145180. [Google Scholar] [CrossRef] [PubMed]
  22. Rifa’i, A.; Dewi, N.R. Environmental quality and economic growth: Evidence from 10 ASEAN countries. Sustinere J. Environ. Sustain. 2018, 2, 65–75. [Google Scholar] [CrossRef]
  23. Saidi, K.; Rahman, M.M. The link between environmental quality, economic growth, and energy use: New evidence from five OPEC countries. Environ. Syst. Decis. 2021, 41, 3–20. [Google Scholar] [CrossRef]
  24. Shafik, N. Economic development and environmental quality: An econometric analysis. Oxford Econ. Pap. 1994, 46, 757–773. [Google Scholar] [CrossRef]
  25. Wafiq, A.N.; Suryanto, S. The impact of population density and economic growth on environmental quality: Study in Indonesia. J. Ekon. Studi Pembang. 2021, 22, 301–312. [Google Scholar] [CrossRef]
  26. Yan, C.; Li, H.; Li, Z. Environmental pollution and economic growth: Evidence of SO2 emissions and GDP in China. Front. Public Health 2022, 10, 930780. [Google Scholar] [CrossRef]
  27. Sidique, O.; Sadiawati, D.; Pratami, D. Navigating Challenges of New City Development for Nusantara, Indonesia’s Future Capital. 2025. Available online: https://www.ipsnews.net/2023/09/navigating-challenges-new-city-development-nusantara-indonesias-future-capital/ (accessed on 7 February 2025).
  28. Thomsen, C. Sustainability (World Commission on Environment and Development Definition). In Encyclopedia of Corporate Social Responsibility; Idowu, S.O., Capaldi, N., Zu, L., Gupta, A.D., Eds.; Springer: Berlin/Heidelberg, Germany, 2013. [Google Scholar] [CrossRef]
  29. Wang, S.; Abbas, J.; Sial, M.S.; Álvarez-Otero, S.; Cioca, L.-I. Achieving green innovation and sustainable development goals through green knowledge management: Moderating role of organizational green culture. J. Innov. Knowl. 2022, 7, 100272. [Google Scholar] [CrossRef]
  30. Wu, L.; Qing, C.; Jin, S. Environmental protection and sustainable development of enterprises in China: The moderating role of media attention. Environ. Econ. Manag. 2022, 10, 966479. [Google Scholar] [CrossRef]
  31. Langhelle, O. Sustainable development and social justice: Expanding the Rawlsian framework of global justice. Environ. Values 2000, 9, 295–323. [Google Scholar] [CrossRef]
  32. Mensah, J. Sustainable development: Meaning, history, principles, pillars, and implications for human action: Literature review. Cog. Soc. Sci. 2019, 5, 1653531. [Google Scholar] [CrossRef]
  33. Waaswa, A.L.; Satognon, F. Development and the environment: Overview of the development planning process in agricultural sector, in Uganda. J. Sustain. Dev. 2020, 13, 1–10. [Google Scholar] [CrossRef]
  34. Zamroh, M.R.A. Pembangunan Berkelanjutan [In English: Sustainable Development]. 2020. Available online: https://geohepi.hepidev.com/2020/12/15/pembangunan-berkelanjutan/ (accessed on 25 September 2024).
  35. Sibe, J.P.; Chiatchoua, C.; Megne, M.N. The long run relationship between population growth and economic growth: A panel data analysis of 30 of the most populated Countries of the world. Análisis Económico 2016, 31, 205–218. [Google Scholar]
  36. Thornton, J. Population growth and economic growth: Long-run evidence from Latin America. South. Econ. J. 2021, 68, 464–468. [Google Scholar] [CrossRef]
  37. Peterson, E.W.F. The role of population in economic growth. Sage Open 2017, 7, 2158244017736094. [Google Scholar] [CrossRef]
  38. Brazelton, W.R. Alvin Harvey Hansen: Economic growth and a more perfect society: The economist’s role in defining the stagnation thesis and in popularizing Keynesianism. Am. J. Econ. Sociol. 1989, 48, 427–440. [Google Scholar] [CrossRef]
  39. Kothe, E.J.; Ling, M.; North, M.; Klas, A.; Mullan, B.A.; Novoradovskaya, L. Protection motivation theory and pro-environmental behaviour: A systematic mapping review. Aust. J. Psychol. 2019, 71, 411–432. [Google Scholar] [CrossRef]
  40. Stern, D. Progress on the environmental Kuznets curve? Environ. Dev. Econ. 1998, 3, 173–196. [Google Scholar] [CrossRef]
  41. Fuhr, H. The rise of the Global South and the rise in carbon emissions. Third World Q. 2021, 42, 2724–2746. [Google Scholar] [CrossRef]
  42. Meng, J.; Huo, J.; Zhang, Z.; Liu, Y.; Mi, Z.; Guan, D.; Feng, K. The narrowing gap in developed and developing country emission intensities reduces global trade’s carbon leakage. Nat. Commun. 2023, 14, 3775. [Google Scholar] [CrossRef]
  43. Jia, J.; Xin, L.; Lu, C.; Wu, B.; Zhong, Y. China’s CO2 emissions: A systematical decomposition concurrently from multi-sectors and multi-stages since 1980 by an extended logarithmic mean divisia index. Energy Strategy Rev. 2023, 49, 101141. [Google Scholar] [CrossRef]
  44. Arrow, K.; Bolin, B.; Costanza, R.; Dasgupta, P.; Folke, C.; Holling, C.S.; Jansson, B.-O.; Levin, S.; Mäler, K.-G.; Perrings, C.; et al. Economic growth, carrying capacity, and the environment. Ecol. Econ. 1995, 15, 91–95. [Google Scholar] [CrossRef]
  45. Hasid, Z.; Mire, M.S.; Rochaida, E.; Wijaya, A. Power generation infrastructure and its effect on electric energy consumption: Context in Indonesia, 2013–2020. Int. J. Energy Econ. Pol. 2023, 13, 52–60. [Google Scholar] [CrossRef]
  46. Addai, K.; Serener, B.; Kirikkaleli, D. Can environmental sustainability be decoupled from economic growth? Empirical evidence from Eastern Europe using the common correlated effect mean group test. Reg. Sustain. 2023, 4, 68–80. [Google Scholar] [CrossRef]
  47. Awan, A.G. Relationship between environment and sustainable economic development: A theoretical approach to environmental problems. Int. J. Asian Soc. Sci. 2013, 3, 741–761. [Google Scholar]
  48. Brad, S.; Mocan, B.; Brad, E.; Fulea, M. Environmentally sustainable economic growth. Amfiteatru Econ. J. 2016, 18, 446–460. [Google Scholar]
  49. Čábelková, I.; Smutka, L.; Mareš, D.; Ortikov, A.; Kontsevaya, S. Environmental protection or economic growth? The effects of preferences for individual freedoms. Environ. Econ. Manag. 2023, 11, 1129236. [Google Scholar] [CrossRef]
  50. Cai, J.; Chen, Q.; Zhang, Z. Balancing environmental sustainability and economic development: Perspectives from new structural economics. Sustainability 2024, 16, 1124. [Google Scholar] [CrossRef]
  51. Shen, D. Environmental sustainability and economic development: A world view. J. Econ. Sustain. Dev. 2015, 6, 60–80. [Google Scholar]
  52. Adebayo, T.S.; Agboola, M.O.; Rjoub, H.; Adeshola, I.; Agyekum, E.B.; Kumar, N.M. Linking economic growth, urbanization, and environmental degradation in China: What is the role of hydroelectricity consumption? Int. J. Environ. Res. Public Health. 2021, 18, 6975. [Google Scholar] [CrossRef]
  53. das Neves Almeida, T.A.; Cruz, L.; Barata, E.; García-Sánche, I.-M. Economic growth and environmental impacts: An analysis based on a composite index of environmental damage. Ecol. Indic. 2017, 76, 119–130. [Google Scholar] [CrossRef]
  54. Kahuthu, A. Economic growth and environmental degradation in a global context. Environ. Dev. Sustain. 2006, 8, 55–68. [Google Scholar] [CrossRef]
  55. Ondaye, G.; Ondze, C.; Imongui, E. Effects of economic growth on environmental degradation in the Republic of Congo: The case of CO2 emissions. Mod. Econ. 2021, 12, 1703–1717. [Google Scholar] [CrossRef]
  56. Pettinger, T. Environmental Impact of Economic Growth. 2021. Available online: https://www.economicshelp.org/blog/145989/economics/environmental-impact-of-economic-growth/#:~:text=The%20environmental%20impact%20of%20economic,potential%20loss%20of%20environmental%20habitats (accessed on 3 August 2024).
  57. Zhao, X.; Jiang, M.; Zhang, W. The impact of environmental pollution and economic growth on public health: Evidence from China. Front. Public Health 2022, 10, 861157. [Google Scholar] [CrossRef] [PubMed]
  58. Prawitasari, N.; Amarullah, R.; Sari, M.A.P.; Azizah, T.N.; Sartika, D.; Kusumaningrum, M.; Wahyuni, T.; Hidayah, K.; Permadi, R.N. Public servant competency development of national capital (IKN) buffer regions as a policy approach in Indonesia. Eur. J. Bus. Manag. 2023, 15, 76–88. [Google Scholar]
  59. Central Statistics Agency-East Kalimantan. Laju Pertumbuhan Produk Domestik Regional Bruto Atas Dasar harga Konstan 2010 Menurut Kabupaten/Kota [In English: Growth Rate of Gross Regional Domestic Product at Constant 2010 Prices by District/City]. 2024. Available online: https://kaltim.bps.go.id/indicator/157/95/1/-seri-2010-laju-pertumbuhan-pdrb-kabupaten-kota-atas-dasar-harga-konstan-2010.html (accessed on 15 October 2024).
  60. Ministry of Environment and Forestry-Republic of Indonesia. Indeks Kualitas Lingkungan Hidup Indonesia [In English: Indonesian Environmental Quality Index]; Directorate General of Pollution and Environmental Damage Control: Jakarta, Indonesia, 2024. [Google Scholar]
  61. Kurniawan, E.; Zulfikar, A.L.; Wijaya, A.; Darma, D.C. Harmonization of trading partners between Indonesia–Italy: Empirical calculations of selected agricultural commodities. Indones. J. Dev. Plan. 2024, 8, 91–117. [Google Scholar] [CrossRef]
  62. Chakravarty, D.; Mandal, S.K. Is economic growth a cause or cure for environmental degradation? Empirical evidences from selected developing economies. Environ. Sustain. Indic. 2020, 7, 100045. [Google Scholar] [CrossRef]
  63. Grossman, G.M.; Krueger, A.B. Economic growth and the environment. Q. J. Econ. 1995, 110, 353–377. [Google Scholar] [CrossRef]
  64. Priyagus, P. Does economic growth efficient and environmental safety? The case of transportation sector in Indonesia. Int. J. Energy Econ. Pol. 2022, 11, 365–372. [Google Scholar]
  65. Yang, L.; Yuan, S.; Sun, L. The relationships between economic growth and environmental pollution based on time series data? An empirical study of Zhejiang Province. J. Camb. Stud. 2012, 7, 33–42. [Google Scholar] [CrossRef]
  66. Castiglione, C.; Infante, D.; Smirnova, J. Environment and economic growth: Is the rule of law the go-between? The case of high-income countries. Energy Sustain. Soc. 2015, 5, 1–7. [Google Scholar] [CrossRef]
  67. Everett, T.; Ishwaran, M.; Ansaloni, G.P.; Rubin, A. Economic growth and the environment. In Paper 2: Defra Evidence and Analysis Serie; The Department for Environment, Food & Rural Affairs: London, UK, 2010. Available online: https://assets.publishing.service.gov.uk/government/uploads/system/uploads/attachment_data/file/69195/pb13390-economic-growth-100305.pdf (accessed on 29 November 2024).
  68. Gedikli, A. An investigation of the reasons for the natural resource curse: Selected country cases. Buss. Econ. Res. J. 2019, 11, 15–31. [Google Scholar] [CrossRef]
  69. Karabegović, A. Institutions, Economic Growth, and The “Curse” of Natural Resources. In Studies in Mining Policy; MacMahon, F., Ed.; Fraser Institute: Vancouver, BC, Canada, 2009; Available online: https://www.fraserinstitute.org/sites/default/files/CurseofNaturalResources2009.pdf (accessed on 10 December 2024).
  70. Moradbeigi, M.; Law, S.H. Growth volatility and resource curse: Does financial development dampen oil shocks? Res. Pol. 2016, 48, 97–103. [Google Scholar] [CrossRef]
  71. Di John, J. Is there really a resource curse? A critical survey of theory and evidence. Glob. Gov. 2021, 17, 167–184. [Google Scholar] [CrossRef]
  72. de Ferranti, D.; Perry, G.E.; Lederman, D.; Maloney, W.F. From Natural Resources to Knowledge Economy; World Bank Latin American and Caribbean Studies: Washington, DC, USA, 2002. [Google Scholar] [CrossRef]
  73. Wright, G.; Czelusta, J. Resource-Based Growth: Past and Present. In Natural Resources: Neither Curse nor Destiny; Lederman, D., Maloney, W.F., Eds.; World Bank: Washington, DC, USA, 2007; pp. 183–212. [Google Scholar]
  74. Sachs, J.D.; Warner, A.M. The curse of natural resources. Eur. Econ. Rev. 2001, 45, 827–838. [Google Scholar] [CrossRef]
  75. Gylfason, T. Natural resources, education, and economic development. Eur. Econ. Rev. 2001, 45, 847–859. [Google Scholar] [CrossRef]
  76. Gylfason, T.; Herbertsson, T.T.; Zoega, G. A mixed blessing: Natural resources and economic growth. Macroecon. Dyn. 1999, 3, 204–225. [Google Scholar] [CrossRef]
  77. Leite, C.A.; Weidmann, J. Does Mother Nature Corrupt? Natural Resources, Corruption, and Economic Growth. IMF Working Papers, No. 99/85; IMF: Washington, DC, USA, 1999; Available online: https://www.imf.org/en/Publications/WP/Issues/2016/12/30/Does-Mother-Nature-Corrupt-Natural-Resources-Corruption-and-Economic-Growth-3126 (accessed on 4 December 2024).
  78. Wulandari, C.; Hayati, B. The relationship between economic development and environmental degradation in Indonesia. Econ. Dev. Anal. J. 2020, 9, 328–342. Available online: https://journal.unnes.ac.id/sju/edaj/article/view/38159 (accessed on 15 December 2024).
  79. Raihan, A.; Begum, R.A.; Said, M.N.M.; Pereira, J.J. Relationship between economic growth, renewable energy use, technological innovation, and carbon emission toward achieving Malaysia’s Paris agreement. Environ. Syst. Decis. 2022, 42, 586–607. [Google Scholar] [CrossRef]
  80. Leonardo, D.; Maulana, M.; Hartanto, J. Impact of economic growth and FDI on Indonesia environmental degradation: EKC and pollution hypothesis testing. J. Ekon. Pembang. 2023, 21, 15–30. [Google Scholar] [CrossRef]
  81. Humbatova, S.I.; Hajiyeva, N.; Fodor, M.G.; Sood, K.; Grima, S. The impact of economic growth on the ecological environment and renewable energy production: Evidence from Azerbaijan and Hungary. J. Risk Finan. Manag. 2024, 17, 275. [Google Scholar] [CrossRef]
  82. Osuntuyi, B.V.; Lean, H.H. Economic growth, energy consumption and environmental degradation nexus in heterogeneous countries: Does education matter? Environ. Sci. Eur. 2022, 34, 48. [Google Scholar] [CrossRef]
  83. Dardouri, N.; Smida, M. The link between economic growth and ecological footprint: What future prospects for the G7 Countries: PMG-ARDL. Migr. Let. 2023, 21, 50–65. [Google Scholar] [CrossRef]
  84. Yu, Y.; Li, K.; Duan, S.; Song, C. Economic growth and environmental pollution in China: New evidence from government work reports. Energy Econ. 2023, 124, 106803. [Google Scholar] [CrossRef]
  85. Acheampong, A.O.; Osei Opoku, E.E. Environmental degradation and economic growth: Investigating linkages and potential pathways. Energy Econ. 2023, 123, 106734. [Google Scholar] [CrossRef]
  86. Xu, Y.; Li, X.; Yuan, P.; Zhang, Y. Trade-off between environment and economy: The relationship between carbon and inflation. Front. Environ. Sci. 2023, 11, 1093528. [Google Scholar] [CrossRef]
  87. Velenturf, P.M.; Purnell, P. Principles for a sustainable circular economy. Sustain. Prod. Consum. 2021, 27, 1437–1457. [Google Scholar] [CrossRef]
  88. Qamruzzaman, M. Do natural resources bestow or curse the environmental sustainability in Cambodia? Nexus between clean energy, urbanization, and financial deepening, natural resources, and environmental sustainability. Energy Strategy Rev. 2024, 53, 101412. [Google Scholar] [CrossRef]
  89. Hariram, N.P.; Mekha, K.B.; Suganthan, V.; Sudhakar, K. Sustainalism: An integrated socio-economic-environmental model to address sustainable development and sustainability. Sustainabilty 2023, 15, 10682. [Google Scholar] [CrossRef]
  90. Ekins, P.; Zenghelis, D. The costs and benefits of environmental sustainability. Sustain. Sci. 2021, 16, 949–965. [Google Scholar] [CrossRef]
  91. Badulescu, D.; Simut, R.; Badulescu, A.; Badulescu, A.V. The relative effects of economic growth, environmental pollution and non-communicable diseases on health expenditures in European Union Countries. Int. J. Environ. Res. Public Health. 2019, 16, 5115. [Google Scholar] [CrossRef]
  92. Dianjaya, A.R.; Epira, P. Indonesia green economy implementation readiness of greenhouse gas emissions reduction. J. Contemp. Gov. Public Policy 2020, 1, 27–40. [Google Scholar] [CrossRef]
  93. Wijayanti, Y.R.; Sari, I.C. Reinvigorating sustainable green economics in Indonesia: Exploring the nexus between global green economy index and SDG 8. J. Indones. Sustain. Dev. Plan. 2024, 5, 203–216. [Google Scholar] [CrossRef]
  94. Suparjo, S.; Darma, S.; Kurniadin, N.; Kasuma, J.; Priyagus, P.; Darma, D.C.; Haryadi, H. Indonesia’s new SDGs agenda for green growth—Emphasis in the energy sector. Int. J. Energy Econ. Policy 2021, 11, 395–402. [Google Scholar] [CrossRef]
Figure 1. Map IKN based on clusters. Source: Syaban and Appiah-Opoku [14].
Sustainability 17 01656 g001
Figure 2. The relationship between economic, social, and environmental factors in sustainable development. Source: Waaswa and Satognon [33].
Sustainability 17 01656 g002
Figure 4. Linear trendline graph in model 1.
Sustainability 17 01656 g004
Figure 5. Linear trendline graph in model 2.
Sustainability 17 01656 g005
Table 1. Economic growth in PPU, Paser, Balikpapan, Samarinda, and Kutai Kartanegara.
Region2017201820192020202120222023
PPU3.132.644.7−2.92.554.486.22
Paser5.175.075.09−1.824.85.074.46
Balikpapan6.735.616.12−1.413.596.454.14
Samarinda5.285.084.091.823.485.114.84
Kutai Kartanegara6.85.366.89−1.093.995.324.94
Indonesia5.075.175.02−2.073.75.315.05
Source: Central Statistics Agency-East Kalimantan [59].
Table 2. IKLH in PPU, Paser, Balikpapan, Samarinda, and Kutai Kartanegara.
Region2017201820192020202120222023
PPU75.6585.980.8776.4575.0674.4676.15
Paser74.1773.0965.9270.0773.2262.3962.9
Balikpapan71.4775.7174.272.7475.2973.9773.41
Samarinda69.3868.7861.9468.4371.0368.4373.5
Kutai Kartanegara81.8786.8878.9878.4975.0674.4680.95
Indonesia66.4671.6766.5570.2771.4372.4272.54
Source: Ministry of Environment and Forestry-Republic of Indonesia [60].
Table 3. Profile of variables.
Variable NameSourceParameterObservation Period
Economic growthCentral Statistics Agency-East
Kalimantan [59]
Percent (%)2017–2023
Environmental qualityMinistry of Environment and
Forestry-Republic of Indonesia [60]
Index (points)2017–2023
Table 4. Descriptive statistics and correlation coefficients.
ItemsEconomic GrowthEnvironmental Quality
Mean4.0573.75
Median4.8474.17
Maximum6.8986.88
Minimum−2.9061.94
Std. deviation2.455.80
Pearson0.959 (0.009) **
Kendall’s tau0.580 (0.016) *
Spearman’s rho0.587 (0.037) *
Obs.3535
Symbol notation: * p < 0.05 and ** p < 0.01.
Table 5. Panel data regression results.
ItemsModel 1
(Economic Growth →
Environmental Quality)
Model 2
(Environmental Quality → Economic Growth)
Constant37.909 (0.000) **8.693 (0.043) *
Coefficients0.9590.493
t-statistics3.0522.693
Prob.0.009 **0.027 *
Lower bound−0.817−0.146
Upper bound0.8600.153
F-statistics4.6052.485
Prob.0.003 **0.023 *
Std. error5.8833.767
Obs.3535
Symbol notation: * p < 0.05 and ** p < 0.01.
Table 6. Comparison between past studies.
Authorships Variables (Substance)ModelSign
Wulandari and Hayati [78]Economic growth → Environmental degradationVector Error Correction Model (VECM)+
Liu et al. [21]GDP per capita → Terrestrial carbon sequestrationPanel Model+
Raihan et al. [79]Economic growth → CO2 emissionsDynamic Ordinary Least Squares (DOLS)+
Leonardo et al. [80]Economic growth → Environmental degradationError Correction Model (ECM)+
Humbatova et al. [81] Economic growth → Ecological environmentAutoregressive Distributed Lag (ARDL)+
Osuntuyi and Lean [82]Economic growth ↔ Environmental damageFully Modified Ordinary Least Squares (FMOLS), DLOS, PMG-Autoregressive Distributed Lag (PMG-ARDL), and Common Correlated Effects Mean Group (CCEMG)+
Dardouri and Smida [83]GDP → Ecological footprintPMG-ARDL+
Yu et al. [84]Economic growth → Environmental damageTwo-Stage Least Square (2SLS)+
Acheampong and Opoku [85]Environmental degradation → Economic growthMoments Technique Method with Global Panel-
Xu et al. [86]Carbon → InflationOrdinary Least Square (OLS) Regression+
Disclaimer/Publisher’s Note: The statements, opinions and data contained in all publications are solely those of the individual author(s) and contributor(s) and not of MDPI and/or the editor(s). MDPI and/or the editor(s) disclaim responsibility for any injury to people or property resulting from any ideas, methods, instructions or products referred to in the content.

