Article

The Impact of Multidimensional Relational Network Embedding on the Carbon Emission Reductions of Manufacturing Enterprises: From the Mediating and Regulating Roles of Technological Innovation

1
Jiangxi Economic Development Research Institute, Jiangxi Normal University, Nanchang 330022, China
2
Regional Development Research Institute, Jiangxi Normal University, Nanchang 330022, China
*
Author to whom correspondence should be addressed.
Sustainability 2025, 17(4), 1655; https://doi.org/10.3390/su17041655
Submission received: 13 January 2025 / Revised: 13 February 2025 / Accepted: 15 February 2025 / Published: 17 February 2025

Abstract

:
Promoting low-carbon, green development in the industrial sector is crucial for the sustainable development of the economy and society in China. As the micro-entity of industrial carbon reduction, the question of how to enhance the carbon reduction capacity of industrial enterprises has attracted widespread attention. Research suggests that a multidimensional relationship network, consisting of government, market, industry, and public networks and network reputation, significantly influences enterprises’ carbon emission performance. Based on the survey data of 1226 manufacturing enterprises, this study empirically examines the impact of multidimensional relationship network on the carbon emissions of enterprises and its mechanism from a micro-perspective. The findings reveal that relational network embedding significantly reduces the carbon emission intensity, and the reduction effect becomes stronger as the embedding degree increases. Compared to the government and industry networks, the market network, public network, and network reputation have a more significant impact on carbon emission reduction. The heterogeneity analysis shows that the reduction effect is more significant in enterprises with a higher carbon emission intensity and digital level. The mechanism analysis also highlights the role of technological innovation as a mediator and regulator in strengthening the carbon emission reduction effect of relationship network embedding.

1. Introduction

China’s economy has experienced rapid growth, characterized by high levels of investment and high resource consumption, resulting in significant carbon emissions. In 2022, China’s cumulative carbon emissions reached 11 billion tons, accounting for 28.87% of global emissions [1]. Industrial emissions constituted 38.18% of the national emissions and ranked second after the power sector. Therefore, it is crucial for China to promote low-carbon development in the industrial sector to achieve its carbon peak and neutrality goals. In order to reduce carbon emissions, Chinese governments have taken many measures, such as adopting clean energy consumption structure, developing circular economy, promoting green technology innovation, and so on.
Existing studies have mainly analyzed the drivers of carbon emission reduction at the national [2], provincial [3], city [4], and industry [5] levels from a macro-perspective. As the stakeholders involved in global warming, industrial enterprises play an important role in carbon emission reduction. However, the studies related to enhancing industrial enterprises’ carbon reduction capabilities are not abundant. The limited existing literature mainly explores the internal and external driving factors of enterprises’ carbon reduction efforts. The internal factors mainly include the enterprise’s nature of ownership, its size, the characteristics of its management, and industry attributes [6,7,8,9,10]. Meanwhile, the external factors mainly include the development of industrial clusters, financial constraints, the market characteristics, carbon reduction policies, and environmental regulations [11,12,13,14]. Previous studies have applied a variety of models to analyze these drivers, including multiple linear regression models [10,14], GMM methods [2], and Heckman models [15]. Moreover, some studies have used spatial econometric models [3] to analyze the spatial spillover effects on carbon reduction, and some have applied machine learning to predict and assess the effects of the total carbon emissions and its drivers [16,17].
However, to the best of our knowledge, there are few studies that focus on relational networks, which are proven to impact the social actors’ decision making and behavior [18]. The related existing literature can be broadly categorized into the following three groups. Firstly, the definition and measurement of relational networks [19,20,21,22,23]. The relational networks are the basis for the generation of social capital, enabling enterprises to access information and resources with other organizations or people in the relationship network, thus influencing enterprises’ behavioral decisions [23,24,25]. Regarding the measurement of relational networks, some studies have applied single-dimension metrics [26,27], while some researchers have used multidimensional metrics [22,23,28,29]. Compared to single-dimension measurement, multidimensional metrics can fully and completely reflect corporate relational networks, which mainly include government networks, industry networks, public networks, and bank or associated organization networks [22,23,28,29,30,31]. The second group of research focuses on the effects of relationship networks on carbon emissions. Previous studies suggest that the embedding of relational networks has an inhibitory effect on carbon emissions at the national [30], provincial [32], and enterprise levels [33,34]. Conversely, some studies indicate it has a promoting effect on carbon emissions [2,35]. Additionally, it has been stated to have a spatial spillover effect on carbon emissions [3,4,36]. In the third type of research, technological innovation is proven to be the most common mediator between relational networks and carbon reduction [33,37]. Specifically, relational networks can increase investment in technological innovation related to energy conservation and emission reduction and thus restrict carbon emissions [38]. However, it is also indicated that technological innovation plays a regulating role in the influence of relational networks on carbon emissions, specifically manifesting that the level of technological innovation effectively enhances the inhibitory effect of relational networks on carbon emission intensity [37,39].
Our work contributes to the relevant literature in three ways. Firstly, to the best of our knowledge, the existing literature generally focuses on the impact of the individual social networks on its carbon emissions, and it ignores the roles of market players, industry networks, public networks, and the network reputation surrounding the enterprise [2,9,37,40]. Therefore, we regard the enterprise as a social entity and propose the theoretical combination of the multidimensional relationship networks of the enterprise, including government networks, market networks, industry networks, public networks, and the network reputation. This study empirically investigated the impact of multidimensional relational networks on enterprises’ carbon reductions and verifies the different impacts among various networks. Our findings contribute to the current arguments about the role of relational networks in achieving emission reductions among enterprises. Secondly, the existing literature mainly focuses on the economic performance of an enterprise’s relational network [23,24,25,26,41,42], while few studies pay attention to its environmental impact. To fill this gap, this work explores the impact of an enterprise’s relational network on its carbon emission reductions. Our findings provide empirical support and precise policy recommendations regarding the carbon emission reductions of industrial enterprises and regional sustainable development. Thirdly, there is little quantitative discussion of the mechanism behind this. This work attempts to identify the mediating and regulating roles in the impact of an enterprise’s relational network on its carbon emission reductions. Our findings offer a useful addition to the literature related to relational networks and their mediating effects.
This work is organized as follows. Section 2 documents the theoretical analysis and research hypothesis. Section 3 describes the data and method used. Section 4 provides the empirical estimation results, which include the baseline results, a series of robustness tests, a heterogeneity analysis, and mechanism examination. Section 5 concludes this work and provides policy recommendations.

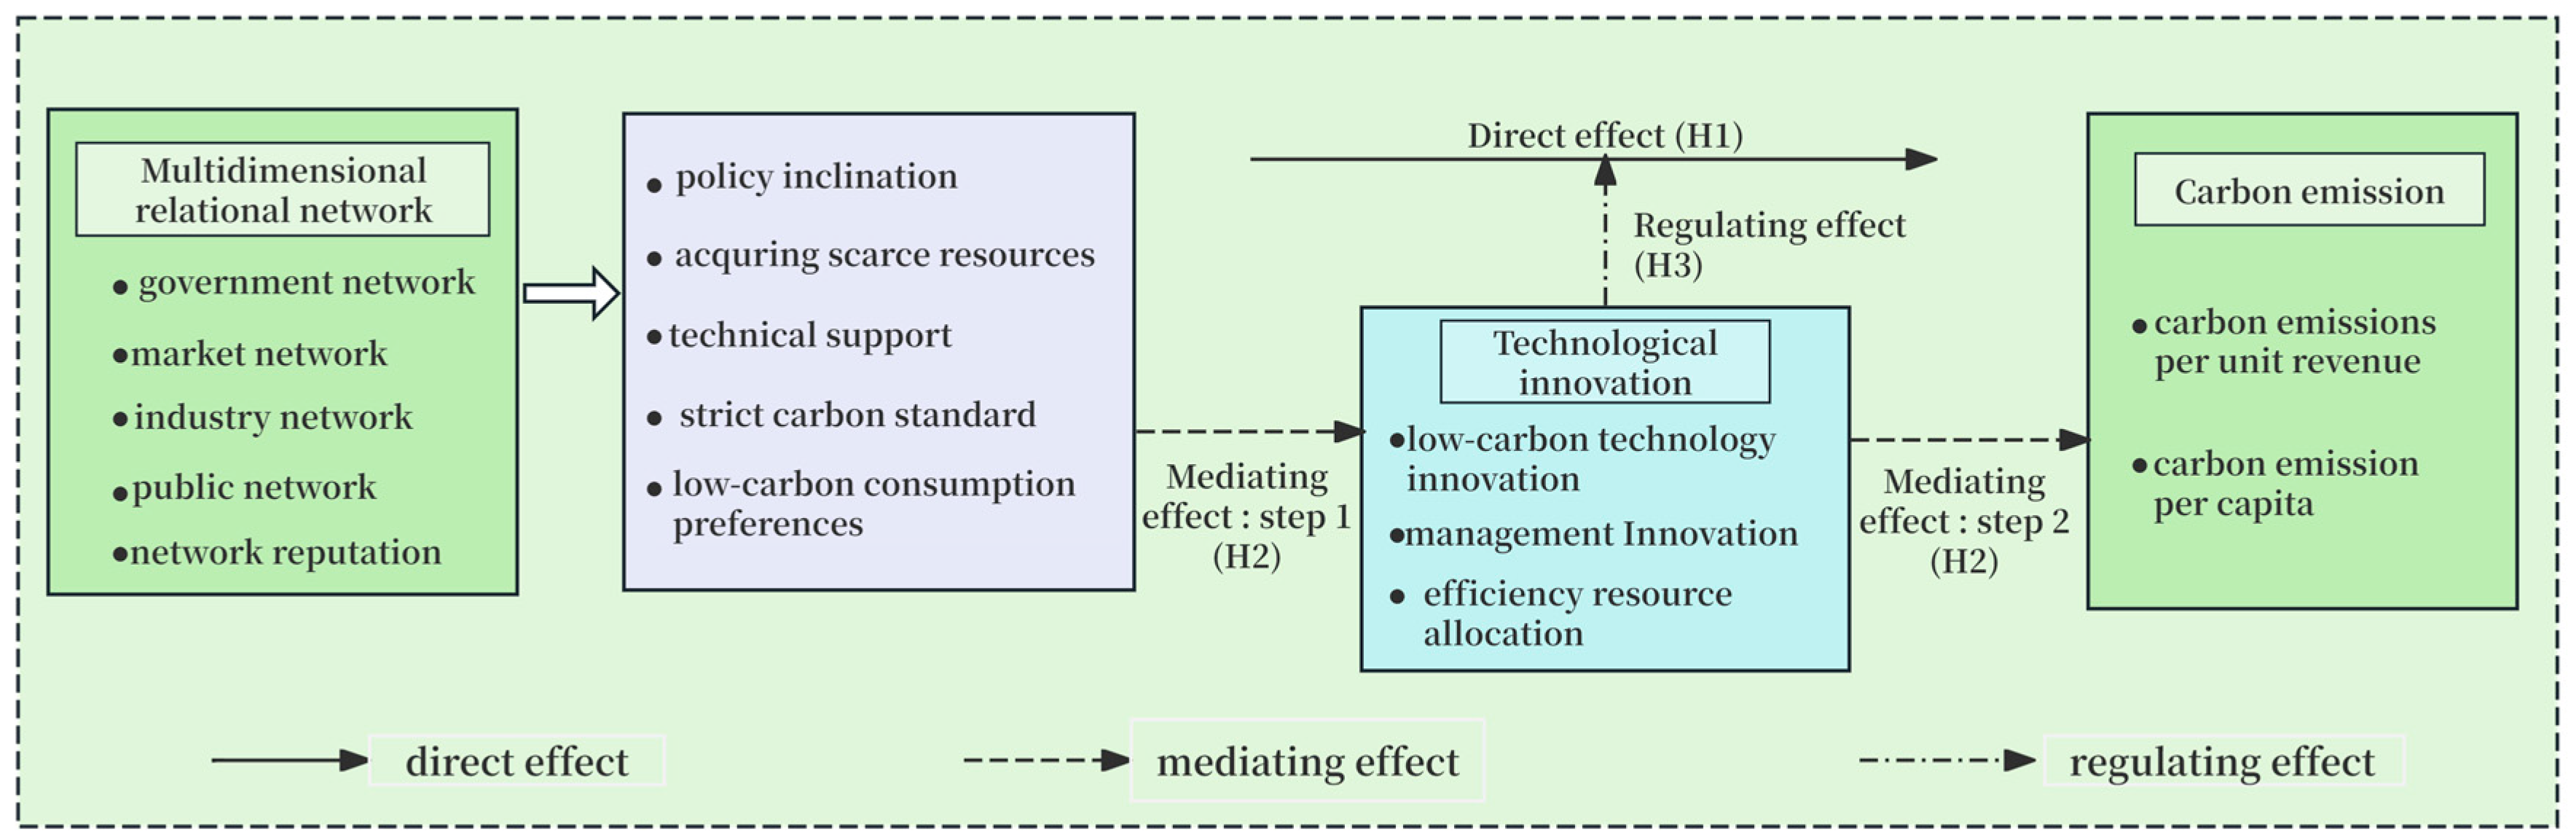
2. Theoretical Analysis and Research Hypothesis

2.1. Direct Impact of Relational Networks on Carbon Emissions of Enterprises

According to embedding theory, enterprises operate within a social structure and their behavior is influenced by relational networks, which involve resource exchanges with other organizations or individuals and contribute to the formation of social capital [20,43,44]. Enterprises rely on relational networks to acquire information resources due to limitations in their knowledge and capabilities. These relational networks extend beyond relationships with governments, markets, and industries [28,45] to include public relations networks [15] and network reputation [23]. In this study, the multidimensional relational network of an enterprise was constructed from five dimensions, namely, the government network, market network, industry network, public network, and network reputation (refer to Figure 1). Specifically, the government network encompasses the formal and informal relationships between enterprises and the government, while the market network reflects the enterprise’s participation in the market and its compliance with market regulations. The industry network indicates the enterprise’s involvement in industry organizations, such as industry associations. The public network encompasses the relationships between the enterprise and its consumers, with the brand culture representing the emotional connection established between these parties. The network reputation refers to the emotional bond connecting the enterprise and society, which is influenced by stakeholders’ perceptions and evaluations.
The various dimensions of an enterprise’s relational network can have different impacts on its carbon emissions. Firstly, the impact of an enterprise’s government network on carbon emissions is unclear. Above all, close relationships with the government can lead to financial support, subsidies and access to limited resources [46,47], encouraging enterprises to implement carbon reduction efforts in response to the government’s low-carbon policies [23,48]. In addition, government relationships may increase the risk of over-investment, leading to a crowding-out effect on green investments and potentially resulting in increased carbon emissions or pollution [15,35]. Moreover, the government provides a safe haven effect, meaning that enterprises with government networks are more likely to experience reduced penalties or even avoid punishment for their environmental vandalism, resulting in a lack of motivation for enterprises to reduce their carbon emissions [2,35]. Secondly, the market network is expected to effectively restrain the enterprise’s carbon emissions, as enterprises operating in the international trade market face stringent environmental standards and need to continuously invest in carbon reduction to ensure the acceptance of their products or services [40,45,49]. Thirdly, an enterprise’s industry network is expected to contribute to carbon emission reduction. Industry associations play a crucial role in resource integration and establishing connections within the network [28]. First, industry associations may set stricter carbon reduction standards and actively engage in standard setting to drive industry-wide transformation towards environmental friendliness [23]. Furthermore, industry associations directly provide actionable carbon reduction standards to enterprises, reducing the costs associated with exploring carbon reduction measures [23]. Fourthly, an enterprise’s public relational network is anticipated to have a restraining effect on its carbon emissions. With the growing environmental demands from the public, as well as increasing consumer preferences for low-carbon products, enterprises are motivated to fulfill their environmental responsibilities and gain recognition and support [15]. Finally, an enterprise’s network reputation is expected to contribute to carbon emission reduction. Enterprises with a positive reputation earn trust from other institutions, facilitating access to convenient financing channels, advanced carbon reduction technologies, and beneficial social resources, thereby enhancing their capacity for carbon reduction [50]. Based on the above, this study proposes the following hypothesis.
H1: 
A multidimensional relational network restrains carbon emissions in enterprises.

2.2. Theoretical Mechanism Behind Relational Networks and Carbon Emissions of Enterprises

2.2.1. Mediating Role of Technological Innovation

A multidimensional relational network provides increased opportunities and channels for connection with external organizations, facilitating enhancements in an enterprise’s technological innovation [51,52]. Firstly, extensive integration within a multidimensional relational network enables effective resource allocation and optimization to support innovation activities, motivating enterprises to increase their research and investment in innovation [22]. Secondly, collaboration between enterprises and network actors promotes the two-way flow of technology, allowing enterprises to obtain valuable knowledge and technological support, thereby enhancing their technological innovation [53,54]. Furthermore, the multidimensional relational network breaks down the information barriers between different departments and industries through collaboration, communication, and information sharing, thereby enhancing enterprises’ technological innovation [22].
Furthermore, a multidimensional relational network can also lead to a reduction in enterprises’ carbon emissions by promoting their technological innovation. Low-carbon innovation activities play a crucial role in the process of carbon reduction [50]. Through information exchange with various network actors, enterprises can access innovative ideas and cutting-edge technologies related to green and low-carbon practices, thereby promoting their technological innovation and enabling a transition from the traditional, inefficient production modes to environmentally friendly ones. Moreover, enterprises often adopt environmentally friendly and long-lasting green technological innovations to gain societal recognition and meet the green and low-carbon requirements of their stakeholders [33].

2.2.2. Regulating Role of Technological Innovation

Enterprises with stronger technological innovation can effectively absorb, transform, integrate, and commercialize various low-carbon technologies and knowledge obtained through relational networks, thereby enhancing their resource utilization efficiency and achieving their carbon reduction targets [53,55]. Moreover, these enterprises communicate their technological advantages in terms of energy conservation and emission reduction to banking institutions, the general public, and other stakeholders, leading to increased financial support, consumer endorsement, and further motivation to reduce their carbon emissions [37]. Based on the above, the following hypotheses are proposed in this study.
H2: 
Technological innovation mediates the influence of multidimensional relational networks on the carbon emissions of enterprises.
H3: 
Technological innovation regulates the influence of multidimensional relational networks on enterprises’ carbon emissions.

3. Data and Methods

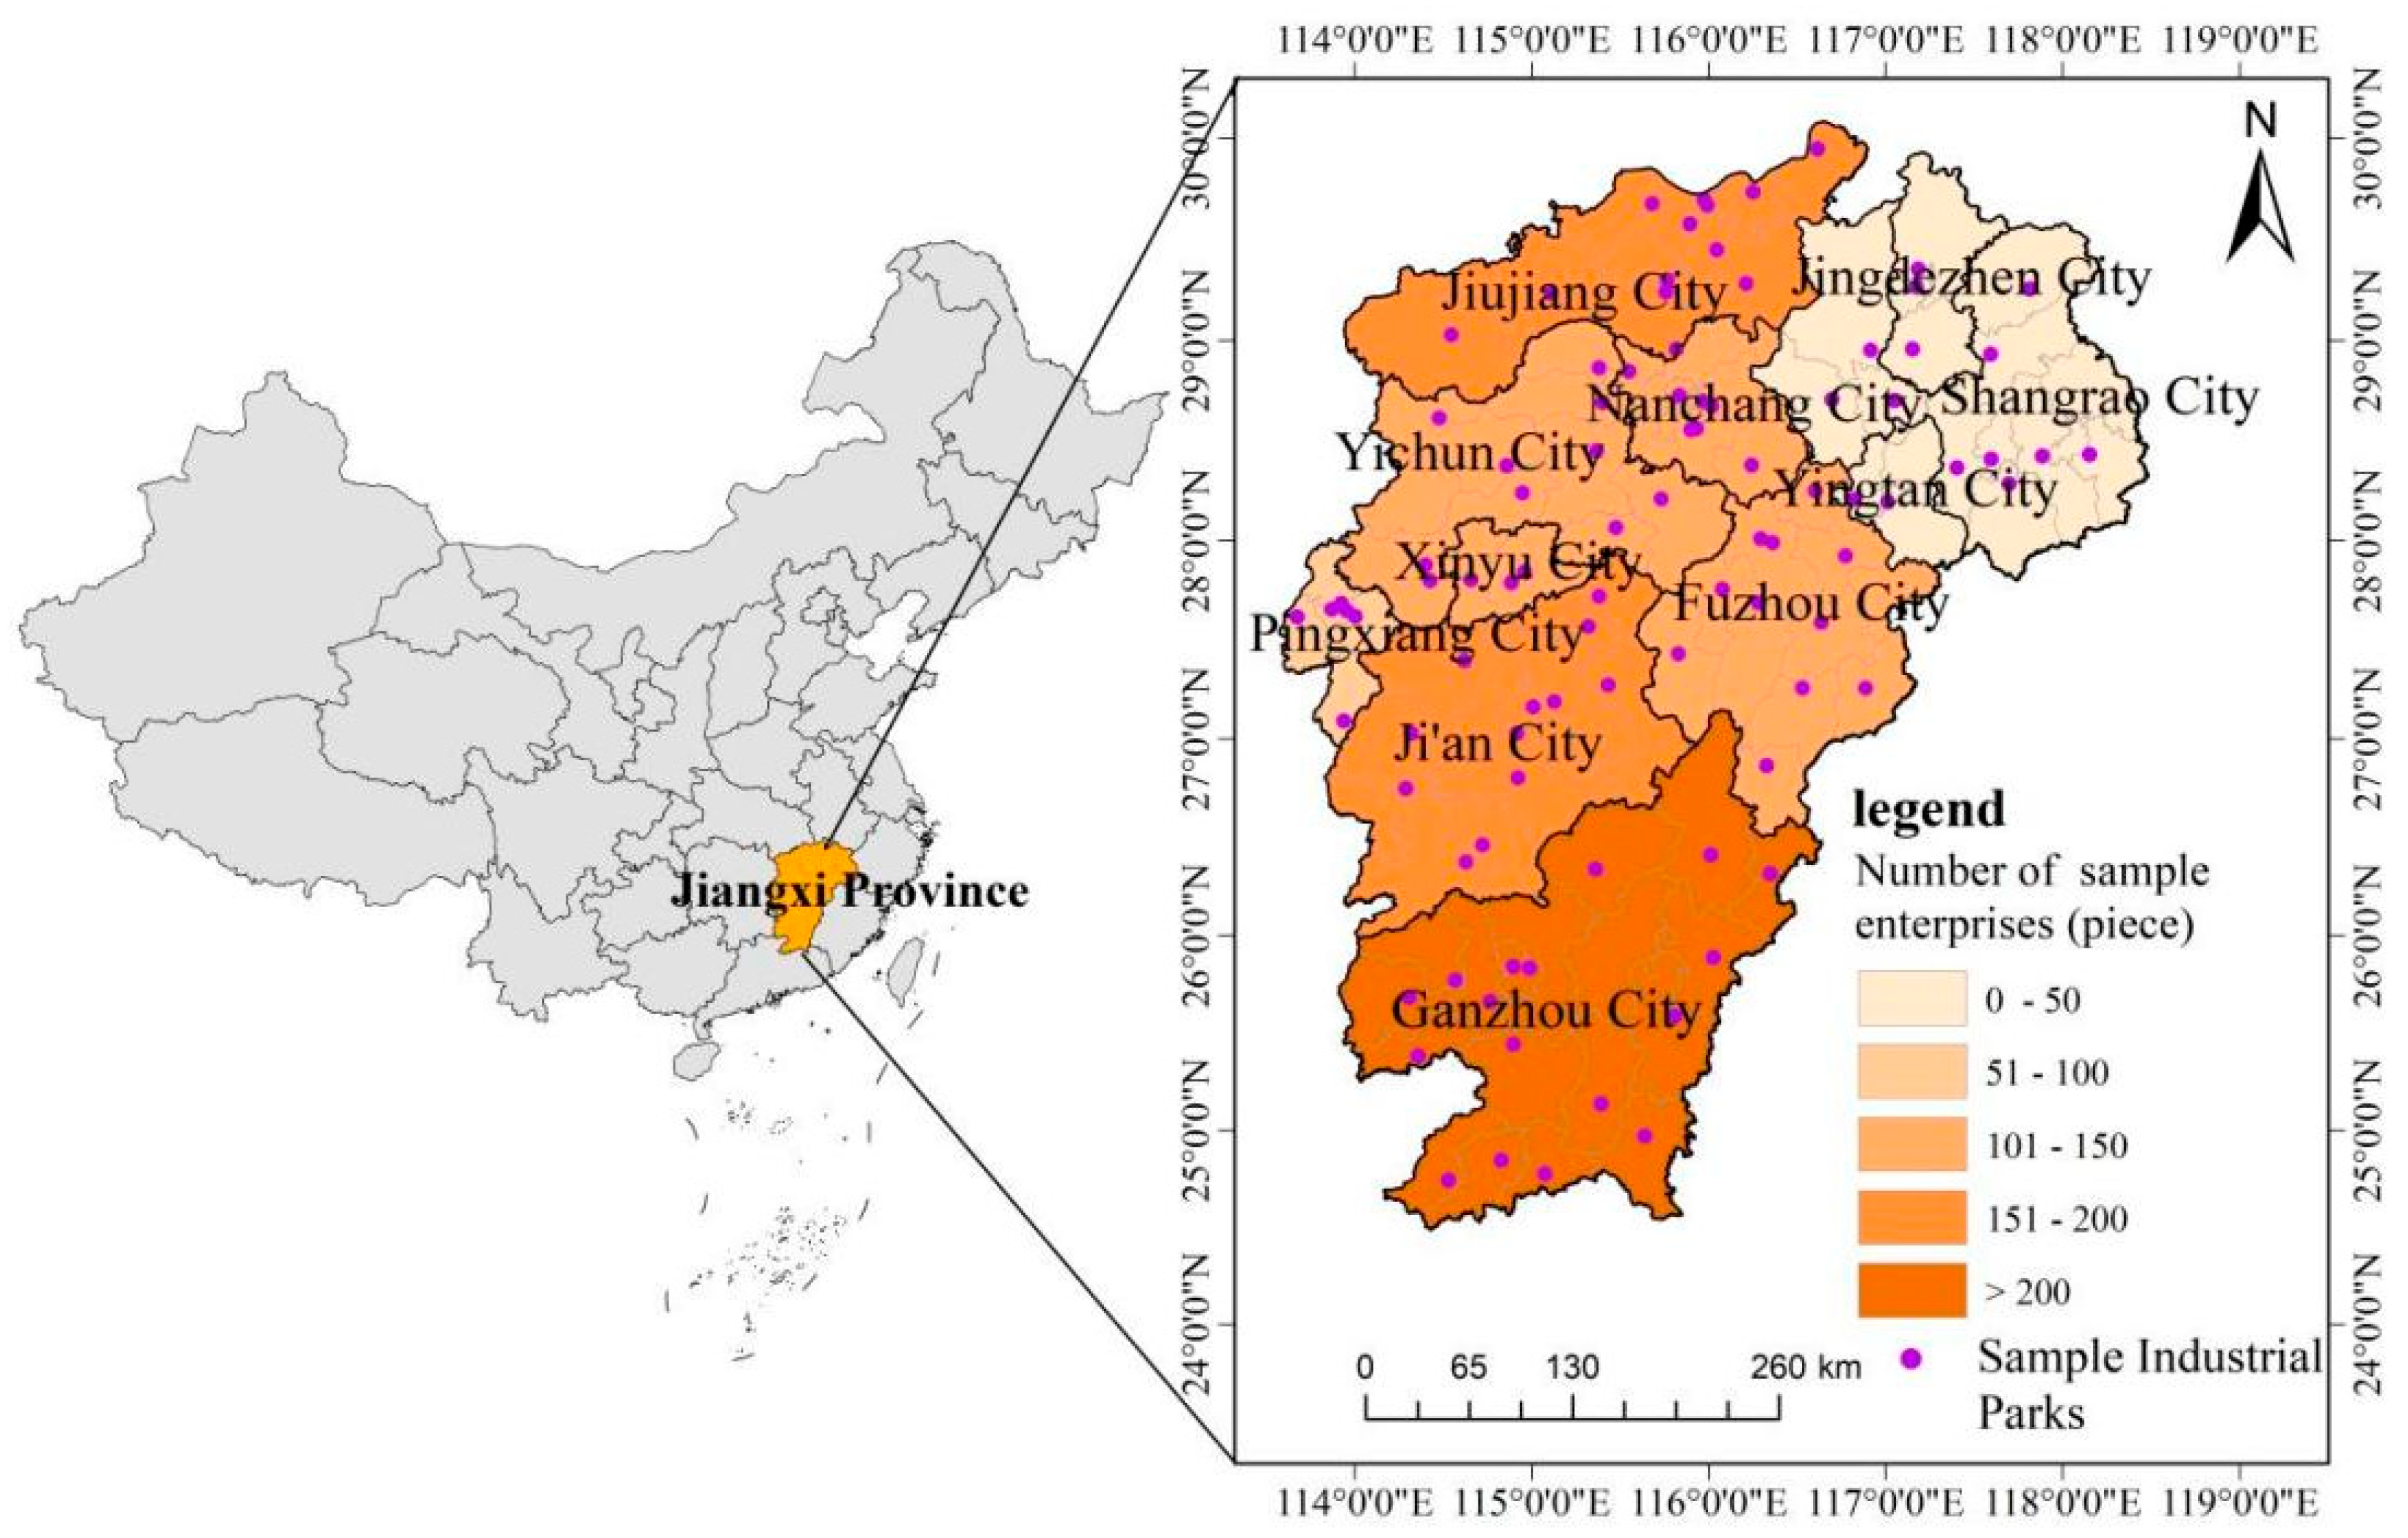
3.1. Description of Data

The research group collected enterprise questionnaires through a big data platform built by the Department of Industry and Information Technology in Jiangxi Province, which served to ensure the validity and authenticity of the data. The survey was conducted from July to October 2022. The respondents were the manufacturing enterprises above the designated size with an annual main business income of CNY 20 million or above. The survey questionnaires were distributed to 1350 industrial enterprises in 98 industrial parks (covering 97% of all industrial parks in Jiangxi Province), located throughout all 11 cities. Ultimately, 1274 questionnaires were recovered, and 1226 valid questionnaires were obtained after data cleaning and sorting, resulting in an effective response rate of 96.23% (refer to Figure 2). The questionnaire covered various aspects, including basic information about the enterprises’ production and operation, digitization, industrial chains, and energy consumption. Data processing involved eliminating unconventional data samples with missing or abnormal data and applying 1% and 99% percentile truncation to certain continuous variables to mitigate the influence of extreme values on the regression results.

3.2. Variable Definition

3.2.1. Dependent Variable

The objective of this study was to investigate the influence of multidimensional relational networks (Network) on the carbon emission intensity of enterprises (COI). Hence, COI is the dependent variable. Previous research has defined COI as the ratio of an enterprise’s total carbon emissions to its main business income [3,45]. To ensure consistency in carbon emission calculation and avoid biases in the results, the questionnaire did not directly request carbon emission data from the enterprises. Instead, data regarding the enterprises’ five major energy consumption sources—namely, coal, coke, diesel, natural gas, and electricity—were collected through questionnaires. According to the guidelines provided by the Intergovernmental Panel on Climate Change (IPCC) [56], the specific formula for the calculation of carbon emissions is as follows [57,58]:
E ( C O 2 ) = k = 1 5 E ( C O 2 ) k = k = 1 4 M k × N C V k × C E F k × C O F k × 44 / 12 + M 5 d
C O I = E ( C O 2 ) / O u t p u t
where E(CO2) denotes the total amount of carbon dioxide emissions produced by each type of energy; k denotes the type of energy, where k = 1, 2, 3, 4, 5 (raw coal, coke, diesel, natural gas, and electricity, respectively); Mk denotes the consumption of the k type of energy; M5 denotes the amount of electricity used; NCVk is the average low-level heat generation of the k type of energy; CEFk is the carbon content per unit of calorific value of the k type of energy; COFk is the carbon oxidation factor of the k type of energy; 44/12 is the ratio of the molecular weight of carbon dioxide to carbon; d is the conversion factor from electrical energy to carbon dioxide (according to the “China Energy Statistical Yearbook”, the “Guidelines for the Compilation of China’s Upgraded Greenhouse Gas Inventory” and the “Guidelines for the Calculation of Greenhouse Gas Emissions Caused by Energy Consumption”, the average low calorific values of raw coal, coke, diesel, and natural gas are 209.08 TJ/104 t, 284.35 TJ/104 t, 426.52 TJ/104 t, and 3893.1 TJ/108 m3, respectively; the carbon contents per unit calorific value are 26.8 t/TJ, 29.2 t/TJ, 20.2 t/TJ, and 15.3 t/TJ, respectively; and the carbon oxidation factors are 0.98, 0.93, 0.98, and 0.99, respectively; according to the calculation results of the China Association for Science and Technology, the coefficient of electricity’s conversion into carbon dioxide is 0.997 kg/kW·h); COI denotes the carbon emission intensity; and Output denotes the main business income of the enterprise.

3.2.2. Independent Variable

The key explanatory variable in this study was the multidimensional relationship network (Network), which included Network1 and Network2. Network1 represented the embedding status of an enterprise within the relational network (1 = embedded in at least one type of relational network, 0 = not embedded). Meanwhile, Network2 measured the extent to which enterprises were embedded in various relational networks, including government networks (Net1), market networks (Net2), industry networks (Net3), public networks (Net4), and network reputation (Net5). The measurement was based on the number of different network types that an enterprise was involved in.
To elaborate further, Net1 was indicated by the statement, “whether it is a state-owned enterprise” (1 = yes; 0 = no). Due to their inherent government associations, state-owned enterprises may have greater access to government resources [59]. Net2 was represented by the statement, “whether the main products are involved in the foreign sales market” (1 = yes; 0 = no). If an enterprise has established long-term and stable cooperative relationships with other countries or regions, this implies access to more international market resources, which may also entail stricter environmental standards [40]. Net3 was indicated by the statement, “whether it participates in industry associations” (1 = yes; 0 = no). Generally, industry associations can expand the networks of member enterprises, enabling them to obtain timely industry information and trends [23]. Net4 was represented by the statement, “whether the enterprise has a brand” (1 = yes; 0 = no). The expectations and trust of public consumers in the enterprise’s brand may influence its behavior regarding low-carbon emissions [15]. Net5 was represented by the statement, “whether it has obtained provincial-level or national-level honors” (the provincial-level or national-level honors for enterprises mainly include the titles of “specialized, refined, and innovative enterprise”; “small giant”; “single champion enterprise”; “high-tech enterprise”; “unicorn enterprise”; and “gazelle enterprise”) (1 = yes; 0 = no). These honors indicate stronger competitiveness and credibility, making it easier for the enterprise to attract scarce resources such as funds and talent [23].

3.2.3. Mediating and Regulating Variable

Technological innovation (PTN) served as the mediating and regulating variable, typically measured using indicators such as R&D investment, patent applications, and patent authorizations. To achieve a comprehensive examination of enterprises’ innovation, this study adopted the approach of Acs et al. and Xiong and Yang [60,61], using patent authorizations to characterize technological innovation.

3.2.4. Control Variables

Regarding the control variables, this study incorporated established research findings [2,9,62,63] to select the following variables: (1) the operating years of the enterprise (Age) (1 = 8 years and below; 2 = 9~18 years; and 3 = longer than 18 years); (2) the enterprise area (Lnsqu), measured as either the actual area occupied by the enterprise or the rented workshop area; (3) the enterprise size (Lnsca), represented by the number of employees within the enterprise; (4) the enterprise’s location in the industry chain (Ind) (1 = final goods producer; 0 = intermediate goods producer); (5) digital applications (DIG), measured as the number of digital management software applications used, such as OA, ERP, SAAS, CRM, SCM, MES, etc. To account for the influence of industry and regional characteristics on enterprises’ carbon emission intensity, this study included dummy variables for the industry attributes (Industry) and city locations (City) of the enterprises.
We finally used 1226 sample enterprises. Table 1 lists the results of the descriptive statistical analyses of the variables. They show that the mean, maximum, and minimum values of COI were −1.674, 3.015, and −6.549, respectively, and the standard deviation was 1.842, indicating that there were large differences in the carbon emission intensity among the enterprises. Network1 was a dummy variable with a standard deviation of 0.474, while Network2 was a discrete variable with a standard deviation of 0.974. Both showed that there was a large individual difference among the multidimensional relational networks, which provides an opportunity for empirical analyses.
Table 2 reports the Pearson correlations of the variables. The results show that the correlation between the explained variables and the explanatory and control variables was significant, indicating that the variables were selected appropriately and that they could be tested in the next step. The correlation coefficients between COI and Network1 and Network2 were −0.067 and −0.090, with significance at the levels of 5% and 1%, respectively. It can be said that the multidimensional relationship network is correlated with the carbon emission reduction efficiency of enterprises.

3.3. Model Setting

3.3.1. Primary Model

To further empirically evaluate the possible impact of multidimensional relational networks on enterprises’ carbon emissions, a multivariate linear model was established as follows:
C O I = α 0 + α 1 N e t w o r k + α 2 C o n t r o l s + ε 1
where COI indicates the carbon emission intensity; Network represents the multidimensional relational network, including the relational network’s embedded state (Network1) and the relational network’s embedded degree (Network2); Controls denotes a series of control variables; α 0 indicates the constant term; α 1 is the total effect of the multidimensional relational network on carbon emissions; α 2 is the partial regression coefficient of the control variable; and ε 1 represents an error term.

3.3.2. Mediation Effect Model

To investigate the mechanism through which the multidimensional relational network affects the carbon emission intensity of an enterprise, this study adopted the stepwise method proposed by Baron and Kenny [64]. Equations (3)–(5) represent the models used to examine the mediating effect.
P T N = b 0 + b 1 N e t w o r k + b 2 C o n t r o l s + ε 2
C O I = c 0 + c 1 N e t w o r k + c 2 P T N + c 3 C o n t r o l s + ε 3
where PTN represents the innovation capacity of the enterprise; b 0 and c 0 denote the constant terms; b 1 is the impact of the multidimensional relational network on the enterprise’s innovation capacity; c 1 denotes the direct effect of multidimensional relationship networks on carbon emissions; c 2 is the impact of the innovation capacity on carbon emissions; b 2 and c 3 indicate the partial regression coefficients of the control variables; ε 2 and ε 3 represent error terms; and the other variables are defined as in Equation (3).
In this work, the stepwise regression method was utilized to examine the mediation effect, which required the following three conditions to be satisfied. Firstly, the coefficient α 1 should be statistically significant in Equation (3), indicating the presence of the total effect of the multidimensional relational network on carbon emissions. Secondly, the coefficient b 1 should be statistically significant in Equation (4), demonstrating the effect of the multidimensional relationship network on the innovation capacity. Thirdly, the coefficient c 2 should be statistically significant in Equation (5). If the coefficient c 1 is significant, it indicates the partially mediating role of the innovation capacity, or otherwise it implies the fully mediating role of the innovation capacity.

3.3.3. Moderated Effect Model

To investigate the moderating effect of the innovation capacity on the relationship between the relational network and the carbon emissions of enterprises, this study developed a moderating effect model based on the framework proposed by Qu and Luo [65]. The model is as follows:
C O I = d 0 + d 1 P T N × N e t w o r k + d 2 C o n t r o l s + ε 4
where d 1 indicates the coefficients of the interaction term of the relational network and innovation capacity of the enterprise; d 0 indicates the constant terms; ε 4 represents the error terms; and other variables are defined as in Equation (3).

4. Empirical Results

4.1. Baseline Results

To ensure the reliability of the model estimations, this study first conducted a multicollinearity test on all of the variables, and the variance inflation factor (VIF) was found to be less than 2, indicating the absence of multicollinearity. The regression results are presented in Table 3. Columns (1) to (4) provide the estimation results for the embedding status (Network1) and degree of the multidimensional relational network (Network2), while columns (5) and (6) present the estimation results for the various dimensions of the relational network including government network, market network, industry network, public network, and network reputation. Overall, the results indicate that the coefficients of Network1 and Network2 in columns (1) to (4) were both significant and negative, suggesting that the multidimensional relational network can significantly reduce the carbon emission intensity of enterprises, thereby supporting H1. Specifically, the regression coefficient of Network1 in column (2) was −0.283, indicating that, when keeping the other variables constant, enterprises embedded in a relational network had a 28.3% lower carbon emission intensity compared to those not embedded in a relational network. In column (4), the regression coefficient of Network2 was −0.216, indicating that, when keeping the other conditions constant, a one-rank increase in Network2 led to a 21.6% decrease in the carbon emission intensity.
Regarding the different impacts of various dimensions, the results in column (6) reveal that Net2, Net4, and Net5 were significant and negative regarding the carbon emission intensity of enterprises, which indicates that enterprise’s market network, public network, and network reputation play important roles in carbon emission reductions. Specifically, the absolute value of the coefficient of Net2 was the largest, suggesting that the market network has the most noticeable effect in terms of reducing carbon emissions. This aligns with previous research suggesting that enterprises involved in international markets are more likely to adhere to internationally recognized environmental management practices, which can significantly reduce their carbon intensities [45]. The coefficients for Net4 and Net5 were also significant and negative, indicating that embedding in the public network and the network reputation have significant effects in terms of reducing carbon emissions. This is consistent with the existing literature, indicating that enterprises with higher levels of public attention and better reputations have more incentives to maintain their efforts in green management in order to create favorable public opinions and evaluations, thus exerting a positive effect on carbon emissions [15,23,50]. Unexpectedly, the coefficients of Net1 and Net3 were not significant, which illustrates that the government network and industry network have no effect on an enterprise’s carbon emissions; this is not consistent with previous findings. A possible reason is that state-owned enterprises with better government networks have more abundant capital and are less sensitive to governments’ financial support. Therefore, although government networks can provide financial resources for enterprises’ low-carbon behavior, they still have no effect on their carbon emission reductions.
Regarding the control variables, the variable Age shows a negative and significant coefficient in column (1), indicating that, if an enterprise has operated for a longer period of time, it is likely to have a lower carbon emission intensity. This can be attributed to the accumulation of experience, improved management practices, and the better implementation of carbon emission reduction strategies, and it aligns with the findings of Wang et al. [2]. Meanwhile, the control variables Lnsqu and Lnsca had significant and positive effects on the carbon emission intensity of enterprises across all models. This suggests that an increase in the land area and scale of operation of an enterprise may lead to a significantly higher carbon emission intensity, which is consistent with the study conducted by Xia and Cai [9]. This result can be attributed to the expansion of the enterprise’s scale, which increases its energy demands and subsequently leads to higher carbon emissions. At the same time, the variable Ind showed a significant and negative coefficient in all models, suggesting that final goods producers have lower carbon emission intensities compared to intermediate goods producers. This may be due to the direct influence of consumers, as the growing awareness of environmentally friendly consumption has led to a preference for low-carbon products, prompting enterprises to adopt low-carbon production methods. Additionally, the variable DIG exhibited a significant and negative coefficient in all models, indicating that increased digitalization can effectively reduce the carbon emission intensities of enterprises. This is because digitalization optimizes the allocation of production factors and enhances the carbon management efficiency, thereby reducing carbon emissions [3,66].

4.2. Robustness Estimation and Endogeneity

To enhance the reliability of the conclusions, this study conducted robustness tests using two approaches. Firstly, the explained variable was the carbon emissions per capita (COP) instead of the carbon emission intensity. Secondly, the core explanatory variable was replaced with the enterprise’s loan amount (CRE) as a measure of its multidimensional relational network. The results of these tests showed that the coefficients of the multidimensional relational network remained significant and negative, confirming the reliability of the previous findings (refer to Appendix A.1 Table A1).
To address potential endogeneity issues arising from missing variables and reverse causality, this study employed the instrumental variables method (IV) so as to ensure more robust and reliable estimation results. Following Fisman and Svensson [67], the instrumental variable was constructed as the mean value of the multidimensional relational networks of other enterprises within the same industry. As the average relational network at the industry level is influenced by the industry characteristics and is not directly affected by individual enterprises, it can be considered relatively exogenous. The two-stage least squares estimation method (2SLS) was used for the regression analysis. The results of the first-stage regression indicated a significant and positive coefficient between the instrumental variable and the multidimensional relational network, and the F-statistic exceeded 10, confirming the validity of the instrumental variable selection (refer to Appendix A.2 Table A2). The results of the second-stage regression demonstrated that the coefficient of the multidimensional relational network remained significant and negative, indicating that it continued to exert an inhibitory effect on enterprises’ carbon emission intensity. These findings reinforce the robustness of the primary regression results.

4.3. Heterogeneity Analysis

4.3.1. Heterogeneity Analysis of Carbon Emission Level

Enterprises with different carbon emission levels may experience varying levels of pressure to reduce their emissions, leading to potentially different effects of multidimensional relational networks on carbon emission reductions [34]. In this study, we utilized quantile regression to examine the heterogeneous influence of multidimensional relational networks on carbon emission reductions across enterprises with different carbon emission intensities. As displayed in Table 4, the multidimensional relational network exhibited an inhibitory effect on the carbon emission intensities of enterprises across different quantiles of carbon emission intensity, with this effect showing an increasing trend. Specifically, from the 25th percentile to the 75th percentile, the absolute value of the coefficient of influence rose from 0.174 to 0.220, as shown in columns (4) to (6). This indicates that the higher the carbon emission intensity, the more pronounced the inhibitory effect of the multidimensional relational network on enterprises’ carbon emissions. This may be attributed to the fact that enterprises with a higher carbon emission intensity face greater external regulation and social pressure from various dimensions of their relational networks. To meet external expectations and maintain positive network relationships, these enterprises are more inclined to adopt emission reduction measures, resulting in a more significant reduction in carbon emissions within the upper tertile of the carbon intensity [34].

4.3.2. Heterogeneity Analysis of Digitization Level

Differences in the information flow, communication, and cooperation within a relational network can arise from various digital levels, resulting in an asymmetric impact on the relationship between enterprises’ multidimensional relational networks and their carbon emissions. Building on the work of Xie [68], the digital level was divided into high and low groups, using the median as the threshold, to examine the heterogeneity of the effect of multidimensional relational networks on carbon emissions based on different digital levels. As presented in Table 5, the coefficient reflecting the impact of the multidimensional relational network on enterprises’ carbon emission intensity was significant and negative only in the high-digital-level group. This suggests that a higher digital level enhances the efficacy of the multidimensional relational network in reducing carbon emissions. Our conclusions are consistent with the findings of Liu and Cui [34], who postulated that digitalization can improve the efficiency of internal and external collaboration in multidimensional relational networks, which enables the real-time and efficient sharing of information related to carbon emission reduction among an enterprise and its collaborators. With the popularization of digitalization, the driving mechanism of digitalization on the green transformation of enterprises is worth studying in the future.

4.4. Mechanism Analysis

4.4.1. Analysis of Mediating Effect

(1)
Stepwise Test Method
This work utilized the stepwise test method to examine the mediating effect of technological innovation, with the first step already completed and passing the test, as shown in Table 3. The focus then shifted to the second and third steps of the mediating effect examination. Table 6 presents the estimated coefficients of Network1 and Network2 on the innovation capability variable (PTN). In columns (1) and (3), the coefficients were significant and positive, indicating that the multidimensional relational network positively influences the technological innovation of enterprises. However, in columns (2) and (4), the estimated coefficients of multidimensional relational networks and technological innovation were significant and negative, suggesting that technological innovation partially mediate the impact of multidimensional relational networks on carbon emissions. The mediating effect accounted for 18.59% and 21.71% of the total effect for Network1 and Network2, respectively. The robustness of the findings was further supported by the results of the Sobel test. These results indicate that as enterprises accumulate multidimensional relational networks, they gain more opportunities to acquire, integrate, and utilize innovative resources, leading to enhanced technological and knowledge capabilities for green and low-carbon innovation. This, in turn, improves their production efficiency and energy utilization efficiency and ultimately reduces the carbon emission intensity. Consequently, H2 was confirmed. Our findings are similar to those of Zhao et al. [50], who emphasize that relational networks such as market networks and public networks can help stakeholders to better understand the environmental governance in enterprises’ production. In order to maintain an environmentally friendly image, enterprises are forced to take measures to improve their environmental performance, including enhancing their technological innovation, exploiting green production technologies, and reducing their levels of pollution and carbon emissions.
(2)
Bootstrap Method
To address the issue of non-normally distributed samples, the mediating effect was further tested using the non-parametric percentile bootstrap method, which corrects for biases by regulating the percentile points of the confidence intervals [69]. Table 7 presents the results of the bias-corrected bootstrap method, with a sampling number of 5000. The estimation results demonstrate that Network had a significant, negative total effect and direct effect on COI. Additionally, there was a significant, negative indirect effect through PTN, and the sign and value of the effect coefficients were similar to those in the stepwise regression analysis shown in Table 6, indicating the robust mediating effect of PTN. Specifically, PTN mediated the inhibitory effect of the network on COI by 18.70% and 21.76%, respectively.

4.4.2. Analysis of Regulating Effect

Based on the previous theoretical analysis, it is suggested that technological innovation plays a regulating role in the relationship between multidimensional relational networks and enterprises’ carbon emissions. As shown in Table 6, the coefficients of the interaction term between Network and PTN were negative in columns (5) and (6), and both were significant at the 1% level. This indicates that technological innovation significantly moderates the relationship between networks and carbon emissions. It suggests that enterprises with stronger technological innovation can enhance the carbon emission reduction effects of their relational networks. A possible reason for this is that enterprises with stronger technological innovation are better equipped to absorb and transform the carbon emission reduction information, knowledge, and technology brought by their relational networks. This continuous improvement and optimization of the technological system and management mode strengthen the overall carbon emission reduction efforts of the enterprise. Consequently, H3 was confirmed. This conclusion is supported by Zhao and Lee [37], who also suggest that relationship networks can positively influence carbon emission reduction through corporate innovation. Moreover, the increasing preference for low-carbon and environmentally friendly products among consumers may force enterprises to pay attention to their own green innovations [22]. Meanwhile, in order to maintain their existing market networks, public networks, and network reputations, enterprises must actively adopt green technological innovation with environmental protection effects.

5. Conclusions and Discussion

This work empirically examined the relationship among multidimensional relational networks, technological innovation, and carbon emissions based on 1226 industrial enterprises located in Jiangxi Province, which is part of the ecologically sensitive Yangtze River Basin. The main findings are as follows: (1) Multidimensional relational network embedding significantly reduces the carbon emission intensities of enterprises, and the reduction effect is strengthened with higher levels of embedding. Thus, compared to government and industry networks, market and public networks and network reputation have a stronger promoting effect on carbon emission reductions. (2) The heterogeneity analysis reveals that the carbon emission reduction effect of multidimensional relational networks is more pronounced in enterprises with a higher carbon emission intensity and higher levels of digitalization. (3) The mechanism examination results indicate that technological innovation not only serve as a mediator in the inhibitory effect of relational networks on carbon emissions but also act as a regulator, strengthening the carbon emission reduction effect of relational network embedding. Overall, these findings contribute to our understanding of the role of multidimensional relational networks and technological innovation in reducing carbon emissions in enterprises.
In light of these conclusions, we propose the following policy recommendations. Firstly, more attention should be paid to stimulate enterprises’ endogenous driving force of carbon reduction. The baseline results show that markets with higher standards for carbon requirement and public supervision can more effectively force enterprises to reduce carbon emission than the government network. It is said that low-carbon products can gain competitive advantages and public consumer preferences, which transform into an endogenous driving force for enterprises to reduce carbon emissions. It can be achieved through the following measures: (i) accelerating the promotion of ESG concepts and strengthening the construction of enterprise ESG capabilities, and consequently enhancing their international competitiveness; (ii) constructing the carbon footprint accounting system for products, improving the carbon emission standards in the product market, and gradually promoting effective connection between domestic and international standards; (iii) broadening the channels available for the public to express their preferences regarding environmental protection and conduct supervision, thereby cultivating the enthusiasm of the public to participate in environmental management.
Secondly, it is necessary to emphasize the important role of digitization in enterprises’ carbon emission reductions. According to our results, enterprises with a higher level of digitization can achieve greater carbon emission reduction effects. Some measures can be taken to enhance enterprises’ digitization: (i) establishing digital transformation demonstration projects on some representative enterprise, as well as extending successful cases to stimulate the enthusiasm of more enterprises to participate in digital transformation; (ii) introducing a set of digital platforms including intelligent energy management system, intelligent carbon management system, and intelligent operation center; (iii) enhancing employees’ digital skills and innovation capabilities by conducting training courses on cutting-edge technologies such as big data and artificial intelligence.
Thirdly, it is essential to improve enterprises’ technological innovation and provide technical support for carbon reductions. Our mechanism analysis shows that technological innovation plays both important mediation and regulation roles in the inhibitory effect of relational networks on carbon emissions. Encouraging enterprises’ technological innovation can be achieved through the following measures: (i) building an innovation consortium with close cooperation between the upstream and downstream of the industrial chain, and constructing the innovation cooperation mechanism among enterprises, research institutes, and financial institutions; (ii) accelerating the transformation and application of green technologies, developing the technology trading markets; (iii) improving relevant laws and regulations on intellectual property protection, as well as enhancing the systematic governance capability of the entire industry chain, including the creation, utilization, protection, and management of intellectual property.
While this study yielded some valuable findings and insights for government decision making and research in the area of enterprise carbon reductions, some limitations should be noted. Firstly, this work was based on a survey of 1226 industry enterprises from 98 industrial parks in 11 municipalities in Jiangxi Province, Central China; therefore, the results cannot be extrapolated to other parts of the country. Future research should be performed and extended to more regions with different development conditions (not limited to China) in order to gain a comprehensive understanding of the factors that influence industrial enterprises’ carbon emission reductions. Secondly, the relationship network considered in this study was static. Future research should aim to improve our understanding of the dynamics of the multidimensional relational networks and their spatial overflow effects on carbon emission. Thirdly, this study only proposed several research hypotheses and conducted empirical examinations, but it did not provide a complete theoretical framework. Future research can build a robust theoretical framework based on this study to explore more mechanisms by which relational networks affect enterprises’ carbon emissions, as well as the different mechanisms of various dimensional relational networks.

Author Contributions

Writing—review and editing, validation, supervision, formal analysis, B.Z.; writing—original draft, visualization, data curation, software, methodology, L.L.; writing—review and editing, writing—original draft, visualization, methodology, investigation, data curation, conceptualization, project administration, X.L.; writing—review and editing, project administration, funding acquisition, X.H. All authors have read and agreed to the published version of the manuscript.

Funding

This research was supported by the National Social Science Foundation of China [grant number 21SKJD03]; the National Natural Science Foundation of China [grant number 72063019]; the Jiangxi Province Social Science Planning Foundation [grant number 22YJ14]; and the Jiangxi Province Cultural and Artistic Science Planning Foundation [grant number YG2022154].

Institutional Review Board Statement

This study involved surveying entrepreneurs and was conducted in strict accordance with the ethical standards of the Jiangxi Economic Development Research Institute (JXEDRI). The protocol for the research was reviewed and approved by the JXEDRI, which is specifically responsible for field research and research work in Jiangxi Normal University.

Informed Consent Statement

Informed consent was obtained from all respondents prior to their participation in the study.

Data Availability Statement

The data will be made available upon reasonable request.

Conflicts of Interest

The authors declare no conflicts of interest.

Appendix A

Appendix A.1

Table A1. Robustness test.
Variables(1)(2)(3)
COPCOPCOP
Network1−0.450 ***
(−4.07)
Network2 −0.339 ***
(−6.06)
CRE −0.029 *
(−1.67)
ControlsYesYesYes
IndustryYesYesYes
CityYesYesYes
Cons2.834 ***2.647 ***−2.334 ***
(12.25)(11.53)(−9.28)
N122612261226
R20.1520.1650.103
Notes: *** and * indicate significance at the 1% and 10% confidence levels, respectively. The t-statistics are reported in parentheses.

Appendix A.2

Table A2. Endogeneity test.
Second Stage(1)(2)
VariableCOICOI
Network1−2.125 **
(−2.91)
Network2 −1.215 **
(−2.89)
ControlsYesYes
IndustryYesYes
CityYesYes
N12261226
AndersonCanon. LM (p value)37.638
[0.000]
30.113
[0.000]
Cragg–Donald Wald F38.57730.669
Stock–Yogo weak ID test critical values: 10% maximal IV16.3816.38
First stageNetwork1Network2
Network1-Instrumental variable0.704 ***
(6.21)
Network2-Instrumental variable 1.231 ***
(5.54)
F38.5830.67
(0.000)(0.000)
Notes: *** and ** indicate significance at the 1% and 5% confidence levels, respectively. The t-statistics are reported in parentheses in the first stage, while Z-statistics are reported in parentheses in the second stage. Moreover, the p-value is in square brackets.

References

  1. China Emission Accounts and Datasets. 2023. Available online: https://www.ceads.net (accessed on 13 January 2025).
  2. Wang, Z.; Fu, H.; Ren, X. Political Connections and Corporate Carbon Emission: New Evidence from Chinese Industrial Firms. Technol. Forecast. Soc. Change 2023, 188, 122326. [Google Scholar] [CrossRef]
  3. Jiang, Y.; Zhao, R.; Qin, G. How Does Digital Finance Reduce Carbon Emissions Intensity? Evidence from Chain Mediation Effect of Production Technology Innovation and Green Technology Innovation. Heliyon 2024, 10, e30155. [Google Scholar] [CrossRef]
  4. Wang, J.; Dong, K.; Ren, X. Is the Spatial Impact of Digital Financial Inclusion on CO2 Emissions Real? A Spatial Fluctuation Spillover Perspective. Geosci. Front. 2024, 4, 101656. [Google Scholar] [CrossRef]
  5. Kang, X.; Chen, L.; Wang, Y.; Liu, W. Analysis on the Spatial Correlation Network and Driving Factors of Carbon Emissions in China’s Logistics Industry. J. Environ. Manag. 2024, 366, 121916. [Google Scholar] [CrossRef]
  6. Brust, D.; Liston-Heyes, C. Environmental Management Intentions: An Empirical Investigation of Argentina’s Polluting Firms. J. Environ. Manag. 2010, 91, 1111–1122. [Google Scholar] [CrossRef] [PubMed]
  7. Lee, S. Corporate Carbon Strategies in Responding to Climate Change. Bus. Strateg. Environ. 2012, 21, 33–48. [Google Scholar] [CrossRef]
  8. Córdova, C.; Zorio-Grima, A.; Merello, P. Carbon Emissions by South American Companies: Driving Factors for Reporting Decisions and Emissions Reduction. Sustainability 2018, 10, 2411. [Google Scholar] [CrossRef]
  9. Xia, M.; Cai, H. The Driving Factors of Corporate Carbon Emissions: An Application of the LASSO Model with Survey Data. Environ. Sci. Pollut. Res. 2023, 30, 56484–56512. [Google Scholar] [CrossRef]
  10. Chang, L.; Fang, S. Climate Actions and Corporate Carbon Emissions along the Supply Chain. Econ. Lett. 2024, 235, 111503. [Google Scholar] [CrossRef]
  11. Berman, E.; Bui, L. Environmental Regulation and Productivity: Evidence from Oil Refineries. Rev. Econ. Stat. 2001, 83, 498–510. [Google Scholar] [CrossRef]
  12. Dai, R.; Duan, R.; Liang, H.; Ng, L. Outsourcing Climate Change. Finance Working Paper No. 723/2021; European Corporate Governance Institute: Brussels, Belgium, 2021. [Google Scholar]
  13. Bartram, S.M.; Hou, K.; Kim, S. Real Effects of Climate Policy: Financial Constraints and Spillovers. J. Financ. Econ. 2022, 142, 668–696. [Google Scholar] [CrossRef]
  14. Li, K.; Zhang, P.; Lian, Y.; Zhou, C.; Xiang, Y. Can Institutional Pressures Serve as an Efficacious Catalyst for Mitigating Corporate Carbon Emissions? Environ. Sci. Pollut. Res. 2024, 31, 21380–21398. [Google Scholar] [CrossRef]
  15. Wang, Y.; Zhao, Z.; Shi, M.; Liu, J.; Tan, Z. Public Environmental Concern, Government Environmental Regulation and Urban Carbon Emission Reduction-Analyzing the Regulating Role of Green Finance and Industrial Agglomeration. Sci. Total Environ. 2024, 924, 171549. [Google Scholar] [CrossRef] [PubMed]
  16. Lin, X.; Zhu, X.; Feng, M.; Han, Y.; Geng, Z. Economy and Carbon Emissions Optimization of Different Countries or Areas in the World Using an Improved Attention Mechanism Based Long Short Term Memory Neural Network. Sci. Total Environ. 2021, 792, 148444. [Google Scholar] [CrossRef] [PubMed]
  17. Wu, F.; He, J.; Cai, L.; Du, M.; Huang, M. Accurate Multi-Objective Prediction of CO2 Emission Performance Indexes and Industrial Structure Optimization Using Multihead Attention-Based Convolutional Neural Network. J. Environ. Manag. 2023, 337, 117759. [Google Scholar] [CrossRef] [PubMed]
  18. Granovetter, M. Coase Revisited: Business Groups in the Modern Economy. Ind. Corp. Change 1995, 4, 93–130. [Google Scholar] [CrossRef]
  19. Radcliffe-Brown, A. On Social Structure. J. R. Anthropol. Inst. Great Br. Irel. 1940, 70, 1–12. [Google Scholar] [CrossRef]
  20. Woolcock, M. Microenterprise and Social Capital. J. Socio-Econ. 2001, 30, 193–198. [Google Scholar] [CrossRef]
  21. Jørgensen, F.; Ulhøi, J. Enhancing Innovation Capacity in SMEs through Early Network Relationships. Creat. Innov. Manag. 2010, 19, 397–404. [Google Scholar] [CrossRef]
  22. Li, T.; Zahari, A.I.; Sanusi, S. The Sustainability of Technological Innovation in China: From the Perspective of Network Relationships. Sustainability 2023, 15, 4242. [Google Scholar] [CrossRef]
  23. Alfani, A.; Vera, D. Determinants of Carbon Emission Disclosure. J. Econ. Bus. Accoutancy 2020, 22, 333–346. [Google Scholar] [CrossRef]
  24. Kern, P.; Schnyder, G. Corporate Networks in Post-War Britain: Do Finance–Industry Relationships Matter for Corporate Borrowing? Bus. Hist. 2021, 63, 966–987. [Google Scholar] [CrossRef]
  25. Niu, R.; Chen, L.; Jin, L.; Xie, G.; Zhao, L. Does Managerial Bank Relationship Network Matter Corporate Resilience? Evidence from the COVID-19 Crisis. Int. Rev. Econ. Financ. 2024, 89, 855–877. [Google Scholar] [CrossRef]
  26. Larcker, D.; So, E.; Wang, C. Boardroom Centrality and Firm Performance. J. Account. Econ. 2013, 55, 225–250. [Google Scholar] [CrossRef]
  27. Hossain, A.; Saadi, S.; Amin, A.S. Does CEO Risk-Aversion Affect Carbon Emission? J. Bus. Ethics 2023, 182, 1171–1198. [Google Scholar] [CrossRef]
  28. Li, P.; Lin, Z.; Peng, B.; Du, H. Do CEOs’ Social Networks Affect Carbon Emissions in China? The Moderating Role of CEO Reputation. Int. Rev. Econ. Financ. 2023, 88, 1122–1137. [Google Scholar] [CrossRef]
  29. Li, J.; Li, S.; Zhang, Y.; Tang, X. Network Evolutionary Game Analysis of Green Credit: A Perspective of Carbon Emissions Trading. Manag. Decis. Econ. 2024, 45, 1343–1362. [Google Scholar] [CrossRef]
  30. Chen, T.; Gozgor, G.; Koo, C.K.; Lau, C.K.M. Does International Cooperation Affect CO2 Emissions? Evidence from OECD Countries. Environ. Sci. Pollut. Res. 2020, 27, 8548–8556. [Google Scholar] [CrossRef]
  31. Zeng, S.; Xie, X.; Tam, C.M. Relationship between Cooperation Networks and Innovation Performance of SMEs. Technovation 2010, 30, 181–194. [Google Scholar] [CrossRef]
  32. Chen, S.; Yang, W. How Does Public Concern about Climate Change Affect Carbon Emissions? Evidence from Large-Scale Online Content and Provincial-Level Data in China. J. Clean. Prod. 2023, 426, 139137. [Google Scholar] [CrossRef]
  33. Jin, J.; Wang, F. Impact of Government Support on Firm Carbon Emission Efficiency: The Transmission Channel of Green Innovation. Financ. Res. Lett. 2024, 68, 105980. [Google Scholar] [CrossRef]
  34. Liu, L.; Cui, K. How Does Market-Incentive Environmental Regulation Affect Enterprises Green Growth? The Mediating Role of R&D Investment and Innovation Output. Heliyon 2024, 10, e30847. [Google Scholar] [CrossRef] [PubMed]
  35. Xie, R.; Zhang, J.; Tang, C. Political Connection and Water Pollution: New Evidence from Chinese Listed Firms. Resour. Energy Econ. 2023, 74, 101390. [Google Scholar] [CrossRef]
  36. Holtkamp, C.; Weaver, R. Quantifying the Relationship between Social Capital and Economic Conditions in Appalachia. Appl. Geogr. 2018, 90, 175–186. [Google Scholar] [CrossRef]
  37. Zhao, Y.; Lee, C. The Impact of Vertical Environmental Regulation Mechanism on Greenwashing. J. Clean. Prod. 2024, 475, 143637. [Google Scholar] [CrossRef]
  38. Hu, C.; Wei, Y.; Hu, W. Research on the Relationship between Agricultural Policy, Technological Innovation and Agricultural Carbon Emissions. Issues. Agric. Econ. 2018, 9, 66–75. [Google Scholar] [CrossRef]
  39. Chen, X.; Chen, X. Media Pressure, Financing Constraints, and Industrial Enterprises’ Carbon Emissions—Based on Regulating Effect of Green Invention Patent. Sci. Technol. Prog. Policy 2021, 38, 69–78. [Google Scholar] [CrossRef]
  40. Richter, P.; Schiersch, A. CO2 Emission Intensity and Exporting: Evidence from Firm-Level Data. Eur. Econ. Rev. 2017, 98, 373–391. [Google Scholar] [CrossRef]
  41. Peng, M.; Luo, Y. Managerial Ties and Firm Performance in a Transition Economy: The Nature of a Micro-Macro Link. Acad. Manag. J. 2000, 43, 486–501. [Google Scholar] [CrossRef]
  42. Kang, M.; Yang, S. Impact of Social Capital on Corporate Performance and Contextual Performance of Social Enterprises. Korean J. Bus. Adm. 2016, 29, 151–167. [Google Scholar] [CrossRef]
  43. Wassmer, U.; Li, S.; Madhok, A. Resource Ambidexterity through Alliance Portfolios and Firm Performance. Strateg. Manag. J. 2017, 38, 384–394. [Google Scholar] [CrossRef]
  44. Cao, G.; Geng, W.; Zhang, J.; Li, Q. Social Network, Financial Constraint, and Corporate Innovation. Eurasian Bus. Rev. 2023, 13, 667–692. [Google Scholar] [CrossRef]
  45. Cole, M.; Elliott, R.; Okubo, T.; Zhou, Y. The Carbon Dioxide Emissions of Firms: A Spatial Analysis. J. Environ. Econ. Manag. 2013, 65, 290–309. [Google Scholar] [CrossRef]
  46. Khwaja, A.; Mian, A. Do Lenders Favor Politically Connected Firms? Rent Provision in an Emerging Financial Market. Q. J. Econ. 2005, 120, 1371–1411. [Google Scholar] [CrossRef]
  47. Faccio, M. Politically Connected Firms. Am. Econ. Rev. 2006, 96, 369–386. [Google Scholar] [CrossRef]
  48. Wang, H.; He, Y.; Ding, Q. The Impact of Network Externalities and Altruistic Preferences on Carbon Emission Reduction of Low Carbon Supply Chain. Environ. Sci. Pollut. Res. 2022, 29, 66259–66276. [Google Scholar] [CrossRef] [PubMed]
  49. Zou, H.; Zeng, S.; Lin, H.; Xie, X. Top Executives’ Compensation, Industrial Competition, and Corporate Environmental Performance: Evidence from China. Manag. Decis. 2015, 53, 2036–2059. [Google Scholar] [CrossRef]
  50. Zhao, L.; Lingqian, K.; Kai, X. The Impact of Public Environmental Preferences and Government Environmental Regulations on Corporate Pollution Emissions. J. Environ. Manag. 2024, 351, 119766. [Google Scholar] [CrossRef]
  51. Phelps, C. A Longitudinal Study of the Influence of Alliance Network Structure and Composition on Firm Exploratory Innovation. Acad. Manag. J. 2010, 53, 890–913. [Google Scholar] [CrossRef]
  52. Inigo, E.; Ritala, P.; Albareda, L. Networking for Sustainability: Alliance Capabilities and Sustainability-Oriented Innovation. Ind. Mark. Manag. 2020, 89, 550–565. [Google Scholar] [CrossRef]
  53. Romero, D.; Molina, A. Collaborative Networked Organisations and Customer Communities: Value Co-Creation and Co-Innovation in the Networking Era. Prod. Plan. Control 2011, 22, 447–472. [Google Scholar] [CrossRef]
  54. Čirjevskis, A. What Dynamic Managerial Capabilities Are Needed for Greater Strategic Alliance Performance? J. Open Innov. Technol. Mark. Complex. 2019, 5, 36. [Google Scholar] [CrossRef]
  55. Ahmed, Z.; Cary, M.; Ali, S.; Murshed, M.; Ullah, H.; Mahmood, H. Moving toward a Green Revolution in Japan: Symmetric and Asymmetric Relationships among Clean Energy Technology Development Investments, Economic Growth, and CO2 Emissions. Energy Environ. 2022, 33, 1417–1440. [Google Scholar] [CrossRef]
  56. Intergovernmental Panel on Climate Change. 2021. Available online: https://www.ipcc.ch/about/vacancies/ (accessed on 13 January 2025).
  57. Xu, J.; Guan, Y.; Oldfield, J.; Guan, D.; Shan, Y. China Carbon Emission Accounts 2020–2021. Appl. Energy 2024, 360, 122837. [Google Scholar] [CrossRef]
  58. Zhang, Y.; Li, M.; Cai, X.; Mao, Y.; Jiao, L.; Wu, L. Drivers of industrial carbon emissions in the Yangtze River Delta region, China: A combination of decoupling and LMDI models. Energy Sources 2024, 19, 2384551. [Google Scholar] [CrossRef]
  59. Wang, T.; Li, H. Dynamic Evaluation of Carbon Emission Performance of New Energy Enterprises Based on Orthogonal Projection Method. Discret. Dyn. Nat. Soc. 2022, 2022, 7627095. [Google Scholar] [CrossRef]
  60. Acs, Z.; Anselin, L.; Varga, A. Patents and Innovation Counts as Measures of Regional Production of New Knowledge. Res. Policy 2002, 31, 1069–1085. [Google Scholar] [CrossRef]
  61. Xiong, Y.; Yang, B. Dual Network Embeddedness, Institutional Environment and Regional Innovation Capability. Sci. Res. Manag. 2022, 43, 32–42. [Google Scholar] [CrossRef]
  62. Cheng, Z.; Wang, F.; Keung, C.; Bai, Y. Will Corporate Political Connection Influence the Environmental Information Disclosure Level? Based on the Panel Data of A-Shares from Listed Companies in Shanghai Stock Market. J. Bus. Ethics 2017, 143, 209–221. [Google Scholar] [CrossRef]
  63. Mastrandrea, R.; Ter Burg, R.; Shan, Y.; Hubacek, K.; Ruzzenenti, F. Assessments of the Environmental Performance of Global Companies Need to Account for Company Size. Commun. Earth Environ. 2024, 5, 42. [Google Scholar] [CrossRef]
  64. Baron, R.; Kenny, D. The Moderator–Mediator Variable Distinction in Social Psychological Research: Conceptual, Strategic, and Statistical Considerations. J. Pers. Soc. Psychol. 1986, 51, 1173–1182. [Google Scholar] [CrossRef]
  65. Qu, X.; Luo, H. Impact of China’s OFDI on Carbon Emissions and Its Transmission Mechanism:An Empirical Analysis Based on Multiple Mediation Effect Model. Popul. Resour. Environ. 2021, 31, 1–14. [Google Scholar]
  66. Zhou, J.; Liu, W. Carbon Reduction Effects of Digital Technology Transformation: Evidence from the Listed Manufacturing Firms in China. Technol. Forecast. Soc. Change 2024, 198, 122999. [Google Scholar] [CrossRef]
  67. Fisman, R.; Svensson, J. Are Corruption and Taxation Really Harmful to Growth? Firm Level Evidence. J. Dev. Econ. 2007, 83, 63–75. [Google Scholar] [CrossRef]
  68. Xie, Y. The Effect and Mechanism of Digital Economy on Regional Carbon Emission Intensity. Contemp. Econ. Manag. 2022, 44, 68–78. [Google Scholar] [CrossRef]
  69. Wen, Z.; Ye, B. Analyses of Mediating Effects: The Development of Methods and Models. Adv. Psychol. Sci. 2014, 22, 731–745. [Google Scholar] [CrossRef]
Figure 1. Research hypothesis.
Sustainability 17 01655 g001
Figure 2. Locations and distribution of samples in Jiangxi Province, China.
Sustainability 17 01655 g002
Table 1. Definitions and descriptions of variables.
Variable NameVariable DefinitionDescription of VariableMeanSDMin.Max.
Dependent variable
COI Carbon emission intensityCarbon emissions per main business income (after taking the logarithm)−1.6741.842−6.5493.015
Independent variables
Network1Relationship network embedding status1 = embedded in at least one type of relational network described in this work;
0 = no embedding
0.6630.47301
Network2Relationship network embedding degreeNumber of network types in total: 0~51.0650.97404
Net1Government network1 = state-owned enterprise; 0 = not state-owned enterprise0.0530.22401
Net2Market network1 = involved in foreign sales market; 0 = not involved in foreign sales market0.0030.05701
Net3Industry network1 = participates in industry associations; 0 = does not participate0.2690.44401
Net4Public network1 = enterprise with brands; 0 = no brands0.5060.50001
Net5Network reputation1 = enterprise with honors; 0 = no honors0.2340.42401
Mediating/regulating variable
PTN Technological innovationNumber of authorized patents 5.4898.008030
Control variables
AgeOperating years of enterprise1 = 8 years and under, 2 = 9 to 18 years, 3 = longer than 18 years1.6200.64113
LnsquEnterprise areaArea actually occupied by the enterprise or rented workshop area (acres)4.0011.6310.4059.276
LnscaEnterprise sizeCurrent number of employees in the enterprise (persons)4.7961.2712.0797.980
IndLocation in industry chain1 = final goods producer, 0 = intermediate goods producer0.4720.49901
DIGDigital applicationsNumber of digital software applications, such as OA, ERP, SAAS, CRM, SCM, MES, etc. 1.5181.604013
IndustryIndustry effectWhether the enterprise belongs to a high-energy-consumption industry: 1 = yes, 0 = no0.5270.49901
CityRegional effectWhether the enterprise is located in the provincial capital city: 1 = yes, 0 = no0.1120.31501
Table 2. Pearson’s correlation coefficients of variables.
Variable COINetwork1Network2PTNAgeLnsquLnscaIndDIGIndustryCity
COI1
Network1−0.067 **1
Network2−0.090 ***0.780 ***1
PTN−0.097 ***0.222 ***0.340 ***1
Age−0.0200.170 ***0.284 ***0.130 ***1
Lnsqu0.203 ***0.186 ***0.231 ***0.220 ***0.235 ***1
Lnsca0.133 ***0.234 ***0.311 ***0.350 ***0.211 ***0.482 ***1
Ind−0.170 ***0.145 ***0.096 ***0.068 **0.033−0.054 *0.0421
DIG−0.069 **0.249 ***0.342 ***0.369 ***0.099 ***0.254 ***0.485 ***0.123 ***1
Industry−0.080 ***−0.0080.023−0.055 *0.131 ***0.029−0.124 ***0.013−0.068 **1
City−0.122 ***0.0450.053 *0.082 ***0.093 ***0.0170.081 ***0.110 ***0.158 ***0.082 ***1
Notes: This table shows the correlation coefficients of the key variables used for analysis. The symbols ***, **, and * indicate significance at the 1%, 5%, and 10% confidence levels, respectively.
Table 3. Estimation results of the primary model.
Variable(1)(2)(3)(4)(5)(6)
COI COI COI COI COI COI
Network1−0.277 **−0.283 **
(−2.36)(−2.43)
Network2 −0.214 ***−0.216 ***
(−3.57)(−3.62)
Net1 −0.0910.033
(−0.39)(0.14)
Net2 −1.354−1.478 *
(−1.54)(−1.69)
Net3 −0.107−0.123
(−0.90)(−1.05)
Net4 −0.286 **−0.314 **
(−2.25)(−2.47)
Net5 −0.226 **−0.208 *
(−2.08)(−1.92)
Age−0.190 **−0.140−0.142−0.092−0.134−0.084
(−2.23)(−1.63)(−1.63)(−1.06)(−1.60)(−1.00)
Lnsqu0.229 ***0.231 ***0.231 ***0.232 ***0.217 ***0.216 ***
(6.19)(6.26)(6.26)(6.32)(6.11)(6.11)
Lnsca0.193 ***0.177 ***0.202 ***0.188 ***0.212 ***0.197 ***
(3.68)(3.36)(3.86)(3.56)(4.22)(3.90)
Ind−0.532 ***−0.498 ***−0.541 ***−0.506 ***−0.501 ***−0.469 ***
(−4.98)(−4.66)(−5.10)(−4.78)(−4.86)(−4.55)
DIG−0.166 ***−0.152 ***−0.147 ***−0.133 ***−0.149 ***−0.136 ***
(−4.35)(−2.21)(−3.82)(−3.44)(−4.02)(−3.65)
IndustryNoYesNoYesNoYes
CityNoYesNoYesNoYes
Cons−2.526 ***−2.391 ***−2.636 ***−2.509 ***−2.660 ***−2.525 ***
(−10.62)(−9.77)(−11.11)(−10.28)(−11.55)(−10.68)
N122612261226122612261226
R20.0940.1050.0990.1100.1030.116
Notes: ***, **, and * indicate significance at the 1%, 5%, and 10% confidence levels, respectively. The t-statistics are reported in parentheses.
Table 4. Quantile regression results regarding the heterogeneity of carbon emissions.
Variable(1)(2)(3)(4)(5)(6)
COI COI
25%50%75%25%50%75%
Network1−0.178−0.273 **−0.352 ***
(−1.00)(−2.26)(−3.01)
Network2 −0.174 **−0.190 ***−0.220 ***
(−2.18)(−2.94)(−3.90)
ControlsYesYesYesYesYesYes
IndustryYesYesYesYesYesYes
CityYesYesYesYesYesYes
Cons−3.199 ***−2.366 ***−1.312 ***−3.339 ***−2.489 ***−1.380 ***
(−7.49)(−9.54)(−3.97)(−8.04)(−11.52)(−4.57)
N122612261226122612261226
Notes: *** and ** indicate significance at the 1% and 5% confidence levels, respectively. The t-statistics are reported in parentheses.
Table 5. Regression results regarding the heterogeneity of the digitization level.
Variable(1)(2)(3)(4)
Low_DigitizationHigh_DigitizationLow_DigitizationHigh_Digitization
Network1−0.127−0.694 ***
(−0.89)(−3.30)
Network2 −0.075−0.332 ***
(−0.89)(−3.92)
ControlsYesYesYesYes
IndustryYesYesYesYes
CityYesYesYesYes
Cons −2.989 ***−1.534 ***−3.012 ***−1.865 ***
(−9.01)(−3.98)(−9.08)(−4.92)
N750476750476
R20.0840.1890.0840.196
Notes: *** indicates significance at the 1% confidence levels, respectively.
Table 6. Results of mediating effect and regulating effect tests.
VariableMediating Effect (Stepwise Test Model)Regulating Effect
(1)(2)(3)(4)(5)(6)
PTNCOIPTNCOICOICOI
Network11.760 ***−0.231 **
(3.80)(−1.98)
Network2 1.711 ***−0.169 **
(7.34)(−2.79)
PTN −0.030 *** −0.027 ***
(−4.18) (−3.76)
Network1 × PTN −0.033 ***
(−4.13)
Network2 × PTN −0.016 ***
(−4.29)
ControlsYesYesYesYesYesYes
IndustryYesYesYesYesYesYes
CityYesYesYesYesYesYes
Cons−4.586 ***−2.528 ***−3.720 ***−2.611 ***−2.635 ***−2.644 ***
(−4.73)(−10.31)(−3.89)(−10.68)(−10.64)(−10.68)
Sobel Z −0.053 ** −0.047 ***
(−2.810) (−3.343)
N122612261226122612261226
R20.1920.1180.2150.1210.1130.114
Notes: *** and ** indicate significance at the 1% and 5% confidence levels, respectively. The t-statistics are reported in parentheses.
Table 7. Results of mediating effect test based on the bias-corrected bootstrap approach.
Mediating VariableConduction PathEffectCoefficient of InfluenceStandard Error95% Confidence Interval
(1)(2)(3)(4)LimitLower Limit
PTNCOI-PTN-Network1Indirect−0.053 ***0.018−0.089−0.017
COI-PTN-Network1Direct−0.231 **0.116−0.456−0.004
COI-Network1Total−0.284 **0.116−0.511−0.056
PTNCOI-PTN-Network2Indirect−0.047 ***0.014−0.075−0.019
COI-PTN-Network2Direct−0.169 ***0.061−0.288−0.050
COI-Network2Total−0.216 ***0.060−0.334−0.098
Notes: *** and ** indicate significance at the 1% and 5% confidence levels, respectively.
Disclaimer/Publisher’s Note: The statements, opinions and data contained in all publications are solely those of the individual author(s) and contributor(s) and not of MDPI and/or the editor(s). MDPI and/or the editor(s) disclaim responsibility for any injury to people or property resulting from any ideas, methods, instructions or products referred to in the content.

