
Towards Clean Energy Transition: An Exploratory Case Study from Rural Egypt


Abstract
1. Introduction
1.1. Research Background
1.1.1. RE: Towards a Clean-Energy Transition
1.1.2. Diagnosing the Built Environment and Building Consumption for Energy Transition
1.1.3. Diagnosing the Correlation for Energy Transition in Egypt
1.2. State of the Art
1.3. Objective
1.4. Hypothesis
1.5. Research Questions
- RQ1. What is the current energy-use intensity (EUI) of rural buildings in Egypt, and what factors of built-environment elements and socio-economics influence the domestic energy consumption, mostly?
- RQ2. What is the techno-economic assessment of installing PV panels to promote renewable rural energy communities in Egypt within the current regulatory framework?
2. Methodology
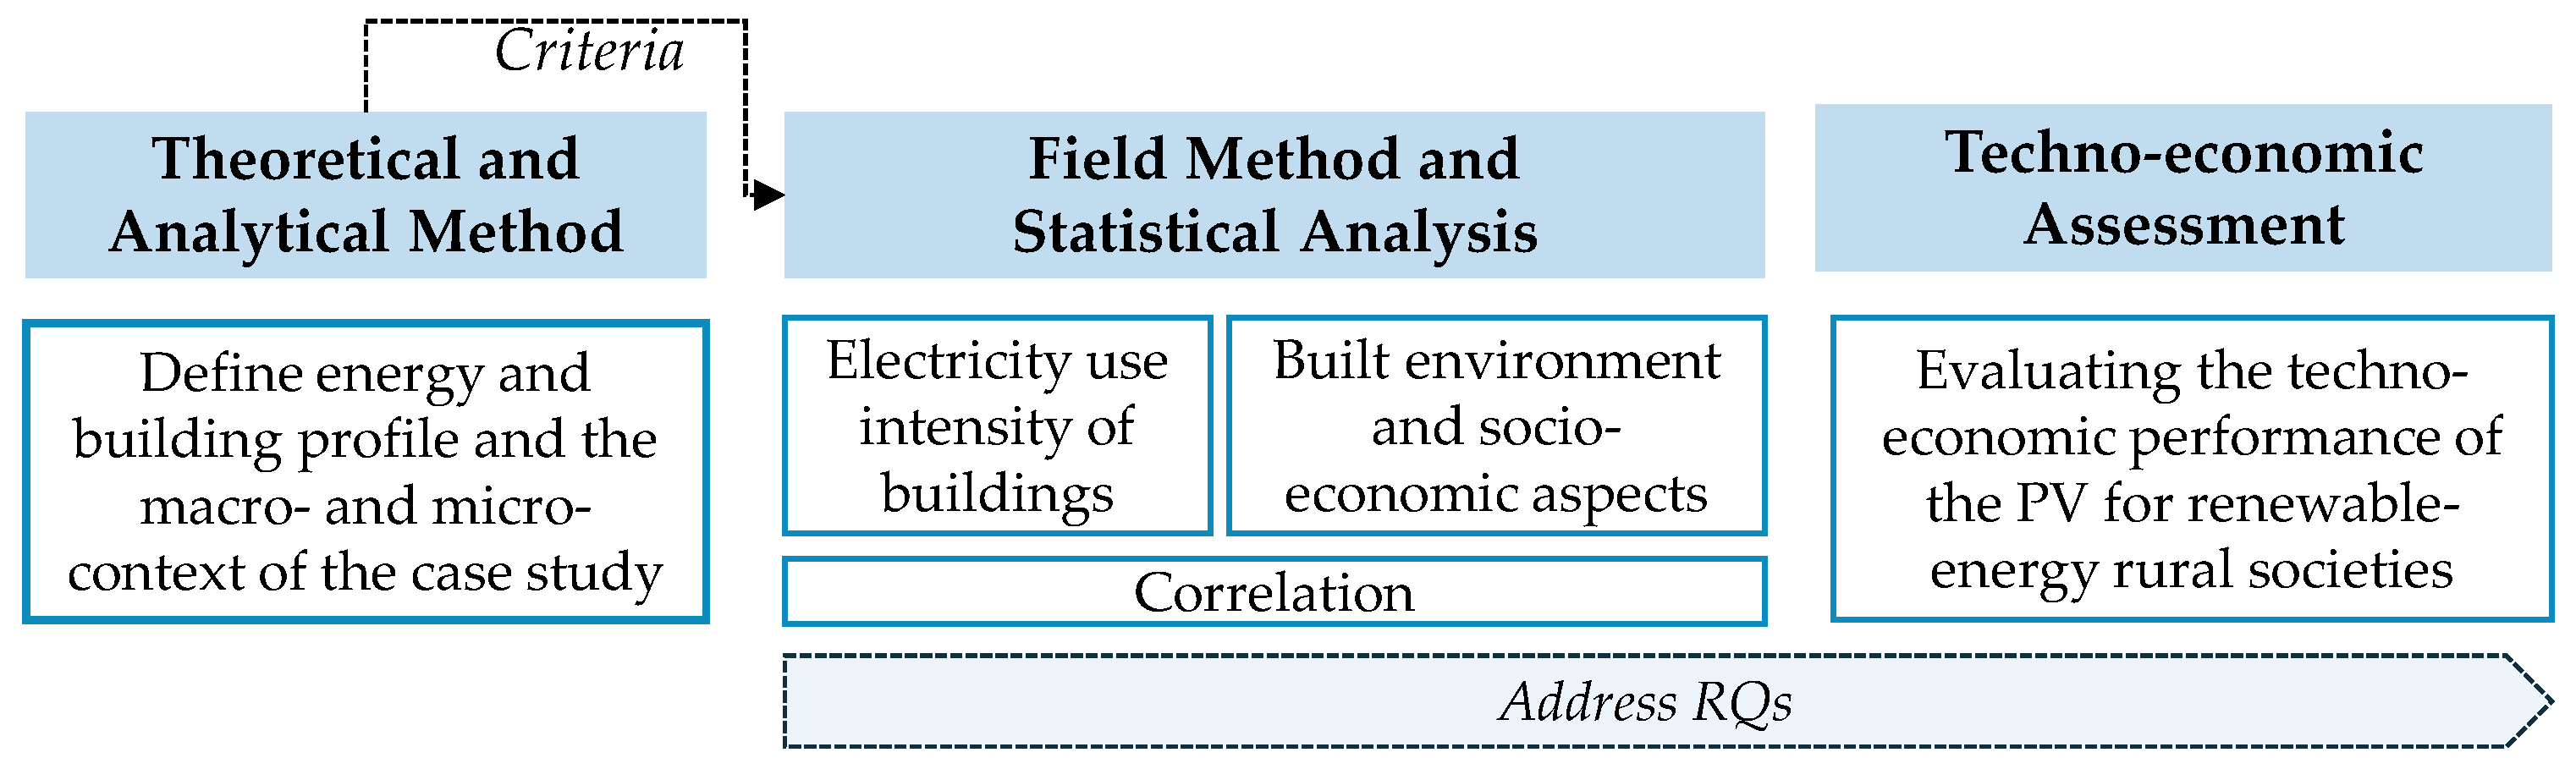
Study Structure and Methodology
- Part 1—Theoretical and Analytical Methods
- Part 2—Field Method and Statistical Analysis
- Diagnose the current consumption patterns of residential and non-residential buildings (Section 3.2.1 and Section 3.2.2).
- Designate the relatedness between dependents and independent variables resulting from the questionnaire, using two statistical models: the Pearson Correlation Coefficient to characterize the correlation between numerical building characteristics and electricity consumption, and the nominal one-way Analysis of Variance (ANOVA) to investigate electricity consumption, socio-economic activities, and urban settings (Section 3.2.3).
- Part 3—Techno-economic assessment of installing PV panels
3. Results
3.1. Defining the Case Study
3.1.1. Energy Profile and Building in Rural Egypt, at a Glance
3.1.2. Macro-Context: Delta Region, Egypt
3.1.3. Macro-Context: Lasiafar Albalad Village
3.2. Field Study Results
3.2.1. Phase 1: Interviews
3.2.2. Phase 2: Questionnaire and Data Collection
Questionnaire Design
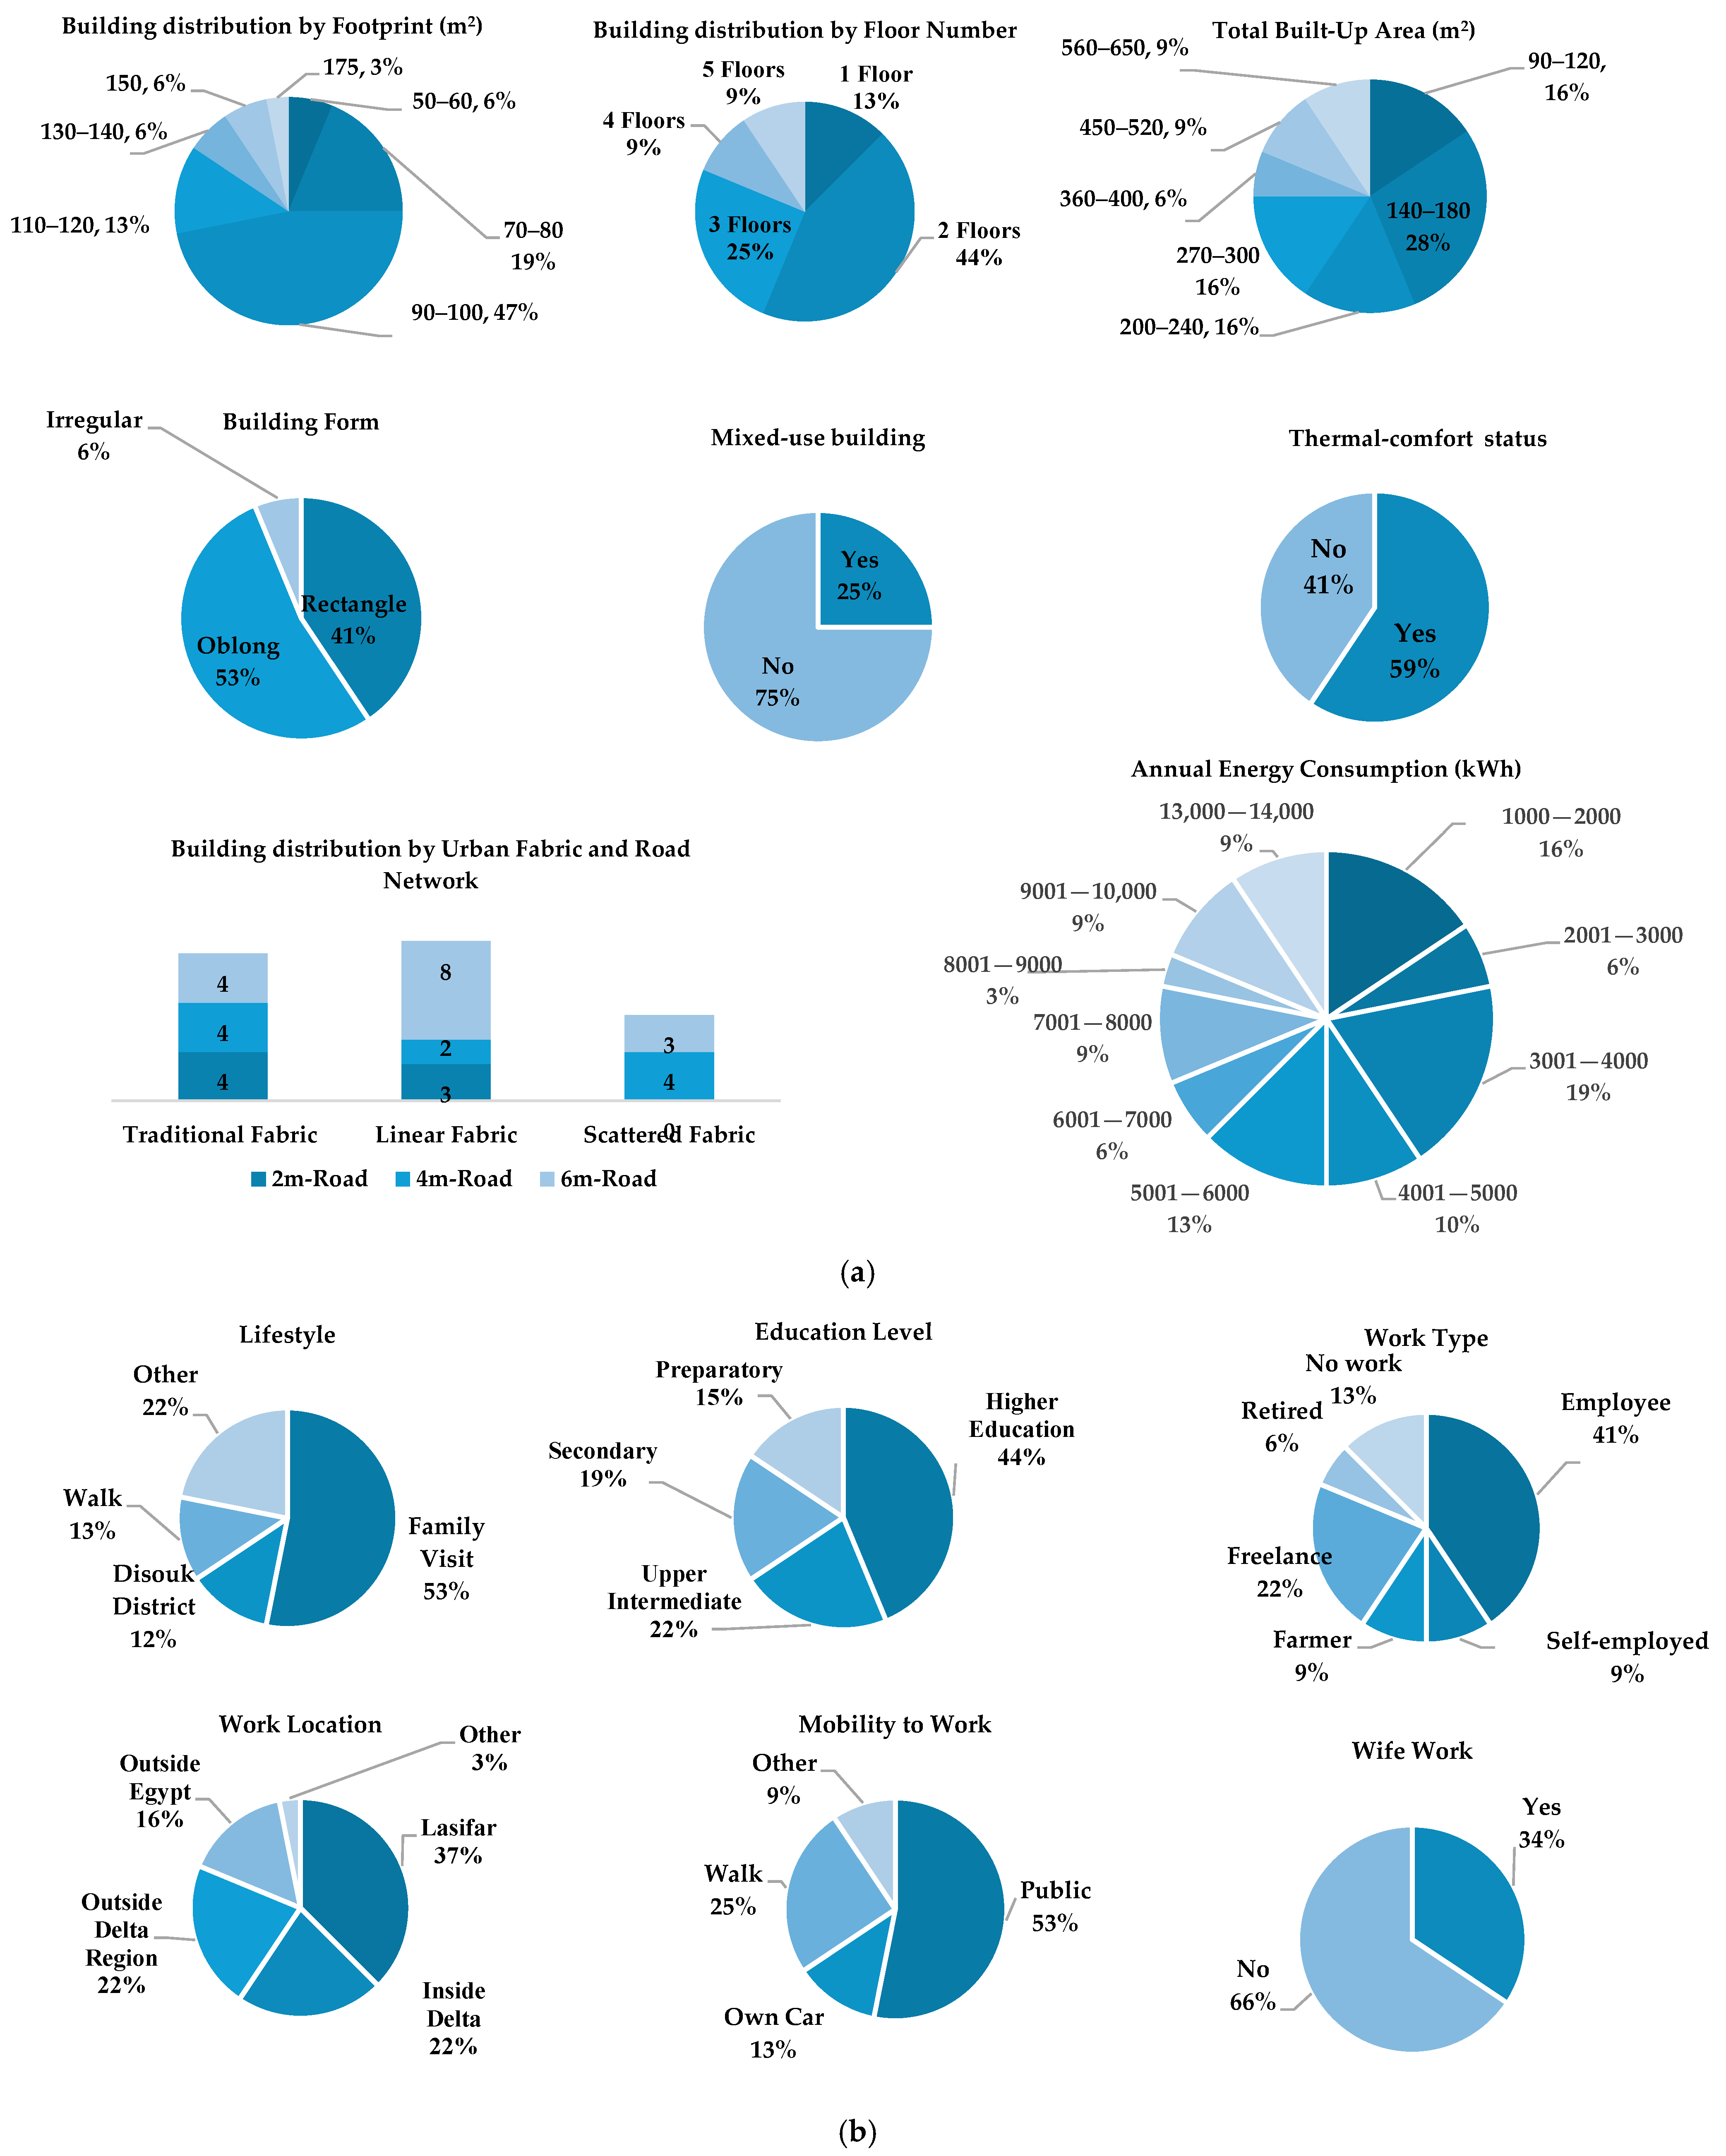
- Building characteristics: floor area, floor number, building form, orientation, building type (residential or mixed-use and, if mixed-use, what kind), and monthly average in summer and winter for the dwelling and for the entire building.
- Socio-economic activities: household size in dwellings, household size in the buildings, if any, household breadwinner’s work type, working as a farmer or not, mobility to work, breadwinner’s work location, lifestyle, and finally, wife’s work status.
- Urban characteristics: location by urban fabric and location by road network
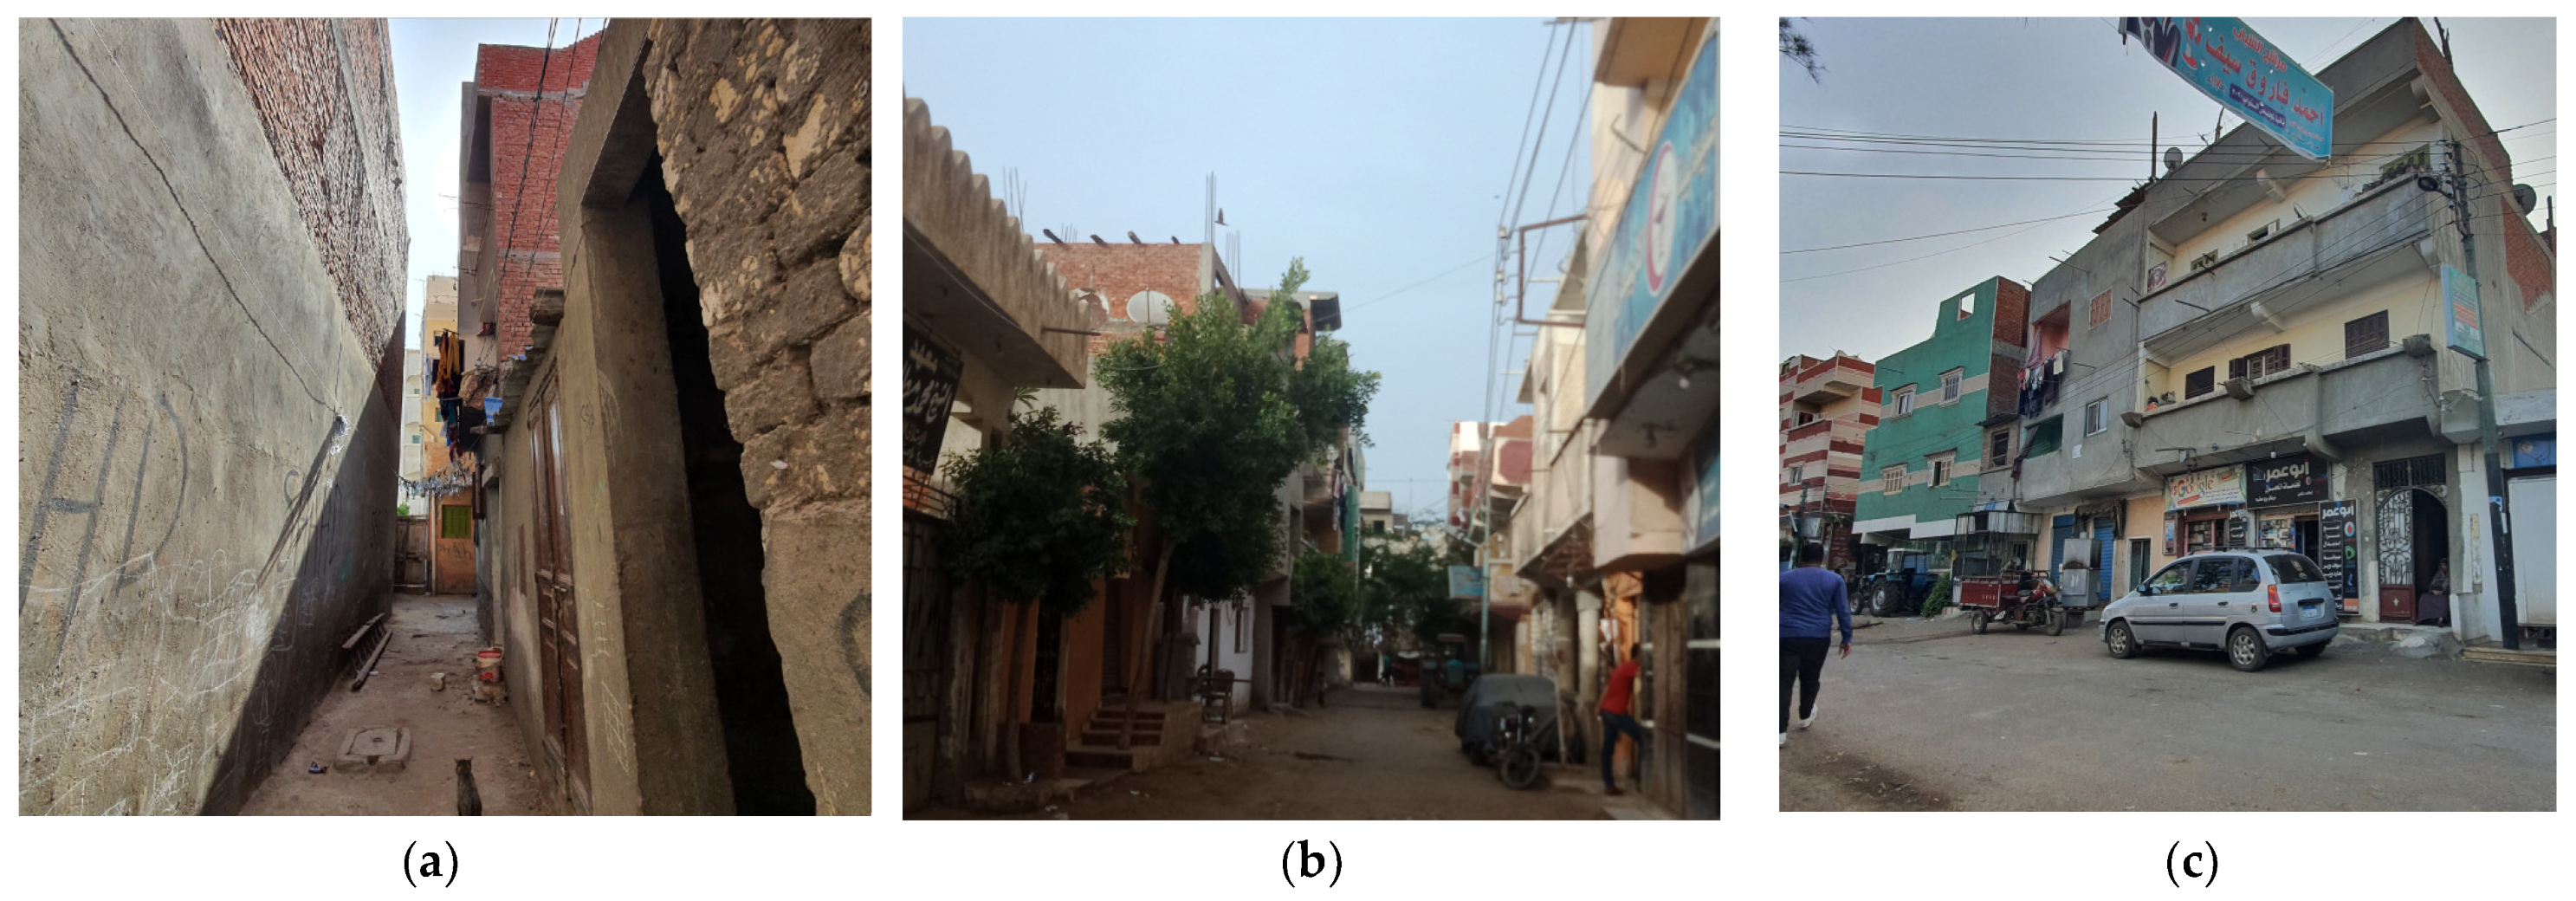
- Is the building by the main road? This indicates that the linear urban fabric and the main road in the village, which is usually typical for most Egyptian villages, are aligned with the water body, as seen in Figure 4c.
- Is it near the village’s boundaries, like those near the healthcare buildings or cemeteries? This signifies the scattered urban fabric, e.g., Figure 4b.
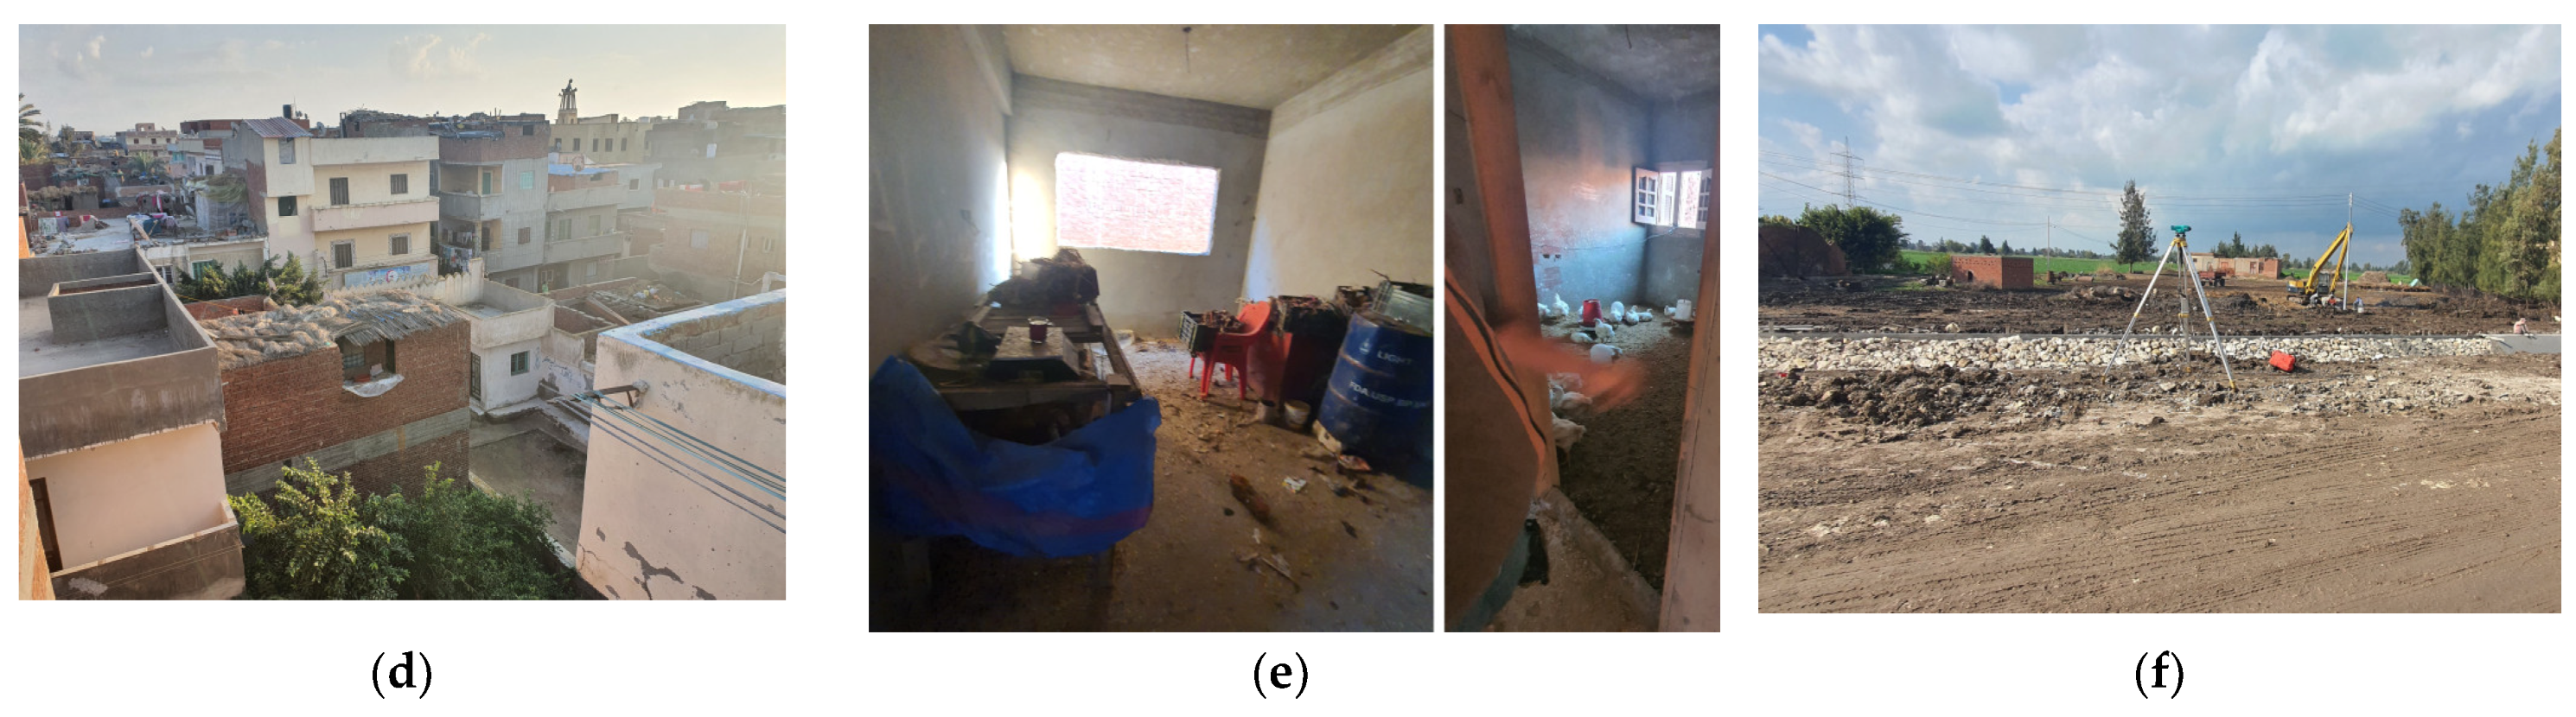
- What is the road width in front of your building: 2, 4, or 6 meters? The replies to this question indicated that the buildings located on 2 m roads are entirely located on the compacted urban fabric, e.g., Figure 3a; likewise, the 4 m roads complied with the position of the scattered, e.g., Figure 3b, and the 6 m road with the linear, e.g., Figure 3c,f.
- Is there any activity on the ground floor, such as a shop, pharmacy, studio, or dairy factory? If yes (like the one shown in Figure 3c), indicate the activity type.
- Is the building regular (square form), elongated and regular (rectangular form), or is the house unusually elongated and irregular (with projections and recesses in the facade)? This answer relies on the landlord’s perception and description.
- The respondents were asked whether they felt thermal comfort. Hence, the question was whether your building is “Bahary”, meaning orientation towards the north seaside, and meaning good conditions, or “Kibli”, meaning the building is oriented towards the south, expressing uncomfortable conditions.
Questionnaire Sample and Results
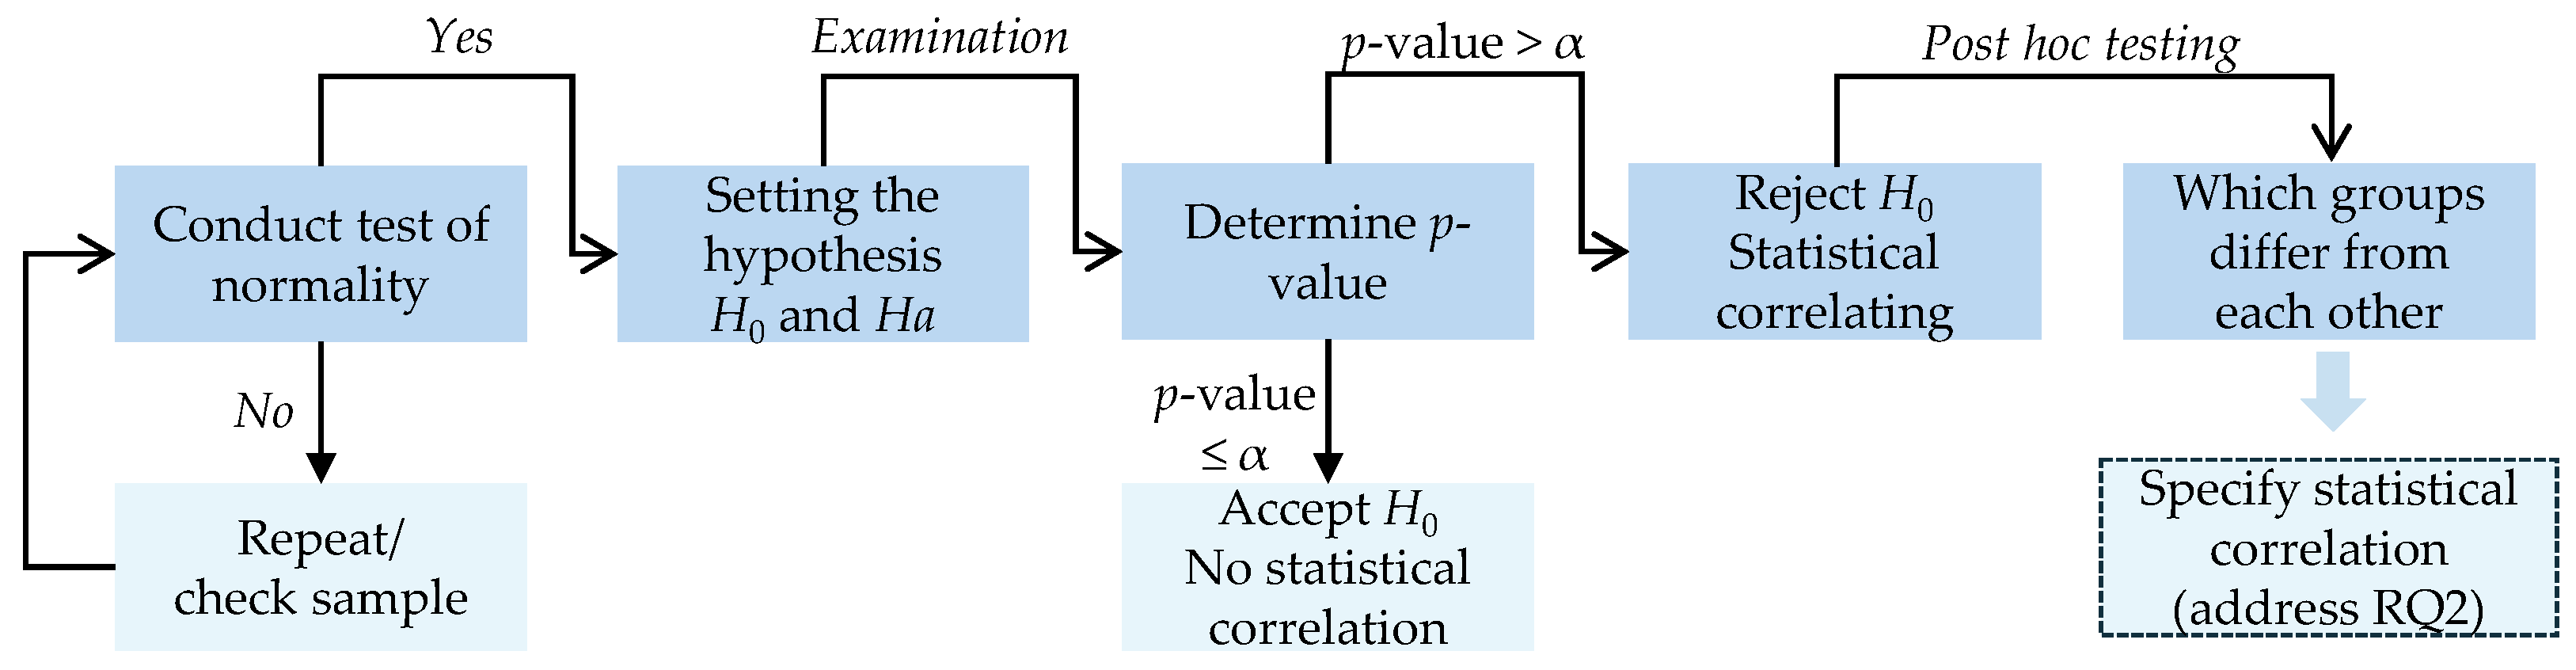
3.2.3. Statistical Analysis
- Ordinal scale measurements are data that have some orders and ranks.
- Nominal scale measurements refer to names of tags that do not have numerical values for categorizing such an object. In our study, they are represented by socio-economic variables (e.g., lifestyle, economic activity, and mobility to work) and built-environment variables (e.g., building position by road width or urban tissue and building form).
- Ratio (continuous) scale measurements with interval data qualities, like the natural zero point; in this study, they are represented by electricity consumption and building characteristics (e.g., footprint, floor number, household size, and built-up type).
- Interval scale measurements: the measured data on a scale showing the distance from one to another.
Numerical Data: Pearson Correlation Coefficient
Socio-Economic Activities

| Group Code | Group Description | Mean (kWh) | Standard Deviation (SD) | f-Value | p-Value | Statistically Significant |
|---|---|---|---|---|---|---|
| 1 | Family Visits | 6654.35 | 3577.10 | |||
| 2 | Going to the Disouk | 8397 | 4390.266 | 4.432 | 0.011 | Yes |
| 3 | Walking | 5178 | 2834.736 | |||
| 4 | Other | 2040 | 1074.430 |
| Lifestyle Groups with Electricity Consumption | Mean Differences Between Groups (kWh) | p-Value | Statistically Significant |
|---|---|---|---|
| (2) Going to the Disouk, (4) Other | 6357 | 0.020 | Yes |
| (1) Family Visits, (4) Other | 4614.355 | 0.018 |
| Group Code | Group Description | Mean (kWh) | SD | f-Value | p-Value | Statistically Significant |
|---|---|---|---|---|---|---|
| 1 | University Education | 5030.57 | 2448.254 | |||
| 2 | Above Intermediate | 6516 | 3734.526 | 0.358 | 0.783 | No |
| 3 | Secondary | 6540 | 5021.819 | |||
| 4 | Preparatory | 5284 | 5685.529 |
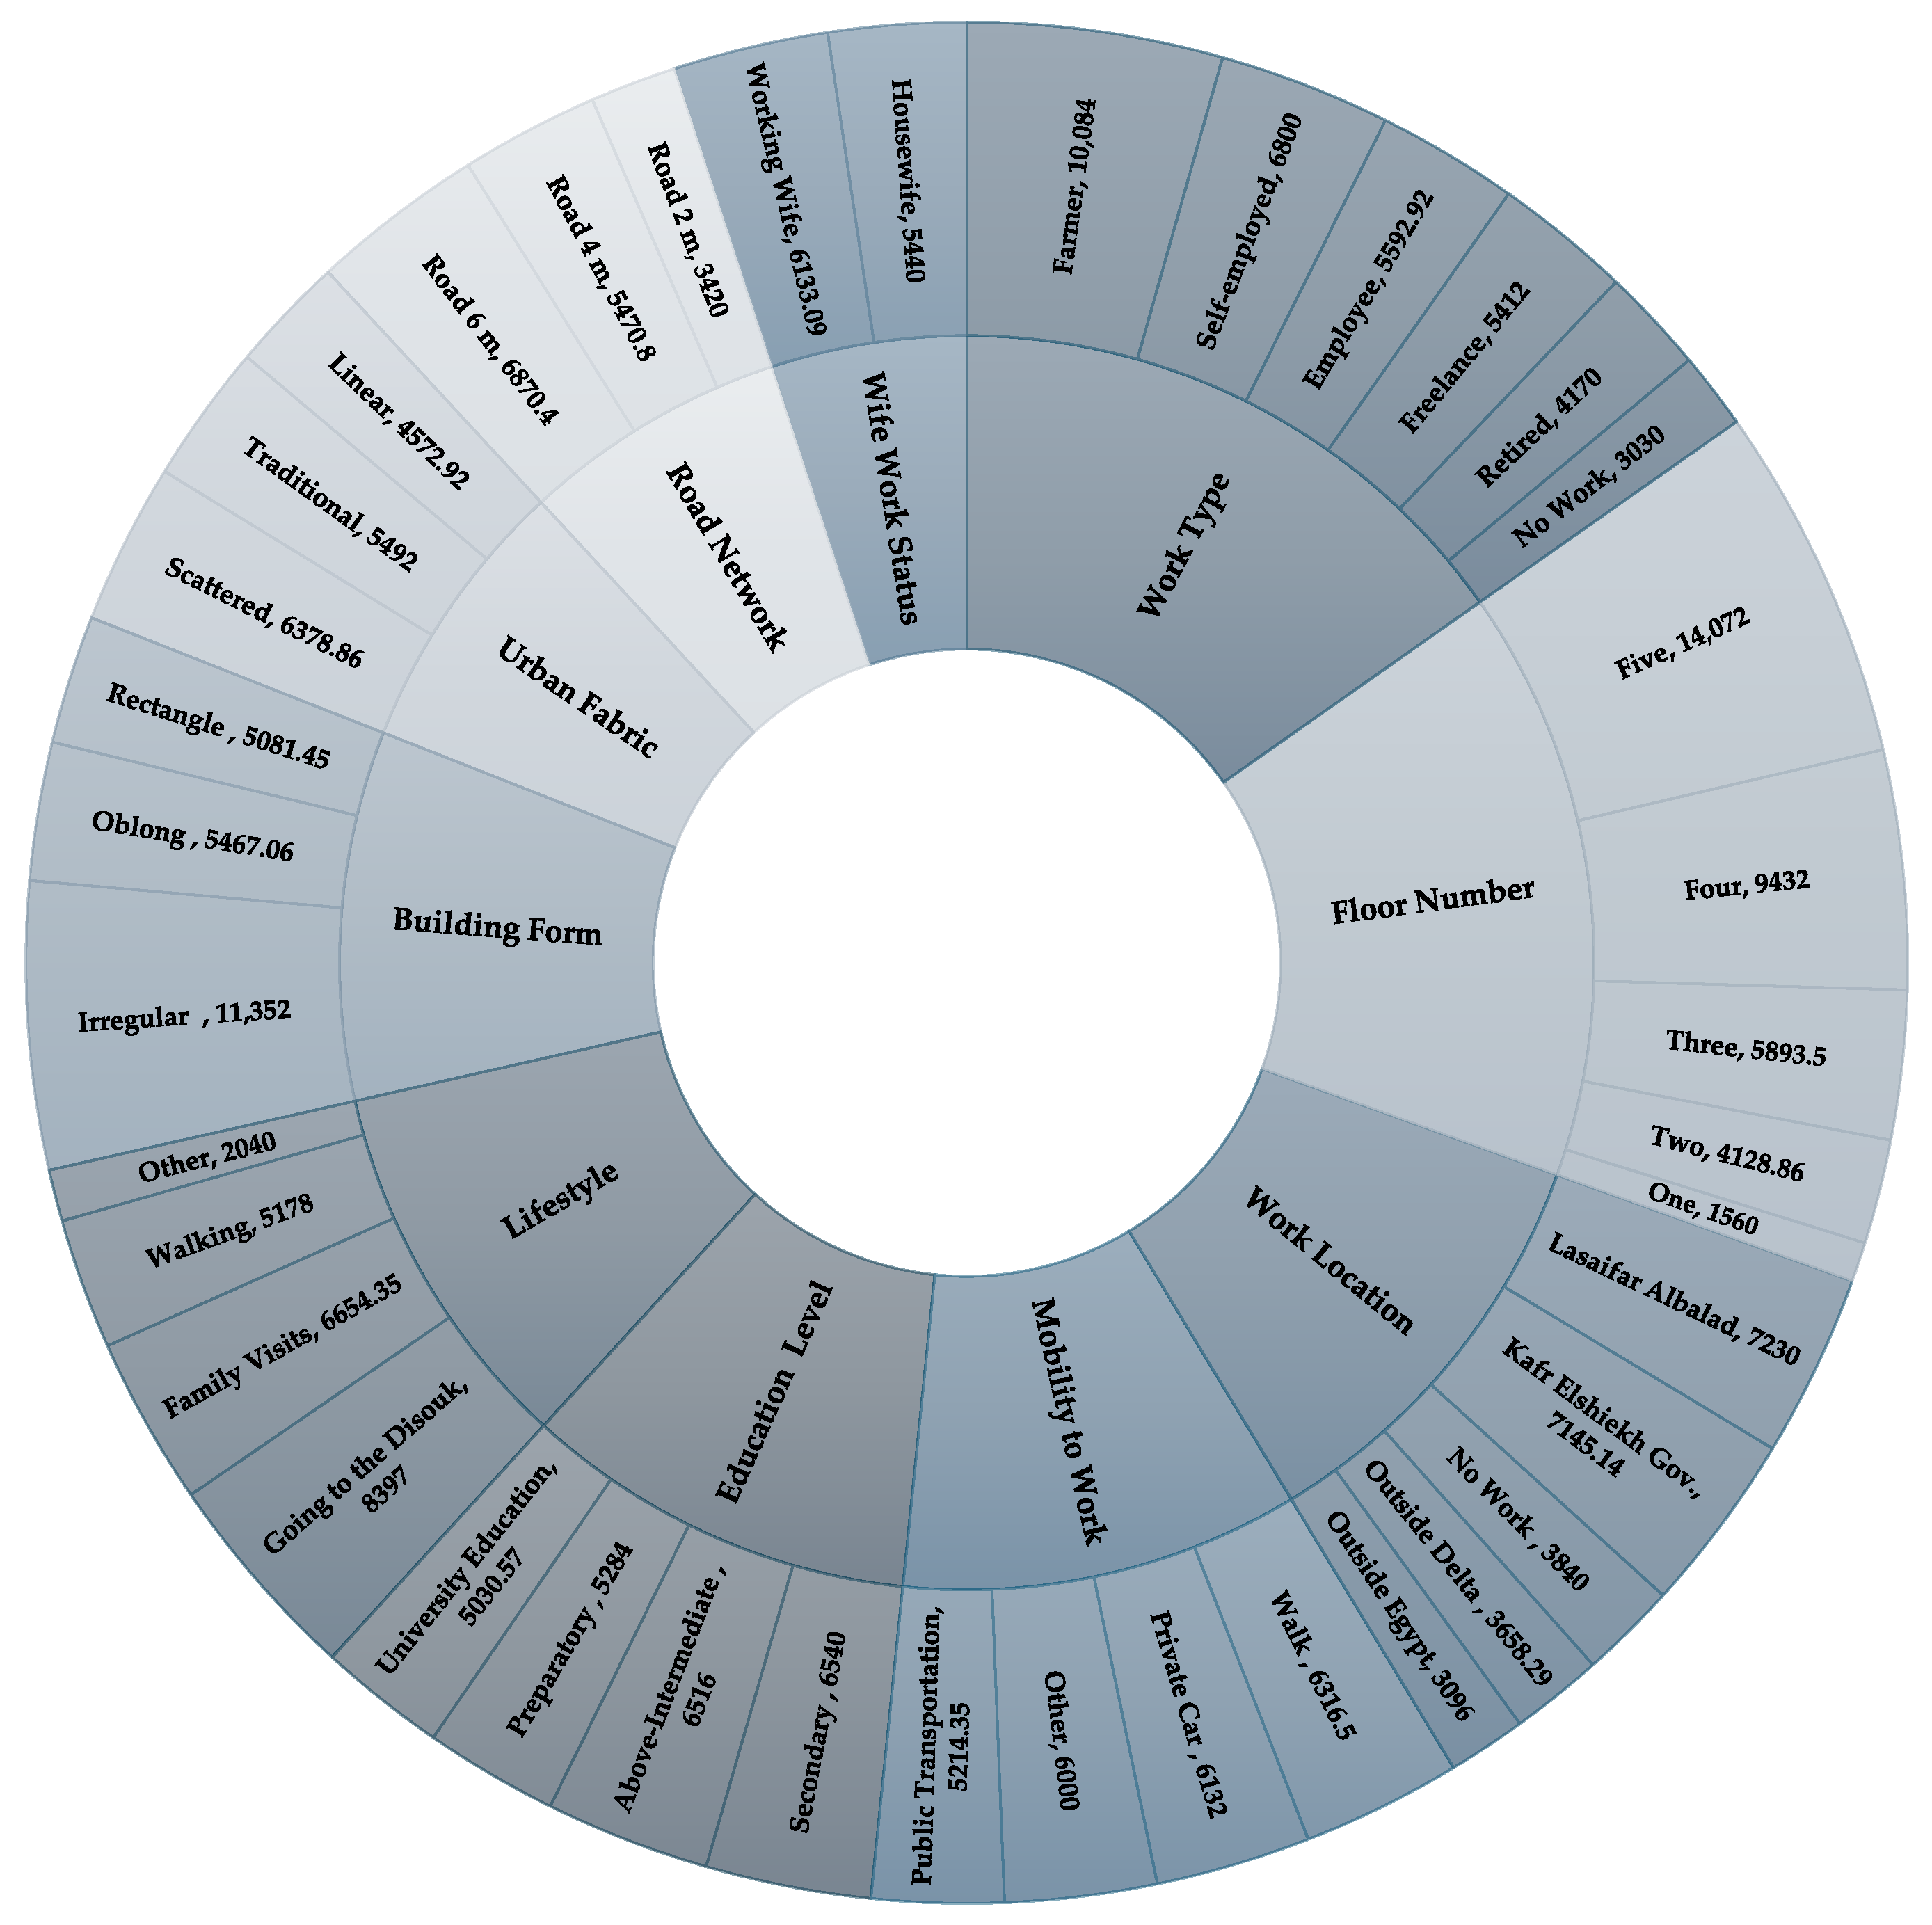
- The buildings where the people work as farmers have the highest annual electricity consumption mean, of 10,084 kWh, while the lowest mean in the buildings where their residents are not working is 3030 kWh. However, the statistical analysis results indicated that the p-value equals 0.235 (more than 0.05), which means there is no statistical significance between work type and electricity-consumption variables. In other words, no observed effect and no multiple comparisons are required.
- By work location, the buildings of the people working inside the village have the highest mean, of 7230 kWh, and the lowest occurred in the buildings where their residents work abroad, in Egypt, of 3096 kWh. However, the statistical analysis revealed that the p-value equals 0.087; therefore, there is no observed effect between the work location and electricity consumption.
- With respect to mobility means to work, the lowest electricity-consumption average happened in the buildings where residents rely on public transportation, at 5214.35 kWh, and the highest was for the buildings where their residents tend to walk to work, while the other means have a similar average. However, the statistical analysis revealed that the p-value equals 0.911; therefore, there is no effect between mobility to work and electricity consumption.
- Based on the wives’ work status, the buildings where the wives work consume an average annual of 6133 kWh more energy than those where the wives do not work, which is 5440 kWh. However, the statistical analysis revealed that the p-value equals 0.626; therefore, there is no observed effect between the wife’s work status and energy consumption.
| Group Code | Group Description | Mean (kWh) | SD | f-Value | p-Value | Statistically Significant |
|---|---|---|---|---|---|---|
| Work Type | ||||||
| 1 | Employee | 5592.92 | 2533.883 | |||
| 2 | Self-employed | 6800 | 1705.872 | |||
| 3 | Farmer | 10,084 | 7706.227 | 1.465 | 0.235 | No |
| 4 | Freelance | 5412 | 4318.061 | |||
| 5 | Retired | 4170 | 466.690 | |||
| 6 | No Work | 3030 | 2833.161 | |||
| Work Location | ||||||
| 1 | Lasaifar Albalad | 7230 | 4827.620 | |||
| 2 | Kafr Elshiekh Gov. | 7145.14 | 2480.721 | |||
| 3 | Outside Delta | 3658.29 | 1808.054 | 2.277 | 0.087 | No |
| 4 | Outside Egypt | 3096 | 1648.417 | |||
| 5 | No Work | 3840 | 0 | |||
| Mobility to Work | ||||||
| 1 | Public Transportation | 5214.35 | 3101.115 | |||
| 2 | Private Car | 6132 | 3639.398 | 0.177 | 0.911 | No |
| 3 | Walk | 6316.50 | 5490.798 | |||
| 4 | Other | 6000 | 3186.785 | |||
| Wife’s Work Status | ||||||
| 1 | Working Wife | 6133.09 | 3074.036 | |||
| 2 | Housewife | 5440 | 4092.959 | 0.242 | 0.626 | No |
Urban Fabric and Building Characteristics
- With respect to building form, the results revealed that irregular buildings consumed the highest annual electricity consumption, a mean of 11,352 kWh, nearly double that of each different form. However, the statistical analysis results indicated that the p-value equals 0.078; hence, there is no observed effect between building form and electricity consumption.
- With respect to floor number, the results confirmed a positive link between the floor number and energy consumption; the five floors had the highest consumption of 14,072, while the one-floor buildings consumed an annual average of 1560 kWh. Although it makes sense that the higher the floor number, the more consumption, likewise, for the footprint variable, the results revealed that the p-value is less than 0.001 (a very high significance level). This means there is a statistical significance for between-group variables, so post hoc testing to enable multiple comparisons is conducted, to determine the mean differences. Table 8 shows the variance between the floor-number group variables, confirming this strong positive correlation.
- With respect to urban fabric, the buildings on the scattered fabric consume the highest annual average, of 6378.86 kWh, while the buildings at the linear fabric consume the lowest yearly average, of 4572.92 kWh. However, the statistical analysis results indicated that the p-value equals 0.626; hence, there is no observed effect between building location by urban fabric and electricity consumption.
- With respect to building position on the road network, buildings on roads with a width of 6 m consume the highest annual average, of 6870.40 kWh, followed by 4 m and 2 m width roads; this indicates a positive correlation between the width of the road and electricity consumption. However, the results showed that the p-value equals 2.218, meaning that no statistical effect was observed between location by urban fabric and electricity consumption.
| Group Code | Group Description | Mean | (SD) | f-Value | p-Value | Statistically Significant |
|---|---|---|---|---|---|---|
| Building Form | ||||||
| 1 | Rectangular Form | 5081.45 | 3253.906 | |||
| 2 | Oblong Form | 5467.06 | 3788.301 | 2.785 | 0.078 | No |
| 3 | Irregular Form | 11,352 | 2562.555 | |||
| Floor Number | ||||||
| 1 | One Floor | 1560 | 5321.165 | |||
| 2 | Two Floors | 4128.86 | 1983.013 | |||
| 3 | Three Floors | 5893.50 | 1799.388 | 30.937 | <0.001 | Yes |
| 4 | Four Floors | 9432 | 806.146 | |||
| 5 | Five Floors | 14,072 | 900.107 | |||
| Urban Fabric | ||||||
| 1 | Traditional Fabric | 5492 | 3659.470 | |||
| 2 | Linear Fabric | 4572.92 | 3823.805 | 0.242 | 0.626 | No |
| 3 | Scattered Fabric | 6378.86 | 4200.079 | |||
| Road Network | ||||||
| 1 | Road 2 m | 3420 | 1535.187 | |||
| 2 | Road 4 m | 5470.80 | 3089.142 | 2.218 | 0.127 | No |
| 3 | Road 6 m | 6870.40 | 4436.363 |
| Floor Number with Electricity Consumption | Mean Differences Between Groups | p-Value | Statistically Significant |
|---|---|---|---|
| (5) Five Floors: (1) One Floor | 12,512 | >0.001 | |
| (5) Five Floors: (2) Two Floors | 9943.143 | >0.001 | |
| (5) Five Floors: (2) Three Floors | 8178.500 | >0.001 | Yes |
| (5) Five Floors: (2) Four Floors | 4640 | 0.002 |
3.2.4. Techno-Economic Assessment of Installing PV
| Segment | 1st | 2nd | 3rd | 4th | 5th | 6th | 7th | |
| Consumption range (kWh) * | 0–50 | 50–100 | 101–200 | 201–350 | 351–650 | 651–1000 | >1000 | Selling price of kWh/RE |
| Price (EGP) * | 0.68 | 0.78 | 0.95 | 1.55 | 1.95 | 2.10 | 2.23 | 0.016 |
| Price (USD) ** | 0.014 | 0.016 | 0.019 | 0.031 | 0.040 | 0.043 | 0.045 | |
| Maximum expenditure according to consumption | ||||||||
| Monthly (kWh) | 50 | 100 | 200 | 350 | 650 | 1000 | N/A | |
| Annually (kWh) | 600 | 1200 | 2400 | 4200 | 7800 | 12,000 | ||
| Monthly (USD) | 0.7 | 1.6 | 3.8 | 10.85 | 26 | 43 | ||
| Annually (USD) | 8.4 | 19.2 | 45.6 | 130.2 | 312 | 516 | ||
| Segment Group | Annual Consumption (kWh) | Annual Expenditure in Electricity (USD) | PV Unit Generation (kWh) | Surplus in Electricity Generation (kWh) | Selling Price (0.016 USD/kWh) | Economic Benefit (Saving + Generation) (USD) | Initial Cost (USD) | Economic Profitability | |
|---|---|---|---|---|---|---|---|---|---|
| SPP | NPV at 25 Years (USD) | ||||||||
| First | 600 | 8.4 | 8500 | 136 | 144.4 | 24.9 | −3066 | ||
| Second | 1200 | 19.2 | 7900 | 126.4 | 145.6 | 24.7 | −3062 | ||
| Third | 2400 | 45.6 | 9100 | 6700 | 107.2 | 152.8 | 3600 | 23.6 | −3035 |
| Fourth | 4200 | 130.2 | 4900 | 78.4 | 208.6 | 17.3 | −2829 | ||
| Fifth | 7800 | 312 | 1300 | 20.8 | 332.8 | 10.8 | −2370 | ||
| Sixth | 12,000 | 516 | −2900 | −46.4 | 469.6 | 7.7 | −1865 | ||
4. Discussion
4.1. Addressing RQ1
4.2. Addressing RQ2
5. Conclusions and Implications
5.1. Policy Implications
5.2. Limitation and Future Direction
Supplementary Materials
Author Contributions
Funding
Institutional Review Board Statement
Informed Consent Statement
Data Availability Statement
Acknowledgments
Conflicts of Interest
Abbreviations
| ANOVA | Analysis of Variance (statistical formula) |
| EUI | Energy Use Intensity (energy efficiency indicator |
| GHG | Greenhouse gas |
| Mt CO2eq | Metric ton of carbon dioxide equivalent (measurement unit) |
| NEEAP | National Energy Efficiency Action Plan |
| NPV | Net present value (economic assessment indicator) |
| PV | Photovoltaic |
| R value | Correlation coefficient (statistical indicator) |
| RE | Renewable energy |
| RQ | Research Question |
| SD | Standard deviation (statistical measure) |
| SDG | Sustainable Development Goal |
| SPP | Simple payback period (economic assessment indicator) |
| p value | Probability value (statistical measure) |
Appendix A
| Source | DF | SS | MS | F | p |
|---|---|---|---|---|---|
| Between-Group (factor) | m − 1 | SS (Between) | MST | MST/MSE | absolute value |
| Within-Group (Error) | n − m | SS (Error) | MSE | ||
| n − 1 | SS (Total) |
| Acrynom | Description | Equation | Definition and Rationale |
|---|---|---|---|
| H0 | Null hypothesis | (A1) | Indicates no difference among group means (no statistical correlation observed). |
| Ha | Alternative hypothesis | (A2) | Indicates statistically significant result occurs (one group varies significantly, with respect to all means of the dependent variable). |
| α | Significance level (alpha) | N/A (absolute value) | Assumes the probability of error with a percentage, usually 5%, in the study’s results; in simple words, if the study is repeated 100 times, the same results will occur 95 times. |
| f-value | Probability value | (A3) | In the ratio of the between-group and within-group variance, a higher f-value indicates the higher difference between sample means, relative to the variation within the samples. The f-value is essential to determine the p-value (see below, in this table). |
| SST | Sum of Squares (Total) | (A4) | The total variation that can be assigned to different factors (the essential factor to determine the f-value) is determined by the sum of squares between groups. |
| SSB | Sum of Squares (Between) | N/A (input to Equation (A4)) | The sum of squares between the group means and the grand mean. |
| SSE | Sum of Squares (Error) | N/A (input to Equation (A4)) | The sum of squares between the data and the group means. |
| MS | Mean Square | N/A | To evaluate the variance between sample means with respect to the overall sample mean; in other words, it is the variance between groups (input in ANOVA table, Table A1). |
| MSB | Mean Square due to Treatment | (A5) | Estimating sample mean variance from the overall mean (input in ANOVA table, Table A1). |
| MSE | Mean Square due to Error | (A6) | Estimating the sample variances for the population variance (input in ANOVA table, Table A1). |
| p-value | Probability value | Absolute value | It examines the hypothesis (the probability assuming no difference between variables—the null hypothesis). Where if p-value ≤ α, reject H0 in favor of Ha, while if p-value > α, do not reject H0. |
| DF | Degree of freedom | N/A (input to ANOVA table) | To determine the dependent variables which can be used in the analysis. If n total variable data are collected, the DF = n − 1. If there are m groups for comparison, the DF = m − 1 is associated with the interest factor, and finally, if there are n total variable data collected and m groups for comparison, the DF = n − m. |
References
- Dasgupta, P.; Morton, J.; Dodman, D.; Karapinar, B.; Meza, F.; Rivera-Ferre, M.G.; Toure Sarr, A.; Vincent, K.E. Rural Areas. In Climate Change 2014: Impacts, Adaptation, and Vulnerability. Part A: Global and Sectoral Aspects. Contribution of Working Group II to the Fifth Assessment Report of the Intergovernmental Panel on Climate Change; Field, C.B., Barros, V.R., Barros, D.J., Dokken, K.J., Mach, M.D., Mastrandrea, T.E., Bilir, M., Chatterjee, K.L., Ebi, Y.O., Estrada, R.C., et al., Eds.; Cambridge University Press: Cambridge, UK; New York, NY, USA, 2014; pp. 613–657. [Google Scholar]
- IEA. World Energy Outlook 2023; IEA: Paris, France, 2023. [Google Scholar]
- Li, M.; Jin, T.; Liu, S.; Zhou, S. The Cost of Clean Energy Transition in Rural China: Evidence Based on Marginal Treatment Effects. Energy Econ. 2021, 97, 105167. [Google Scholar] [CrossRef]
- Ritchie, H.; Rosado, P.; Roser, M. CO2 and Greenhouse Gas Emissions. Available online: https://ourworldindata.org/co2-and-greenhouse-gas-emissions (accessed on 28 May 2024).
- Clausen, L.T.; Rudolph, D. Renewable Energy for Sustainable Rural Development: Synergies and Mismatches. Energy Policy 2020, 138, 111289. [Google Scholar] [CrossRef]
- Patnaik, A.; Kudal, P.; Dawar, S.; Dawar, P. Sustainable Rural Development through Renewable Energy Technologies: Identification of Potential Methods to Increase Rural Incomes. In IOP Conference Series: Earth and Environmental Science, Jaipur, India, 24–25 June 2022; IOP Publishing: Bristol, UK, 2022; Volume 1084, p. 012020. [Google Scholar]
- Cebotari, S.; Cristea, M.; Moldovan, C.; Zubascu, F. Renewable Energy’s Impact on Rural Development in Northwestern Romania. Energy Sustain. Dev. 2017, 37, 110–123. [Google Scholar] [CrossRef]
- Kothari, S.; Strachan, N. Cooperatives as Bottom-Up Energy System Actors for Increasing Renewables Adoption; EnergyREV, University of Strathclyde Publishing: Glasgow, UK, 2023. [Google Scholar]
- IEA. Renewables 2023 Analysis and Forecast to 2028; IEA: Paris, France, 2024. [Google Scholar]
- Gao, Y. Top-down and Bottom-up Processes for Rural Development and the Role of Architects in Yunnan, China. Buildings 2016, 6, 47. [Google Scholar] [CrossRef]
- Ghorbani, A.; Nascimento, L.; Filatova, T. Growing Community Energy Initiatives from the Bottom up: Simulating the Role of Behavioural Attitudes and Leadership in the Netherlands. Energy Res. Soc. Sci. 2020, 70, 101782. [Google Scholar] [CrossRef]
- Fleiter, T.; Rehfeldt, M.; Herbst, A.; Elsland, R.; Klingler, A.-L.; Manz, P.; Eidelloth, S. A Methodology for Bottom-up Modelling of Energy Transitions in the Industry Sector: The FORECAST Model. Energy Strategy Rev. 2018, 22, 237–254. [Google Scholar] [CrossRef]
- Davis, M. Rural Household Energy Consumption: The Effects of Access to Electricity—Evidence from South Africa. Energy Policy 1998, 26, 207–217. [Google Scholar] [CrossRef]
- Quan, S.J.; Li, C. Urban Form and Building Energy Use: A Systematic Review of Measures, Mechanisms, and Methodologies. Renew. Sustain. Energy Rev. 2021, 139, 110662. [Google Scholar] [CrossRef]
- Centre, E.C.J.R.; Perpiñá Castillo, C.; Hormigos Feliu, C.; Dorati, C.; Kakoulaki, G.; Peeters, L.; Quaranta, E.; Taylor, N.; Uihlein, A.; Auteri, D.; et al. Renewable Energy Production and Potential in EU Rural Areas; Publications Office of the European Union: Luxembourg, 2024. [Google Scholar]
- Shi, Z.; Liang, F.; Pezzuolo, A. Renewable Energy Communities in Rural Areas: A Comprehensive Overview of Current Development, Challenges, and Emerging Trends. J. Clean. Prod. 2024, 484, 144336. [Google Scholar] [CrossRef]
- Furmankiewicz, M.; Hewitt, R.J.; Kazak, J.K. Can Rural Stakeholders Drive the Low-Carbon Transition? Analysis of Climate-Related Activities Planned in Local Development Strategies in Poland. Renew. Sustain. Energy Rev. 2021, 150, 111419. [Google Scholar] [CrossRef]
- Akizu, O.; Bueno, G.; Barcena, I.; Kurt, E.; Topaloğlu, N.; Lopez-Guede, J.M. Contributions of Bottom-up Energy Transitions in Germany: A Case Study Analysis. Energies 2018, 11, 849. [Google Scholar] [CrossRef]
- Bernal, A.; Prin, M.; Ortiz, J. Bottom-Up Energy Transitions: Managing the Rise of Energy Communities in Latin America. Available online: https://www.iea.org/commentaries/bottom-up-energy-transitions-managing-the-rise-of-energy-communities-in-latin-america (accessed on 16 October 2024).
- Ayodele, T.R. Sustainable Electricity Generation in Rural Communities Using Hybrid Energy System: The Case Study of Ojataye Village. J. Renew. Energy Smart Grid Technol. 2016, 11, 43–56. [Google Scholar]
- Kapsalis, V.; Maduta, C.; Skandalos, N.; Bhuvad, S.S.; D’Agostino, D.; Yang, R.J.; Parker, D.; Karamanis, D. Bottom-up Energy Transition through Rooftop PV Upscaling: Remaining Issues and Emerging Upgrades towards NZEBs at Different Climatic Conditions. Renew. Sustain. Energy Transit. 2024, 5, 100083. [Google Scholar] [CrossRef]
- Mustafa, J.; Almehmadi, F.A.; Alqaed, S.; Sharifpur, M. Building a Sustainable Energy Community: Design and Integrate Variable Renewable Energy Systems for Rural Communities. Sustainability 2022, 14, 13792. [Google Scholar] [CrossRef]
- Salah, S.I.; Eltaweel, M.; Abeykoon, C. Towards a Sustainable Energy Future for Egypt: A Systematic Review of Renewable Energy Sources, Technologies, Challenges, and Recommendations. Clean. Eng. Technol. 2022, 8, 100497. [Google Scholar] [CrossRef]
- Nemr, M.E.; Gebaly, A.E.; Ghazala, A. Optimal Sizing of Standalone PV-Wind Hybrid Energy System in Rural Area North Egypt. J. Eng. Res. 2021, 5, 46–56. [Google Scholar] [CrossRef]
- Ibrahim, K.H.; Hassan, A.Y.; AbdElrazek, A.S.; Saleh, S.M. Economic Analysis of Stand-Alone PV-Battery System Based on New Power Assessment Configuration in Siwa Oasis–Egypt. Alex. Eng. J. 2023, 62, 181–191. [Google Scholar] [CrossRef]
- Ahmad, G.E. Photovoltaic-Powered Rural Zone Family House in Egypt. Renew. Energy 2002, 26, 379–390. [Google Scholar] [CrossRef]
- Abouaiana, A.; Battisti, A. Agile-Transdisciplinary Conceptual Framework for Retrofitting Mediterranean Built Environments. In Mediterranean Architecture and the Green-Digital Transition, Selected Papers from the World Renewable Energy Congress Med Green Forum 2022, Florence, Italy, 20–22 July 2022, 1st ed.; Springer: Cham, Switzerland, 2023. [Google Scholar]
- Abouaiana, A. Rural Energy Communities as Pillar towards Low Carbon Future in Egypt: Beyond COP27. Land 2022, 11, 2237. [Google Scholar] [CrossRef]
- Kassem, R.; Mahmoud, M.M.; Ibrahim, N.F.; Alkuhayli, A.; Khaled, U.; Beroual, A.; Saleeb, H. A Techno-Economic-Environmental Feasibility Study of Residential Solar Photovoltaic/Biomass Power Generation for Rural Electrification: A Real Case Study. Sustainability 2024, 16, 2036. [Google Scholar] [CrossRef]
- Torabi Moghadam, S.; Toniolo, J.; Mutani, G.; Lombardi, P. A GIS-Statistical Approach for Assessing Built Environment Energy Use at Urban Scale. Sustain. Cities Soc. 2018, 37, 70–84. [Google Scholar] [CrossRef]
- Juan, X.; Weijun, G. Analysis on Energy Consumption of Rural Building Based on Survey in Northern China. Energy Sustain. Dev. 2018, 47, 34–38. [Google Scholar] [CrossRef]
- Sena, B.; Zaki, S.A.; Rijal, H.B.; Alfredo Ardila-Rey, J.; Yusoff, N.M.; Yakub, F.; Ridwan, M.K.; Muhammad-Sukki, F. Determinant Factors of Electricity Consumption for a Malaysian Household Based on a Field Survey. Sustainability 2021, 13, 818. [Google Scholar] [CrossRef]
- Wang, P.; Yang, Y.; Ji, C.; Huang, L. Influence of Built Environment on Building Energy Consumption: A Case Study in Nanjing, China. Environ. Dev. Sustain. 2024, 26, 5199–5222. [Google Scholar] [CrossRef]
- Wang, P.; Yang, Y.; Ji, C.; Huang, L. Positivity and Difference of Influence of Built Environment around Urban Park on Building Energy Consumption. Sustain. Cities Soc. 2023, 89, 104321. [Google Scholar] [CrossRef]
- Osorio, B.; McCullen, N.; Walker, I.; Coley, D. Understanding the Relationship between Energy Consumption and Urban Form. Athens J. Sci. 2017, 4, 115–141. [Google Scholar] [CrossRef]
- Woo, Y.-E.; Cho, G.-H. Impact of the Surrounding Built Environment on Energy Consumption in Mixed-Use Building. Sustainability 2018, 10, 832. [Google Scholar] [CrossRef]
- Antonopoulos, C.; Trusty, A.; Shandas, V. The Role of Building Characteristics, Demographics, and Urban Heat Islands in Shaping Residential Energy Use. City Environ. Interact. 2019, 3, 100021. [Google Scholar] [CrossRef]
- Wang, M.; Yu, H.; Yang, Y.; Jing, R.; Tang, Y.; Li, C. Assessing the Impacts of Urban Morphology Factors on the Energy Performance for Building Stocks Based on a Novel Automatic Generation Framework. Sustain. Cities Soc. 2022, 87, 104267. [Google Scholar] [CrossRef]
- Zhu, S.; Ma, C.; Wu, Z.; Huang, Y.; Liu, X. Exploring the Impact of Urban Morphology on Building Energy Consumption and Outdoor Comfort: A Comparative Study in Hot-Humid Climates. Buildings 2024, 14, 1381. [Google Scholar] [CrossRef]
- Xie, M.; Wang, M.; Zhong, H.; Li, X.; Li, B.; Mendis, T.; Xu, S. The Impact of Urban Morphology on the Building Energy Consumption and Solar Energy Generation Potential of University Dormitory Blocks. Sustain. Cities Soc. 2023, 96, 104644. [Google Scholar] [CrossRef]
- Tam, V.W.Y.; Almeida, L.; Le, K. Energy-Related Occupant Behaviour and Its Implications in Energy Use: A Chronological Review. Sustainability 2018, 10, 2635. [Google Scholar] [CrossRef]
- Heinonen, J.; Junnila, S. Residential Energy Consumption Patterns and the Overall Housing Energy Requirements of Urban and Rural Households in Finland. Energy Build. 2014, 76, 295–303. [Google Scholar] [CrossRef]
- Geng, Y.; Ji, W.; Lin, B.; Hong, J.; Zhu, Y. Building Energy Performance Diagnosis Using Energy Bills and Weather Data. Energy Build. 2018, 172, 181–191. [Google Scholar] [CrossRef]
- Nishida, K.; Takeda, A.; Iwata, S.; Kiho, M.; Nakayama, I. Household Energy Consumption Prediction by Feature Selection of Lifestyle Data. In Proceedings of the 2017 IEEE International Conference on Smart Grid Communications (SmartGridComm), Dresden, Germany, 23–27 October 2017; IEEE: Piscataway, NJ, USA, 2017; pp. 235–240. [Google Scholar]
- Alsaadani, S. A Statistical Review of a Decade of Residential Energy Research in Egypt. Energy Rep. 2022, 8, 95–102. [Google Scholar] [CrossRef]
- Nafeaa, S.; Mohamed, A.; Fatouha, M. Assessment of Energy Saving in Residential Buildings Using Energy Efficiency Measures under Cairo Climatic Conditions. Eng. Res. J. 2020, 166, 320–349. [Google Scholar] [CrossRef]
- Attia, S.; Evrard, A.; Gratia, E. Development of Benchmark Models for the Egyptian Residential Buildings Sector. Appl. Energy 2012, 94, 270–284. [Google Scholar] [CrossRef]
- Hegazy, I.R.; Moustafa, W.S.; Akl, M.H. Effect of Building Forms on Energy Consumption in Coastal Rural Communities in Egypt. J. Urban Regen. Renew. 2019, 12, 269–285. [Google Scholar] [CrossRef]
- Salama, R.A.; Hassan, M.M. Implementation of the Rural Family’s Household Electrical Energy Conservation Practices Ismailia Governorate. Alex. Sci. Exch. J. 2021, 42, 1909–1927. [Google Scholar] [CrossRef]
- Abdelhay, A.A. The Economic and Social Impacts of Electricity Use in Fayoum. J. Fac. Arts—Beni Suef Univ. 2020, 4, 423–447. (In Arabic) [Google Scholar] [CrossRef]
- Elsabbagh, T.A.A.; Elsayed, N.R.I.; Elshenawy, M.A.M.E. Spatial Analysis of Electricity Consumption Patterns in Industrial Activity in Sharkia Governorate—An Applied Study in Energy Geography Using Geographic Information Systems. J. Humanit. Lit. Stud. Fac. Arts Kafrelsheikh Univ. Arab Repub. Egypt 2023, 28, 1–69. (In Arabic) [Google Scholar] [CrossRef]
- Swedberg, R. Exploratory Research. The Production of Knowledge: Enhancing Progress in Social Science; Cambridge University Press: Cambridge, UK, 2020; Volume 2, pp. 17–41. [Google Scholar]
- European Commission. EU-Egypt Joint Statement on Climate, Energy and Green Transition—STATEMENT/22/3703; European Commission: Brussels, Belgium, 2022. [Google Scholar]
- Simões, H.M.; Stanicek, B. Egypt’s Climate Change Policies State of Play Ahead of COP27; European Parliament: Brussels, Belgium, 2022. [Google Scholar]
- Masria, A.; Negm, A.; Iskander, M.; Saavedra, O. Coastal Zone Issues: A Case Study (Egypt). Procedia Eng. 2014, 70, 1102–1111. [Google Scholar] [CrossRef]
- GoE. Egypt’s Second Updated Nationally Determined Contributions; International Energy Agency: Paris, France, 2023. [Google Scholar]
- MPED. Egypt’s 2021 Voluntary National Review; The Ministry of Planning and Economic Development, Egypt: Cairo, Egypt, 2021.
- UNDESA. Decent Life (Hayah Karima): Sustainable Rural Communities (Government) #SDGAction43597. Available online: https://sdgs.un.org/partnerships/decent-life-hayah-karima-sustainable-rural-communities#:~:text=%E2%80%9CDecent%20Life%E2%80%9D%20is%20an%20initiative,multidimensional%20poverty%20and%20unemployment%20rates (accessed on 27 September 2024).
- MOEE. Second: National Energy Efficiency Action Plan (NEEAP)—2018/2019–2021/2022; ESMAP-RISE: Cairo, Egypt, 2016. (In Arabic) [Google Scholar]
- IEA. Countries & Regions/Africa/Egypt—Energy System of Egypt. Available online: https://www.iea.org/countries/egypt (accessed on 21 January 2025).
- CAPMAS. Annual Bulletin of Electricity and Energy Statistics 2019/2020; Ref. No. 71-22231-2020; Central Agency for Public Mobilization and Statistics: Cairo, Egypt, 2022. (In Arabic)
- CAPMAS. Egypt Population, Housing, and Establishments Census 2017; Central Agency for Public Mobilization and Statistics: Cairo, Egypt, 2017. (In Arabic)
- CAPMAS. Total Number of Housing Units Implemented by the Sector (Government—Public/Public Works) (In Arabic). Available online: https://www.capmas.gov.eg/Pages/IndicatorsPage.aspx?Ind_id=5803 (accessed on 27 September 2024).
- CAPMAS. Total Number of Housing Units Implemented for the Social Housing Project (One Million Units) (In Arabic). Available online: https://www.capmas.gov.eg/Pages/IndicatorsPage.aspx?Ind_id=5807 (accessed on 27 September 2024).
- GOPP. The Strategic Plan for Urban Development for the Delta Region; Ministry of Housing, Utilities and Urban Communities represented by the General Organization for Physical Planning: Cairo, Egypt, 2017. (In Arabic)
- GOPP. Development Strategy for the Governorates of Egypt, South Upper Egypt Region: Sohag Governorate—Qena Governorate—Aswan Governorates—Red Sea Governorate; General Authority for Urban Planning, Ministry Of Housing, Utilities & Urban Development, Egypt: Cairo, Egypt, 2008. (In Arabic)
- CAPMAS. Annual Bulletin of Electricity and Energy Statistics 2017/2018. Issue: February-2021—Ref. No. 71-22231-2018; Central Agency for Public Mobilization and Statistics: Cairo, Egypt, 2021.
- Mahgoub, Y. The Transformation of Traditional Rural Settlements in Egypt. In Traditional Environments in a New Millennium: Defining Principles and Professional Practices, Proceedings of the Second International Symposium in the Built Environment, Amasya, Turkey, 20–23 June 2001; IZTECH Library: İzmir, Turkey, 2001. [Google Scholar]
- Abouaiana, A. Retrofitting Rural Dwellings in Delta Region to Enhance Climate Change Mitigation in Egypt. Environ. Clim. Technol. 2021, 25, 136–150. [Google Scholar] [CrossRef]
- Open Street Map. Changeset: 116508706 Building Update, Case Study Ahmed Abouaiana. 2022. Available online: https://www.openstreetmap.org/changeset/116508706#map=18/31.182792/30.719345 (accessed on 21 January 2025).
- Abouaiana, A. Lasaifar Albalad Settlement Map, Kafr El-Sheikh, Delta Region, Egypt; Research Gate: Berlin, Germany, 2022. [Google Scholar]
- Abouaiana, A. Agile Methodology as a Transdisciplinary Retrofitting Approach for Built Environment in Traditional Settlements in Mediterranean Region. Ph.D. Thesis, Sapienza University of Rome, Rome, Italy, 2022. [Google Scholar]
- Youth of Lasifer Youth Center [In Arabic]. Available online: https://www.facebook.com/groups/226713854189879/posts/1640009669526950/ (accessed on 19 January 2025).
- Abouaiana, A. Proposal to Improve Energy Efficiency in Lasiafar Village [In Arabic]. Available online: https://docs.google.com/forms/d/e/1FAIpQLSfppAiRC_n-j5l2WWsozb8TS_CE3ZWIQRFsyqtTJpUEZdwMZw/viewform?fbclid=IwY2xjawH1gDpleHRuA2FlbQIxMAABHQbc1q3HQa36gSBSQdknNCVgCYejBhvY48FCWX82V-lXh1-jpJOGH7LGPw_aem_ORjBzP96GGXh0gUU3HNvxA (accessed on 19 January 2025).
- DePoy, E.; Gitlin, L.N. Introduction to Research E-Book: Understanding and Applying Multiple Strategies. In Introduction to Research E-Book: Understanding and Applying Multiple Strategies; Elsevier Health Sciences: Amsterdam, The Netherlands, 2019; ISBN 0323612482. [Google Scholar]
- Boslaugh, S. Statistics in a Nutshell: A Desktop Quick Reference, 2nd ed.; O’Reilly Media, Inc.: Sebastopol, CA, USA, 2012; ISBN 1449361153. [Google Scholar]
- Khamis, H. Measures of Association: How to Choose? J. Diagn. Med. Sonogr. 2008, 24, 155–162. [Google Scholar] [CrossRef]
- Hauke, J.; Kossowski, T. Comparison of Values of Pearson’s and Spearman’s Correlation Coefficient on the Same Sets of Data. Quaest. Geogr. 2011, 30, 87–93. [Google Scholar] [CrossRef]
- Social Science Statistics. Pearson Correlation Coefficient Calculator. Available online: https://www.socscistatistics.com/tests/pearson/ (accessed on 19 January 2025).
- St, L.; Wold, S. Analysis of Variance (ANOVA). Chemom. Intell. Lab. Syst. 1989, 6, 259–272. [Google Scholar]
- David, V. 3—Structure as Groups of Objects/Variables; Valérie David; Elsevier: Amsterdam, The Netherlands, 2017; pp. 35–55. ISBN 978-1-78548-239-7. [Google Scholar]
- Ross, A.; Willson, V.L. One-Way Anova. In Basic and Advanced Statistical Tests: Writing Results Sections and Creating Tables and Figures; Ross, A., Willson, V.L., Eds.; SensePublishers: Rotterdam, The Netherlands, 2017; pp. 21–24. ISBN 978-94-6351-086-8. [Google Scholar]
- IBM. IBM SPSS Software. Available online: https://www.ibm.com/spss (accessed on 19 January 2025).
- Strunk, K.K.; Mwavita, M. Design and Analysis in Educational Research: ANOVA Designs in SPSS®; Routledge: London, UK, 2020; ISBN 0429432798. [Google Scholar]
- Sen, S.; Yildirim, I. A Tutorial on How to Conduct Meta-Analysis with IBM SPSS Statistics. Psych 2022, 4, 640–667. [Google Scholar] [CrossRef]
- Feng, W.; Chen, J.; Yang, Y.; Gao, W.; Zhao, Q.; Xing, H.; Yu, S. The Impact of Building Morphology on Energy Use Intensity of High-Rise Residential Clusters: A Case Study of Hangzhou, China. Buildings 2024, 14, 2245. [Google Scholar] [CrossRef]
- PV-HUB. Egypt PV HUB Platform. Available online: https://pv-hub.org/ (accessed on 19 January 2025).
- El Shenawy, E.T.; Hegazy, A.H.; Abdellatef, M. Design and Optimization of Stand-Alone PV System for Egyptian Rural Communities. Int. J. Appl. Eng. Res. 2017, 12, 10433–10446. [Google Scholar]
- Fetyan, K.M.; Hady, R. Performance Evaluation of On-Grid PV Systems in Egypt. Water Sci. 2021, 35, 63–70. [Google Scholar] [CrossRef]
- PV-HUB. Eligible Companies. Available online: https://pv-hub.org/?page_id=6927 (accessed on 19 January 2025).
- Gabr, A.Z.; Helal, A.A.; Abbasy, N.H. Economic Evaluation of Rooftop Grid-connected Photovoltaic Systems for Residential Building in Egypt. Int. Trans. Electr. Energy Syst. 2020, 30, e12379. [Google Scholar] [CrossRef]
- PV-HUB. Calculate the Estimated Cost of a Solar Cell System. Available online: https://pv-hub.org/?page_id=7318 (accessed on 19 January 2025).
- Schweser, K. SchweserNotesTM 2019 Level I CFA® Book 1: Ethical and Professional Standards and Quantitative Methods; Kaplan, Inc.: Fort Lauderdale, FL, USA, 2018; ISBN 978-1-4754-7871-6. [Google Scholar]
- CFA. Institute Capital Budgeting: Level I |2021 Curriculum | CFA Program Level I | Corporate Finance. Available online: https://www.cfainstitute.org/en/membership/professional-development/refresher-readings/capital-budgeting-l1 (accessed on 18 June 2021).
- EgyptERA. Electricity Tariff for the Fiscal Year 2024/2025* Starting from August Consumption. Available online: https://egyptera.org/ar/TarrifAug2024.aspx (accessed on 21 January 2025).
- Central Bank of Egypt. Exchange Rates’ Average Market Rate in EGP. 30 November 2024. Available online: https://www.cbe.org.eg/en/economic-research/statistics/exchange-rates (accessed on 30 November 2024).
- Abouaiana, A.; Mendonça, P. Retrofitting Dwellings in Traditional Coastal Settlements in Egypt and Portugal Using Nature-Based Solutions and Conventional Thermal Insulation Materials: Technical and Economic Assessment. J. Archit. Eng. 2022, 28, 05022005. [Google Scholar] [CrossRef]
- Dabaieh, M.; Makhlouf, N.N.; Hosny, O.M. Roof Top PV Retrofitting: A Rehabilitation Assessment towards Nearly Zero Energy Buildings in Remote off-Grid Vernacular Settlements in Egypt. Sol. Energy 2016, 123, 160–173. [Google Scholar] [CrossRef]
- El Hassani, S.; Charai, M.; Moussaoui, M.A.; Mezrhab, A. Towards Rural Net-Zero Energy Buildings through Integration of Photovoltaic Systems within Bio-Based Earth Houses: Case Study in Eastern Morocco. Sol. Energy 2023, 259, 15–29. [Google Scholar] [CrossRef]
- Ghafoor, A.; Munir, A. Design and Economics Analysis of an Off-Grid PV System for Household Electrification. Renew. Sustain. Energy Rev. 2015, 42, 496–502. [Google Scholar] [CrossRef]
- Almutairi, K.; Hosseini Dehshiri, S.S.; Hosseini Dehshiri, S.J.; Mostafaeipour, A.; Issakhov, A.; Techato, K. Use of a Hybrid Wind–Solar–Diesel–Battery Energy System to Power Buildings in Remote Areas: A Case Study. Sustainability 2021, 13, 8764. [Google Scholar] [CrossRef]
- Mahmoud, M.M.; Ibrik, I.H. Techno-Economic Feasibility of Energy Supply of Remote Villages in Palestine by PV-Systems, Diesel Generators and Electric Grid. Renew. Sustain. Energy Rev. 2006, 10, 128–138. [Google Scholar] [CrossRef]
- Sukarno, I.; Matsumoto, H.; Susanti, L. Household Lifestyle Effect on Residential Electrical Energy Consumption in Indonesia: On-Site Measurement Methods. Urban Clim. 2017, 20, 20–32. [Google Scholar] [CrossRef]
- He, B.; Yang, L.; Ye, M.; Mou, B.; Zhou, Y. Overview of Rural Building Energy Efficiency in China. Energy Policy 2014, 69, 385–396. [Google Scholar] [CrossRef]
- Steg, L.; Perlaviciute, G.; Van der Werff, E. Understanding the Human Dimensions of a Sustainable Energy Transition. Front. Psychol. 2015, 6, 805. [Google Scholar] [CrossRef] [PubMed]
- Tsuchiya, Y.; Swai, T.A.; Goto, F. Energy Payback Time Analysis and Return on Investment of Off-Grid Photovoltaic Systems in Rural Areas of Tanzania. Sustain. Energy Technol. Assess. 2020, 42, 100887. [Google Scholar] [CrossRef]
- Arif, S.; Taweekun, J.; Ali, H.M.; Ahmed, A.; Bhutto, A.A. Building Resilient Communities: Techno-Economic Assessment of Standalone off-Grid PV Powered Net Zero Energy (NZE) Villages. Heliyon 2023, 9, e21426. [Google Scholar] [CrossRef]
- Nafeh, A. Design and Economic Analysis of a Stand-Alone PV System to Electrify a Remote Area Household in Egypt. Open Renew. Energy J. 2009, 2, 33–37. [Google Scholar] [CrossRef]
- Çamur, H.; Kassem, Y.; Alessi, E. A Techno-Economic Comparative Study of a Grid-Connected Residential Rooftop PV Panel: The Case Study of Nahr El-Bared, Lebanon. Eng. Technol. Appl. Sci. Res. 2021, 11, 6956–6964. [Google Scholar] [CrossRef]
- Rej-Witt, M.; Dębska, L. The Use of a Photovoltaic System in a Single Family House in Poland–Case Study. In Proceedings of the E3S Web of Conferences, Meknes, Morocco, 9–10 December 2021; EDP Sciences: Les Ulis, France, 2022; Volume 336, p. 00010. [Google Scholar]
- Abdulhady, H.; Metwally, H. Review of the Factors Affecting the Solar Energy Yield in Egypt. Egypt. Int. J. Eng. Sci. Technol. 2020, 29, 51–60. [Google Scholar] [CrossRef]
- IDSC. Public Policy Forum; IDSC: Cairo, Egypt, 2024. [Google Scholar]
- Rodrigues, F.; Cardeira, C.; Calado, J.M.F. The Daily and Hourly Energy Consumption and Load Forecasting Using Artificial Neural Network Method: A Case Study Using a Set of 93 Households in Portugal. Energy Procedia 2014, 62, 220–229. [Google Scholar] [CrossRef]
- IEA. Energy Efficiency 2020; International Energy Agency: Paris, France, 2020. [Google Scholar]
- Lode, M.L.; Felice, A.; Alonso, A.M.; De Silva, J.; Angulo, M.E.; Lowitzsch, J.; Coosemans, T.; Camargo, L.R. Energy Communities in Rural Areas: The Participatory Case Study of Vega de Valcarce, Spain. Renew. Energy 2023, 216, 119030. [Google Scholar] [CrossRef]
- Gouveia, J.P.; Aelenei, L.; Aelenei, D.; Ourives, R.; Bessa, S. Improving the Energy Performance of Public Buildings in the Mediterranean Climate via a Decision Support Tool. Energies 2024, 17, 1105. [Google Scholar] [CrossRef]
- Riva, F.; Tognollo, A.; Gardumi, F.; Colombo, E. Long-Term Energy Planning and Demand Forecast in Remote Areas of Developing Countries: Classification of Case Studies and Insights from a Modelling Perspective. Energy Strategy Rev. 2018, 20, 71–89. [Google Scholar] [CrossRef]
- Naumann, M.; Rudolph, D. Conceptualizing Rural Energy Transitions: Energizing Rural Studies, Ruralizing Energy Research. J. Rural. Stud. 2020, 73, 97–104. [Google Scholar] [CrossRef]
- HBRC. Egyptian Code for Improving the Efficiency of Energy Use in Buildings, Part 1: Residential Buildings; ECP306-2005; Ministry of Housing: Cairo, Egypt, 2008. (In Arabic)
- Javanroodi, K.; Nik, V.M. Impacts of Microclimate Conditions on the Energy Performance of Buildings in Urban Areas. Buildings 2019, 9, 189. [Google Scholar] [CrossRef]
- Xu, Z.; Wang, X.; Tang, S.; Chen, Y.; Yang, Y. Construction and Case Analysis of a Comprehensive Evaluation System for Rural Building Energy Consumption from an Energy–Building–Behavior Composite Perspective. Sustainability 2024, 16, 6959. [Google Scholar] [CrossRef]
- Mishra, P.; Pandey, C.M.; Singh, U.; Gupta, A.; Sahu, C.; Keshri, A. Descriptive Statistics and Normality Tests for Statistical Data. Ann. Card. Anaesth. 2019, 22, 67–72. [Google Scholar]
- Brown, A.M. A New Software for Carrying out One-Way ANOVA Post Hoc Tests. Comput. Methods Programs Biomed. 2005, 79, 89–95. [Google Scholar] [CrossRef] [PubMed]

| Building Typology | Building Characteristics | Electricity Consumption | Description | ||||
|---|---|---|---|---|---|---|---|
| Footprint | Floor | Built-Up Area | Monthly | Annual | EUI | ||
| m2 | Number | m2 | kWh/ Month | kWh/Year | kWh/m2/ Year | ||
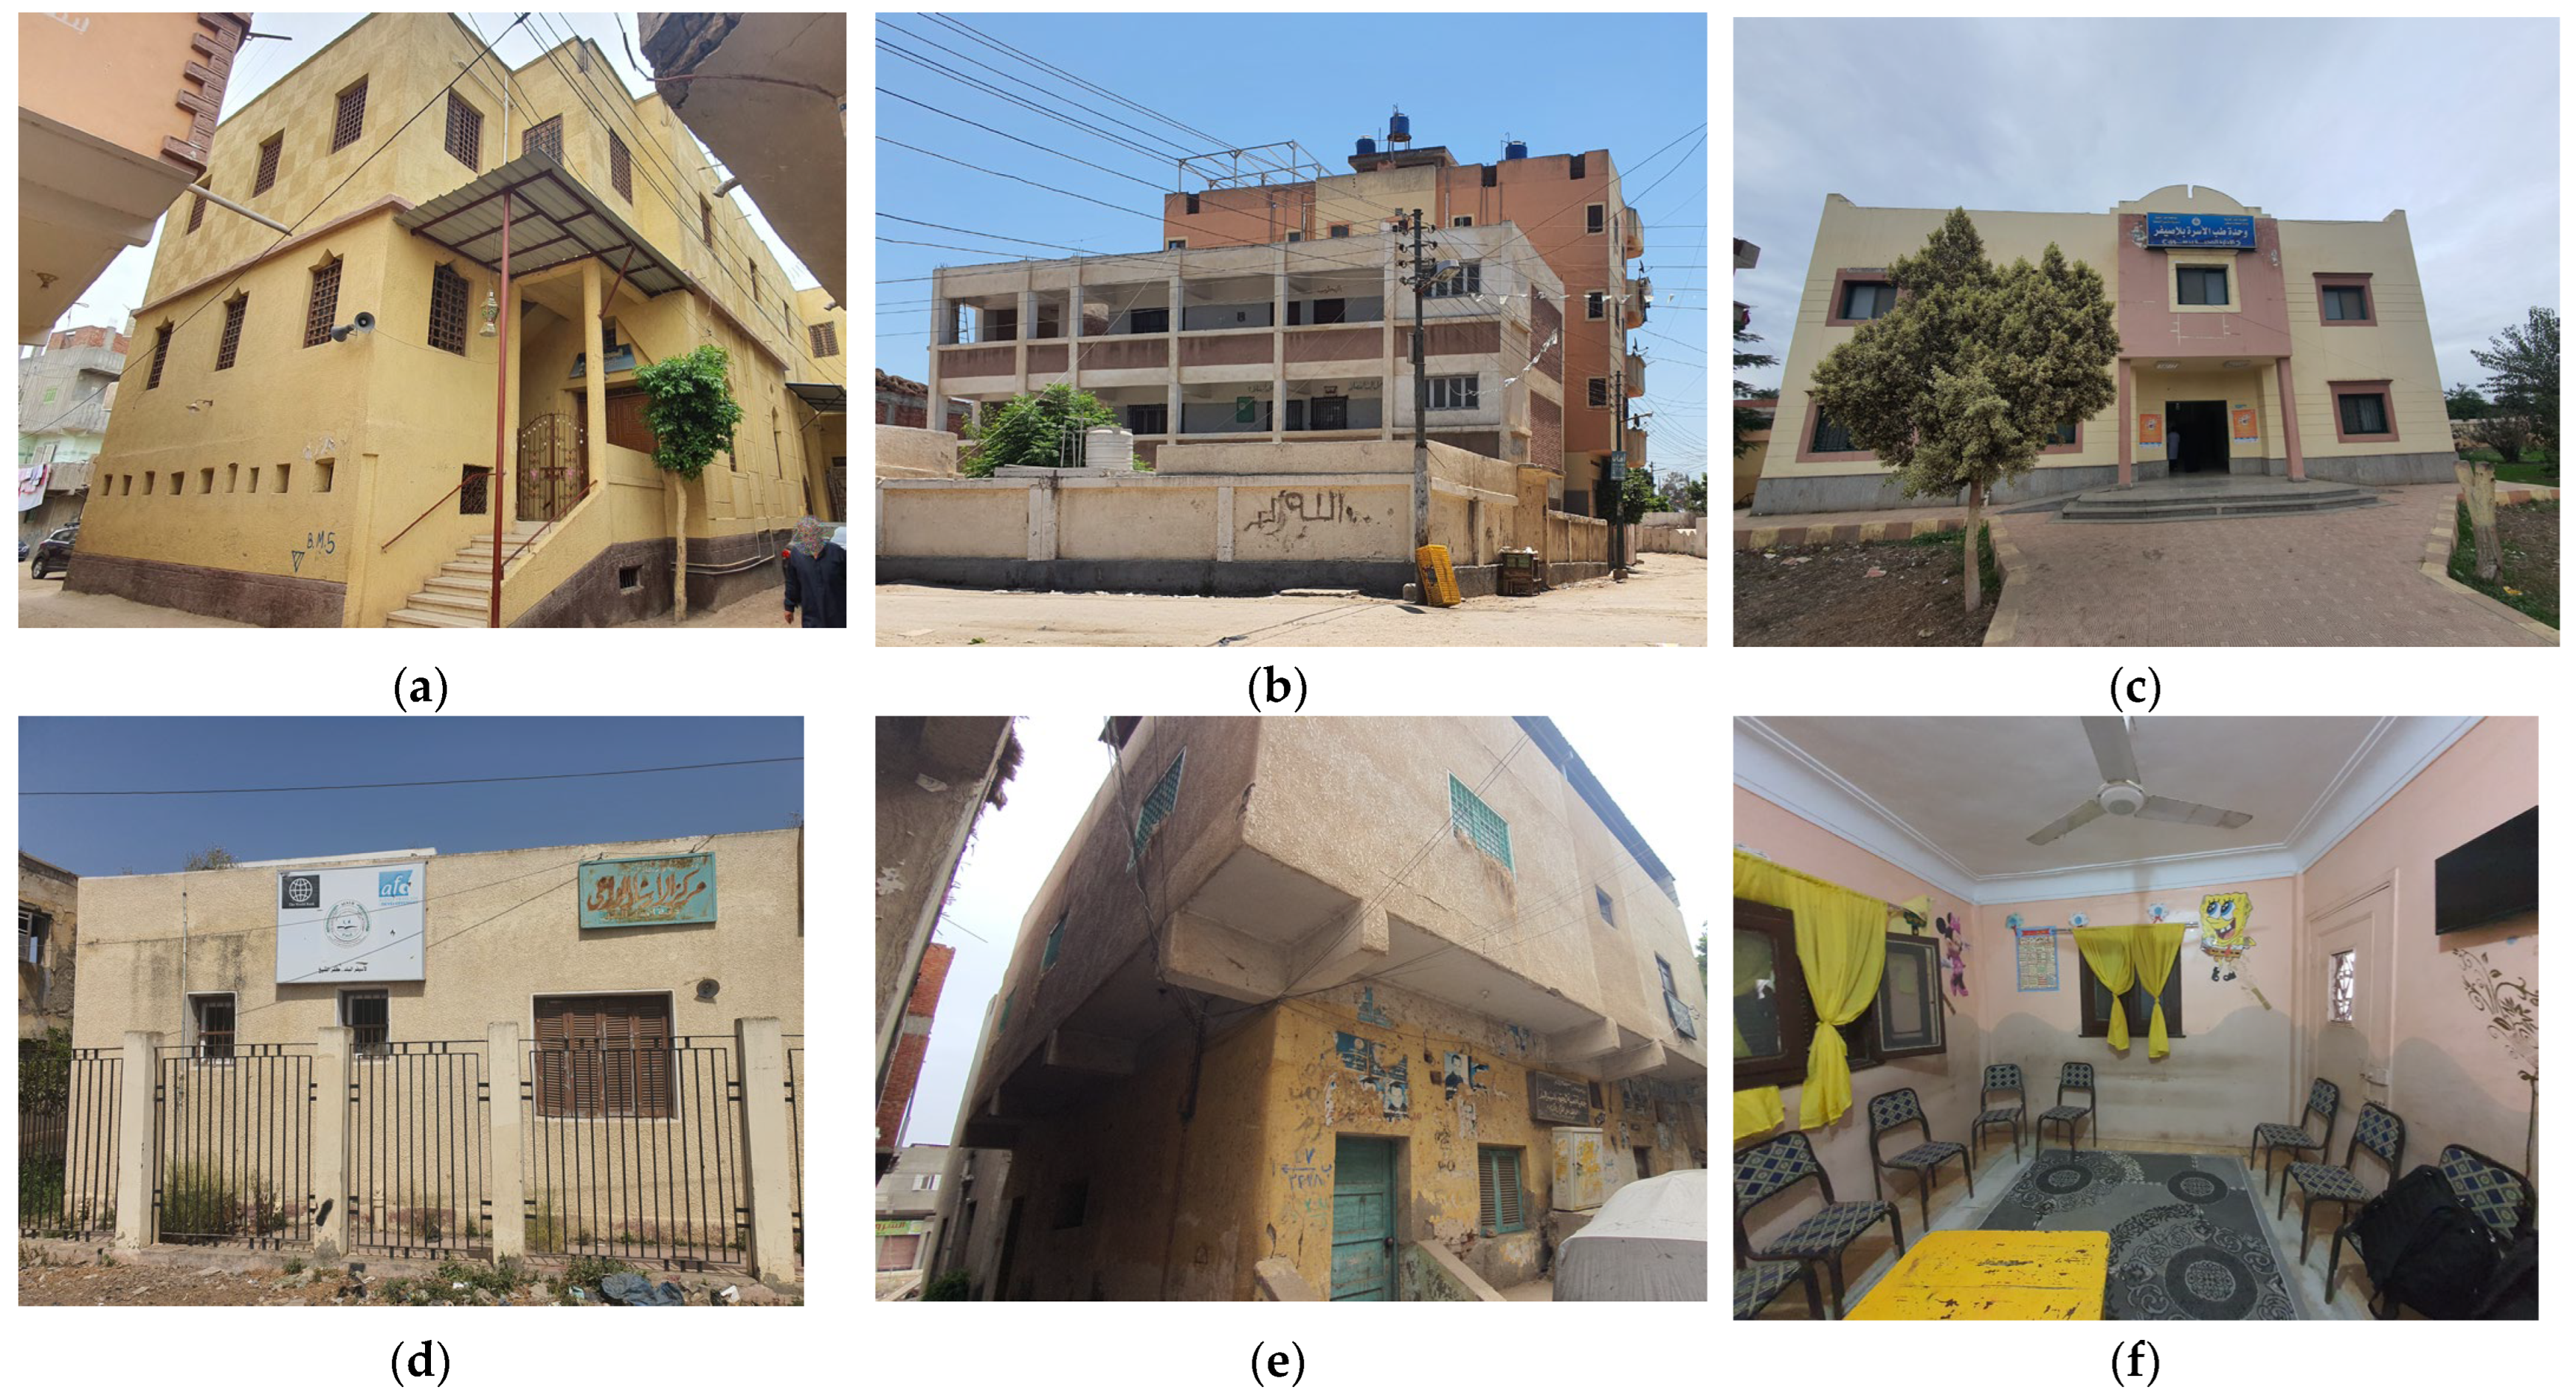
| The grand mosque | 300 | 1 | 300 | 220 | 2400 | 8 | The grand mosque is located in the village’s core; its maximum capacity is nearly 250 worshippers, as shown in Figure 4a. |
| Preparatory school | 220 | 3 | 660 | 500 | 6000 | 9 | There are eight classrooms, each equipped with a computer and a smart display board, along with two computer labs, a science lab, a library, and executive rooms, as seen in Figure 4b. |
| Primary school | 210 | 3 | 630 | 250 | 3000 | 4.8 | It is positioned near the center of the village and comprises ten classes. |
| Health-unit building | 65 | 2 | 130 | 1000 | 12,000 | 92.3 | The center provides all basic healthcare services, like vaccinations, as depicted in Figure 4c. Consumption is higher than the norm because of the equipment used, like the medical fridges. |
| The agriculture association | 75 | 1 | 75 | 110 | 1320 | 17.6 | This government building assists farmers by offering finance and marketing processes while lowering production costs, see Figure 4d. |
| Social | 120 | 2 | 250 | 120 | 1440 | 6 | The social development facility houses an official unit for social affairs and a kindergarten. It operates officially for 35 h each week and is essential to serving the local community, see Figure 4e. |
| Social (NGO) [27] | 150 | 1 | 150 | 100 | 1200 | 8 | The building belongs to Albakyat Alsalihat, a non-governmental organization (NGO), see Figure 4f. It accommodates a residential building providing social activities for children, orphans, and widows. |
| Independent shops | 16–25 | 1 | 16–25 | 80–120 | 1200 | 2.5 | It encompasses various types of businesses, including restaurants, vehicle services, mechanics’ workshops, and bakeries. These establishments are primarily located along the main road to serve commercial needs, operating for about 70 h weekly. |
| Aspect | r Value | p -Value | Statistical Significance |
|---|---|---|---|
| Footprint | +0.342 | 0.055 | No |
| Built-Up Area | +0.836 | 0.000 | Yes |
| Total Members | +0.604 | 0.000 | Yes |
| Household Number | +0.6843 | 0.000016 | Yes |
| Floor Number | +0.887 | 0.000 | Yes |
Disclaimer/Publisher’s Note: The statements, opinions and data contained in all publications are solely those of the individual author(s) and contributor(s) and not of MDPI and/or the editor(s). MDPI and/or the editor(s) disclaim responsibility for any injury to people or property resulting from any ideas, methods, instructions or products referred to in the content. |
© 2025 by the authors. Licensee MDPI, Basel, Switzerland. This article is an open access article distributed under the terms and conditions of the Creative Commons Attribution (CC BY) license (https://creativecommons.org/licenses/by/4.0/).
Share and Cite
Abouaiana, A.; Battisti, A. Towards Clean Energy Transition: An Exploratory Case Study from Rural Egypt. Sustainability 2025, 17, 1597. https://doi.org/10.3390/su17041597
Abouaiana A, Battisti A. Towards Clean Energy Transition: An Exploratory Case Study from Rural Egypt. Sustainability. 2025; 17(4):1597. https://doi.org/10.3390/su17041597
Chicago/Turabian StyleAbouaiana, Ahmed, and Alessandra Battisti. 2025. "Towards Clean Energy Transition: An Exploratory Case Study from Rural Egypt" Sustainability 17, no. 4: 1597. https://doi.org/10.3390/su17041597
APA StyleAbouaiana, A., & Battisti, A. (2025). Towards Clean Energy Transition: An Exploratory Case Study from Rural Egypt. Sustainability, 17(4), 1597. https://doi.org/10.3390/su17041597