Article

Impact of Urban Densification on Outdoor Microclimate and Design of Sustainable Public Open Space in Residential Neighborhoods: A Study of Niš, Serbia

by
Milena Dinić Branković
*,
Milica Igić
,
Jelena Đekić
and
Milica Ljubenović
Faculty of Civil Engineering and Architecture, University of Niš, 14 Aleksandra Medvedeva Street, 18000 Niš, Serbia
*
Author to whom correspondence should be addressed.
Sustainability 2025, 17(4), 1573; https://doi.org/10.3390/su17041573
Submission received: 24 December 2024 / Revised: 27 January 2025 / Accepted: 28 January 2025 / Published: 14 February 2025
(This article belongs to the Section Sustainable Urban and Rural Development)

Abstract

:
This research examined changes in the microclimatic parameters affecting thermal comfort in three residential settings with various urban forms in the city of Niš, Serbia, that underwent intense post-socialist urban densification. Outdoor microclimate was modeled for summertime conditions in two scenarios, before and after transformation, by using ENVI-met software. The obtained results offer quantitative data on microclimatic conditions in the chosen settings and comparisons between scenarios. Findings revealed significant variations in the transformed scenarios, with distinct patterns in specific open spaces: a single mid-rise development forming a square in a high-rise setting showed a wind speed decrease, a daytime mean radiant temperature increase despite lower temperature, and an increase in humidity; extensive low- and mid-rise development in a green high-rise setting generated the highest temperature increase at night, notably reduced daytime and slightly elevated the nighttime mean radiant temperatures, and presented inverted temperature and humidity patterns in urban canyons during the day and night; dispersed densification in low-rise setting manifested the highest wind speed increase, significantly increased the daytime temperature, and mostly raised the nighttime mean radiant temperature. Urban design strategies for sustainable public open space that enhance the resilience of densified areas include using shading from transformed western/southern-edge buildings, avoiding small partly-framed spaces and fragmented grassy surfaces, implementing urban gaps to support nighttime cooling, and framing public open space with trees.

1. Introduction

Increasing urbanization as a global phenomenon and the associated densification of urban areas, which was the focus of this study, have significant implications upon the environment, human health, and well-being. The increase in built structures and paved surfaces, along with infrastructure overload and the decrease in greenery and public open spaces (hereinafter POSs) in the urban matrix, jointly contribute to environmental pollution, natural hazards, and ecosystem degradation. Additionally, urban densification has societal implications resulting from an eroded natural environment such as limited recreation options, disrupted social relations, and reduced quality of life.
Adverse effects of urban densification are particularly visible in the urban environments of former socialist cities in South and East Europe and Central and Eastern Europe, where the shift in planning paradigms toward market-oriented approaches in post-socialism led to intensive transformation of the urban fabric. The transformations implied, among others, the massive urban densification and privatization of public space [1]. Residential land use experienced significant changes following the end of centralized planning practices, with the effects of densification evident in POSs and green areas. Similar to their post-socialist counterparts, Serbian cities underwent an extensive densification of residential fabric in a specific development context framed by deep economic and political crisis in the 1990s. Aside from large housing estates as the dominant housing form from the socialist period, the zones of single-family housing were also pressured by intense densification, with market-led spatial transformations detected in the layout and height of structures. Post-socialist residential development unfolded as [2]: (1) new construction at the expense of POSs and green areas in existing large housing estates, (2) consolidation of individual plots and the conversion of individual to multi-family housing, and (3) the extension of residential buildings by constructing additional floors on top of them.
With the transition to post-socialism, the implication of urban densification on the environment, microclimate, and thermal comfort of users was not under the spotlight of the scientific and professional community in former socialist cities. The focus of densification processes was on the short-term benefits alone, prioritizing other issues. In the last few decades, however, the importance of outdoor thermal comfort has been acknowledged by researchers at the global scale. Some of the most influential parameters affecting the microclimate of open spaces in cities involve urban morphology and density [3,4,5,6,7]. Therefore, numerous studies have analyzed the impacts of urban form and design elements (built form, height/width (H/W) ratio of open space, street geometry, trees and vegetation, water surfaces, canopies, material properties, orientation) on the microclimate parameters and thermal comfort by using field measurements and/or numerical simulations, and proposed some guidelines for enhancing urban design approaches. Particular urban configurations that were explored involve squares [8], parks [9], urban canyons [3,6,10,11,12,13], courtyards [14,15] and urban blocks [16], resulting in urban planning and design recommendations in academic research. Fewer studies dealt with complex segments of urban fabric, encompassing several urban forms: streets and courtyards [17], courtyards and squares [18], different urban forms and landscapes [19,20], and urban quarters or districts [21,22].
A significant number of studies including some of the previously listed have utilized ENVI-met to tackle the impact of urban morphology on the local microclimate in various urban settings. ENVI-met is a three-dimensional software model that provides essential insights for sustainable and resilient urban design [23] and can integrate and account for spatial variations in the four meteorological variables affecting thermal comfort (wind speed, air temperature, relative humidity, and mean radiant temperature) [24]. It is therefore a frequently used tool for predicting the microclimate and assessing the thermal comfort in outdoor spaces within thermal comfort studies involving different urban configurations/geometries in various climates across the globe [3,8,10,11,15,20,21,22,25,26], some of which also reviewed the role of urban greenery [5,7,19,27,28]. All of these academic works demonstrate that ENVI-met is highly suitable for examining how urban design parameters influence the urban microclimate and thermal comfort, and provide good grounds for using ENVI-met in this study. The main findings of the listed studies that are relevant for this research are discussed in the theoretical part of the paper.
The majority of these studies focused on a single urban feature of urban form, involving a canyon, a courtyard or a block, without accounting for the effects of the surroundings within a complexly structured urban setting. Furthermore, several studies explored the changes in physical structure and urban greenery independently, but rarely considered their combined effects. On the other hand, the implications of new developments/transformations of existing structures on the microclimate in POSs in real, existing residential environments involving multiple variables have remained understudied, particularly in post-socialist urban landscapes, considering their unique urban forms and specific models of urban densification. This study aims to address this gap in the literature through a case study of the city of Niš, Serbia, which examined the effects of actual post-socialist transformations by using ENVI-met model simulations for the summer period. The paper explores the transformation of existing structures and the construction of new buildings in existing compact residential areas, since these are some of the key features of post-socialist development, and investigates how the variations in building volume, surface cover, and urban greenery interact to influence the local microclimate. By building on previous studies, this research contributes to the body of knowledge on how urban densification affects outdoor thermal comfort in specific post-socialist development patterns.
This issue gains importance with the fact that Serbia has experienced a temperature increase over the past century, and that the climate will continue to become warmer in the coming decades [29]. From this perspective, the research hypothesis is that, if properly guided, the process of urban densification can help in adjusting the existing urban environments to a temperature increase, thus achieving a more agreeable thermal sensation in POSs in residential zones. This claim is further backed by the research of Wolfgang et al. [22], corroborating the positive effects of densification achieved through the implementation of appropriate measures of urban design, with Cortesão et al. [30] claiming that the retrofitting of public spaces in dense urban areas may result in microclimatic improvements, Emmanuel and Fernando [31] stating that the highest level of thermal comfort, quantified by both air temperature and mean radiant temperature, was observed in high-density development areas, and Lindberg et al. [32], whose study acknowledged that increased urban density, coupled with adding vegetation, represented an efficient strategy to reduce summer outdoor heat stress. Additionally, it can be stated that although the microclimate has a significant impact on outdoor thermal comfort, the research findings on this topic have not been mainstreamed into urban planning and design guidelines, and have yet to be integrated into urban planning regulations. This paper therefore aims to: (1) determine how and to what extent the post-socialist densification of urban structure has influenced the microclimatic parameters of thermal comfort in outdoor spaces within various residential settings, and (2) identify key features of urban design and mitigation strategies that contribute to a favorable microclimate in POSs at the local scale to help guide densification processes in inherited urban settings.

2. Theoretical Background: Microclimatic Parameters in Open Space Environments

Thermal comfort in outdoor urban environments is influenced by climatic conditions and subjective human aspects [33]. However, the extent and intensity of human activities in POSs are directly dependent on the level of comfort/discomfort with the current climatic conditions [30,34]. A favorable outdoor microclimate can even boost the social life in a residential environment and create thriving communities, thus making it a key quality of POSs that needs to be accounted for in urban design [29]. Given their crucial role in achieving POS environmental quality, this study concentrated on microclimatic parameters affecting thermal comfort in open spaces in the summer period, when these spaces are most extensively used.
Microclimatic parameters influence thermal sensation in various ways. Direct exposure to solar radiation in the summer may result in thermal discomfort, while it may be pleasant in winter [34]. Wind enhances convective cooling of the human body, thus reducing the heat load, and can modify the surrounding thermal conditions through the advection of air at the local scale [32]. The air temperature directly impacts the level of thermal comfort. The mean radiant temperature encompasses all shortwave and longwave radiation fluxes, direct and reflected, and reflects the temperature of the surrounding objects and surfaces that influence the human body’s thermal experience [35,36]. Increased relative humidity amplifies the thermal discomfort caused by high temperatures [37].
Urban geometry represents a key factor in determining solar access [38], and affects surface temperatures and air temperatures [12]. Therefore, it is an important factor in accounting for urban heat islands [39], which lead to higher nighttime temperatures in dense urban environments [32]. Moreover, the urban geometry directly affects the wind speed [20], and together with surface materials strongly influence the mean radiant temperature, making it a useful indicator for identifying urban hot spots [32]. Higher structures generate more extensive shaded areas, which result in a lower air temperature and mean radiant temperature [22]. Different urban forms create distinct microclimates, resulting in diverse levels of thermal comfort [20]. Therefore, two typical urban surface units found within residential areas were singled out to establish a baseline in this research: urban canyons and POSs of different scales and different levels of enclosure (including squares).
An urban canyon is a three-dimensional space between two adjacent buildings that consists of walls (building) and the ground (usually street) [38]. Street canyons are shaped as symmetrical or asymmetrical, depending on the height and position of the framing buildings. Asymmetrical street canyons are better suited to real urban morphology [27], but are also more complex for the evaluation of microclimatic parameters in real cases [11,13]. Most of the canyon radiative surplus at daytime is transferred as heat to the air, and about 30% is stored in canyon materials, while at night, only the release of energy stored in the canyon materials occurs, and weak winds do not enable much heat transfer [38]. The streets oriented along with the prevailing wind have the highest wind velocity, whereas those perpendicular to it experience significantly reduced wind speed [12], even in wide street canyons [13]. Better airflow is enabled in wider urban canyons and in canyon configurations with various building heights [4]. The increase in H/W ratio decreases solar access in the street [4] and thus contributes to an air temperature decrease [13], while shade enhancement contributes to lower daytime mean radiant temperatures [10]. In deep urban canyons (H/W ratio over 2), an improved daytime microclimate can be attributed to shading generated by framing buildings, while the conditions are inverted at night due to increased nighttime heat island intensity; in shallow canyons (H/W ratio less than 1), the daytime microclimatic conditions are relatively unfavorable because of direct solar radiation, while the nighttime conditions improve, as stored heat can dissipate more effectively [27]. Research also suggests the mitigation of the heat island effect by using tall buildings that capture the wind and enhance the wind velocity [11].
When it comes to POSs as the other urban surface type, urban configurations may involve open space partly-framed by singular shapes (freestanding buildings) and gaps, linear space framed by row buildings, semi-enclosed space partly framed by row buildings, and a fully enclosed space-courtyard (based on Taleghani et al. [20] and adopted). An increasing number of studies highlight the vital role of outdoor microclimates in the urban design of squares [40]. Research suggests that singular shapes provide a long duration of solar radiation for the outdoor environment, thus causing the poorest thermal comfort situation compared with other analyzed models—linear and courtyard [20]. Compared with a square as a singular shape of substantial size framed by buildings and gaps, a courtyard receives more shading from nearby buildings, resulting in lower values of mean radiant temperature and more favorable microclimate, while in the square, the wind velocities are higher and the air temperatures are lower than in the courtyard [18]. The increase in the H/W aspect ratio in squares leads to higher air velocity (due to channeling effects) and higher air temperature (due to reduced sky view), while a decrease in the aspect ratio may still lead to higher air temperatures (due to reduced airflow) [18]. Researchers have found that pedestrian comfort in dense urban areas can be enhanced through adding tree and vegetation canopies for shade and wind protection, along with creating ground-level gaps between buildings to facilitate airflow [6].
Surface materials have a significant impact on the microclimate. Most paving materials have low albedo and high heat storage capacity, and most building materials have high emissivity coefficients [29]. Therefore, the absorbed sunlight contributes to a higher surface and air temperature at daytime, and higher emissions during the night. Soil and grass contribute to a more comfortable urban environment compared with pavement [18]. In scenarios with more vegetation, the potential air temperatures and mean radiant temperatures are lower [5]. Green spaces significantly reduce the temperatures in densely built areas, while areas with abundant greenery present minimal temperature changes after greening interventions [19].
The addition of trees has the largest effect on the microclimate and thermal comfort [18,41]. Trees decrease solar radiation absorption through shading and evapotranspiration [7], thereby reducing the surrounding ground surface temperature. Through shading, trees reduce the daytime mean radiant temperature, especially in streets [42] and open areas where the vegetation is sparse [32]. The cooling effect of street tree canopies becomes more effective as the street canyon becomes wider and shallower [43]. A relative humidity increase is recorded under tree canopies [44], while the presence of trees in urban canyons reduces the wind speed in the canopy surroundings [45]. Research shows that an increase in tree canopy cover from 10% to 25% in the city of Phoenix resulted in a 2.0 °C temperature reduction at the local scale in residential neighborhoods [28].

3. Methods and Materials

3.1. Methodology

This study focused on the transformation of urban structure in various residential urban settings that have undergone densification processes as well as their implications on POSs. To accomplish the set goals, this research employed a literature review, data collected from field observations, and software simulations of weather conditions. A graphical representation of the research flow and steps is provided in Scheme 1.
The patterns and intensity of urban densification differ significantly throughout the residential fabric of Niš, in terms of physical, functional, social, and environmental structure. This research selected three representative study areas in residential settings based on the following criteria:
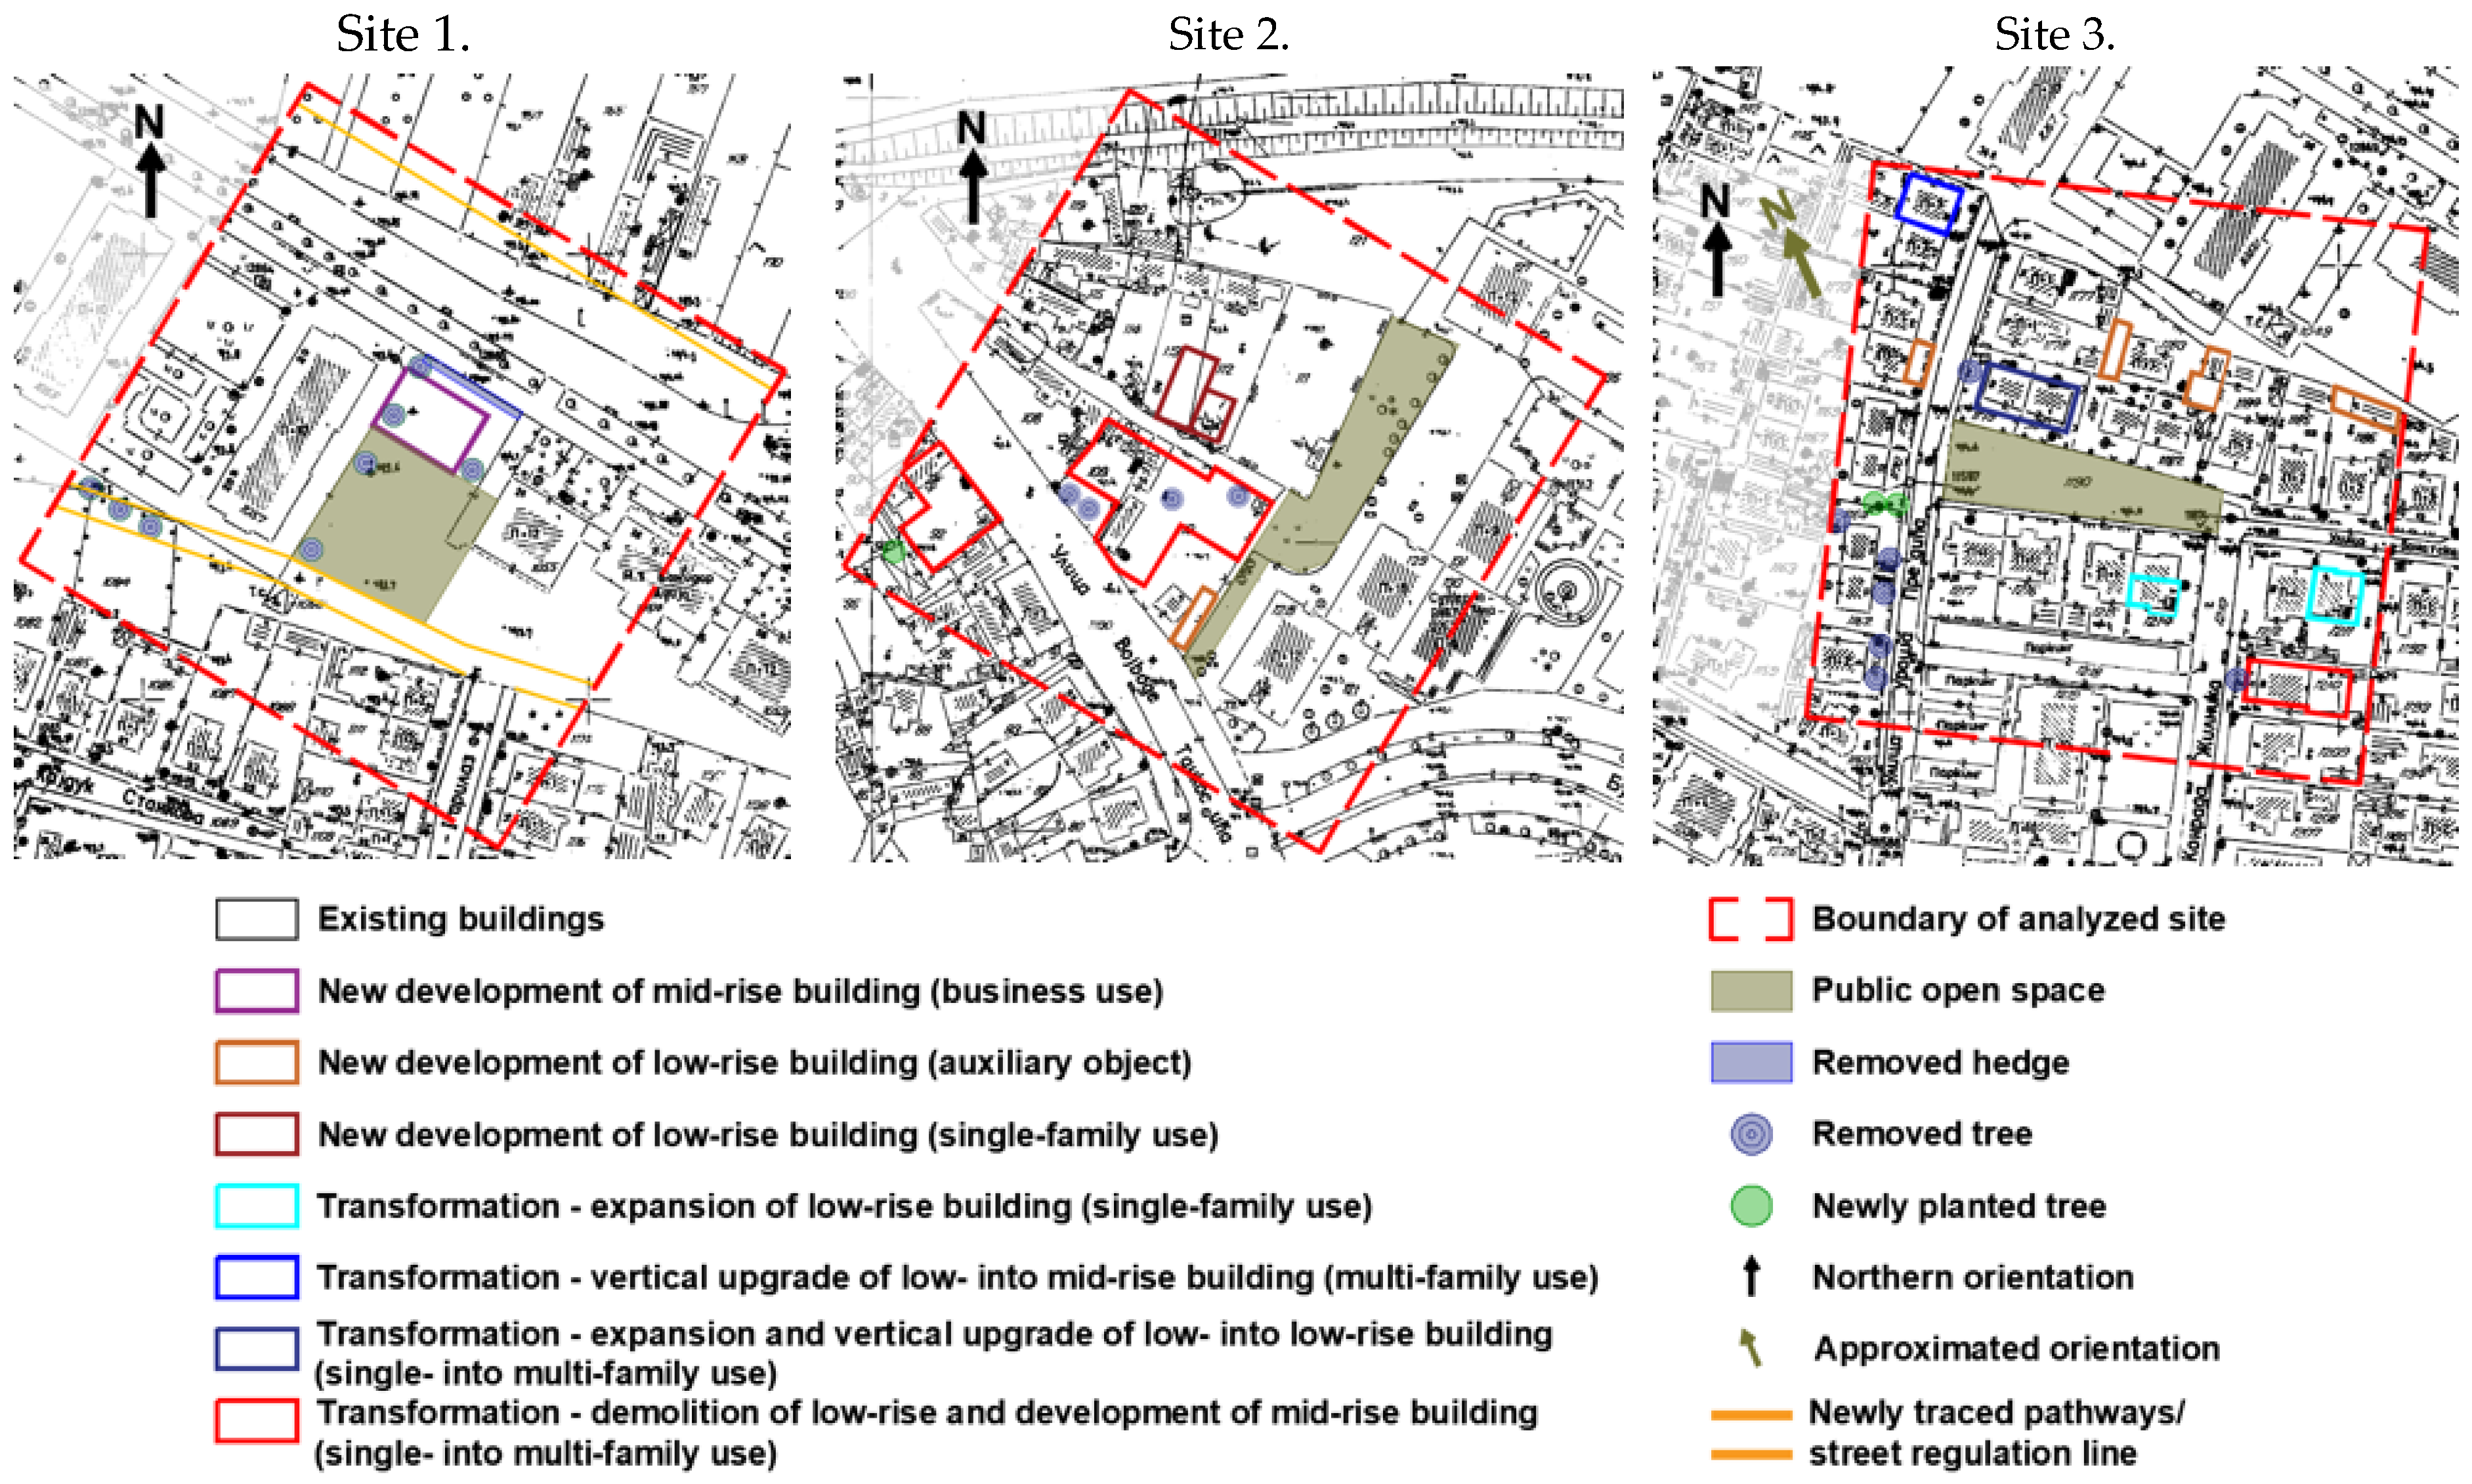
  • Various types of residential fabric involving urban settings with multi-family buildings, single-family houses, and a mixture of both types, with structures of various heights (low-rise, mid-rise and high-rise);
  • Sites that underwent transformation in the post-socialist period involving the transformation of existing structures and/or new construction;
  • Presence of two typical open space environments within the residential fabric: a substantial POS between buildings (used or potential) and an urban canyon;
  • Similar orientation of urban configurations (structures and open space) with respect to the north in the three cases;
  • Equal site area dimensions and identical size of the POS in the three urban settings.
In June 2023, thorough field observations were conducted in the three urban settings (including structures, open spaces and greenery) within the selected study areas to identify specific spatial changes brought about by urban densification.
The software employed for modeling and simulating weather conditions was ENVI-met v. 5.6.1. As established in previous research [26], even though some divergences have been found in certain cases between the measurements and simulations, the microclimate variables have been, in general, established with good accuracy. Moreover, unlike on-site measurements, numerical modeling allows for the assessment of different urban design scenarios and offers insights into the changes in the outdoor thermal comfort conditions across space and time [36]. These features favor the use of ENVI-met, making it the best tool to use in this research. The observed microclimatic parameters of outdoor thermal comfort involve solar radiation, wind speed, air temperature, mean radiant temperature, and relative humidity. Three different urban configurations were built by using the software—study areas 1, 2, and 3. The dimensions of the models for all three sites were 50 × 50 × 40 m. The grid cell was configured with a size of 2.5 m (for dx, dy, and dz) to enhance the model precision, aligning with Forouzandeh’s [15] findings that simulations with a 2 m resolution closely approximate real-world conditions.
Each study area was analyzed under two distinct scenarios: (1) the original urban setting prior to any transformations, and (2) the present state of the urban setting following the transformation of structures and new developments. The two scenarios were juxtaposed to determine the aftermath of the transformations of built structure, open space, and greenery on the microclimate in each scenario, in all three study areas. Moreover, the obtained minimum and maximum values of the difference in parameters were compared across the three cases to determine the specificities of particular height groups concerning the impact of transformations on the microclimate. The original and transformed urban settings were compared using the Compare 2D feature in ENVI-met’s Leonardo tool. The original urban setting was labeled as dataset Reference B, while the transformed urban setting was identified as the observation dataset Absolute A. The research applied the same (current) conditions in both scenarios for all model elements for which it was possible: the initial meteorological conditions, the types of materials/elements for structures, open space and greenery, and the maturity of the trees. Regarding the number and position of the trees and the surface area of grass cover, the initial conditions differed in the two scenarios due to the significant transformation of these elements, which was taken into account. The tree and surface material data were collected during field observations, while the initial meteorological conditions were sourced from the Meteorological Yearbook 2021 [46]. By using the present condition of the study areas for the specified conditions and elements, the variables between these two scenarios included the horizontal and/or vertical building extensions, new developments at the expense of open space, changes in trees and hedges and consequent changes in reducing grassy surfaces, and increasing paved areas. This approach leads to more precise results in comparing the microclimatic parameters and assessing the effects of urban densification.
While the simulations may not capture the full complexity of real urban environments, they can provide comparable results that are useful for analyzing the microclimate parameters and assessing their impact on urban design. Similar to other studies performed with the ENVI-met software, this research faced certain limitations associated with the applied numerical model. Due to the inability to model sloping roof planes directly, these were adjusted to fit the square grid in the ENVI-met numerical model to approximate the roof volume, while irregular shapes were simplified and represented using square blocks [47]. The same wall materials were used in the model [27] due to the complexities of the real-world setting, resulting in the same thermal behavior of building walls in the immediate surroundings. The extended surroundings of the three settings were not included in the model (size of the modeled site areas was constrained by the technical limitations of the ENVI-met software version used, ENVI-met Lite), which may have affected the results of the microclimatic parameters in peripheral areas. When examining the results, the primary focus of analysis was the inner open space within the site, but the implications in the peripheral open space are also discussed.
Outdoor comfort study was carried out at the start of the summer season, a time when people actively use POSs. The date chosen for the simulations was 25 June 2021, as it marked the hottest day of the month, and the latest available meteorological data were for the year 2021. The simulation’s initial meteorological conditions included prevailing south-southwestern wind at inflow 171° with average speed of 0.8 m/s, 9.7 h duration of solar radiation with low cloudiness of 2.3 average, values of relative humidity 19–70%, and air temperature ranging from 20.5 to 38.3 °C. Simple forcing used in the simulation implied that only air temperature and relative humidity were forced in the model, while wind condition (speed and direction) and cloudiness remained unchanged [27]. The average daily wind speed was utilized, consistent with the research of Acero and Arrizabalaga [24]. The mean radiant temperature values were derived from the ENVI-met simulation results.
Simulations were conducted over a 24-h timeframe (start 07 AM June 25, end 07 AM 26 June). The results were monitored and analyzed across the entire period for all parameters, except for solar radiation. Given the fact that heat accumulates in surfaces and structures throughout the day and is released to the air during the afternoon and evening [20], and the urban structure was altered in the transformed scenario, the nocturnal air temperatures, mean radiant temperatures and relative humidity were also affected. In this way, the research gains an insight into the shifts in these parameters that occur during the day, under the influence of direct sunlight and shading, and at night, when there is no solar radiation. Input data for the buildings, vegetation, surface properties and soil used in the simulation models are presented in Table 1.

3.2. Study Areas

Niš is a second-tier city in Serbia with a population of 249,501 people [48], and is a typical post-socialist city. Geographically, the city lies in the Niš Valley at a latitude of 43°20′ north and longitude of 21°54′ east, experiencing a moderate continental climate.
The three selected neighborhoods are located in close proximity (Figure 1), in the residential segment along Nemanjića Boulevard, which is a primary road with great traffic frequency. The sites are positioned at approximately the same elevation above sea level: 193.6 m a.s.l. for Site 1, 192.5 m for Site 2, and 194.3 m for Site 3. Two study areas are located within a large housing estate from the socialist past that directly faces Nemanjića Boulevard (Sites 1 and 2), and have the exact same alignment in relation to the north (31 degrees). The third study area is in the single-family zone adjacent to Nemanjića Boulevard (Site 3), where the structures are positioned with a smaller inclination to the north (7 degrees). For the purpose of this research, this angle was approximated to match the first two sites, and the structures and open space in Site 3 were reviewed as if oriented at a 31-degree inclination to the north. This approach was adopted to ensure identical initial conditions across all three cases, which facilitated the comparison of the results. The actual northern orientation is shown in the figure for all three cases, while the approximated orientation that was adapted for the purpose of this study is provided for Site 3 (Figure 2).
Each of the three analyzed urban settings covered a total of 1.56 hectares. The boundary of the modeled area was established to include: (1) one focal POS of approx. 0.1 hectares, (2) adjacent structures that involved different types of housing (single- and multi-family), (3) and other open spaces including streets. The transformation of Site 1 showcases a dotted intervention in the existing urban fabric, which has been quite extensive and implicates major changes to the focal POS. Site 2 illustrates several transformations that have substantially modified its urban fabric, and reflects indirectly on the focal POS. Site 3 is representative of multiple small-scale transformations distributed throughout the study area, with minor changes to the focal POS. Study areas were modeled in ENVI-met in the original (Figure 3A) and transformed scenarios (Figure 3B).
Study area 1. This site predominantly involves multi-family housing and has urban configuration with singular shapes. The original urban setting featured a POS of good size in-between buildings, which was linked structurally and visually to the primary road. This common space was characterized with a variety of greenery. A new 5-storey building with business use (ground floor + 4) was constructed along the Boulevard, and has contributed to partly framing the existing POS with singular shapes, with a square-like POS form shielded from traffic. Transformation of the focal POS involved the conversion of a major part of the green area into parking space with earth cover, and it is expected that parking will be fully paved once the transformation is completed.
Study area 2. This site presents a mixture of individual houses and multi-family buildings, with a complex urban structure involving both singular and linear shapes. A vast linear POS was envisioned west of the high-rises, between the row buildings and existing single-family plots, shaped with lush greenery. The transformations involved the densification of existing single-family plots by constructing two new low-rise housing units, a 7-storey multi-family building (ground floor + 6 + loft) in the SW part, and a mass housing 6-storey structure (ground floor + 5) with accompanying garages in the center of the site. The configuration of the existing street was altered, giving the urban canyon a new H/W ratio. The existing POS layout and size remained unchanged, but a part of the POS was framed vertically, thus forming a new asymmetrical urban canyon of disjointed form. The reduction in greenery was quite extensive, particularly regarding the grass surface cover.
Study area 3. The area is predominantly occupied with single-family housing and has urban configuration with singular shapes. The original urban setting featured a central POS in-between the existing streets and plots of individual housing. The first transformations of urban structure involved upgrading the multi-family building in the NW with one additional floor, into a 5-storey structure (ground floor + 4). Next, a conversion of single- to multi-family housing was carried out at the brim of the POS, with a development of a 3-storey structure (ground floor + 2). This development also initiated the arrangement of the central POS, which implied a reduction in grass surface cover and conversion into paving, but its layout did not change. Multiple auxiliary buildings were erected on individual plots (ground floor or ground floor + loft), some of which were adapted for housing. Two individual homes were expanded horizontally and upgraded with one and two additional floors. Finally, a 4-storey multi-family housing building was constructed (ground floor + 3), in the existing single-family plot in the east. This new structure and the expanded house north of it have formed a new urban canyon. Street configurations were not altered significantly. A significant portion of open space in individual plots along the existing street in the west was converted from grass into pavement.

4. Results and Discussion

Given the fact that direct solar radiation affects air temperatures most significantly [49], its effects in the two scenarios are discussed first. Output data for the simulation of solar radiation were visualized in Leonardo maps with an accompanying legend, which was individually tailored for each site and observation hour for the direct sw radiation and absolute difference in direct sw radiation.
Next, the changes in wind speed (WS) patterns were investigated, as wind also significantly influences the air temperature. Then, the variations in the air temperature (AT) and mean radiant temperature (MRT) were analyzed, independently and in connection with the previously examined microclimatic parameters. Ultimately, the effect of variations in relative humidity (RH) was reviewed. Relative humidity is inversely correlated with AT and is directly dependent on it [44]. Results for AT, MRT, WS, and RH were shown using spatial difference maps, given for key hours of the day. In this study, noon is referred to as 12 PM. When reviewing these four parameters, a unified common legend was created for all analyzed hours and for each parameter because the values in the legend were adapted to best fit the range of obtained values. The minimum and maximum values of absolute differences between the two scenarios were derived from the legend provided with ENVI-met maps, and presented via graphs for the 24-h period.

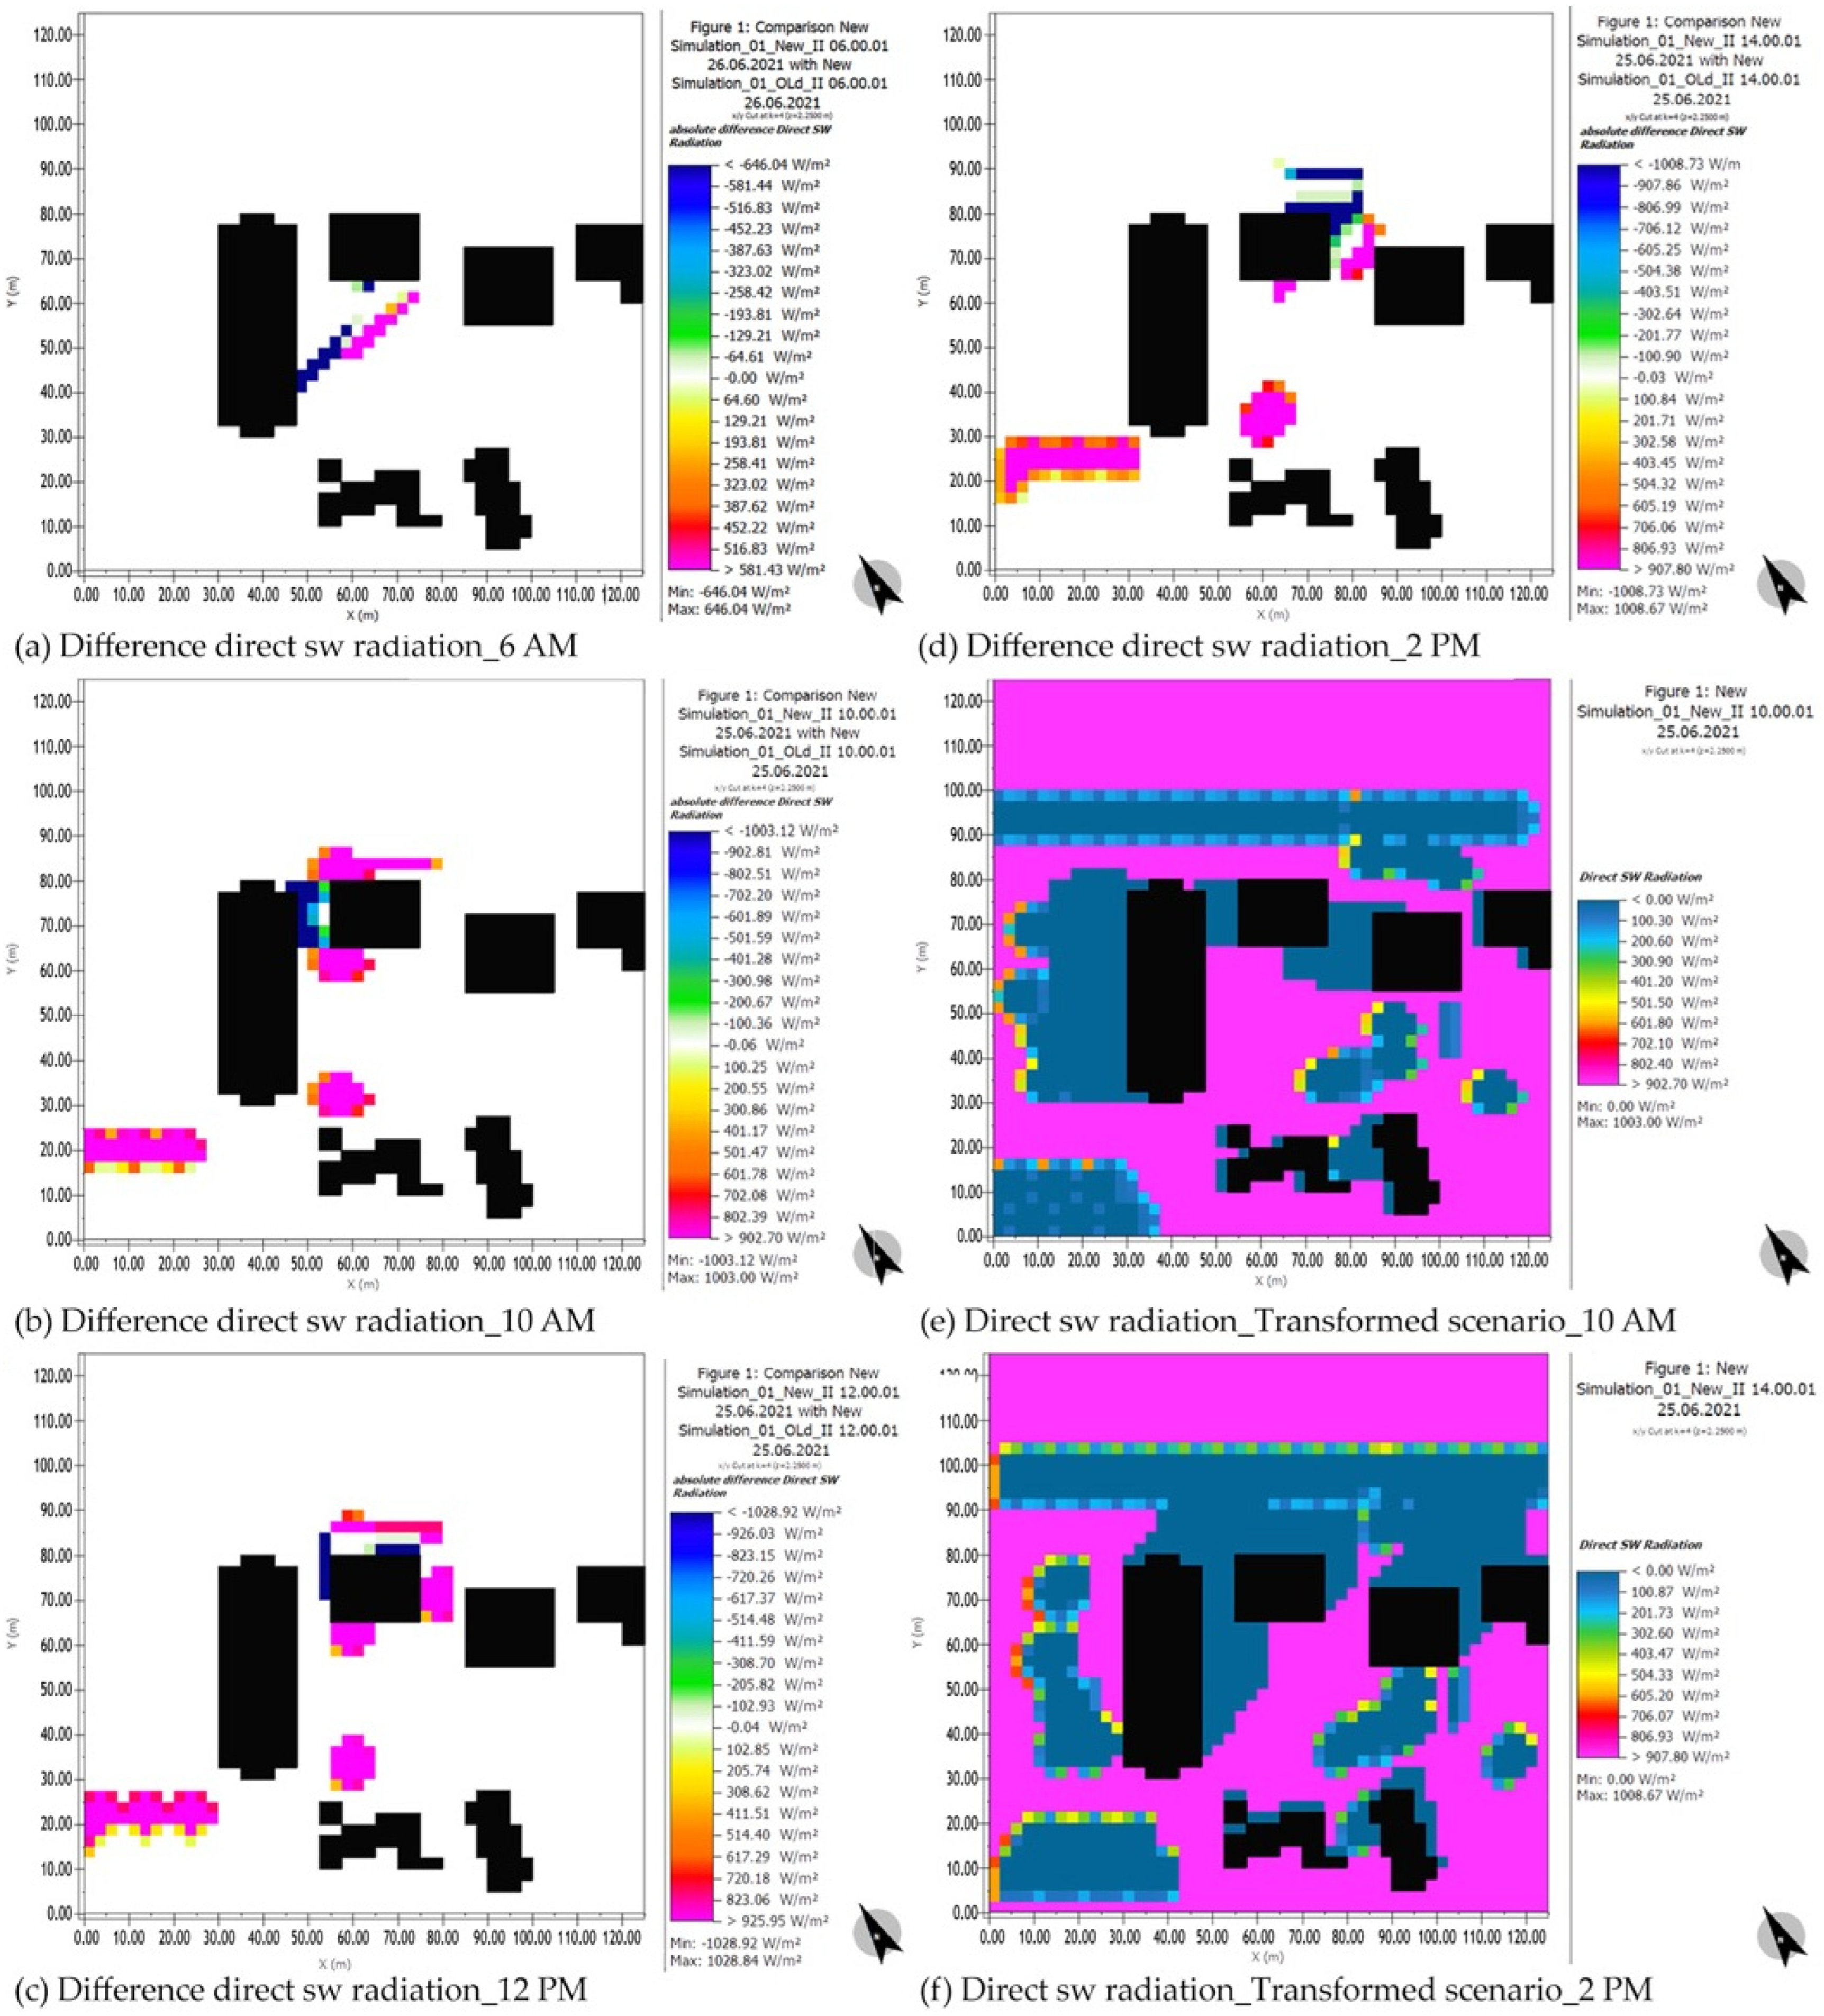
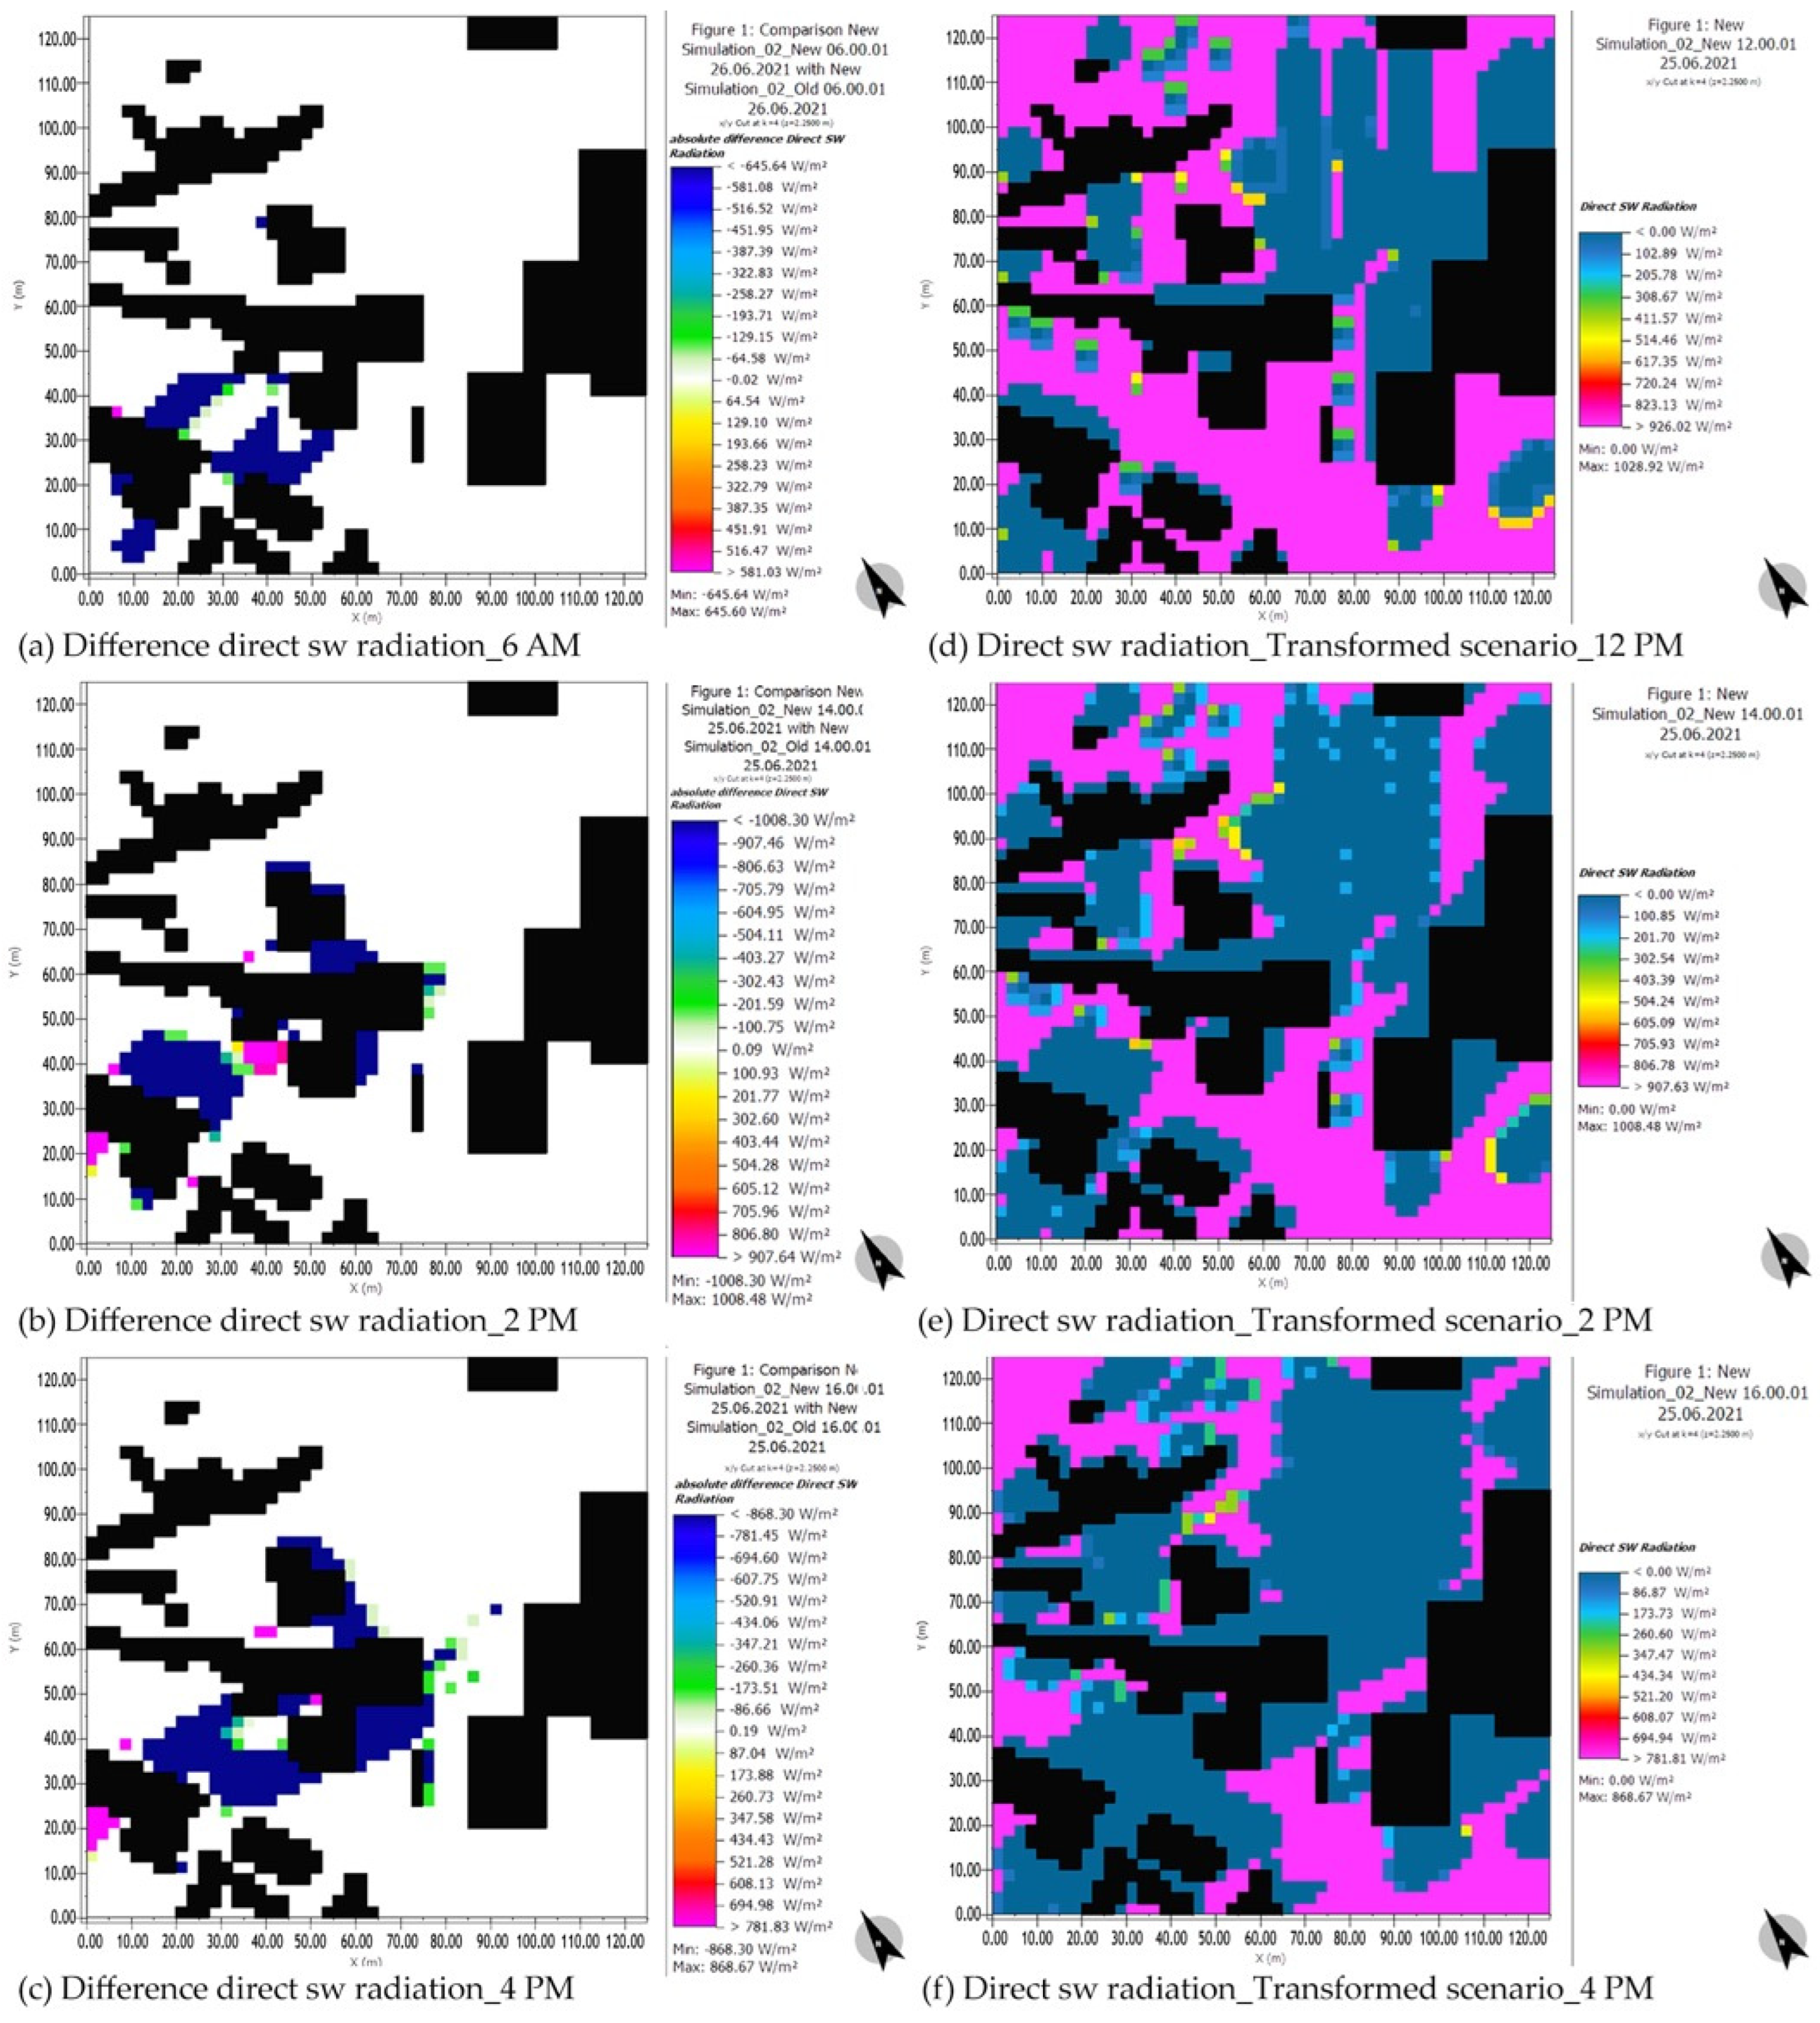
4.1. Solar Radiation

New construction at the expense of open space generated additional shaded areas at the ground level, while cutting down trees to make way for new development reduced the horizontal projection of the shade. Since shading is an efficient strategy to mitigate heat stress in the summer [25], exploring the change in shaded surface is crucial for the interpretation of the study’s results.
Site 1. The majority of changes in shaded areas was generated by trees in all of the analyzed timeframes. A reduced number of trees and removed dense hedge in the transformed scenario resulted in new sunlit areas in open space. The largest rise in sunlit surfaces was recorded at 6 PM. Regarding the newly constructed building, the variation in shaded surfaces between the two scenarios resulting from the structure alone was not extensive; at 6 PM, it was even non-existent. This can be attributed to the height of the newly constructed building, which is medium-rise and lower than the adjacent buildings. Therefore, it does not generate extensive shade (Figure 4a), except from 10 AM to 2 PM (Figure 4b–d). At 2 PM, the greatest difference in shading was recorded. The new structure was developed in the northern part of the site and does not generate additional shading of the inner POS. Although this particular square-like area has the greatest potential for accommodating social life, the inner POS remains sunlit during the peak hours of the day, from 10 AM to 2 PM (Figure 4e,f). New trees that would create shade have not been planted either.
Site 2. When considering the effects of new construction, the two low-rise houses and one auxiliary object did not have a significant impact on the shading of open space. The main contributors to shading were the two mid-rise buildings (5- and 8-storey height). The changes in tall greenery also contributed to the increase in shaded and sunlit areas, but to a small extent. Newly created shade was present most extensively in the vicinity of mid-rise buildings in the afternoon from 2 PM (Figure 5b) and early morning at 6 AM (Figure 5a), covering the street area and part of the open space in the building’s surroundings. The most significant increase in shaded surfaces occurred at 4 PM (Figure 5c). However, the potential of afternoon shade was not used to accommodate the tenants’ activities and outdoor amenities in open space in the immediate surroundings of this building; instead, the space is used for parking. This development did not have a significant impact on the shading of the focal POS (Figure 5d–f), except at 6 PM, in spite of new construction west of it, due to the presence of existing trees and the significant spacing between buildings. The largest increase in sunlit surfaces was recorded at 12 PM.
Site 3. Developing new low-rise auxiliary buildings and upgrading the low-rise structure at the NW with one additional floor did not have significant implications on the shaded surfaces in the parterre. However, for the two single-family houses that were expanded both horizontally and vertically, differences in shading were evident, particularly for the centrally positioned structure whose immediate surroundings had no other transformations (Figure 6a–d). For the two objects that underwent more significant transformations from single- to multi-family use, and the change in layout and height (by two and three additional floors), the changes in shading in the surroundings were prominent. Some shading was generated by two newly planted trees in the west of the site. The greatest difference in the degree of shading was in the afternoon at 4 PM (Figure 6d). Newly sunlit areas were present to a significant extent throughout the day, with most extensive sunlit surfaces recorded at noon. Given the dispersed pattern of low-rise structures, significant open spaces were still sunlit throughout the day (Figure 6f), even in the morning (Figure 6e) and late afternoon when the shading was most extensive. This was also the case with the centrally positioned compact POS that accommodates social interactions, except at 6 AM.
Regarding the effect of urban densification on the insolation and shading of open spaces, the following key findings were established in this study:
  • New mid-rise developments on the site with high-rise structures presented a minor increase in shading compared with the other two sites due to existing shaded areas [22];
  • Sunlit islands were present in the transformed scenario in all focal POSs at the time of the largest difference in shading, in line with [20]; not even significantly transformed elements could provide efficient solar protection of the POS in a dispersed pattern of densification. This is of particular importance for the transformation of structures framing the western and southern edge of the POS that accommodates social life;
  • Removing existing trees to make way for new development may result in sunlit areas than are much more extensive than the shaded areas generated by that construction;
  • Planting new trees is crucial for the POS where social interactions take place, particularly for widely spaced areas because of shading [7].
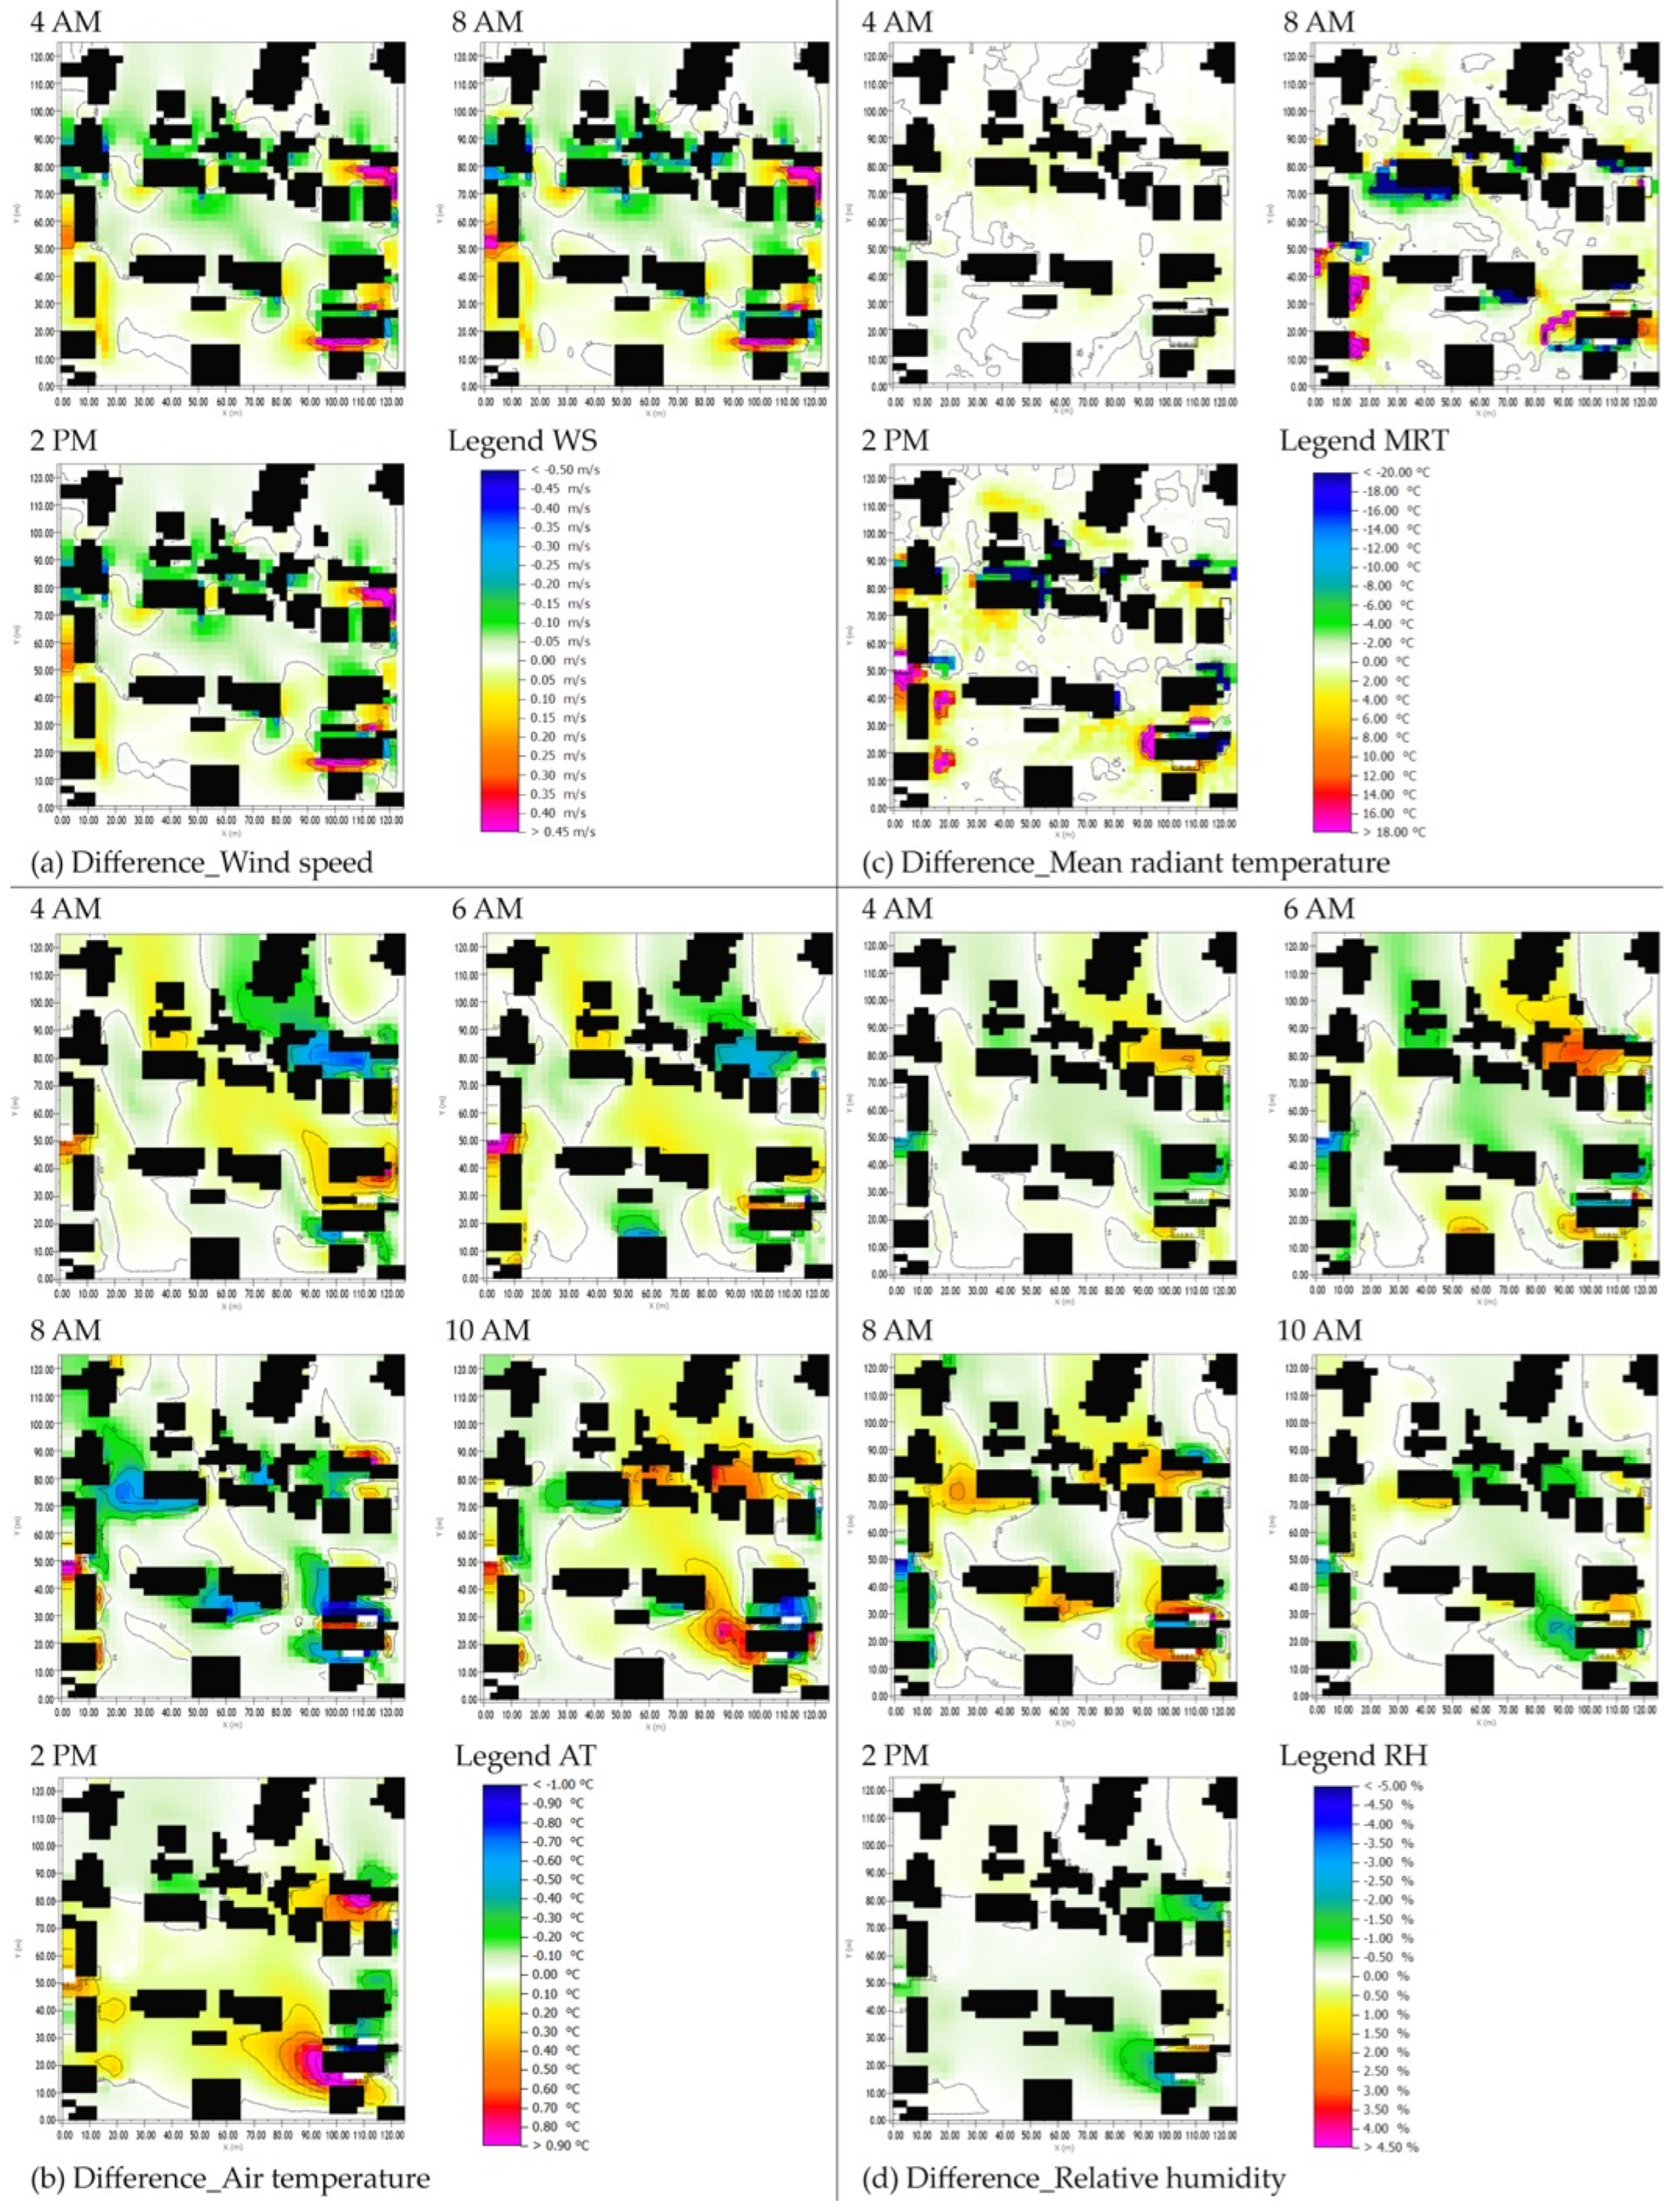
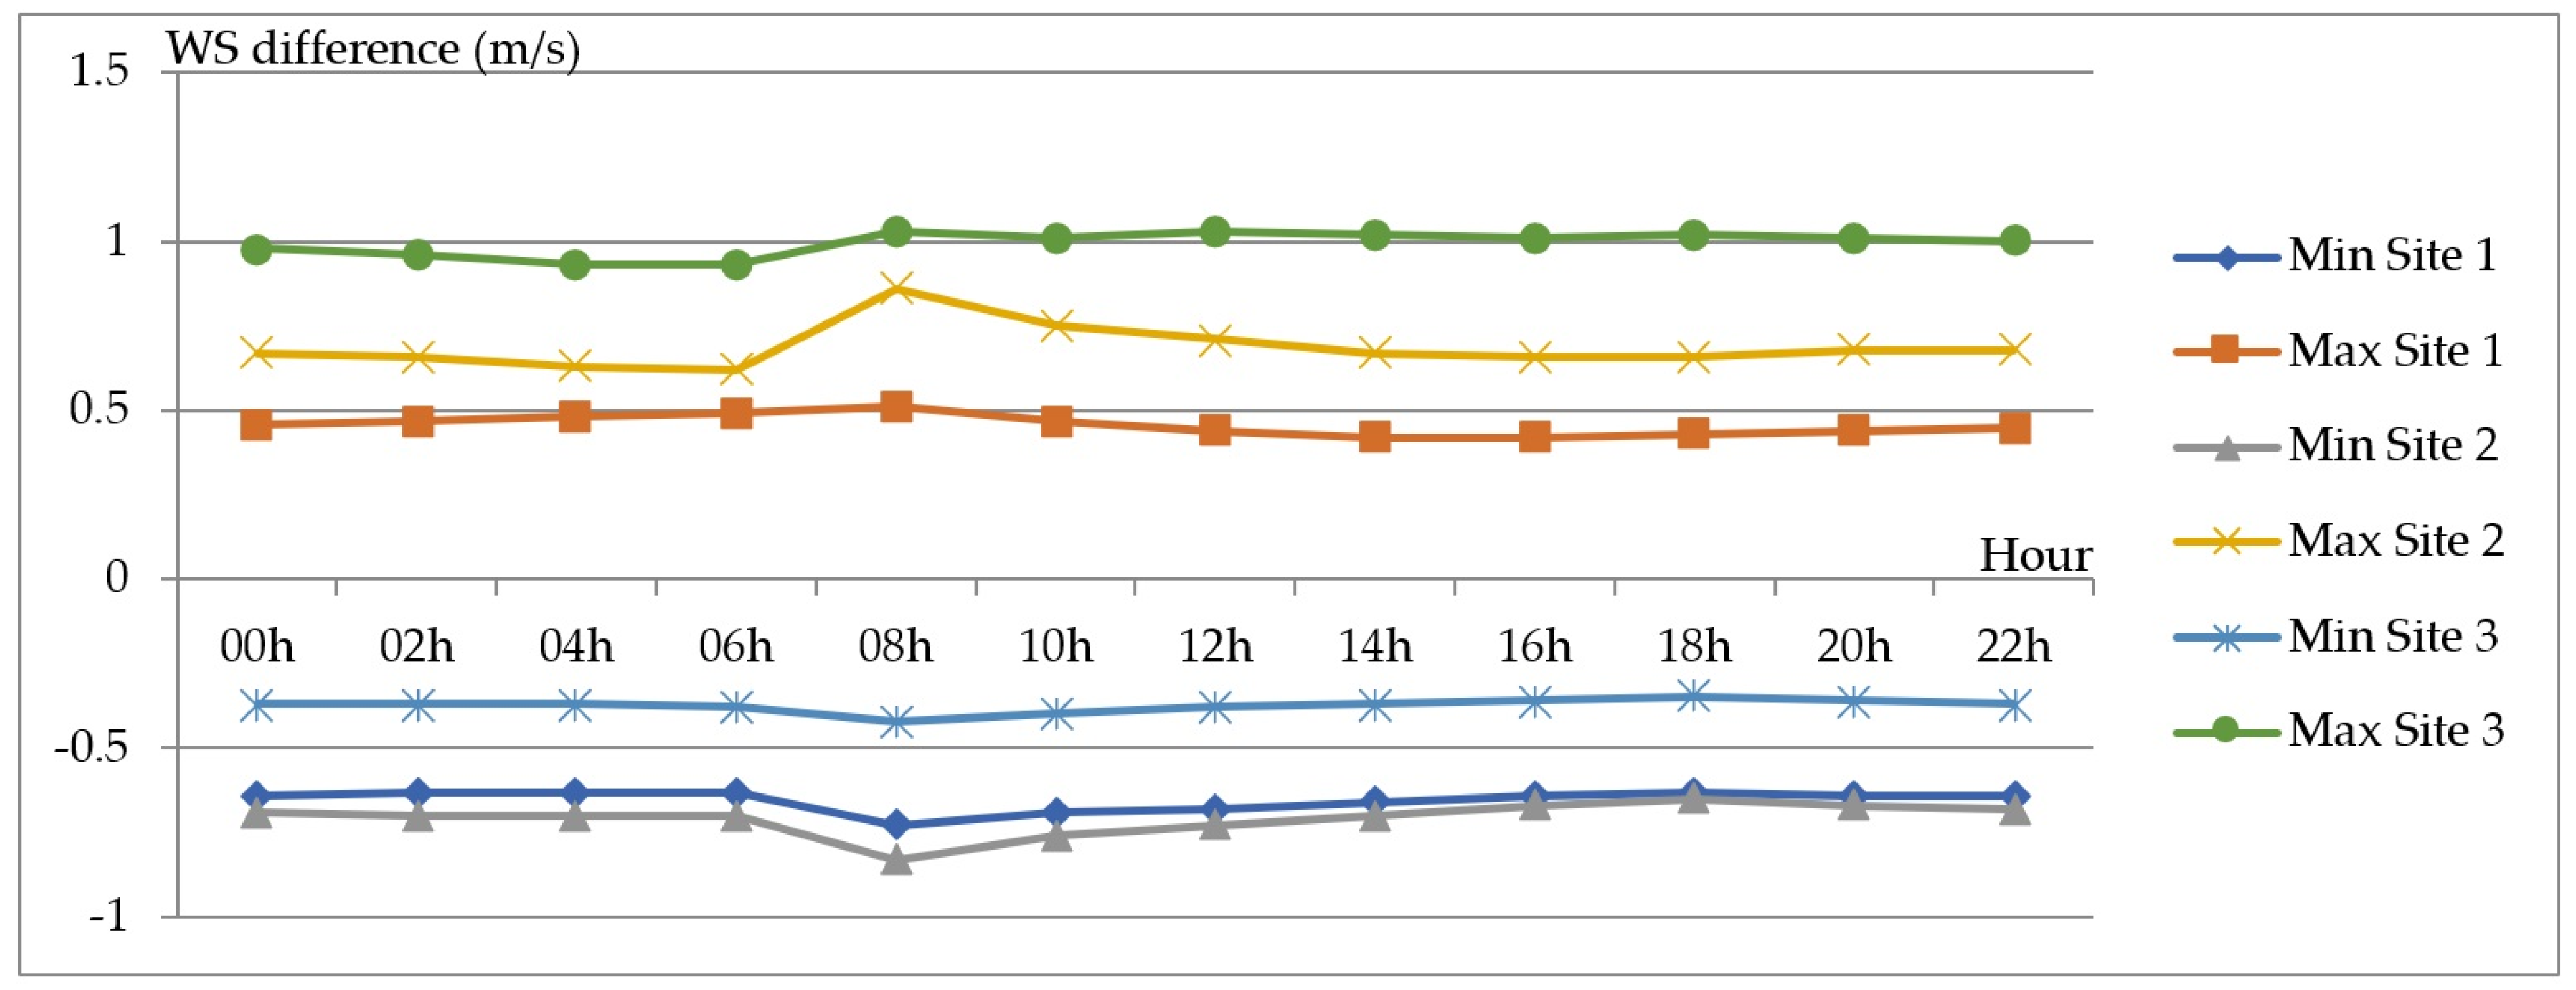
4.2. Wind Speed

Site 1. The transformed urban setting had lower WSs adjacent to the newly constructed building and in the partly-framed POS between buildings (Figure 7a). The values of decreased WSs were relatively constant throughout all analyzed hours, from −0.63 at 6 PM up to −0.73 m/s at 8 AM. The NE and SW outer parts of open space, which are located in the direction of the dominant wind, had somewhat increased WSs. The highest increase in WS was observed in two urban gaps between the new and existing buildings, up to +0.51 m/s at 8 AM. The new building has caused a barrier to air flow and provided additional protection to the inner-block open space from the prevailing SSW wind while simultaneously accelerating the air flow in the gaps between structures. It was also observed that the outer zones with an increase in WS were areas exposed to the dominant wind where the trees were planted. A decrease in WS was recorded in the western outer open space where the trees were removed.
Site 2. New developments in the center of the site, both low- and mid-rise structures, have generated reduced WSs in their surroundings throughout the entire timeframe, up to −0.83 m/s at 8 AM (Figure 8a). The new mid-rise structure represents a barrier to the main wind, and further shields the areas surrounding the low-rise building. Additionally, the disjointed form of structures has created zones of calmer flow in sheltered areas. Two small islands of increased WS that appear next to the objects’ edges are a result of the demolition of previous structures and newly generated open space. On the other hand, a significant part of the open space presented an increased WS, up to +0.86 m/s at 8 AM. These open spaces involve the outer open space in the SW directly exposed to the dominant wind and two urban canyons: between the new mid-rise buildings in the SW and between the newly developed mid-rise building and existing high-rise in the east. The increase in the vertical dimension of structures has resulted in the increased WS in urban canyons.
Site 3. Open space formed by singular shapes in a linear configuration, which is shielded from the prevailing wind, has reduced the WSs in the entire timeframe, up to −0.42 m/s at 8 AM (Figure 9a). This involves both open space with buildings grouped closer together in the northern part of the site, and the central POS where structures are positioned further apart. Zones of lower WSs were positioned along the corners of the transformed structures, involving both a vertical upgrade of the existing buildings and new low-rise construction. The streets and open space in the south that are directly subjected to the main wind had increased WS. New open space, formed by removing the structures, presented the highest increase in WS, up to +1.03 m/s at 8 AM and 12 PM. The urban canyon in the SE presented both increased WS in the segment between the upgraded single-family house and removed low-rise auxiliary building, and decreased WS in the segment between the non-transformed single-family house and the remaining part of the auxiliary building. An increase in WS was also observed in spots of removed trees in areas exposed to the main wind.
When examining the three cases side by side, it was found that the minimum and maximum values of differences in WS between the original and the transformed urban setting in all of the analyzed cases were fairly consistent throughout the day (Figure 10), because the wind speed and direction were not forced in the model. Mid-rise developments in Sites 1 and 2 contributed more to the WS decrease than in the case of low-rise developments in Site 3. The highest increase of WS was recorded in Site 3 due to more open space generated by the removal of existing buildings.
When assessing the impact of the transformation of physical structure on changes in WS, the following key facts were identified:
  • New construction positioned in the pathway of the prevailing wind decreased the WS in the building’s surroundings, which is of particular importance for the POS that is partly framed with new construction; higher buildings presented more WS decrease; and the channeling effects in such partly-framed squares were limited, even in a high H/W ratio, contrary to [18];
  • An increase in WS occurred in urban canyons/gaps that were aligned with the dominant wind, between the existing and new/transformed buildings, corroborating previous findings [6,12]; the higher the structures, the more significant the increase in WS, in line with [11];
  • Disjointed building forms contribute to the reduction in WS;
  • Demolition of structures increases the WS in the footprint of that structure;
  • In outer areas with trees exposed to winds, the trees help to increase the WS, while removing the trees contributes to its decrease, unlike in canyons [45];
  • Although small and similar decreases in wind speed were observed in segments of all three sites, a more significant increase in wind speed occurred in the low-rise setting compared with the other two sites (about 1 m/s).

4.3. Air Temperature

Site 1. In the scenario with a newly developed structure, the AT was lower in the majority of inner POS throughout the analyzed timeframe including nocturnal hours, except during the peak heat of the day from 2 PM to 4 PM (Figure 7b). Regarding the area adjacent to the boundary, the majority of it was hotter in the daytime, from 6 AM to 8 PM, with some cooler islands in the northern open space.
In areas that were hotter in the site, the maximum difference in AT increased from 8 AM throughout the day in the transformed scenario until 12 PM, and then decreased toward the evening and during the night until 02 AM. The greatest increase in AT was recorded in the heat island in the western part of the site in the newly created sunlit area, which resulted from the removal of three tree trunks (+1.39 °C at 12 PM). Other heat islands present in the transformed scenario involved:
  • Area NW of the newly constructed building throughout the afternoon and night, from 6 PM to 10 AM the next day; the maximum increase was at 6 AM (+0.76 °C), even though there was no change in shading at this time (Figure 4a). This island can be attributed to the removal of one tree and also decreased the WS (Figure 7a);
  • SW corner of the inner POS where one tree was removed, in the entire 24-h timeframe, with the highest value over +0.70 °C at 2 PM; this can be explained by the direct exposure to sunlight throughout the day (Figure 4f);
  • NE urban gap between the existing building and new development from 12 PM to 8 PM, with the highest value over +0.60 °C at 4 PM; this island resulted from the newly sunlit surface area starting at 12 PM (Figure 4c), which was generated by the removal of one tree. The values were opposite at night and in the morning—lower ATs were recorded from 10 PM to 10 AM due to the increased WSs in-between buildings (Figure 7a);
  • NW urban gap between the existing building and new development from 12 PM to 10 PM, with the highest value over +0.60 °C at 2 PM. This was generated by replacing the earth cover and paving the area, since there was no significant change in solar radiation (Figure 4c,d); an increase in WS in this area (Figure 7a) contributed to the temperature reduction at night and in the morning, from 12 AM to 10 AM;
  • Area along the SW corner of new building, from 12 PM to 10 PM, which resulted from the new sunlit areas of the removed tree (Figure 4c,d). The highest value over +0.80 °C as at 2 PM; the AT in this spot presented lower values at night from 12 AM to 4 AM and in the morning at 10 AM due to the adjacent large zone of cooler air in the inner POS;
  • Area at the newly formed intersection of pathways in the east between 6 AM and 8 PM, with the highest value over +0.20 °C at 12 PM, resulting from the decrease in green surfaces and new paving.
The greatest decrease in AT was recorded in the open space north of the newly constructed building at 12 PM (−1.32 °C), which was attributed to the increase in shaded areas resulting from the new structure (Figure 4c). Additionally, a significant portion of the inner POS, which is partially framed by structures and existing trees in the SE, was cooler from 6 PM in the afternoon, throughout the night until noon the next day. The inner island of cooler temperature reached the maximum difference of −0.93 °C at 10 AM. This can be explained by the fact that the POS is almost completely shaded in the early morning at 6 AM and 8 AM. Furthermore, the newly constructed mid-rise building reduced the WS in the inner open space (Figure 7a) and enabled the accumulation of cooler nighttime air in the new partly-framed form at 10 AM, which continued until 12 PM. An important point also concerns the change of surface cover. Although the inner POS has undergone significant transformation from grass to earth, this did not contribute to the AT increase, as would occur if the surface was paved. Later in the afternoon, cooler temperature islands coincided with the shaded area of the existing trees (Figure 4f).
The distribution of AT changes did not alter much in the nocturnal period. The majority of the focal POS was cooler at night, with the largest difference in AT of −0.58 °C at 4 AM. The remaining outer open space in the south and east segment of the site also had slightly decreased values of ATs during the night from 10 PM to 4 AM. Starting from 6 AM, the surface area of cooler temperature zones decreased, and hotter island appeared.
Shading from the new structure did not notably affect the reduction in AT values. This is due to the fact that the difference in the shaded area between the two scenarios is minimal, and several trees were removed to make way for new construction, thus generating new sunlit areas. Nevertheless, cooler zones were visible in the temperature map in areas of extended shade at 10 AM, 12 PM, and 2 PM (Figure 4b–d).
Site 2. Lower temperatures were evident across most of the analyzed site in the transformed scenario, from 10 AM to 6 PM (Figure 8b), with zones of increased AT that appeared in the vicinity of the newly developed structures. The majority of hotter zones was exposed to direct sun radiation, which resulted in a temperature increase of up to +1.12 °C at 4 PM in the sunlit surroundings of a new mid-rise residential building in the SW of the site (Figure 5f). Increased ATs were also evident in the area in-between the mid-rise buildings that formed urban canyons during the day, from 10 AM to 2 PM, with the highest increase at 12 PM (+0.45 °C). These were also mostly sunlit zones (Figure 5d).
The lowest ATs were observed at daytime along the new construction, especially in the nooks resulting from the disjointed building forms and in-between structures: at 8 AM along the new mid-rise in the SW (−1.31 °C), and in-between the new developments in the center of the site at 2 PM (−1.24 °C). These were areas within the newly generated shade, which covered quite an extensive surface area from 2 PM to 6 PM (Figure 5b,c,e,f). Lower temperatures in the surroundings of new central structures occurred from 10 AM to 6 PM in spite of reduced WS (Figure 8a). The largest areas of cooler temperatures were present in the hottest part of the day (12 PM to 4 PM) in the surroundings of a newly constructed single-family house that is low-rise, despite the fact that a significant part of the site is sunlit (Figure 5d–f). This can be explained by the grass cover in the surroundings of the house, the preservation of the existing nearby trees, and the cooling effect of shade along the disjointed building form and between the structures. The absence of two trees that were removed to pave the area has resulted in the sunlit island in the period from 10 AM to 2 PM (Figure 5b), and consequently, in the increase in ATs at 12 PM and 2 PM (over +0.20 °C). On the other hand, the newly planted tree in the SW has increased the shade (Figure 5e) and decreased the ATs in the same time period (over −0.2 °C at 2 PM).
Changes in nocturnal ATs occurred in the completely opposite pattern. Areas surrounding the low-rise single-family house were the hottest at nighttime. The temperature value slightly increased in the early evening (+0.12 °C at 8 PM), increased throughout the night until 4 AM, when it reached a maximum of +1.40 °C, and again started to decrease toward the morning (+0.35 °C at 8 AM). Areas of higher temperatures were associated with new construction that stores heat during the day and radiates it at nighttime, in line with the existing findings [20]; as well as decreased WS, which helps with the accumulation of hot air at night (Figure 8a). Similarly, an increase in nocturnal temperatures was recorded in the surroundings of the new mid-rise building in the SW, only to a lesser extent. Meanwhile, the areas involving two urban canyons were cooler at night, with the overall largest decrease of −0.58 °C at 6 AM. This can be attributed to the fact that the entire surface area of both urban canyons is shaded in the morning, while the increased WS helps in reducing the AT (Figure 8a). There were no significant changes in the nighttime temperatures involving the two trees that were removed, since they were positioned in the urban canyon with lower temperatures. There was an evident AT increase in the area of a newly planted tree in the west of the site at night (over +0.4 °C at 4 AM).
Considering the abundant vegetation in the area, both grass and tall plants, it can be asserted that the greenery has contributed to lower ATs. Areas covered with grass and planted with trees in the northern and SE part of the site were cooler in general during the warmest hours of the day from 10 AM to 6 PM in the transformed scenario, but with lower values of AT in areas where buildings were grouped closer together. It was also observed that sunlit areas with planted trees presented an overall lower daytime AT in the zone from 8 AM to 6 PM due to shaded islands generated by the trees (Figure 5d–f).
Regarding the effect of the structures’ transformation and shading on the reduction in AT, it was established that extended shading affected the AT by creating cooler temperature islands during all hours from 6 AM to 6 PM, except at 6 AM in the SW spot with the newly planted tree (Figure 5a). This deviation can be explained by the increased temperature island that is formed at nighttime by the new tree, which also extends to the early morning.
Site 3. Multiple small-scale transformations in this site have resulted in a multitude of changes in the AT (Figure 9b), which were more difficult to evaluate compared with the other two sites. Most of the new urban configuration presented higher ATs in the interval from 12 PM to 6 PM including the focal POS. Hotter areas involved fragmented inner open spaces in-between the structures, while outer areas presented a decrease in the ATs. The maximum recorded AT increase amounted to +1.35 °C at 2 PM in two sunlit areas adjacent to the new construction in the east. One of them involved new auxiliary low-rise buildings in the NE that have formed a partly-framed open space of small scale and contributed to the increase in AT from 12 PM to 6 PM. The other heat island was a newly formed sunlit area in the SE, generated by the removal of one tree.
Most of the open space was sunlit during the hottest part of the day until 4 PM (Figure 6f), which contributed to the increase in AT. However, a reduction in AT was observed in the vicinity of the transformed buildings in this period, particularly in the corners of the disjointed building forms and in the urban canyon and gaps that enable air flow. Lower temperatures persisted in the urban canyon and gaps north of the transformed buildings that are grouped close together, which was attributed to the newly generated shades (Figure 6c,d). The lowest value of AT amounted to −1.57 °C at 2 PM in the urban canyon in the SE, between two transformed structures. Throughout the afternoon, cooler islands adjacent to the transformed buildings decreased in size and value, with smaller differences in the evening. Outer areas also had somewhat lower values of AT in general during the day, which was evident in the northern and southern open spaces at 2 PM in areas where no other transformations had occurred and there was no change in shading (Figure 6c). For outer areas in the south, this can be explained by the exposure to the dominant wind. In the northern outer space that was shielded, although a decrease in WS was present (Figure 9a), the value of that decrease was relatively small, which, along with the presence of some shaded surfaces (Figure 6f), could account for a slight temperature decrease (up to −0.2 °C).
Changes in the nocturnal ATs presented a completely different pattern. At 8 PM, smaller zones of cooler temperatures also appeared in the site’s internal open space and persisted until 10 AM. Both the surface area of the cooler zones and temperature difference increased throughout the night. Notwithstanding, vast areas of increased ATs were present throughout the night. The temperature was lower in the immediate surroundings of the new developments and transformed structures. The lowest values of the AT differences were recorded in the open space partly-framed by the new construction in the NE (−0.74 °C at 4 AM) and in the SE urban gap where the existing structure was demolished, between the existing single-family house and new mid-rise building (less than −0.40 °C at 4 AM). This can be explained by the accumulation of cooler nighttime air in the new partly-framed space as well as increased WSs in the spot of the removed building (Figure 9a) and exposure to the dominant wind in the urban gap. On the other hand, in the remaining two areas where an existing low-rise auxiliary building was demolished, an increase in AT was observed at night despite the higher WS. These involved the spot in the west where a tree was also removed, and the area north of the new mid-rise in the east. This can be attributed to the shielded position of both open spaces from the prevalent wind, but also to the change in surface cover next to the demolished structures. Cooler grass islands were replaced with paved surfaces, which absorb more heat during the day and radiate it during the night.
Zones with lower temperatures increased toward the morning until 8 AM, when the most extensive cooler areas were present. The coolest open spaces involved the urban canyon and gaps framed by new/transformed structures, regardless of whether they were sunlit or shaded (Figure 6e). This was a result of the overall cooler air in the morning, when the largest surface area was shaded. Although most of these islands were also cooler at night, the urban canyon in the SE was hotter during the night. This area began to show lower ATs from 6 AM, which was attributed to newly generated shade (Figure 6a). The largest temperature difference of −1.29 °C was recorded in this spot at 8 AM, despite the fact that the area was sunlit (Figure 6e). This was associated with lower morning temperatures resulting from the shaded areas at 6 AM, and the position of the canyon, which is shielded from the dominant wind, enabling the accumulation of cooler air. Lower values persisted in this spot throughout the day until 6 PM due to shading, but with smaller differences (−0.42 °C at 6 PM). The narrow canyon segment between the auxiliary low-rise structure and the new mid-rise development is paved and sunlit in the morning (Figure 6e), and along with decreased WS (Figure 9a), resulted in higher nighttime ATs and a heat island at 8 AM. Starting from 10 AM, this urban canyon presented a decrease in ATs, with the lowest value of AT difference of −1.57 °C at 2 PM, between the mid-rise and the removed part of low-rise structure, which was attributed to shading (Figure 6c,f).
The removal of trees that was performed to pave the area has resulted in an increase in the sunlit surface throughout the day (Figure 6a–d), and consequently, in the increase in ATs in these spots from 6 AM to midnight. On the other hand, areas of removed trees contributed to lower temperatures at 2 AM and 4 AM. In this particular case, no correlation was established during the daytime between the changes in AT and the reduction in grassy areas, while this relation existed at night. This can be attributed to two reasons: (1) the AT is much more dependent on shading, and (2) only small grassy areas were converted into pavement.
Although the differences in shaded areas were not significant during the day, cooler temperature zones were noticeable in the extended shade provided by the upgraded buildings and new developments. The transformation of structures has therefore contributed to lower ATs, particularly in the morning at 8 AM and late afternoon at 4 PM, when the difference in extended shade was the largest (Figure 6b,d). Hotter zones were present during the day in areas where new sunlit surfaces appeared due to the removal of trees.
When analyzing the three cases, the researchers discovered that the minimum values of differences in AT between the original and the transformed urban configuration in all of the analyzed cases were small and quite uniform in the afternoon and at night, from 6 PM to 4 AM (Figure 11). Daytime values were different between the three sites, but the biggest deviation in minimum temperatures was at 2 PM in Site 3. This was the effect of the new mid-rise development on previously partly vacant land, similar to Site 2. Additionally, the same AT distribution patterns north of the new mid-rise developments were observed in Site 2 and Site 3 from 10 AM to 6 PM, when the shaded areas and position shielded from wind enabled the accumulation of cooler air (Figure 8b and Figure 9b).
The values of the differences in the maximum temperatures were uniform and similar for Sites 1 and 3 in the timeframe from 6 PM to 4 AM (Figure 11). This can be explained by the smaller scale of transformations that occurred in Sites 1 and 3 compared with more extensive new developments and transformations in Site 2. The increase in AT reached its maximum value at daytime, at noon in Site 1 and at 2 PM in Site 3. The values of the differences in maximum temperatures mostly showed the opposite pattern in Site 2, except at midnight and late afternoon—the biggest difference in the rise of AT was at night at 4 AM, which can be explained by the development of voluminous new structures that radiate heat stored during the day.
The following summarizes the key findings when examining the impact of transformations on ATs in open spaces:
  • New mid-rise construction on undeveloped land significantly decreased the ATs north of the structures, in shaded areas shielded from the dominant wind, during the hottest part of the day;
  • In urban canyons and gaps formed by new mid-rise buildings and existing high-rises, the ATs increased during the daytime, confirming the influence of urban geometry [12,39] and direct solar radiation [27], started to decrease in the afternoon/evening, and continued to decrease throughout the night until the morning. The increase in WS between the buildings contributed to lower ATs at night, but not to a temperature reduction during the day due to the flow of hotter air, as established in the literature [32];
  • In the inner open spaces and urban gaps in low-rise settings with multiple transformations, the ATs increased during the day until the evening, except in areas north of transformed structures that were shielded from wind. These hotter zones persisted throughout the night, as established for dense urban environments [32];
  • The POS in settings with high-rise buildings, when partly framed by new mid-rise development at northern edge blocking the wind, presented decreased ATs during the day, except in the hottest afternoon hours, due to extensive shading in the early morning and late afternoon [4,13] and decreased WSs that helped accumulate cooler air;
  • New construction that created a partly-framed open space of a small scale contributed to the increase in AT during the hottest part of the day due to the accumulation of hotter air; in these spaces the ATs decreased overnight;
  • During the night, areas with newly planted trees presented an AT increase, while areas of removed trees contributed to lower ATs;
  • Existing knowledge [5,19] can be supplemented with the statement that rich vegetation in the area also contributes to lower ATs in densification processes;
  • In the setting with multiple small-scale transformations, no significant correlation was established between the changes in the ATs and the reduction in grassy areas during the daytime, but the decrease in green surfaces and increase in paved surfaces contributed to lower ATs at night;
  • A significant AT increase was recorded in all three types of transformations (about 1.5 °C); single isolated mid-rise development and multiple small-scale transformations/developments presented the highest increase during the day, while the extensive new development of mid- and low-rises resulted in the highest increase during the night.

4.4. Mean Radiant Temperature

As established in previous research [26], the maps showing the differences in MRTs and direct solar radiation featured areas that completely align during the day (Figure 4, Figure 5, Figure 6, Figure 7c, Figure 8c and Figure 9c). Maps that present the differences in ATs and MRTs also indicated some overlap in their areas of lower values during the day from 8 AM to 6 PM (Figure 7b,c, Figure 8b,c and Figure 9b,c) due to the effects of solar radiation, while this correlation was not established at night. This can be attributed to the fact that the perceived comfortable temperature is directly affected by the ATs and direct sun radiation.
Site 1. Zones of both increased and decreased MRTs were equally represented in the morning, while MRTs were higher throughout most of the urban settings with newly developed buildings in the afternoon hours (Figure 7c). The largest increase in MRT occurred in the newly exposed sunlit areas, which were created by removing trees (Figure 4b–d). The highest value of difference in MRT was recorded south of the new structure at 2 PM, in the sunlit area of the removed tree (+43.60 °C). However, some small parts of open space located in shaded surroundings of the new construction had lower MRTs in the daytime, with the lowest value in the NW urban gap generated by the new mid-rise development at 10 AM (−36.36 °C).
Beginning with 8 PM and further throughout the night, the MRT values decreased (up to −3.55 °C at 4 AM), and the greater part of the open space featured small varieties in MRTs. Areas with the lowest MRT values were those where trees and hedges were removed, which can be explained by the fact that their removal resulted in fewer surfaces that could radiate heat at night. The areas with slightly lower MRTs at night also involved inner open space with earth cover between buildings, which was a result of the reduced ATs in this POS and the fact that soil does not absorb much daily heat and radiate it during the night. MRTs were increased in the surroundings of the new development, since it is a new source of heat radiation. Outer areas in the NW presented higher MRT values during the night, which were relatively uniform (from +2.54 °C at 8 PM to +2.43 °C at 04 AM).
Site 2. MRT values were reduced across most of the urban setting from 8 AM to 10 PM in the scenario with transformed structures (Figure 8c). The largest reduction in daytime MRT was observed in the newly formed shaded areas, created by the increased building heights and the newly planted tree in the SW part of the site, and amounted to −23.14 °C at 8 AM. Additionally, newly developed objects had increased MRTs in their surroundings throughout the day, resulting from the increased volume of built structures. Newly sunlit areas contributed to the MRT increase the most, with the biggest increase of +22.55 °C at 8 AM.
At night, the MRTs increased their values, and higher-value zones covered a more extensive area from midnight to 4 AM. The spot with a newly planted tree, along the disjointed form of a newly constructed building, presented higher MRTs from 8 PM to 4 AM, with the highest MRT difference of +4.36 °C at 4 AM. At 6 AM, the spot of the new tree had a lower MRT because of the shade generated by the new construction (Figure 5a). Areas with lower MRTs were also evident in the surroundings of transformed structures throughout the evening and night, from 8 PM to 6 AM. The lowest value of difference in nighttime MRT was recorded at 4 AM in the area where the two trees were removed (−7.77 °C).
Site 3. Daytime MRT values were elevated in the transformed scenario in the majority of open space, except in the morning at 6 AM and 8 AM (Figure 9c). The extreme value of maximum difference was recorded at 10 AM and amounted to +40.59 °C in the western area, where a low-rise building and one tree were removed. This resulted in a newly sunlit spot, with solar radiation now being absorbed by the ground and remaining structures, which consequently increased the AT (Figure 9b). This was also the case with other sunlit spots of removed trees. Zones of lower MRTs during the day were evident in the extended shade, generated by the transformation of structures and new trees (Figure 6a–d). Furthermore, areas with existing trees and hedges helped to reduce the MRT values during the day due to shading (Figure 6e,f). The biggest difference in the minimum values of MRTs was recorded in the newly generated shade along the mid-rise building in the SE at 8 AM (−35.07 °C).
At night, starting from 8 PM to 4 AM, the majority of the area had higher MRTs, with some islands of lower values. The differences between the maximum and minimum values were much smaller when there was no solar radiation. Lower MRTs were recorded in paved areas, particularly in newly paved zones with reduced greenery, with the lowest value recorded at 4 AM (−2.88 °C) in the west spot of the removed building and tree. Additionally, the open space in the surroundings of the demolished low-rise buildings had cooler MRTs because the decreased volume of structures absorbed and radiated less heat compared with the buildings in the original configuration. The highest value of maximum differences at night amounted to +2.61 °C at 8 PM.
The comparison of the three cases showed that during the day, Sites 1 and 3 presented areas of both increased and decreased MRTs, while the majority of Site 2 had lower MRTs. Lower values in Site 2 were attributed to the fact that the transformation of the structures generated new extensive shaded areas at the parterre level. The daytime maximum value in the MRT difference in Site 2 was at 8 AM and significantly lower compared with the maximum values in the other two sites—Site 1 at 2 PM and Site 3 at 10 AM (Figure 12). This discrepancy was a result of the fact that more trees or structures were removed in Sites 1 and 3, which generated new extensive sunlit areas, whereas new construction did not affect that open space.
The analysis of nocturnal MRTs revealed that the majority of Site 1 had decreased MRTs and Site 3 had increased MRTs, while in Site 2, both zones of lower and higher values were present. During the night hours, the minimum and maximum values of absolute differences in MRT at the three sites were uniform from 8 PM to 4 AM. However, the minimum values of MRT differences were similar for Sites 1 and 3, while at Site 2, this difference was slightly larger (about 7.0 °C). The lower value in Site 2 can be explained by the synergic effect of the removal of trees and the adjacent new mid-rise construction.
In line with the findings above-mentioned, the effects of the structure transformation on MRT identified in this research can be outlined as follows:
  • Newly developed/transformed objects increased the MRTs in their immediate surroundings throughout the day as a result of the larger structure volumes, which absorbed and emitted greater amounts of heat, except in areas of extended shade during the day and areas of removed greenery at night;
  • In the inner POS—square, partly framed by mid- and high-rise buildings and gaps, the daytime MRTs increased despite lower ATs. More shading and improved microclimate in square shapes [18] could be achieved by enclosing the POS with trees. The nocturnal MRT values decreased in the majority of the POS, where the surface cover was transformed from grass to earth, due to the lower emissivity of soil, which has been verified in research [18];
  • Extensive new mid-rise developments in green and high-rise environment contributed to the decrease in daytime MRTs in the majority of the site due to more extensive shading generated by the buildings, particularly in the afternoon, as stated in the literature [5,10,22]; they also increased the overall MRT values at night;
  • Multiple small-scale transformations in the densification of low-rise settings increased the MRTs at nighttime in the majority of the area;
  • Areas with existing trees contributed to the MRT decrease during the day, as found by other researchers [32,42], while the removal of trees, hedges, and grass increased the MRTs during the day and decreased them at night;
  • During the day, Sites 1 and 3 had areas of increased and decreased MRTs, while the majority of Site 2 had lower MRTs; at night, Site 1 had mostly decreased MRTs, Site 3 mostly increased MRTs, and zones of lower and higher values were present in Site 2.

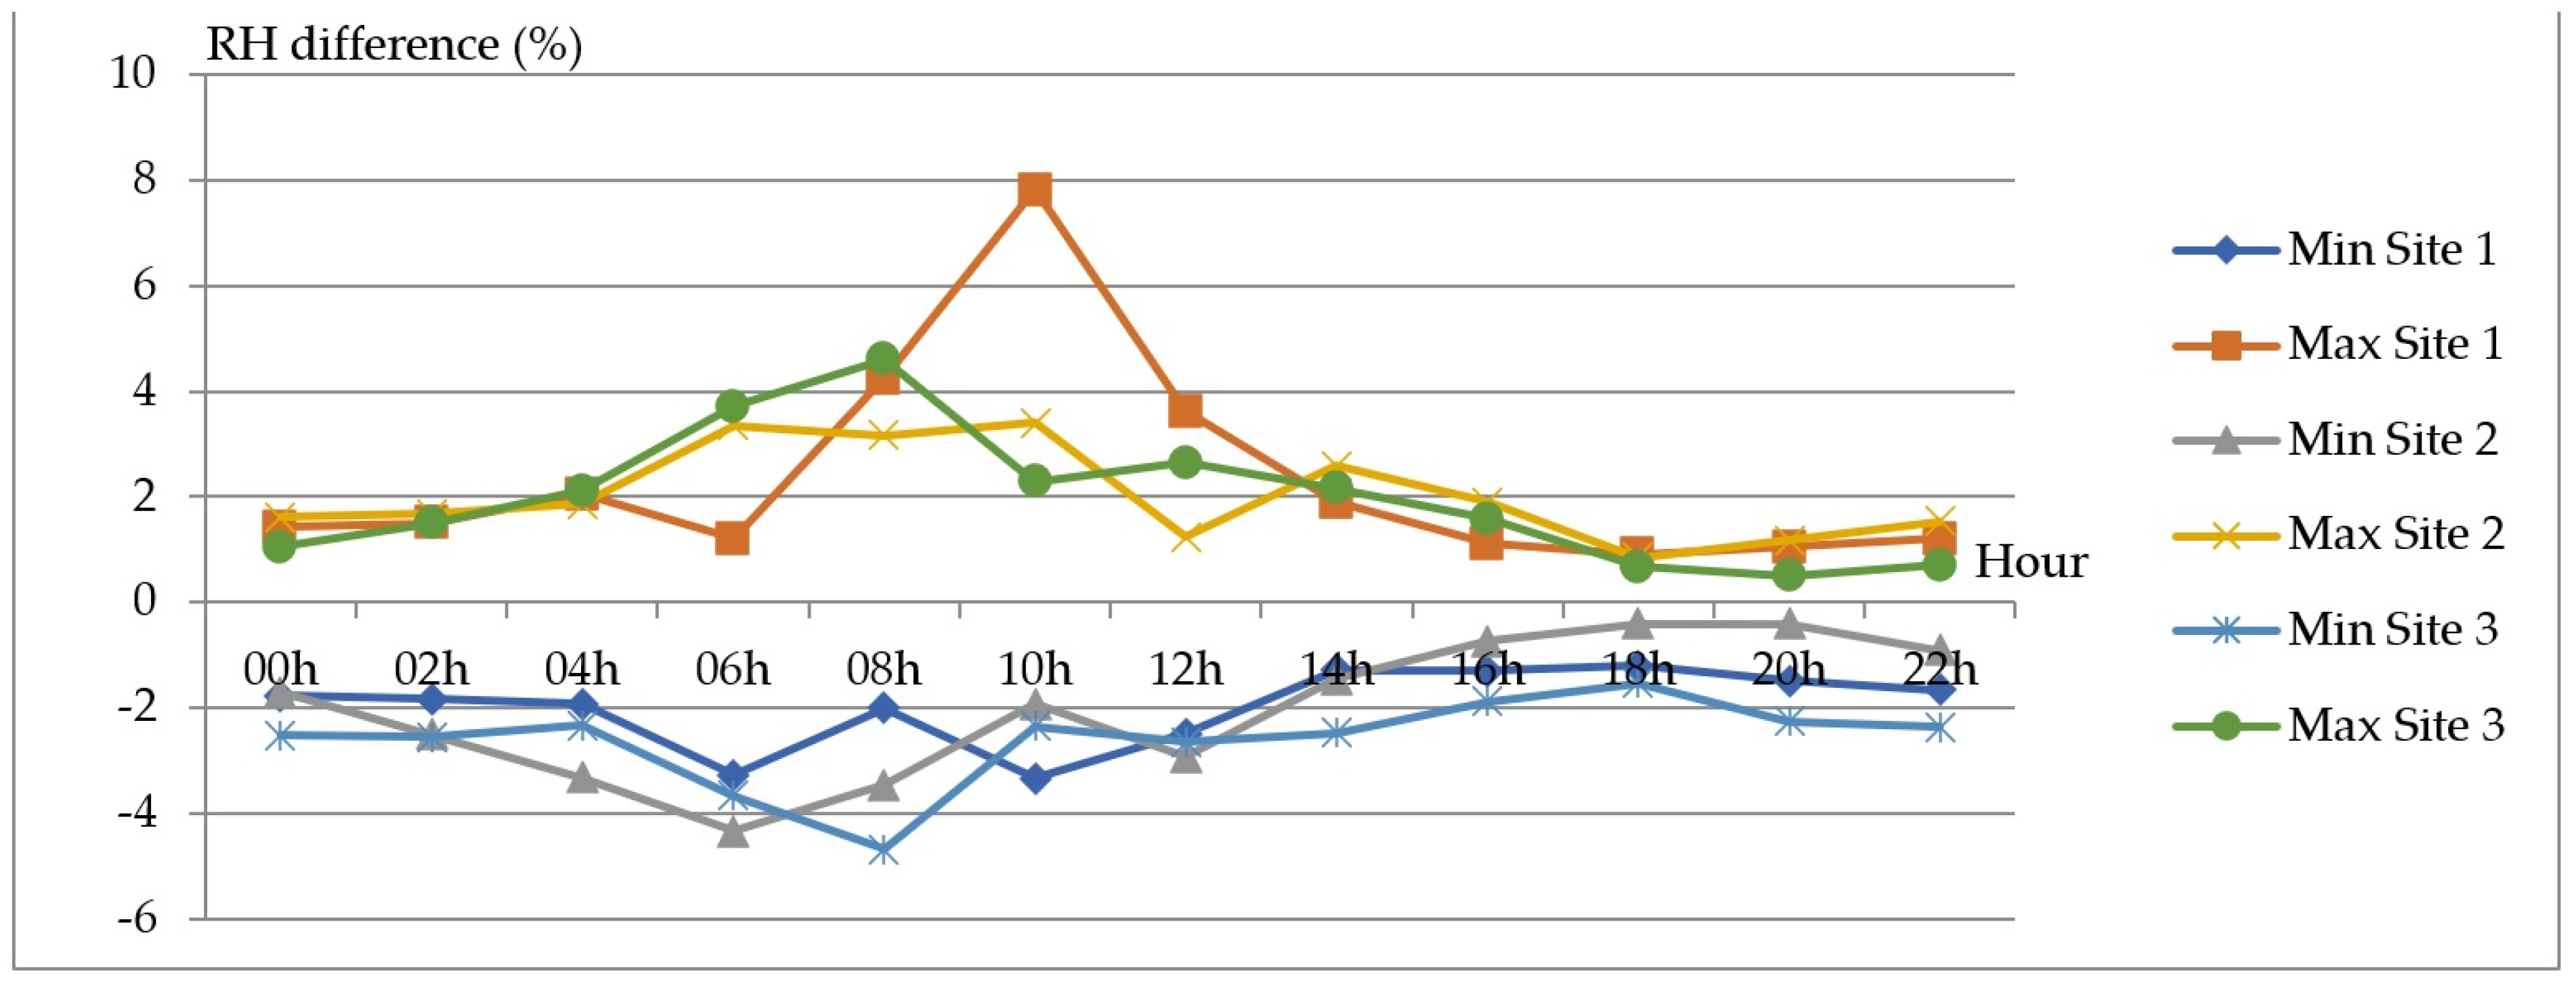
4.5. Relative Humidity

As expected, a higher RH was present in zones with lower AT, and vice versa. Therefore, their zones of extreme values significantly overlapped (Figure 7b,d, Figure 8b,d, and Figure 9b,d).
Site 1. Regarding the outer open space at the border of the site, zones of decreased RH were observed throughout the entire timeframe (Figure 7d). Areas of lower humidity all involved zones with increased ATs (Figure 7b):
  • Western segment of open space where the trees and green cover were removed, from 8 AM to 6 PM (up to −3.33% at 10 AM); this area presented a higher humidity at 6 AM, which was the result of increased nighttime RH that extended into early morning, when this zone was still shaded;
  • Area along the NW corner of newly constructed building throughout the entire timeframe, except at 12 PM and 2 PM, with the lowest level of RH recorded at 6 AM; lower values are attributed primarily to the removal of the tree that has reduced evaporation in this spot, but also to decreased WS (Figure 7a); at 12 PM and 2 PM humidity is slightly increased in the extended shade of the new structure (Figure 4f);
  • Zone along the NE corner of the new building at 8 AM and 10 AM due to the sunlit surface (Figure 4e) and an increase in WS (Figure 7a);
  • Two newly formed urban gaps: NW gap from 12 PM to 10 PM, and NE gap from 2 PM to 8 PM, resulting from the increased WS (Figure 7a); both urban gaps presented increased RH levels at night and throughout the morning;
  • Surroundings of the existing structures in the east throughout the day, particularly in the urban gap between existing buildings, since it was aligned with the dominant wind and presented increased WS (Figure 7a). The lowest RHs were recorded in the newly paved intersection of pathways; these areas had a higher RH at night.
A constant increase in daytime RH was recorded in the northern segment of the outer open space adjacent to the newly constructed building throughout the entire timeframe, with the highest value at 12 PM (over +2%). This was attributed to the temperature decrease in this area (Figure 7b), generated by new shading (Figure 4c).
On the other hand, most of the inner POS showed higher RH values in the transformed scenario in the timeframe from 8 PM, throughout the night, and until 12 PM the next day (up to +7.82% at 10 AM). An increase in humidity occurred despite the fact that grass was replaced with earth cover, resulting in lower evaporation in this open space, and that the area is sunlit in the morning (Figure 4e). This can be explained by the fact that the POS is partly framed with high-rise structures and trees that extend the shading to late morning, while existing trees also contributed to higher RHs. Moreover, the newly constructed mid-rise building has reduced the WS along the building (Figure 7a), thereby enabling the accumulation of cooler nighttime air and humidity. The removal of trees in the inner POS area has resulted in lower RH in these spots, particularly in the hottest part of the day from 12 PM to 8 PM. Lower RHs persisted throughout day and night in the island in-between buildings in the SW, where one tree was removed and generated higher ATs (Figure 7b). It can therefore be stated that, during the day, there was less evaporation from the grass compared with the evaporation from trees. From 2 PM to 6 PM, a significant part of central POS presented lower RH levels in the zone adjacent to the building located at the west of the site, in areas where trees and grass had been removed.
Site 2. Both the increase and decrease in RH in open space were evident in the transformed scenario throughout the entire day (Figure 8d). From 6 PM, throughout the night, and until 8 AM the next day, the increase in humidity occurred in two urban canyons that were formed adjacent to the newly developed mid-rise building in the center of the site, and in the spot of one demolished structure adjacent to the new mid-rise development in the SW. The maximum value of difference in RH in the two urban canyons was high and exceeded +2% at 6 AM. In the remaining part of the site, the RH levels were decreased from 6 PM to 8 AM, and the zone of lowest value was formed in the surroundings of the newly constructed low-rise structure (up to −4.34% at 6 AM), which was attributed to the higher ATs (Figure 8b). The maximum value of the RH increase amounted to +3.41% at 10 AM in the nook of the new building in the SW. Such a high value was attributed to the new shade in this area, which favored the decrease in AT.
In morning hours at 10 AM, most of the site had lower RH levels. From 12 PM and throughout in the afternoon to 4 PM, the zones of increased and decreased humidity were formed in the completely opposite manner to the nighttime and early morning zones: two urban canyons presented lower humidity (up to −2.93% at 12 PM), while the values were increased in the surroundings of the low-rise structure (up to +2.58% at 2 PM). Changes in RH during the day can be explained by increased ATs in the urban canyons, and lower ATs in the surroundings of the new low-rise development (Figure 8b). At 6 PM, the entire site presented mostly higher RH values. A zone of decreased RH persisted in the newly paved area along the disjointed building form south of the new central structure—with no plants to perform evaporation, the RH became lower, and the AT increased. Decreased RH was observed in the northern green area positioned in line with the prevailing wind at 6 PM, which extended into the night.
Site 3. Zones of lower and higher humidity were equally represented throughout the site in the entire timeframe (Figure 9d), except at 4 PM and 6 PM when the greater part of the open space had lower RH values in the transformed scenario. The majority of focal POS had lower RH levels throughout the 24-h timeframe.
Zones of lower humidity throughout the night and morning involved the surroundings of the transformed structures. The lowest value of differences was recorded at 8 AM (−4.68%) in the western area where both a building and a tree had been removed. Other areas with a significant RH decrease were associated with an AT increase (Figure 9b) and involved:
  • A narrow segment of the urban canyon shielded from the dominant wind, between the new mid-rise and partly demolished auxiliary building in the SE of the site, from 10 PM to 8 AM, also due to a decreased WS (Figure 9a);
  • Area north of the new low-rise development with disjointed form that was shielded from the dominant wind, from 6 AM to 10 AM, when the surface was sunlit (Figure 6e);
  • Area along the structures in the SW where existing trees were removed, throughout the entire timeframe, except at 4 AM; a lower daytime RH can be explained by the conversion of grass areas into pavement, and the removal of trees that generated new sunlit areas (Figure 6a–d) and caused the loss of evapotranspiration. The lower humidity during the night, except at 4 AM, can also be attributed to direct exposure to the dominant wind;
  • Partly-framed open spaces in the north, in the surroundings of the transformed auxiliary buildings, from 10 AM to 6 PM, which can be explained by the position being shielded from the prevalent wind and a sunlit surface (Figure 6f);
  • Area in front of the new mid-rise structure in the east where one tree was removed, from 10 AM to 8 PM; this was associated with newly sunlit areas from 10 AM to 2 PM (Figure 6c,f), which also contributed to the increase in MRTs in this interval (Figure 9c).
Zones of increased humidity were also present throughout the night and day, with the smallest surface area in the afternoon at 4 PM and 6 PM. The largest areas with increased RHs were observed at 8 AM, when the following zones of higher humidity appeared in the proximity of the transformed structures, all with cooler ATs:
  • Western street segment between the adapted single-family house and newly constructed multi-family building; a higher RH zone existed throughout the night and persisted until 12 PM; higher daytime values can be attributed to the extended shade in the morning (Figure 6e), which also contributed to lower MRTs (Figure 9c);
  • Northern open space adjacent to the existing high-rise and newly developed low-rise structures at night, from 8 PM to 8 AM;
  • NE open space partly framed by the new low-rise development and protected from the dominant wind; RHs in this area were also increased at night from 8 PM to 8 AM;
  • Open space located south of the upgraded house in the center of the site, in the morning from 6 AM to 10 AM; higher RHs in this spot resulted from shading (Figure 6e) as well as also lower MRTs (Figure 9c);
  • Urban canyon shielded from the wind in the east, between the partly demolished auxiliary building and the transformed single-family house, from 8 AM to 6 PM; the highest difference in RH increase in the site was in this area at 8 AM (+4.61%);
  • SE urban gap between the new mid-rise development and existing single-family house, also involving the demolished building, from 8 PM to 10 AM; this is exposed to the dominant wind and presented an increased WS (Figure 9a).
In the comparison of cases, it was observed that all three sites presented zones of both lower and higher humidity, depending on the position, scale, and exposure to the wind of the new construction as well as changes in greenery. The minimum and maximum differences in RH between the original and the transformed urban setting were similar in the afternoon and part of the night, from 2 PM to 2 AM (Figure 13). Values of maximum humidity differences were uniform at 4 AM in all three sites, but significant differences were noted in the morning hours until noon, particularly at Site 1, which can be explained by the nature and scale of the transformations. The largest increase in the maximum RH values was observed at Site 1 at 10 AM in the inner POS, and was significantly higher compared with the maximum values in the other two sites, at 10 AM in Site 2 and 8 AM in Site 3.
Regarding the differences in minimum RH, they were similar in all three sites, but with larger values from 4 AM to 10 AM. The largest variation in the minimum difference was at 8 AM at Site 3, in the spot involving the demolished building and removed tree. Site 2 presented the biggest difference in minimum values at 6 AM in the wind-protected open space involving the demolished and new structures and new paving. At Site 1, the biggest difference in minimum value was at 10 AM in the area of removed trees and green cover.
Several key points regarding the changes in RH in the transformed buildings scenario can be singled out:
  • Small-scale partly-framed spaces, formed by new/transformed structures of low rise that enable some wind flow, presented higher RH values in the majority of the area throughout the night, with the highest values in the morning and decreased values during the day;
  • Large-scale partly-framed open space in a high-rise setting that experienced a change in surface cover to soil presented an increase in RH throughout the entire timeframe due to reduced WS, which contributes to thermal discomfort in hot environments [37];
  • In linear urban canyons and urban gaps that were generated by the new/transformed structures and exposed to the wind to some extent, higher humidity levels appeared at night and the values increased toward the morning; differences in RH presented opposite values during the day, with a decrease in RH;
  • Urban canyons and open space involving transformed structures that were shielded from the dominant wind presented lower RH values in the nighttime, which further decreased toward the morning; differences in RH presented opposite values during the day and increased values;
  • Change in the surface cover from grass to pavement decreases the RH values during the day; since the RH increases under tree canopies [44], the removal of trees in sunlit areas resulted in lower humidity during the day and higher humidity at nighttime;
  • Values of absolute differences in RH were overall smaller in the late afternoon and at night, and they started to increase in the morning; a substantial rise in RH was present in the early morning when cooler temperatures reduce the air’s capacity to hold moisture.

5. Conclusions

Software simulations performed in this research for three residential areas in Niš, Serbia provided a deeper insight into the performance of microclimate factors affecting thermal comfort in urban densification processes by assessing the impact in the “before” and “after” scenarios. The results presented in this study can be considered applicable for many cities with hot summer conditions.
Reflecting on the first research aim, to determine how and to what extent the post-socialist densification of urban structure influenced the microclimatic parameters of thermal comfort in open spaces within various residential settings, it can be stated that all three types of urban transformations produced zones of substantial changes in WS, AT, MRT, and RH, with different peak hours during the day and night. The variations in microclimatic parameters were influenced by the shape, scale, and surface cover of open space, while disjointed building forms further enhanced their effect. Some segments of densified configurations showed microclimatic improvements, which supports the initial hypothesis. The results indicate that the new development partly framing the POS along the dominant wind path reduced the WS, while clearing up space from existing structures brought a significant increase in WS, even in low-rise urban settings. However, the increase in WS may not have contributed to the daily AT reduction due to the flow of hotter air, as solar heating and urban heat sources tend to overwhelm the cooling effect caused by air movement. The study also found that dispersed densification in low-rise settings significantly increased the ATs during the day, while an extensive grouped development of mid- and low-rises generated the highest AT increase at night. Zones of nighttime decrease in AT appeared in all transformed scenarios, but with smaller values of difference and did not affect the local microclimate significantly. The findings also suggest that the extensive mid-rise developments in green environments with high-rises notably reduced the daytime MRTs through increased shading, but slightly elevated the nighttime MRTs toward the morning, while small-scale densification in low-rise settings primarily raised the nighttime MRTs across the area. Nevertheless, even small increases in nighttime MRTs during the summer are a challenge for sustainability because they hinder the natural cooling process that typically occurs at night. Regarding specific types of open space, higher daytime and lower nighttime ATs occurred in urban canyons and gaps formed by new mid-rise buildings and existing high-rises, and in small-scale open spaces partly-framed by new low-rise structures. Partial framing of large-scale POS in a high-rise setting with new mid-rise building may increase the daytime MRT despite lower ATs. Moreover, the RH patterns vary with structural and surface changes and wind exposure: small low-rise partly-framed open spaces, urban canyons, and gaps exposed to wind showed a higher RH at night and a peak in the morning, open spaces shielded from the wind presented the opposite pattern of distribution, whereas large open spaces with soil surface in high-rise settings maintained increased RH across all timeframes. Finally, the overall trends in the climatic zone examined in this case show that the changes in the microclimatic parameters are more difficult to evaluate in a compact environment with evenly distributed low-rise structures involving multiple small-scale transformations compared with a single mid-rise development or extensive new construction of grouped mid- and low-rise buildings.
In relation to the second research aim, to identify key features of urban design and mitigation strategies that contribute to favorable microclimate in POSs at the local scale, to help guide densification processes in inherited urban settings, the study proposes a few strategies for the sustainable urban design of POS. In POSs partly framed with buildings that are oriented approximately along the north–south axis, more comfortable ATs and MRTs can be attained during the morning and afternoon with new construction on the western edge of that POS, and in the hottest part of the day in developments on the southern POS border due to the effects of shading. New developments and transformations with increased height on the northern brim of POSs could capitalize on more comfortable ATs and MRTs in the morning due to decreased WSs that capture cooler morning air. This strategy is more effective in high-rise settings and settings with structures positioned further apart; partly-framed open spaces of small scale should be avoided as they increase the ATs and MRTs. The use of urban gaps aligned with the dominant wind is favored to enable the nighttime cooling of a POS framed by singular shapes. New construction and an increase in structure height can create more comfortable microclimate conditions in the afternoon, even in urban canyons inclined from the north and laid out against the prevailing wind. The use of trees has been identified as the primary heat mitigation strategy for improving thermal comfort in POSs, particularly in open spaces framed by singular shapes, where enclosing POS with trees improves the microclimate. Preserving existing trees is advised in any parterre transformation that occurs in urban densification. Planting new trees within sparsely vegetated partly-framed POSs, which would enhance the overall microclimate and support the vitality of space, is necessary in urban settings with a dispersed densification of low-rise buildings, and in large-scale spaces with high-rises when the transformations occur on the northern brim of the POS. Vast areas covered with grass are also an important feature of urban design that can decrease the ATs and MRTs at the local level, while fragmented grassy surfaces are not as effective in improving the microclimatic conditions.
To conclude, the research indicates that the process of urban densification requires a comprehensive approach that would also incorporate the review of the microclimatic parameters of thermal comfort. This point gains even more importance when the effects are considered at the larger city scale, as the impact of change in the microclimate of particular sites is amplified by the extent of the transformed urban structure in post-socialist cities such as Niš. Therefore, urban densification must not be a laissez-faire process, and should be carefully guided to create more comfortable, resilient, and sustainable urban environments. To optimize the effectiveness of this study’s findings, it is necessary to transfer the obtained knowledge into actionable strategies for both policymakers and urban planners. This needs to be accomplished through two equally critical approaches: developing comprehensive guidelines for urban planning and design that prioritize thermal comfort and microclimatic considerations, and organizing workshops and training programs for stakeholders to facilitate the practical application of the defined climate-sensitive principles.
The results of this study set good grounds for further research on urban densification as a potential mitigation tool in adapting the residential urban fabric to climate change. It is recommended that future studies should focus on the measured data of summer and winter conditions in densified residential settings. The comparison of ENVI-met results with field studies would provide the validation of the obtained results, which is of particular importance for model improvements in the estimation of WS. Additionally, due to the complexity of urban structure, low-rise urban settings with several small-scale changes scattered throughout the site should be explored in a more detailed study.
Understanding and managing the complexities of urban densification should help to establish the basic principles for limiting the negative impacts of design on urban microclimates and encourage the initial incorporation of climate-responsive principles into urban planning, thus setting the context for more advanced sustainable design practices.

Author Contributions

Conceptualization, M.D.B.; Methodology, M.D.B.; Software, M.D.B.; Validation, M.D.B., M.I., J.Đ. and M.LJ.; Formal analysis, M.D.B. and M.I.; Investigation, M.D.B., M.I., J.Đ. and M.LJ.; Data curation, M.D.B.; Writing—original draft preparation, M.D.B.; Writing—review and editing, M.D.B., M.I., J.Đ. and M.LJ.; Visualization, M.D.B. and M.I. All authors have read and agreed to the published version of the manuscript.

Funding

This research was supported by the Science Fund of the Republic of Serbia, #GRANT No. 7572, Reclaiming Public Open in Residential Areas: Shifting Planning Paradigms and Design Perspectives for a Resilient Urban Future—RePOS.

Institutional Review Board Statement

Not applicable.

Informed Consent Statement

Not applicable.

Data Availability Statement

Data are contained within the article.

Conflicts of Interest

The authors declare no conflicts of interest.

Abbreviations

POS—public open space; H/W ratio—height/width ratio; WS—wind speed; AT—air temperatures; MRT—mean radiant temperatures; RH—relative humidity.

References

  1. Hirt, S. Post-socialist urban forms: Notes from Sofia. Urban Geogr. 2013, 27, 464–488. [Google Scholar] [CrossRef]
  2. Dinić Branković, M.; Bogdanović Protić, I.; Mitković, M.; Đekić, J. Urban densification of the post-socialist city and its implications upon urban structure: A study of Nis, Serbia. In Proceedings of the 5th International Academic Conference on Places and Technologies, Belgrade, Serbia, 26–27 April 2018. [Google Scholar]
  3. Chatzidimitriou, A.; Axarli, K. Street Canyon Geometry Effects on Microclimate and Comfort; A Case Study in Thessaloniki. Procedia Environ. Sci. 2017, 38, 643–650. [Google Scholar] [CrossRef]
  4. Shishegar, N. Street Design and Urban Microclimate: Analyzing the Effects of Street Geometry and Orientation on Airflow and Solar Access in Urban Canyons. J. Clean Energy Technol. 2013, 1, 52–56. [Google Scholar] [CrossRef]
  5. Perini, K.; Magliocco, A. Effects of vegetation, urban density, building height, and atmospheric conditions on local temperatures and thermal comfort. Urban For. Urban Green. 2014, 13, 495–506. [Google Scholar] [CrossRef]
  6. Chatzidimitriou, A.; Yannas, S. Street canyon design and improvement potential for urban open spaces; the influence of canyon aspect ratio and orientation on microclimate and outdoor comfort. Sustain. Cities Soc. 2017, 33, 85–101. [Google Scholar] [CrossRef]
  7. Duarte, D.H.S.; Shinzato, P.; Gusson, C.D.S.; Alves, C.A. The impact of vegetation on urban microclimate to counterbalance built density in a subtropical changing climate. Urban Clim. 2015, 14 Pt 2, 224–239. [Google Scholar] [CrossRef]
  8. Djukic, A.; Vukmirovic, M.; Stankovic, S. Principles of climate sensitive urban design analysis in identification of suitable urban design proposals. Case study: Central zone of Leskovac competition. Energy Build. 2016, 115, 23–35. [Google Scholar] [CrossRef]
  9. Wong, N.H.; Jusuf, S.K.; La Win, A.A.; Thu, H.K.; Negara, T.S.; Wu, X.C. Environmental study of the impact of greenery in an institutional campus in the tropics. Build. Environ. 2007, 42, 2949–2970. [Google Scholar] [CrossRef]
  10. Emmanuel, R.; Rosenlund, H.; Johansson, E. Urban shading—A design option for the tropics? A study in Colombo, Sri Lanka. Int. J. Climatol. 2007, 27, 1995–2004. [Google Scholar] [CrossRef]
  11. Qaid, A.; Ossen, D.R. Effect of asymmetrical street aspect ratios on microclimates in hot, humid regions. Int. J. Biometeorol. 2015, 59, 657–677. [Google Scholar] [CrossRef]
  12. Deng, J.Y.; Wong, N.H. Impact of urban canyon geometries on outdoor thermal comfort in central business districts. Sustain. Cities Soc. 2020, 53, 101966. [Google Scholar] [CrossRef]
  13. Ali-Toudert, F.; Mayer, H. Effects of asymmetry, galleries, overhanging façades and vegetation on thermal comfort in urban street canyons. Sol. Energy 2007, 81, 742–754. [Google Scholar] [CrossRef]
  14. Taleghani, M.; Tenpierik, M.; Dobbelsteen, A.; Sailor, D.J. Heat in courtyards: A validated and calibrated parametric study of heat mitigation strategies for urban courtyards in the Netherlands. Sol. Energy 2014, 103, 108–124. [Google Scholar] [CrossRef]
  15. Forouzandeh, A. Numerical modeling validation for the microclimate thermal condition of semi-closed courtyard spaces between buildings. Sustain. Cities Soc. 2018, 36, 327–345. [Google Scholar] [CrossRef]
  16. Shareef, S.; Abu-Hijleh, B. The effect of building height diversity on outdoor microclimate conditions in hot climate. A case study of Dubai-UAE. Urban Clim. 2020, 32, 100611. [Google Scholar] [CrossRef]
  17. Sözen, İ.; Oral, G.K. Outdoor thermal comfort in urban canyon and courtyard in hot arid climate: A parametric study based on the vernacular settlement of Mardin. Sustain. Cities Soc. 2019, 48, 101398. [Google Scholar] [CrossRef]
  18. Chatzidimitriou, A.; Yannas, S. Microclimate design for open spaces: Ranking urban design effects on pedestrian thermal comfort in summer. Sustain. Cities Soc. 2016, 26, 27–47. [Google Scholar] [CrossRef]
  19. Song, B.; Park, K. Contribution of Greening and High-Albedo Coatings to Improvements in the Thermal Environment in Complex Urban Areas. Adv. Meteorol. 2015, 2015, 792172. [Google Scholar] [CrossRef]
  20. Taleghani, M.; Kleerekoper, L.; Tenpierik, M.; Dobbelsteen, A. Outdoor thermal comfort within five different urban forms in the Netherlands. Build. Environ. 2015, 83, 65–78. [Google Scholar] [CrossRef]
  21. Ketterer, C.; Matzarakis, A. Human-biometeorological assessment of heat stress reduction by replanning measures in Stuttgart, Germany. Landsc. Urban Plan. 2014, 122, 78–88. [Google Scholar] [CrossRef]
  22. Wolfgang, L.; Vuckovic, M.; Etminan, G.; Ratheiser, M.; Tschannett, S.; Österreicher, D. Effects of Densification on Urban Microclimate—A Case Study for the City of Vienna. Atmosphere 2021, 12, 511. [Google Scholar] [CrossRef]
  23. ENVI-Met. Available online: https://envi-met.com/ (accessed on 4 November 2024).
  24. Acero, J.A.; Arrizabalaga, J. Evaluating the performance of ENVI-met model in diurnal cycles for different meteorological conditions. Theor. Appl. Climatol. 2018, 131, 455–469. [Google Scholar] [CrossRef]
  25. Ali-Toudert, F.; Mayer, H. Numerical study on the effects of aspect ratio and orientation of an urban street canyon on outdoor thermal comfort in hot and dry climate. Build. Environ. 2006, 41, 94–108. [Google Scholar] [CrossRef]
  26. Dinić-Branković, M.; Igić, M.; Đekić, J.; Mitković, M. Impact of post-socialist vertical extensions of buildings on outdoor microclimate in collective housing areas: A study of Niš, Serbia. Energy Build. 2022, 265, 112081. [Google Scholar] [CrossRef]
  27. Morakinyo, T.E.; Lam, Y.F. Simulation study on the impact of tree-configuration, planting pattern and wind condition on street-canyon’s micro-climate and thermal comfort. Build. Environ. 2016, 103, 262–275. [Google Scholar] [CrossRef]
  28. Middel, A.; Chhetri, N.; Quay, R. Urban forestry and cool roofs: Assessment of heat mitigation strategies in Phoenix residential neighborhoods. Urban For. Urban Green. 2015, 14, 178–186. [Google Scholar] [CrossRef]
  29. Djekic, J.; Djukic, A.; Vukmirovic, M.; Djekic, P.; Dinic Brankovic, M. Thermal comfort of pedestrian spaces and the influence of pavement materials on warming up during summer. Energy Build. 2018, 159, 474–485. [Google Scholar] [CrossRef]
  30. Cortesão, J.; Brandão Alves, F.; Corvacho, H.; Rocha, C. Retrofitting public spaces for thermal comfort and sustainability. Indoor Built. Environ. 2016, 25, 1085–1095. [Google Scholar] [CrossRef]
  31. Emmanuel, R.; Fernando, H.J.S. Urban heat islands in humid and arid climates: Role of urban form and thermal properties in Colombo, Sri Lanka and Phoenix, USA. Clim. Res. 2007, 34, 241–251. [Google Scholar] [CrossRef]
  32. Lindberg, F.; Thorson, S.; Rayner, D.; Lau, K. The impact of urban planning strategies on heat stress in a climate-change perspective. Sustain. Cities Soc. 2016, 25, 1–12. [Google Scholar] [CrossRef]
  33. Stathopoulos, T.; Wu, H.; Zacharias, J. Outdoor human comfort in an urban climate. Build. Environ. 2004, 39, 297–305. [Google Scholar] [CrossRef]
  34. Givoni, B.; Noguchi, M.; Saaroni, H.; Pochter, O.; Yaacov, Y.; Feller, N.; Becker, S. Outdoor comfort research issues. Energy Build. 2003, 35, 77–86. [Google Scholar] [CrossRef]
  35. Huang, J.; Cedeno-Laurent, J.G.; Spengler, J.D. CityComfort+: A simulation-based method for predicting mean radiant temperature in dense urban areas. Build. Environ. 2014, 80, 84–95. [Google Scholar] [CrossRef]
  36. Gál, C.V.; Kántor, N. Modeling mean radiant temperature in outdoor spaces, A comparative numerical simulation and validation study. Urban Clim. 2020, 32, 100571. [Google Scholar] [CrossRef]
  37. Jin, L.; Zhang, Y.; Zhang, Z. Human responses to high humidity in elevated temperatures for people in hot-humid climates. Build. Environ. 2017, 114, 257–266. [Google Scholar] [CrossRef]
  38. Nunez, M.; Oke, T.R. The energy balance of an urban canyon. J. Appl. Meteorol. 1977, 16, 11–19. [Google Scholar] [CrossRef]
  39. Todhunter, P.E. Microclimatic variations attributable to urban-canyon asymmetry and orientation. Phys. Geogr. 1990, 11, 131–141. [Google Scholar] [CrossRef]
  40. Mandić, L.; Đjukić, A.; Marić, J.; Mitrović, B. A Systematic Review of Outdoor Thermal Comfort Studies for the Urban (Re)Design of City Squares. Sustainability 2024, 16, 4920. [Google Scholar] [CrossRef]
  41. Đekić, J.; Mitković, P.; Dinić Branković, M.; Igić, M.; Đekić, P.; Mitković, M. The study of effects of greenery on temperature reduction in urban areas. Therm. Sci. 2018, 22, 988–1000. [Google Scholar] [CrossRef]
  42. Lee, H.; Holst, J.; Mayer, H. Modification of Human-Biometeorologically Significant Radiant Flux Densities by Shading as Local Method to Mitigate Heat Stress in Summer within Urban Street Canyons. Adv. Meteorol. 2013, 2013, 312572. [Google Scholar] [CrossRef]
  43. Coutts, A.M.; White, E.C.; Tapper, N.J.; Beringer, J.; Livesley, S.J. Temperature and human thermal comfort effects of street trees across three contrasting street canyon environments. Theor. Appl. Climatol. 2016, 124, 55–68. [Google Scholar] [CrossRef]
  44. Souch, C.A.; Souch, C. The effect of trees on summertime below canopy urban climates: A case study Bloomington, Indiana. J. Arboric. 1993, 19, 303–312. [Google Scholar] [CrossRef]
  45. Park, M.; Hagishima, A.; Tanimoto, J.; Narita, K. Effect of urban vegetation on outdoor thermal environment: Field measurement at a scale model site. Build. Environ. 2012, 56, 38–46. [Google Scholar] [CrossRef]
  46. Republic Hydrometeorological Service of Serbia. Meteorological Yearbook—Climatological Data 2021; Republic Hydrometeorological Service of Serbia: Belgrade, Serbia, 2022. Available online: http://www.hidmet.gov.rs/latin/meteorologija/klimatologija_godisnjaci.php (accessed on 4 May 2023).
  47. Brozovsky, J.; Corio, S.; Gaitani, N.; Gustavsen, A. Evaluation of sustainable strategies and design solutions at high-latitude urban settlements to enhance outdoor thermal comfort. Energy Build. 2021, 244, 111037. [Google Scholar] [CrossRef]
  48. Statistical Office of the Republic of Serbia. 2022 Census of Population, Households and Dwellings—Age and Sex; Statistical Office of the Republic of Serbia: Belgrade, Serbia, 2023. Available online: https://publikacije.stat.gov.rs/G2023/pdf/G20234003.pdf (accessed on 4 May 2023).
  49. Steemers, K.; Baker, N.; Crowther, D.; Dubiel, J.; Nikolopoulou, M. Radiation absorption and urban texture. Build. Res. Inform. 1998, 26, 103–112. [Google Scholar] [CrossRef]
Scheme 1. Research workflow. Drawing by Milena Dinić Branković.
Sustainability 17 01573 sch001
Figure 1. Urban area of Niš with the position of the selected sites 1–3 and meteorological station.
Sustainability 17 01573 g001
Figure 2. Study areas with site plan analysis. Drawings by Milena Dinić Branković.
Sustainability 17 01573 g002
Figure 3. Study areas in the ENVI-met models.
Sustainability 17 01573 g003
Figure 4. Difference in direct sw radiation and direct sw radiation in Site 1 at the key hours.
Sustainability 17 01573 g004
Figure 5. Difference in direct sw radiation and direct sw radiation in Site 2 at key hours.
Sustainability 17 01573 g005
Figure 6. Difference in direct sw radiation and direct sw radiation in Site 3 at key hours.
Sustainability 17 01573 g006
Figure 7. Absolute difference in the various parameters in Site 1 at key hours.
Sustainability 17 01573 g007
Figure 8. Absolute difference in the various parameters in Site 2 at key hours.
Sustainability 17 01573 g008
Figure 9. Absolute difference in the various parameters in Site 3 at key hours.
Sustainability 17 01573 g009
Figure 10. Minimum and maximum values of the absolute difference in WS between the two scenarios.
Sustainability 17 01573 g010
Figure 11. Minimum and maximum values of the absolute difference in ATs between the two scenarios.
Sustainability 17 01573 g011
Figure 12. Minimum and maximum values of the absolute difference in MRTs between the two scenarios.
Sustainability 17 01573 g012
Figure 13. Minimum and maximum values of the absolute difference in RH between the two scenarios.
Sustainability 17 01573 g013
Table 1. Data applied in the models in both scenarios across the three study areas.
Building’s materialsWall materialDefault wall—moderate insulation
Flat roof materialDefault wall—moderate insulation
Sloped roof material Default wall—moderate insulation
Open space materialsPedestrian spacesPG concrete pavement grey
Large-scale public open spaceDefault unsealed soil (sandy loam)
Parking lotsPL concrete pavement light
StreetsST asphalt road
GreenerySimple plants—grass in plots Grass 50 cm average dense
Simple plants—grass in other open spaceGrass 50 cm average dense
Simple plants—hedgeHedge dense 2 m
3D plantsTilia Cordata, Acer Campestre, Betula Pendula, Cypress
Disclaimer/Publisher’s Note: The statements, opinions and data contained in all publications are solely those of the individual author(s) and contributor(s) and not of MDPI and/or the editor(s). MDPI and/or the editor(s) disclaim responsibility for any injury to people or property resulting from any ideas, methods, instructions or products referred to in the content.

