Article

Testing Different Fertility Treatment Regimes on Ontario-Grown Hazelnuts: Results from 3 Years of On-Farm Trials

1
Ontario Ministry of Agriculture, Food and Agribusiness (OMAFA), Guelph, ON N1G 4Y2, Canada
2
Former Employee of Ontario Ministry of Agriculture, Food and Agribusiness (OMAFA), Guelph, ON N1G 4Y2, Canada
*
Author to whom correspondence should be addressed.
Sustainability 2025, 17(4), 1543; https://doi.org/10.3390/su17041543
Submission received: 21 January 2025 / Revised: 5 February 2025 / Accepted: 11 February 2025 / Published: 13 February 2025
(This article belongs to the Special Issue Sustainable Crop Production and Agricultural Practices)

Abstract

:
Commercial hazelnut (Corylus avellana L.) production is relatively new to Ontario and there are no Ontario-specific fertility recommendations for this crop. With the increasing numbers of hazelnut growers entering the industry and the number of acres coming into full production capacity, this was identified as a gap. A 3-year trial was conducted to look at how four different fertility treatment regimes impact hazelnut growth and yield: (1) Ontario’s guidelines for established tree fruits, (2) Modified Oregon’s guidelines for hazelnuts, (3) Grower’s management, and (4) Control (with no external fertilizers). Four pilot demonstration sites were also established to compare fertilized plots (e.g., Ontario’s guidelines for established tree fruits) with orchard-specific grower’s management. Location-specific soil and tissue tests were conducted to determine the amount of fertilizer to apply to each orchard. Hazelnut yields and economic returns varied with location, tree age, and market price of hazelnuts; however, fertilized treatment (e.g., Ontario’s guidelines for established tree fruits) outperformed the grower’s management by up to 75 percent with net economic returns of CAD 18–44 per tree. In the orchard where all four fertility treatments were compared, yields and economic returns from modified Oregon treatment and Ontario recommendation were not statistically different. However, they outperformed grower’s management by 44 and 42 percent, respectively. Modified Oregon and Ontario treatment yielded ~7.0 pounds (lb) per tree with a net economic return of CAD 27 per tree during the 3rd year of study, while grower’s management and control treatments yielded 4.8 and 4.0 lb per tree with net economic returns of CAD 19 and 16 per tree, respectively. Also, fertilized treatments showed higher levels of residual nutrients of N, P, and K in the soil and the leaf tissues. The project results supported that Ontario’s fertility guidelines for established tree fruits can be used for commercial hazelnut production on mineral soils in Ontario. Also, testing soils every three years or plant tissues every year could help match applied nutrients more closely with plant demand, thereby enhancing economical and ecological sustainability.

1. Introduction

Hazelnuts (Corylus avellana L.), which are sometimes called filberts, are enjoyed by many Canadian consumers, especially in the form of Nutella or Ferrero Rocher chocolates [1]. Though both products are produced in Ontario, most of the hazelnuts used in these products come from across the Atlantic Ocean, mostly from Turkey.
Turkey is the first world hazelnut producer, producing over 500,000 tonnes of hazelnuts, covering 70 percent and 82 percent of the world’s production and export, respectively, followed by Italy with nearly 20 percent in production and 15 percent in export [2]. North America produces only about 5 percent of the world’s hazelnuts (i.e., about 25,000 t), with 99 percent of those coming from Oregon, United States [3].
Hazelnut is relatively a new crop to Ontario, Canada. There were about only 500 acres of hazelnut trees in the province in 2017 which was expected to expand to 25,000 acres of hazelnut trees by 2027 [4]. The hazelnut industry in the province traces its roots back to 2007 when a hazelnut processing plant was established and now imports about 14,000 tonnes of shelled hazelnuts annually, stimulating interest in growing hazelnuts by Ontario farmers [1,4]. Typically, growers plant one- to two-year-old trees with the first crop harvested when the trees reach age four. The trees hit top production at age 8 to 10 with yields reaching about 2000 lb per acre [3,5]. Farm gate prices usually run in the neighborhood of CAD 2 to 4 per lb [5].
Despite the increasing numbers of hazelnut growers entering the industry and the number of acres coming into full production capacity, there are no Ontario-specific fertility recommendations for this crop [6]. Growers currently rely on a mix of Ontario tree fruit guidelines and recommendations from Oregon, which differs significantly in soil and climate, as well as recommendations from private soil testing labs [5]. While this has been successful for some who have had previous tree crop experience, it has caused others to lose seedlings to overfertilization.
A viable hazelnut industry in Ontario would provide an alternative energy and food crop to help farmers diversify economically while enhancing ecological sustainability. However, the ecological benefits of growing hazelnuts could be undermined if inappropriate fertilization practices are used, leading to nutrient pollution [7]. It was, therefore, essential to develop Ontario-specific fertility recommendations as more acres are coming into full production in the next few years. The main objective of this study, therefore, was to help develop Ontario’s guidelines for hazelnuts focusing on soil application of primary nutrients (e.g., Nitrogen, Phosphorus, and Potassium) by looking at how different fertility treatments impact hazelnut yield and economic returns on mineral soils in Ontario.

2. Materials and Methods

2.1. Study Site, Climate, and Soil Description

This study was conducted in four orchards across South-Western Ontario, Canada, for three growing seasons from 2022 to 2024 (Table 1, Figure 1). The experimental sites were located between 42°49′35″ N and 43°16′12″ N and 79°21′5″ W to 80°38′40″ W at altitudes between 90 and 300 m above sea level (masl) (Table 1). Research was conducted on farmers’ fields under natural climatic conditions.
Baseline soil samples were collected from two soil depths (0–20 and 20–60 cm) from each orchard in the spring of 2022 and analyzed using accredited extraction methods for Ontario soils: pH (saturated paste), soil organic matter (% Loss-on-ignition, LOI), NO3-N (Cadmium Reduction), available P (Olsen P), and available K (ammonium acetate extraction) [8]. The soils from 0 to 20 cm depth were moderate to well-drained sandy clay to black loam with low to moderate fertility (Table 1). The soil pH ranged between 5.4 and 7.3, organic matter between 3.1 and 4.3%, Nitrate-N between 4 and 12 ppm, Olsen P between 11 and 59 ppm, and K between 101 and 205 ppm (Table 1). However, the results from 20 to 60 cm depth did not differ between sites. Additional soil and tissue samples were taken after each growing season to determine the rate of Nitrogen, Phosphate (P2O5), and Potassium (K2O) fertilizers for subsequent seasons. Also, post-trial soil samples were collected after three years to determine changes in fertility levels from the baselines in each orchard.
Climatic data for the experiment were collected from a regional weather station located at or nearby the research site (Table 2). Monthly mean temperature during growing season (May–September) over the three years ranged between 12.9 and 21.4 °C in Orchard 1 and 3, 12.8 and 21.2 °C in Orchard 2, and 12.7 and 22.4 °C in Orchard 4 with the warmest days in July and August at all sites (Table 2). All the research sites received more precipitation in year 3 (i.e., 2024) with the seasonal total ranging between 340 and 445 millimetres (mm) (Table 2). Orchard 2 received more precipitation (a total of 1170 mm over the three growing seasons) compared to other orchards (Table 2).

2.2. Experimental Details

Yamhill, one of the commercial varieties of European hazelnuts, was chosen for its relative ability to resist Eastern Filbert Blight (EFB), a devastating disease caused by the fungus Anisogramma anomala. This variety is also known for its relative cold hardiness along with attractive, compact growth habit, and good crops of delicious nuts [3,5].
The trials consisted of two components: (1) Four pilot demonstrations to compare fertilized plots (e.g., Ontario’s guidelines for established tree fruits) with orchard-specific grower’s managements; and (2) One fully replicated experiment with 4 treatment regimes: (a) Ontario’s guidelines for established tree fruits, (b) Modified Oregon’s guidelines for hazelnuts, (c) Grower’s management, and (d) Control (with no external fertilizers) (Table 3) [3,5,8]. Modified Oregon treatment refers to the modified version of Oregon’s guidelines by adapting phosphorus guidelines from Ontario [3,8].
Two rows of hazelnut trees, with 10 trees on each row, were selected in each orchard for pilot plot demonstrations where one row received fertilized treatment and the other receiving site-specific grower’s management. On the other hand, a fully replicated trial consisted of 4 treatments in 5 replications with 10 trees in each replicate. Location-specific soil and tissue analysis were conducted according to OMAFA’s guidelines [10] to determine the amount of primary nutrients (e.g., NPK) to apply to each orchard in fertilized treatments (Table 3). Application rates were slightly adjusted for modified Oregon’s treatment according to the results of leaf tissue analysis and growth response of the orchard (Table 4). Nitrogen was supplied as Ammonium Sulphate (21-0-0, AS), phosphorus through Mono-Ammonium Phosphate (11-52-0, MAP), and potassium was primarily supplied through Sulphate of Potash/Potassium Sulphate (0-0-51, SOP). The required amount of these fertilizers was calculated, mixed, and banded around each tree under the drip line: 45cm away from the trunk in mid-May (Figure 2). Orchards did not receive any dry fertilizers in the spring/summer of 2024 as the NPK levels in the soil and plant tissues were above the threshold values required to produce hazelnuts commercially on mineral soils of Ontario [8]. Other than the fertilizer treatments, trees were managed similarly (e.g., fungicide application, sucker management/pruning, weed management, etc.) between fertilized treatment and grower’s management in each site.

2.3. Data Collection and Analysis

Trees were observed for symptoms of deficiency or toxicity, diseases, pest, etc., throughout the season. All the trees were harvested three times, at a weekly interval in September, when the nuts were straw-colored and naturally dropped on the ground floor, using the roller. Moisture content in hazelnuts was 16–25 percent when harvested. Therefore, in-shell hazelnuts were processed and dried to a moisture content of around 10 percent prior to collecting yield data [3,5].
Data were recorded for nut yields, kernel to shell ratios (kernel weight: shell weight), percent of blank and decayed nuts, net potential economic returns, and residual nutrients. Gross potential economic return was calculated using the farm gate price of the processed nuts while the net potential economic return was calculated as a gross potential economic return less associated expenses (e.g., fertilizers and labor involved in fertilizer applications).
The data were analyzed using GraphPad Prism 10 software (GraphPad Software, Inc., Boston, MA, USA). Paired t-tests were performed on individual orchard data to analyze the effects of specific treatments (i.e., fertilized vs. grower’s management) in each specific year and location. However, two-way Analysis of Variance (ANOVA) was performed to test the main effects (i.e., treatment and year) and their interactions from replicated trials. The linear correlation and the coefficient of determination were also run between selected parameters using the Pearson Correlation Coefficient (PCC).

3. Results and Discussion

3.1. Replicated Trials
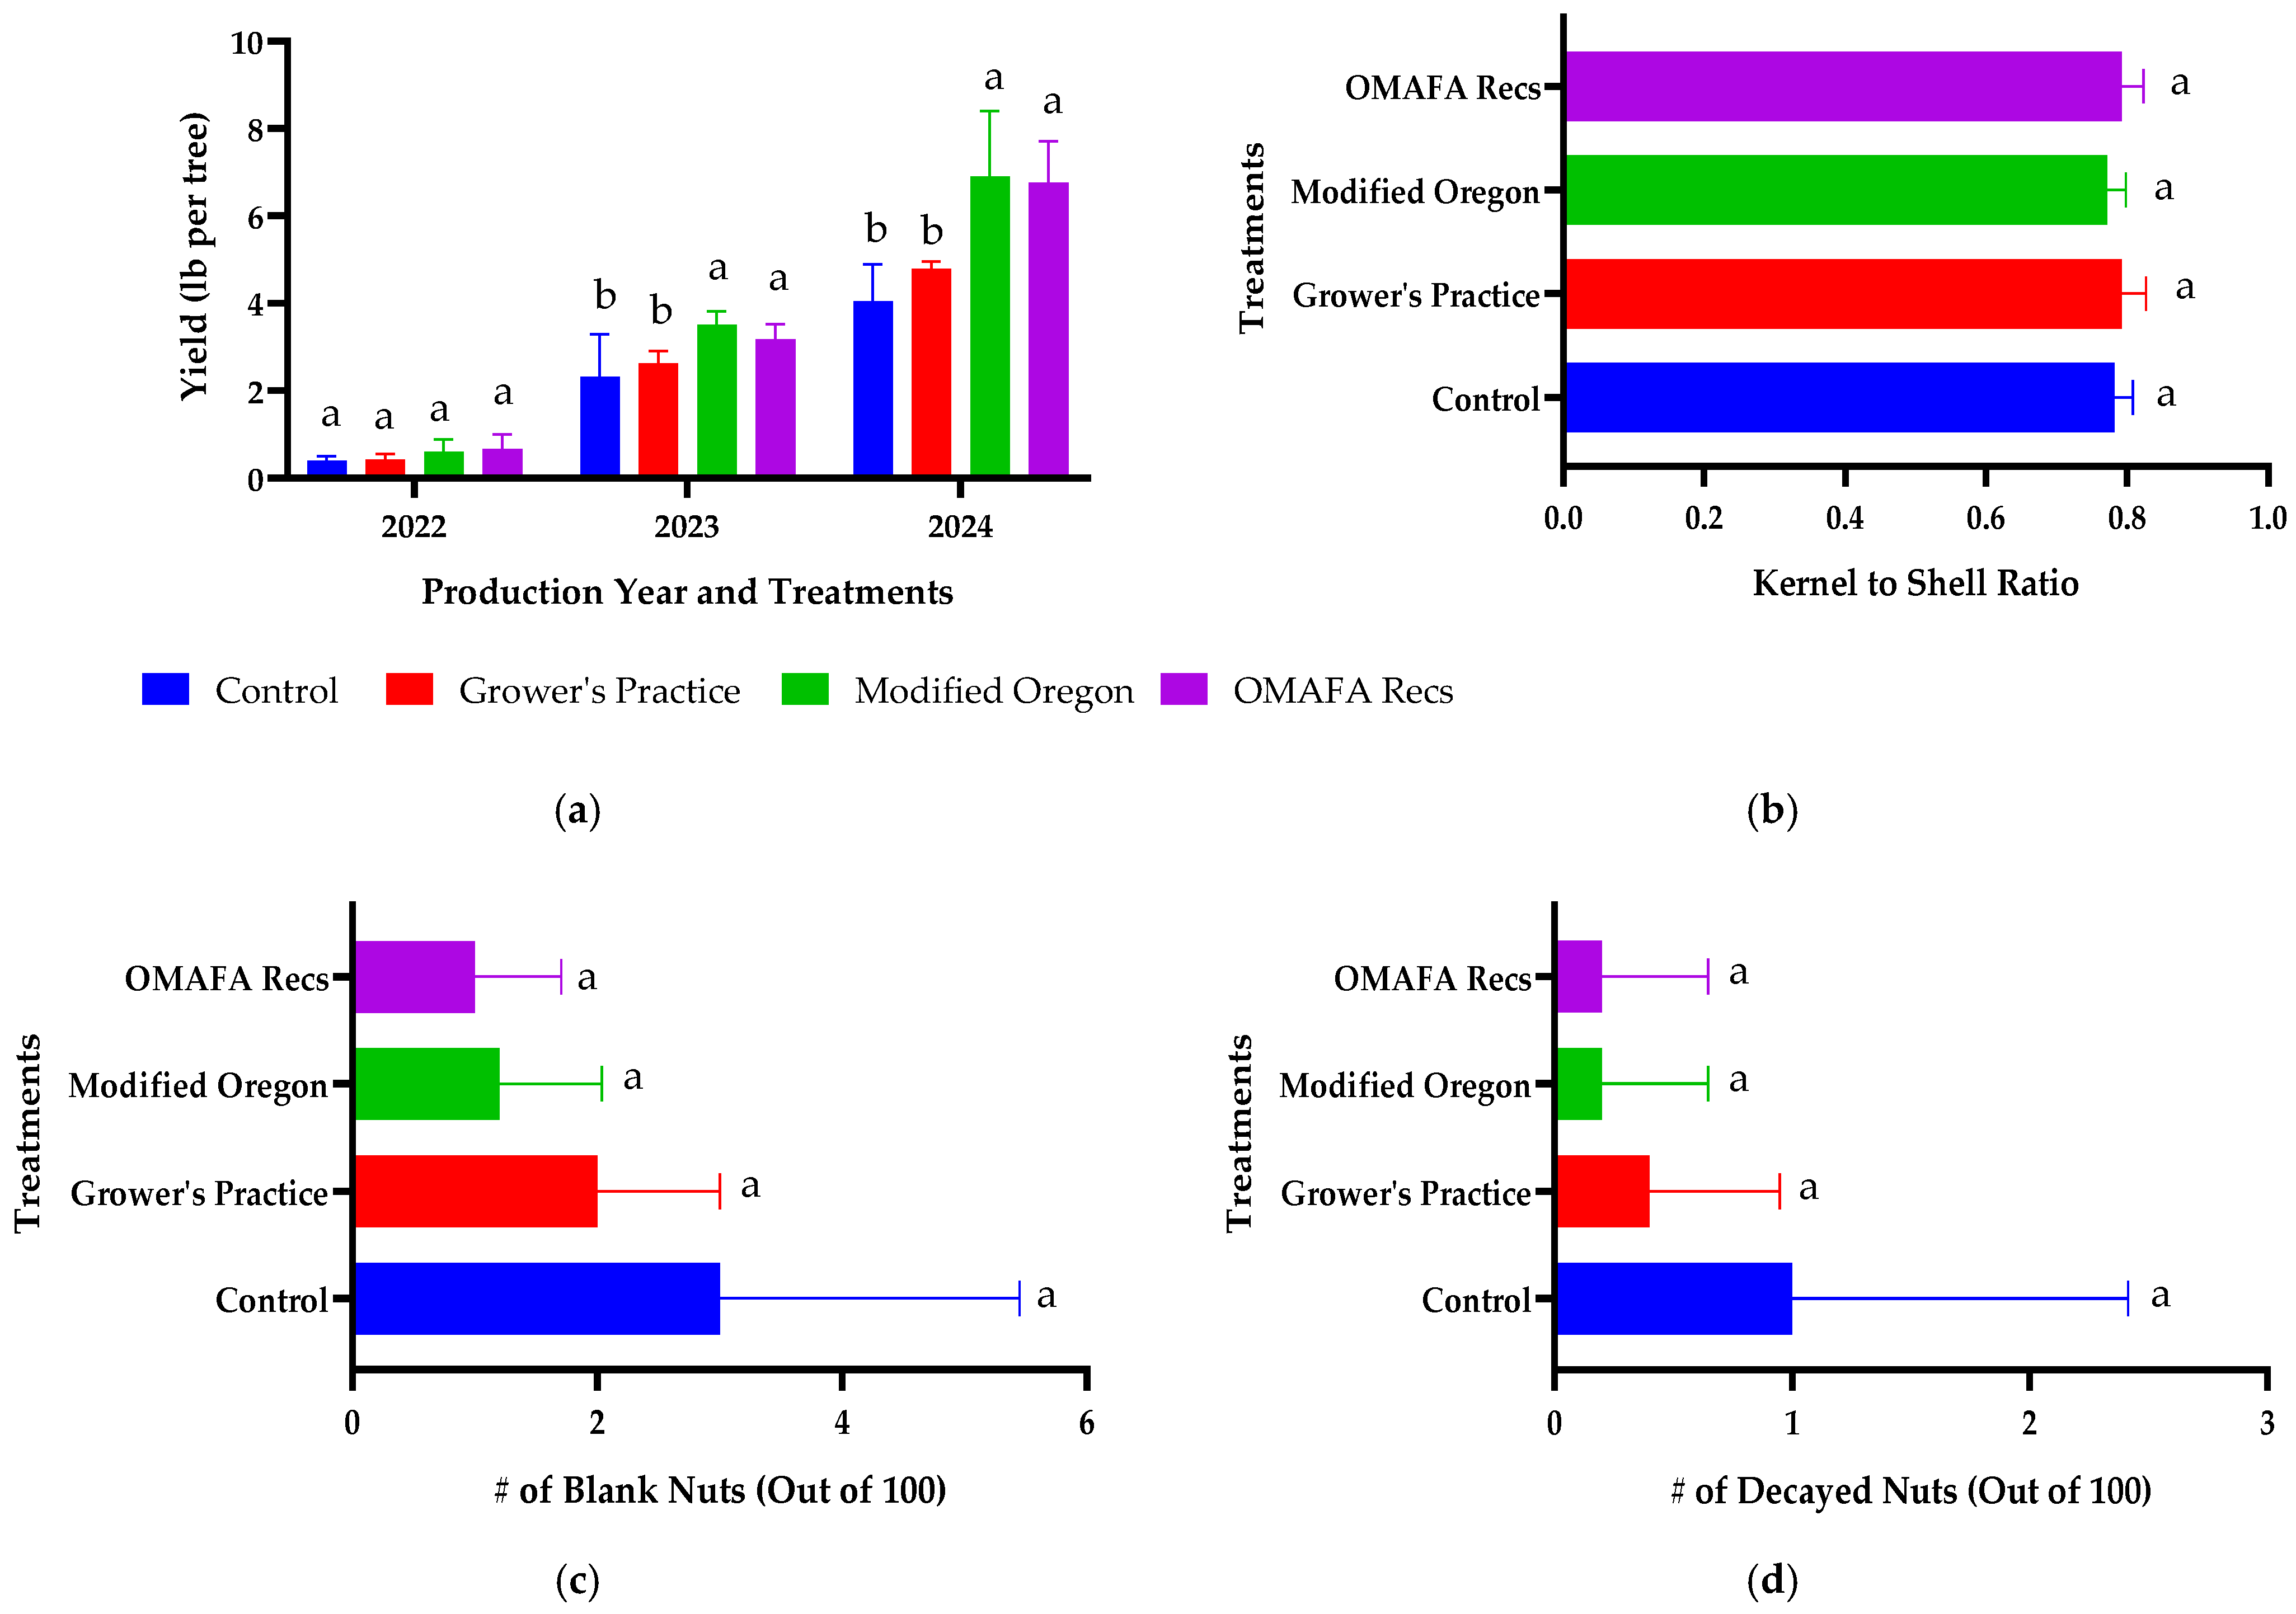
Hazelnut yield: Yield differed between production years and fertilizer treatments (Figure 3a). Fertilized treatments outperformed grower’s management across production years. Modified Oregon treatment yielded 44 percent higher than grower’s management (e.g., 6.9 vs. 4.8 lb per tree, giving a total of 1856 and 1290 lb per acre, respectively), while it yielded 70 percent higher than control treatment (e.g., 6.9 vs. 4.0 lb per tree, giving a total of 1856 and 1087 lb per acre, respectively). Similarly, Ontario treatment yielded 42 percent higher than grower’s management (e.g., 6.8 vs. 4.8 lb per tree, giving a total of 1830 and 1290 lb per acre, respectively), while it yielded 68 percent higher than control treatment (e.g., 6.8 vs. 4.0 lb per tree, giving a total of 1830 and 1087 lb per acre, respectively) (Figure 3a). Yield between modified Oregon and Ontario treatments were not statistically different.
The highest yield was recorded in year 3, perhaps due to the age of tree (i.e., 6 years). The trial was started when those trees just started bearing the nuts (i.e., 4 years old) and the yield gradually increased over the years.
Nut parameters: Kernel to shell ratios were not affected by fertilizer treatments (Figure 3b). Fertilized plots (Ontario and Modified Oregon), however, demonstrated relatively fewer blanks and molded nuts; thereby increasing 100-nut yields (Figure 3c–e). The difference, however, was not statistically different. The percentage of defects including molded, decayed, and insect damaged did not exceed 5 percent thereby maintaining both kernel quality and marketable yield. Kernel Mold could reduce quality and marketable yield since processors will not accept nuts as U.S. No. 1 if the percentage of defects exceeds 5 percent [5].
Potential economic returns: Potential returns vary according to the nut price. Modified Oregon and Ontario treatment gave a potential net economic return of CAD 27 per tree during the 3rd year of the study, while the grower’s management and control treatments provided net economic returns of CAD 19 and 16 per tree, respectively, assuming that the nut price was CAD 4 per lb (Figure 3f). The additional cost of fertilizer treatments (e.g., cost of fertilizers and labor) involved CAD 2.30 for modified Oregon, CAD 1.30 for Ontario treatment, and CAD 0.40 for grower’s foliar fertilizer program, per tree.
Figure 3. Production data from replicated trials: (a) Hazelnut yields as affected by fertilizer treatments and production years; (b) kernel to shell ratio as affected by fertilizer treatments; (c) number of blank nuts as affected by fertilizer treatments; (d) number of decayed/molded nuts as affected by fertilizer treatments; (e) 100-nut yield as affected by fertilizer treatments; and (f) potential net economic returns as affected by fertilizer treatment and production years (tree age). Letters in the bar chart plots indicate statistical significance.
Sustainability 17 01543 g003aSustainability 17 01543 g003b

3.2. Pilot Demonstration

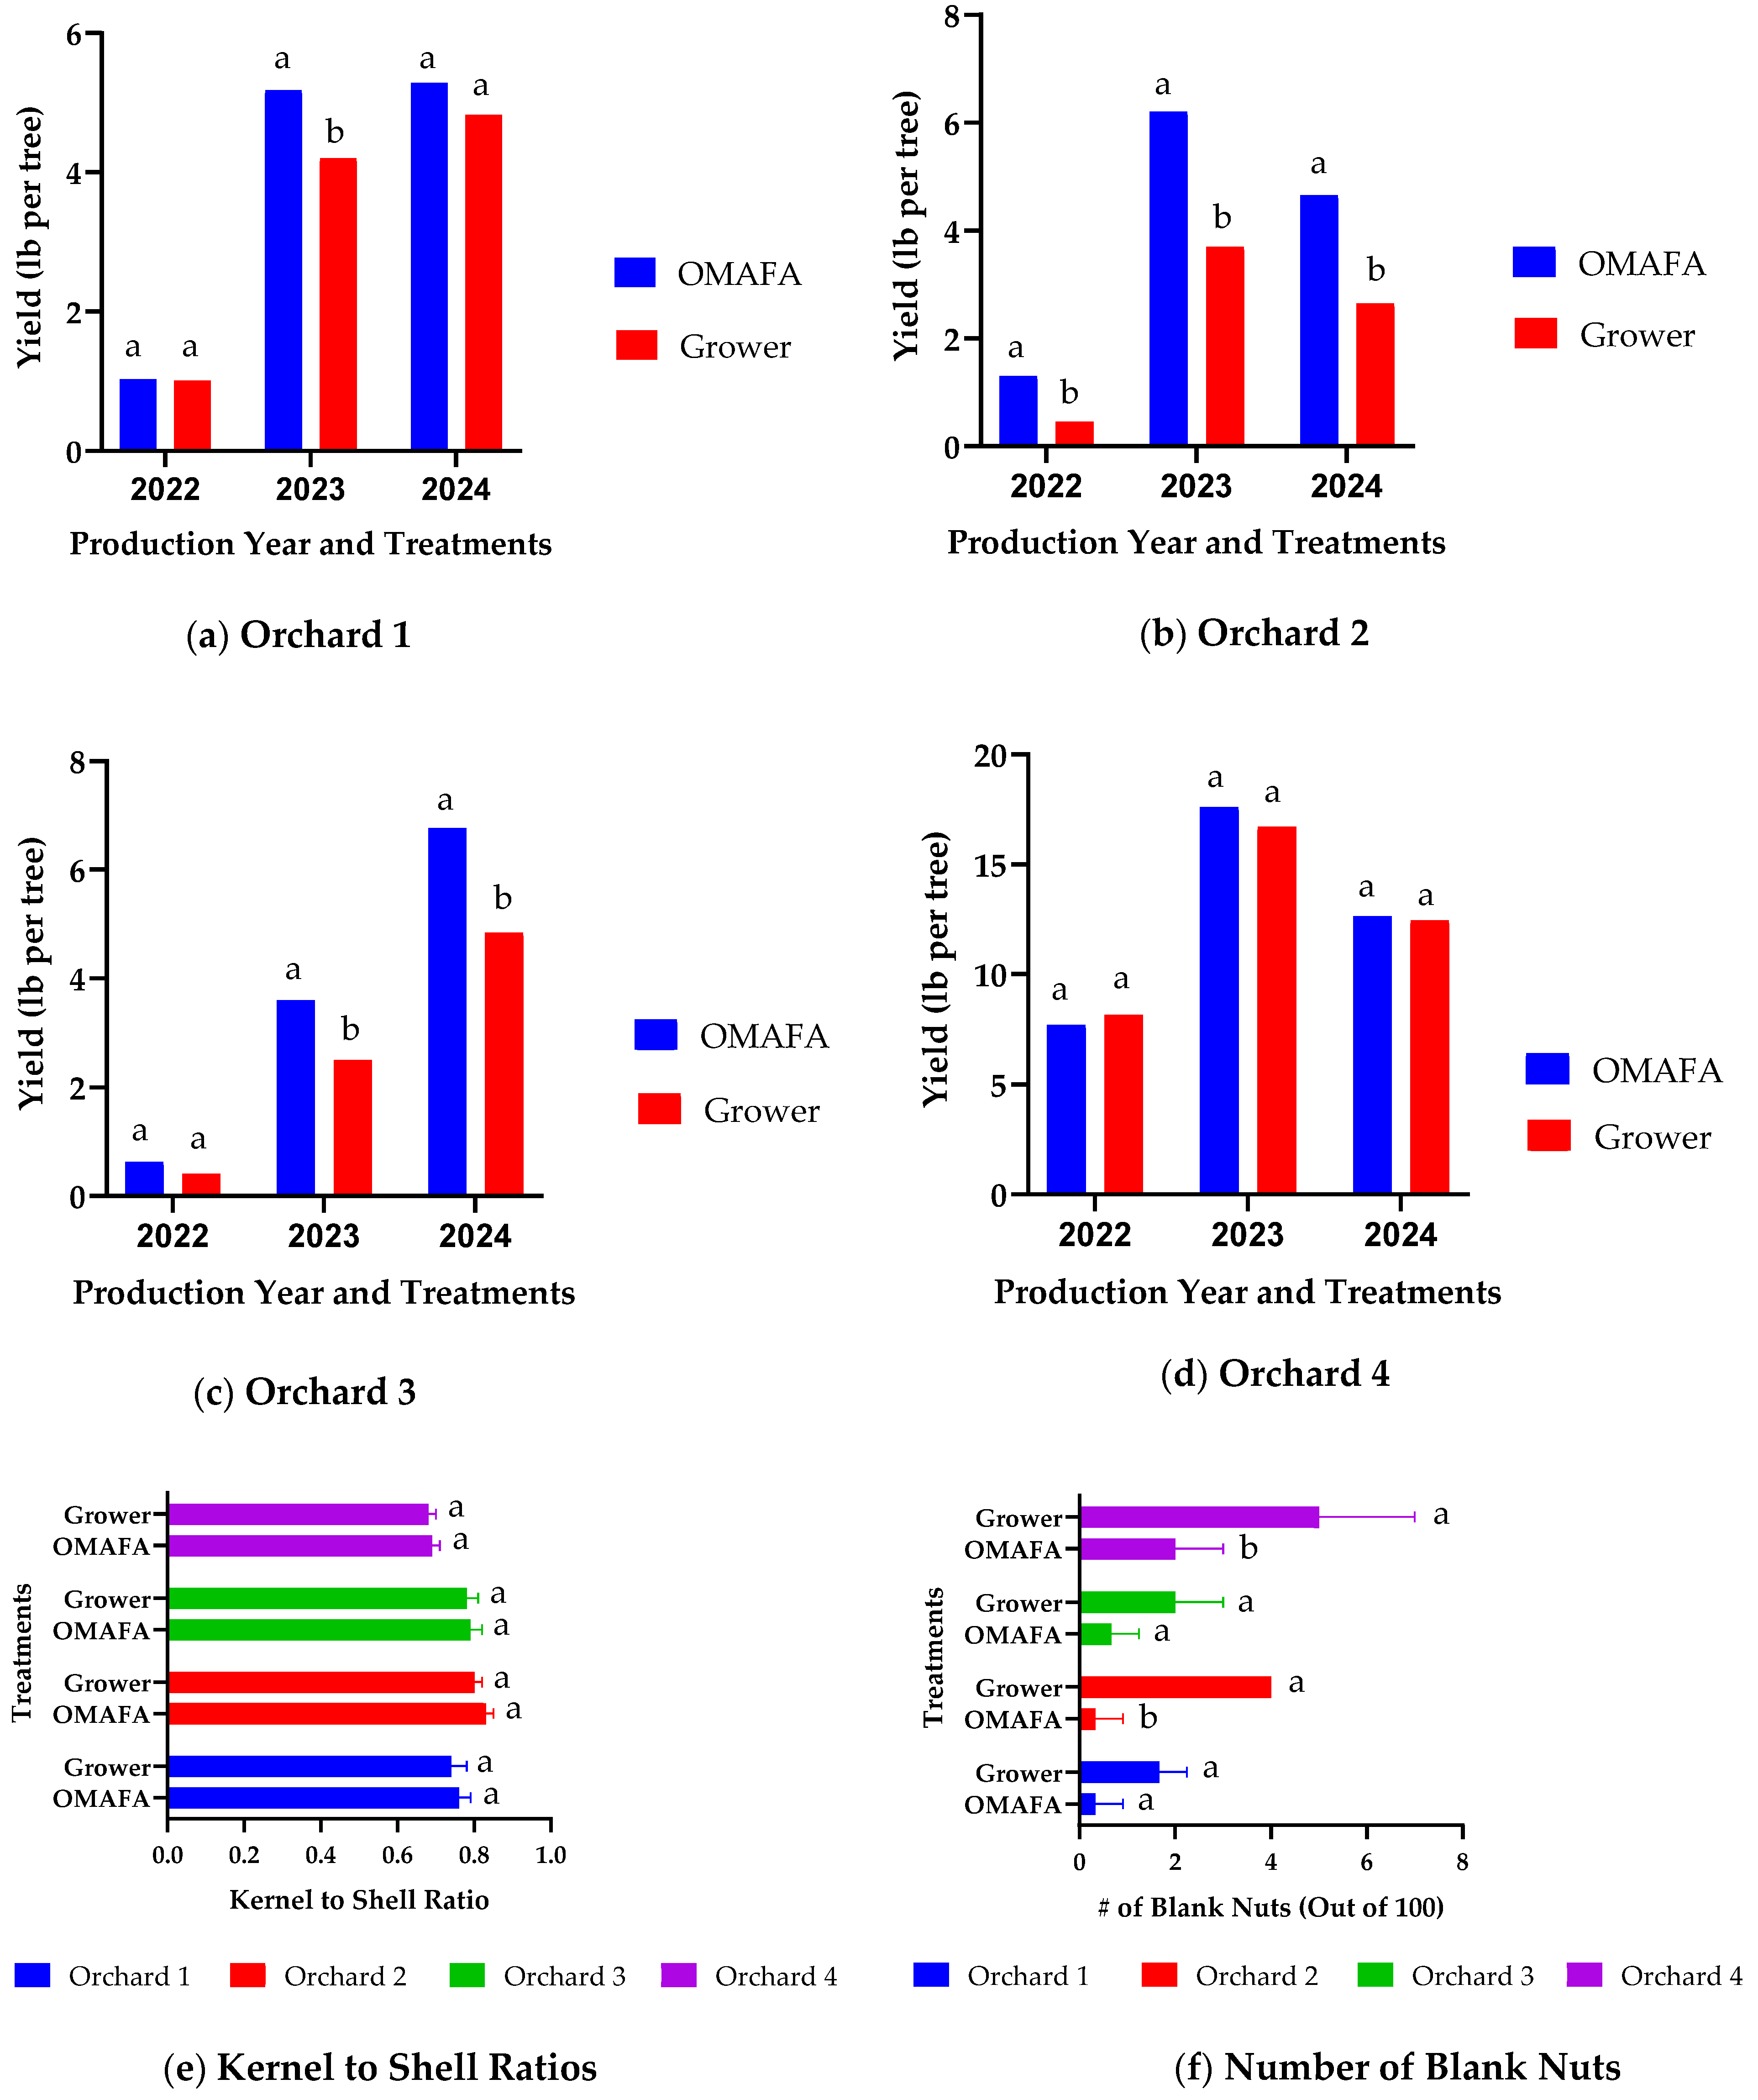
Hazelnut yield: Yield differed between orchards, production years, and treatments (Figure 4a–d). Fertilized trees outperformed grower’s management across the orchards and production years. In year 3, fertilized trees yielded 10 percent higher than grower’s management in Orchard 1 (e.g., 5.3 vs. 4.8 lb per tree giving a total of 1705 vs. 1557 lb per acre; Figure 4a), 75 percent higher in Orchard 2 (e.g., 4.7 vs. 2.7 lb per tree giving a total of 1250 vs. 713 lb per acre; Figure 4b), 42 percent higher in Orchard 3 (e.g., 6.8 vs. 4.8 lb per tree giving a total of 1830 vs. 1290 lb per acre; Figure 4c), and only about 2 percent higher in Orchard 4 (e.g., 12.6 vs. 12.4 lb per tree that were equivalent to 1898 vs. 1860 lb per acre, Figure 4d). The difference between orchards could be associated with the age of the trees (e.g., 6 to 12 years) and site-specific grower’s fertility management program (Table 3). The first crop could be harvested when the trees reach age 4, but the trees could hit top production at age 8 to 10 with yields reaching about 2000 lb per acre [3].
Within each orchard, yield also varied between production years. Orchard 2 and 4 yielded more in year 2 (i.e., 2023) compared to year 3 (i.e., 2024) (Figure 4a–d), perhaps due to climatic factor (e.g., wet summer) that could potentially limit pollination in year 3 [3,5].
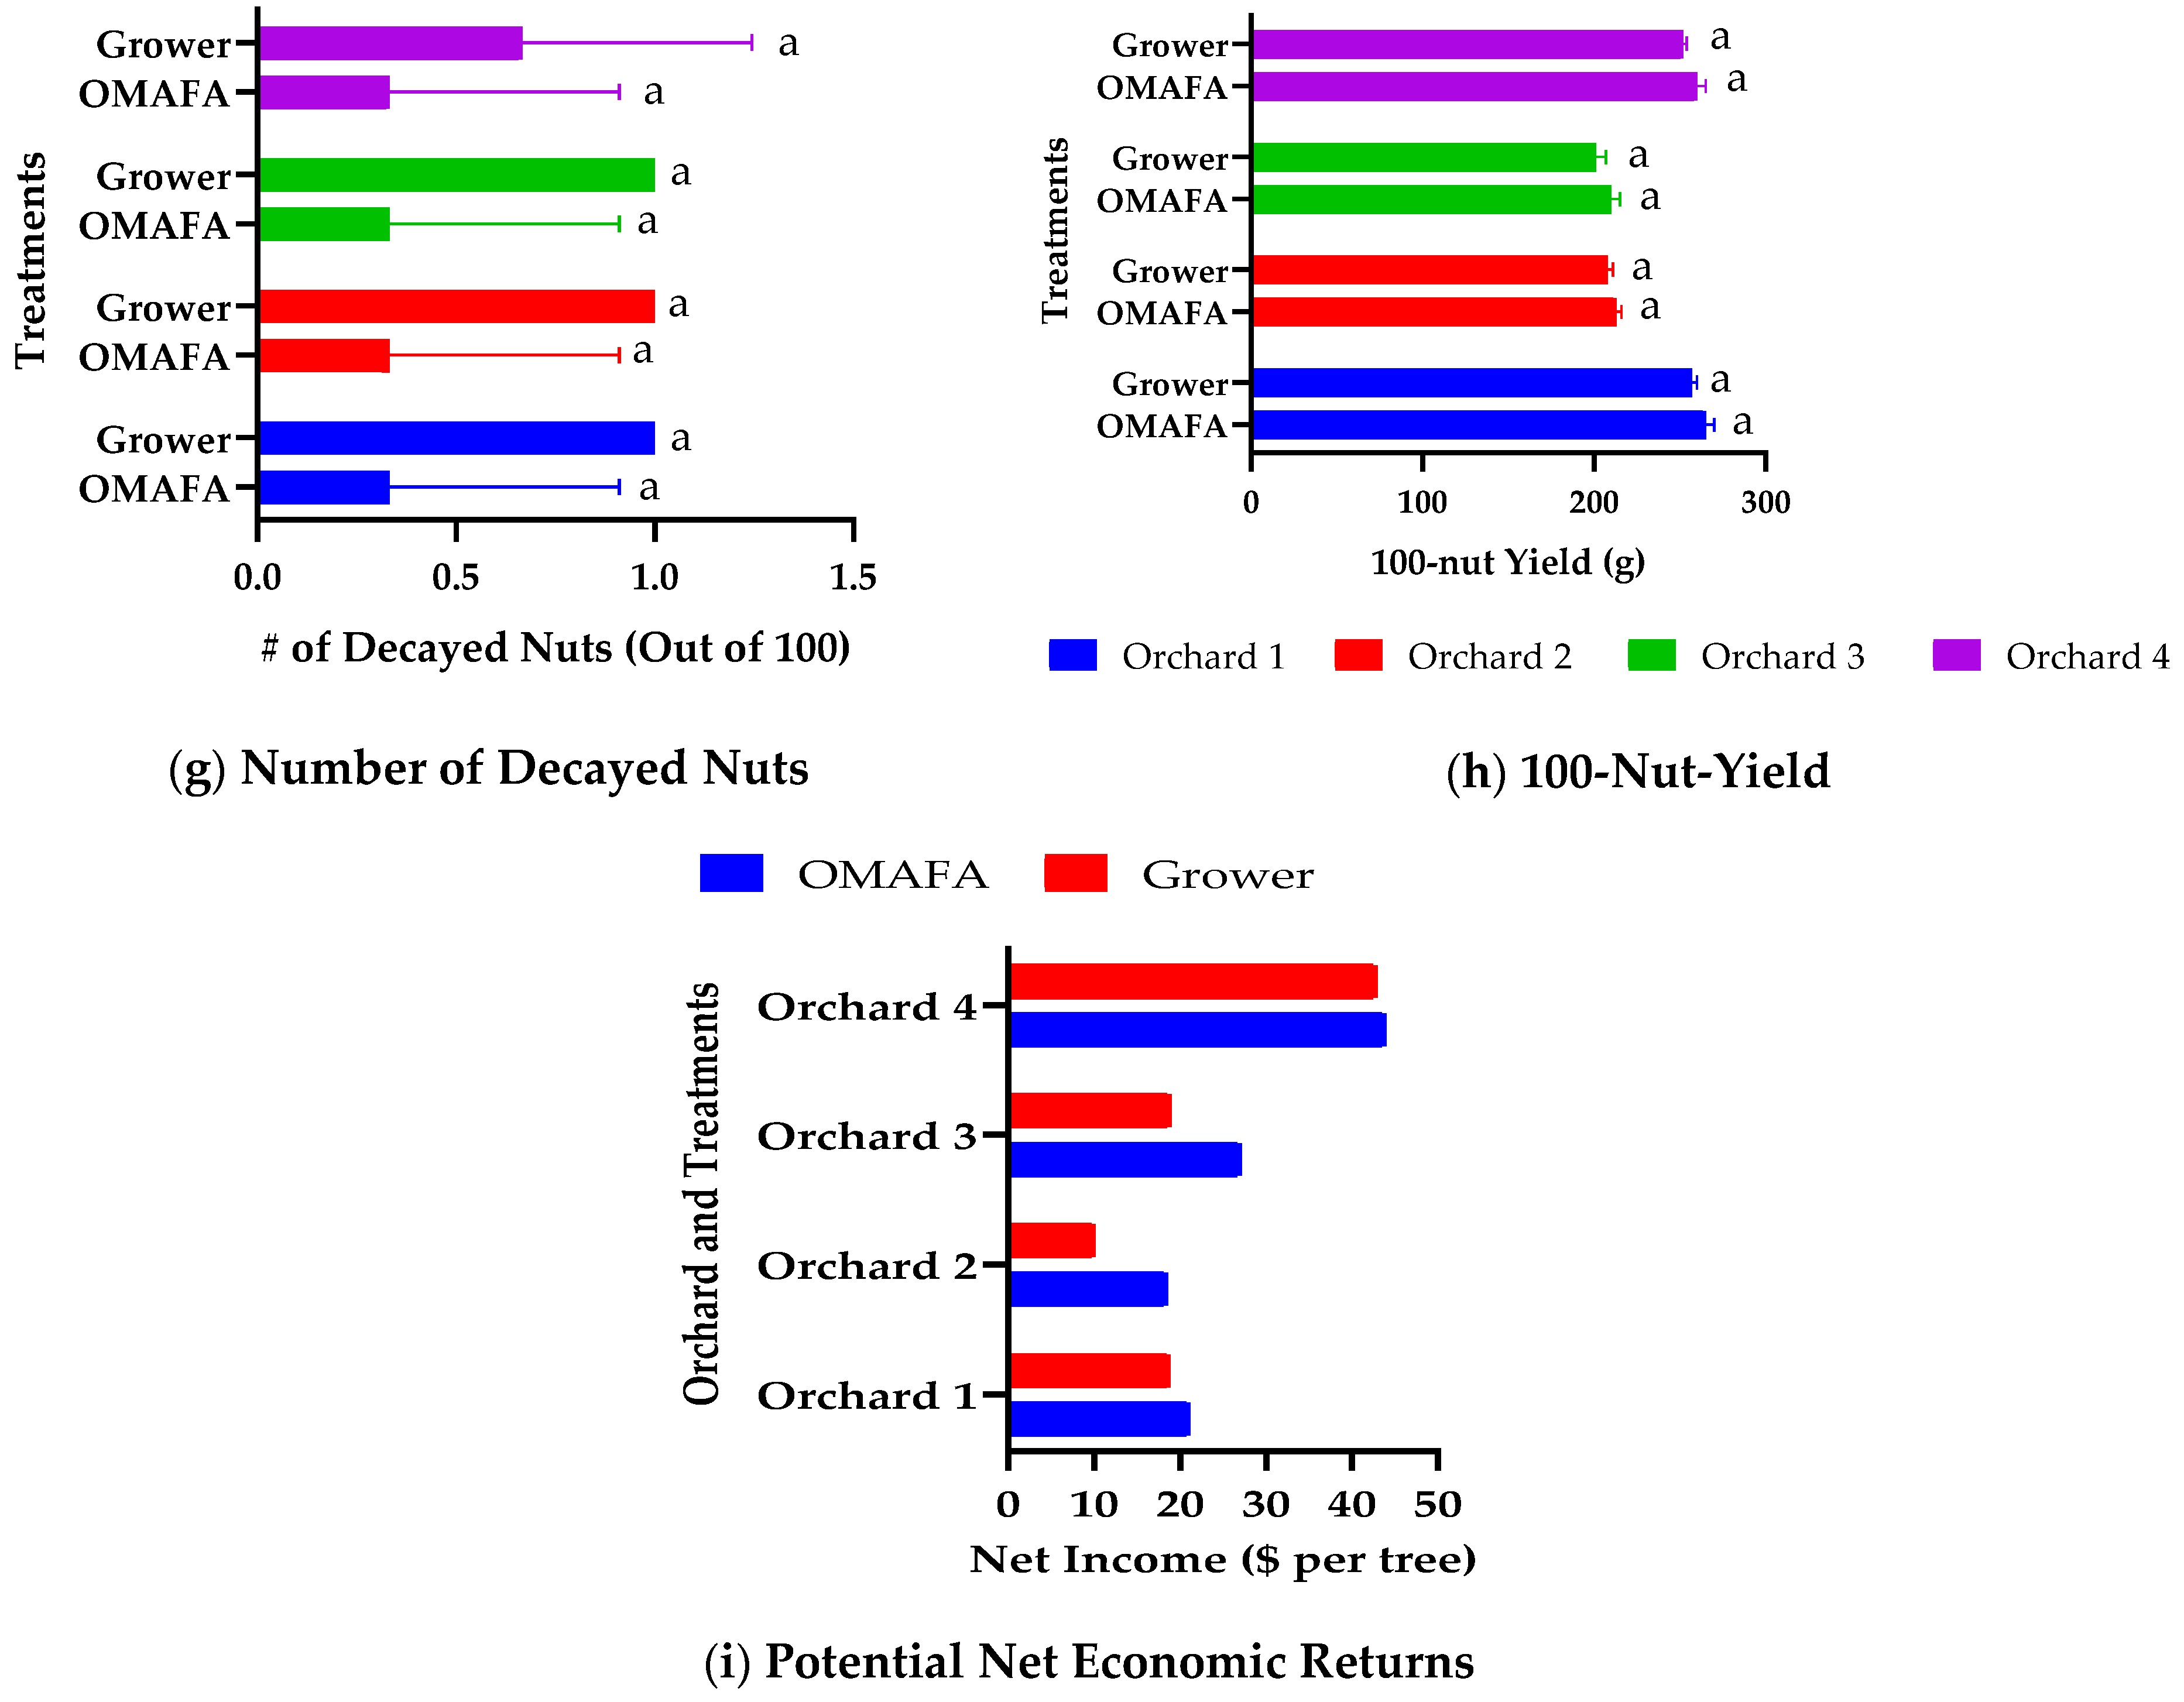
Nut parameters: Kernel to shell ratios did not differ between treatments, but they did differ between orchards (Figure 4e). The highest ratio (0.83) was observed in Orchard 2 while the lowest ratio (0.69) was observed in Orchard 4.
Fertilized plots showed fewer blanks compared to grower’s management across orchards (Figure 4f). Orchard 2 and 4 observed a significantly higher number of blanks in grower’s management; the number, however, was <5 out of 100 (5 percent). Molded nuts did not differ between treatments and orchards (<1 out of 100) (Figure 4g).
The 100-nut-yield differed between treatments and orchards: Fertilized plots showed higher yield compared to grower’s management with Orchard 1 and 4 showing higher weight compared to Orchard 2 and 3 (Figure 4h).
Potential economic returns: Potential net economic returns varied with orchard (i.e., tree age) and fertilizer treatments (Figure 4i). The additional cost of fertilizer treatments (e.g., cost of fertilizers and labor) ranged from CAD 1.0 to 1.3 per tree for fertilized treatments, and CAD 0.4 to 0.9 per tree for grower’s foliar fertilization across orchards.
Fertilized treatment outperformed grower’s management at all orchards with net economic returns of CAD 18–44 per tree, assuming that the nut price was CAD 4 per lb (Figure 4i). The potential net returns from fertilized treatments in year 3 were CAD 21, 18, 27, and 44 per tree from Orchard 1, 2, 3, and 4, respectively, while these numbers were CAD 19, 10, 19, and 43 from grower’s management (Figure 4i).
Application of NPK fertilizers in hazelnut orchards of Georgia also provided higher yield (8.3 percent), shelled nut weight (13.3 percent), kernel weight (10 percent), and kernel efficiency (5.1 percent) over grower’s management or control treatments [11]. In addition, foliar fertilization in combination with soil application of dry NPK fertilizers could enhance hazelnut yield, yield parameters, and soil properties [11]. Özenç et al. [12] also observed positive effects of NPK fertilizers on the yield and mineral composition of hazelnuts.

3.3. Residual Nutrients

Fertilized treatments showed higher levels of residual nutrients of N, P, and K in the soil in both the demonstration sites and replicated trials (Table 5), that were aligned with the leaf tissue analysis (Table 6). In the spring of 2024, residual values of N, P, and K in the grower’s management were either constant or gradually declined from the baseline values of 2022 (Table 5 and Table 6). However, these numbers gradually increased in fertilized treatments across orchards indicating that soil application of recommended dry fertilizers could build up soil nutrients over years (Table 5). Olsen [13] and Olsen et al. [14] also indicated that the spring-applied N is incompletely used in the season of application: more fertilizer N appeared in the leaves that emerged two seasons after application than in leaves that emerged the season of application with some remaining in the roots at the end of the second season. Therefore, although the N applied in the spring contributes to growth in the current season, its main value may be for building reserves for long-term crop health and longevity.
Orchard crops are regarded among the lowest nutrient uptake efficiency of any agricultural crop [15]. Factors that may contribute to low nutrient uptake efficiency involved (1) if nutrients are applied when soils are cold and roots are inactive [16]; (2) application of nutrients in later summer and early fall (August to September) which may stimulate late-season shoot growth that could delay stem hardening, leading to winter damage [17]; and (3) inadequate time for nutrient absorption before cold when they were applied in late fall, even as late as early November, in which the wet soil conditions become conducive to N leaching or runoff [18]. Therefore, the most efficient time for nutrient uptake by woody crops appears to be when plants are fully leafed out and actively growing [5,19,20,21,22]. Olsen [3] also noted that the most efficient uptake of soil-applied N in European hazelnuts occurs during active spring growth, which is from May to June.
The adoption of an integrated approach such as improving soil organic matter, applying N in two or more small doses or in slow-release forms [23], or by fertigation [24], and foliar applications [3] could reduce interception of nitrogen by weeds on European hazelnuts. Most importantly, growers need to match applied nutrients more closely with plant demand to enhance economical and ecological sustainability [25]. This is what is recommended in Oregon, where nutrient application rates are based on the age of the plant for immature hazelnut plants or on leaf analysis for mature plants [3].

3.4. Disease, Pests, and Symptoms of Deficiency or Toxicity

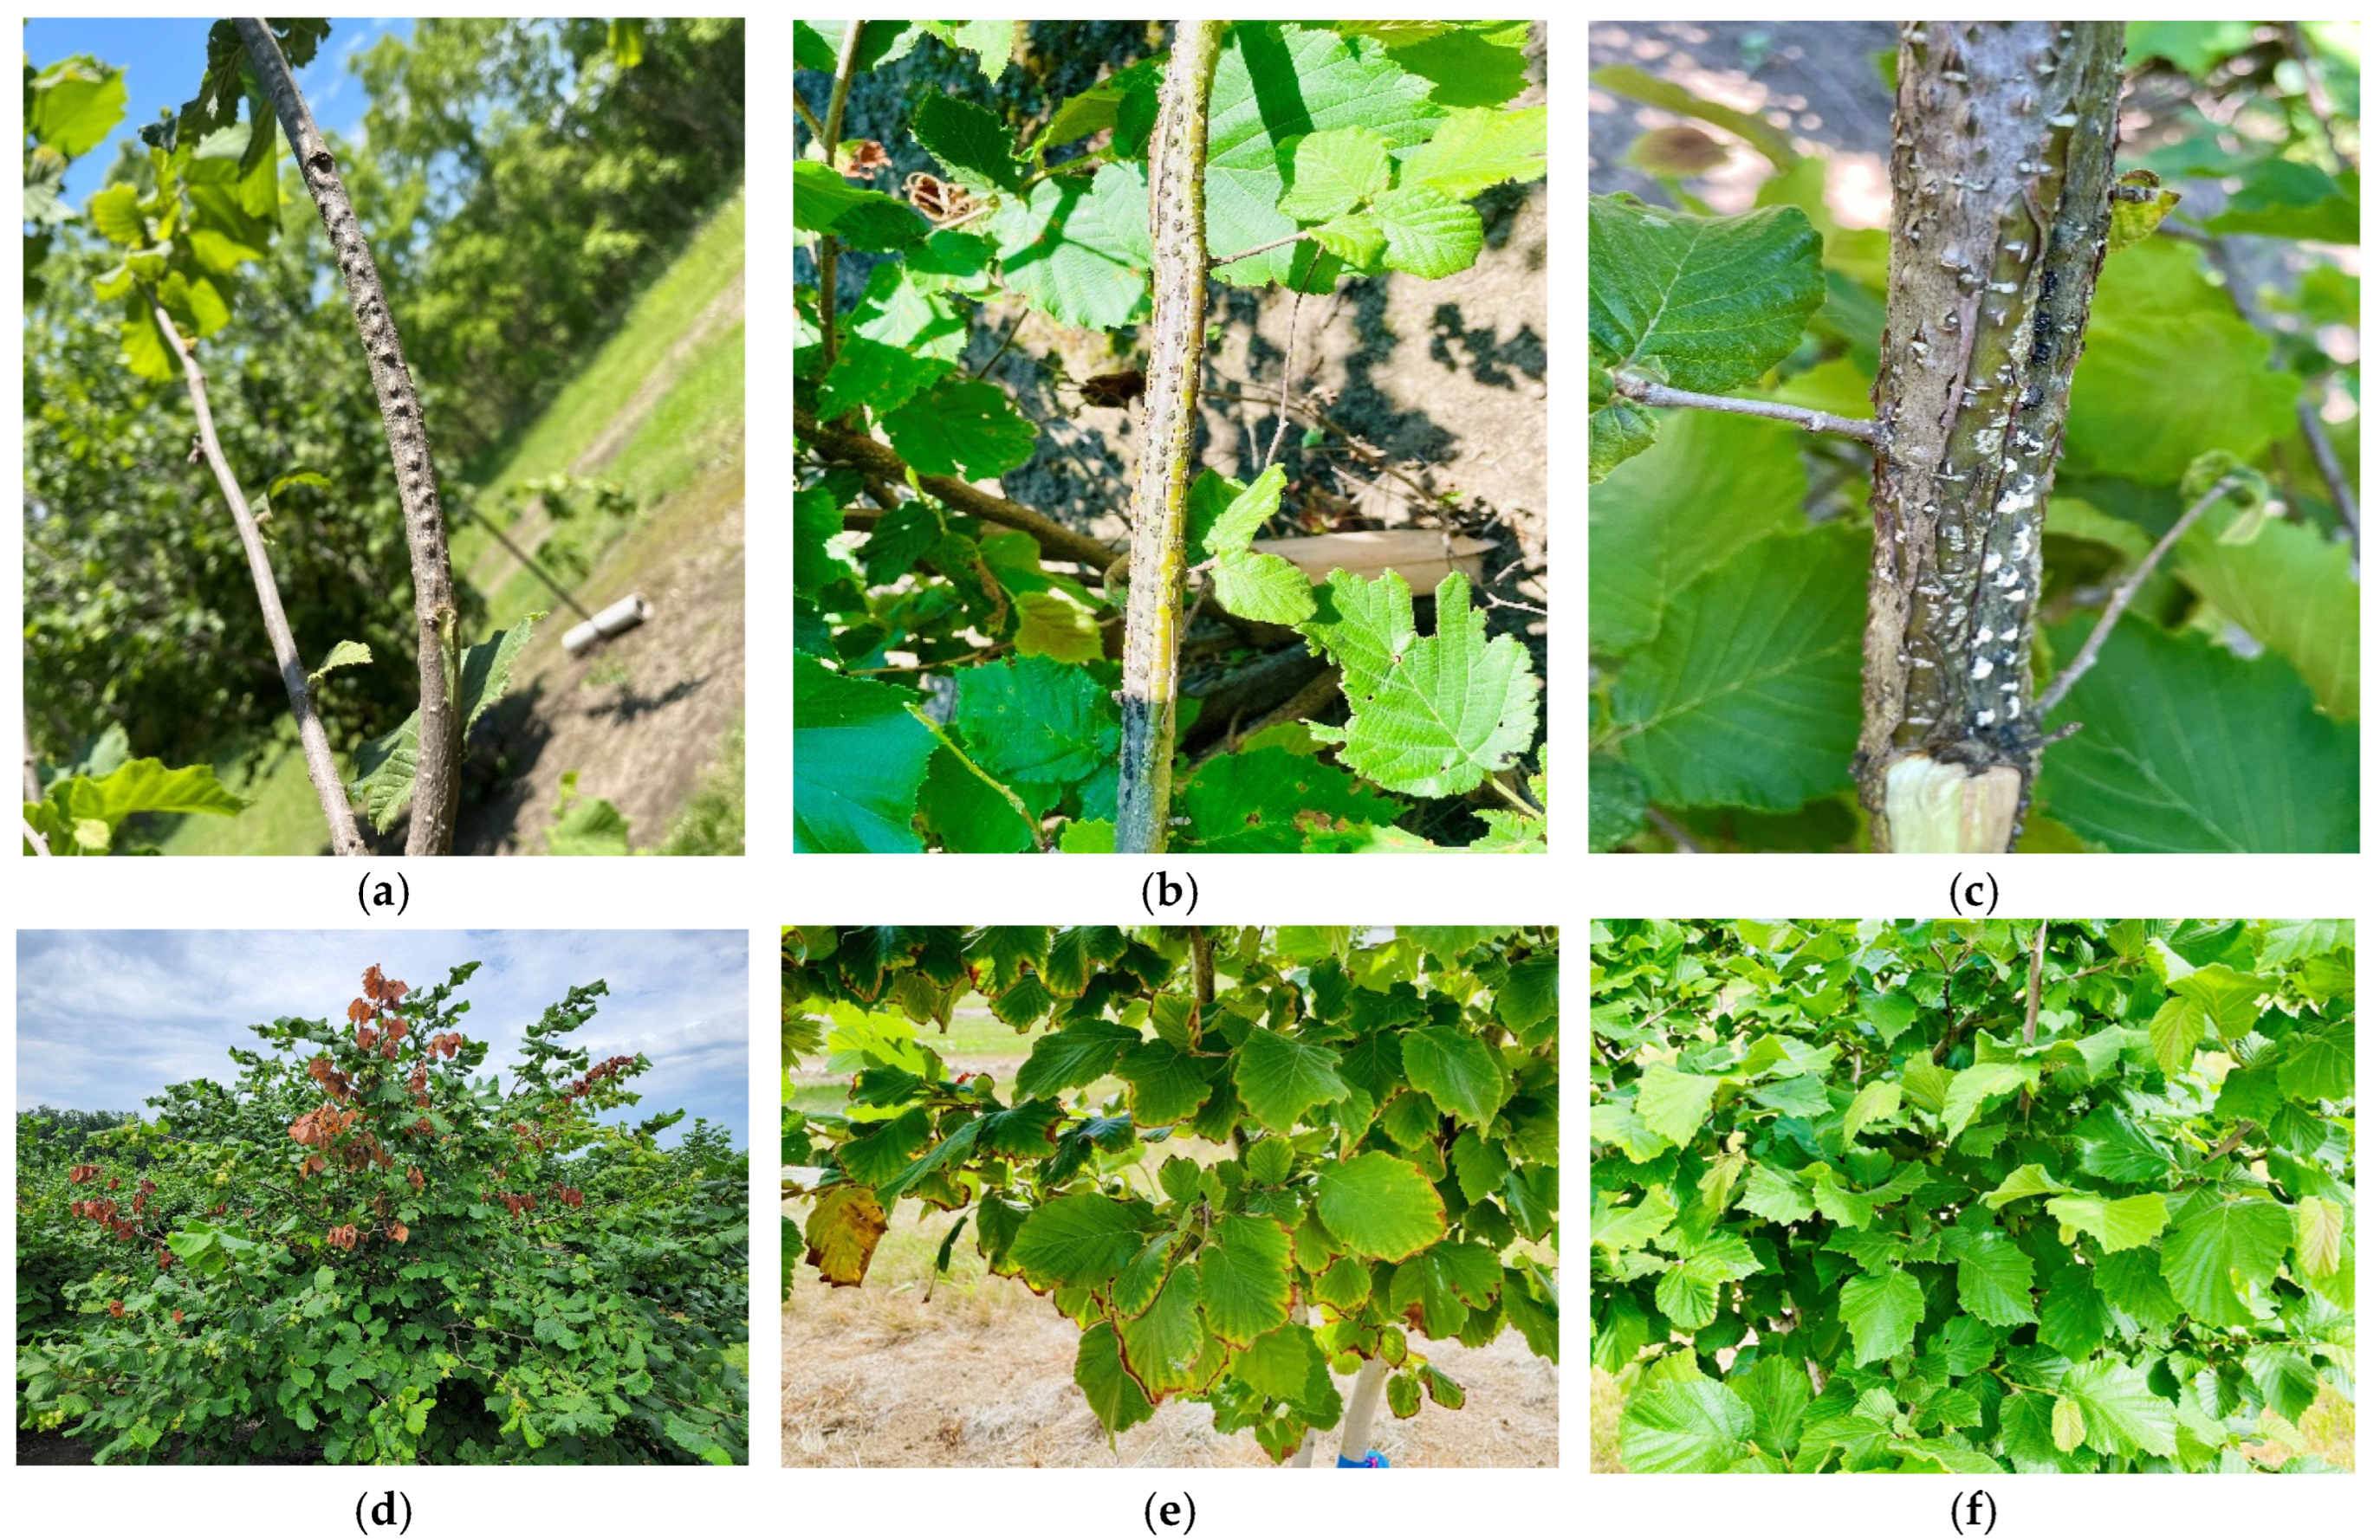
Symptoms of Eastern Filbert Blight were noted across the sites and fertilizer treatments although Yamhill was regarded as resistant to EFB. Symptoms included rows of raised bumps appearing on branches in late spring or early summer (Figure 5a), rows of mature black stromata running along the length of branches (Figure 5b), cankers that look more like cracks or flat sunken areas (Figure 5c), and the death of the twigs or branches (Figure 5d) [5]. This could be an indication that the variety Yamhill began to fully succumb to EFB in Ontario too [26]. Also observed were symptoms of bacterial blight, which is the second most important disease of hazelnut, caused by the bacterium Xanthomonas arboricola pv. corylina (also called Xanthomonas campestris pv. corylina). The leaves on twigs and branches killed by bacterial blight often stay attached, flagging the presence of disease in a similar fashion to Eastern Filbert Blight [5].
The filbert bud mite (Phytoptus avellanae) and the Japanese beetle (Popillia japonica) were also observed regardless of fertilizer treatments across orchards, but their numbers and the extent of damage were minimal.
Symptoms of chlorine toxicity were observed in few fertilized trees that received Muriate of Potash (MOP) as a source of potassium in the first spring resulting in a higher level of chloride in the leaf tissues (i.e., 1.46 vs. 0.13 percent in affected vs. healthy tissues) (Figure 5e–f). This could be perhaps due to the high salt index (116) and chlorine content (45–47 percent) in Muriate of Potash that could lead to chloride toxicity when applied in the spring [10]. As a result, Muriate of Potash was replaced by Potassium Sulphate as a source of potassium the following spring.

4. Conclusions

This 3-year trial demonstrated that the hazelnut yield and potential economic returns varied with location/tree age, fertilizer treatments, production years, and market price of hazelnuts. The pilot demonstrations showed that the fertilized treatment (e.g., Ontario’s guidelines for established tree fruits) outperformed the grower’s management by up to 75 percent with net economic returns of CAD 18–44 per tree. Similarly, the replicated experiment with four different fertility regimes indicated that the modified Oregon and Ontario treatment outperformed grower’s management by 44 and 42 percent, respectively. They yielded ~7.0 lb per tree with a net economic return of CAD 27 per tree during the 3rd year of study, while grower’s management and control treatments yielded 4.8 and 4.0 lb per tree with net economic returns of CAD 19 and 16 per tree, respectively. This trial also found higher levels of residual nutrients of N, P, and K in the soil and the leaf tissues in fertilized treatments; however, they declined gradually in grower’s management, indicating that Ontario’s fertility guidelines for established tree fruits can be used for commercial hazelnut production on mineral soils in Ontario. The competitive yield of hazelnuts from grower’s management in Orchard 4 (i.e., 1898 vs. 1860 lb per acre from fertilized vs. grower’s management) also indicated that 5–7 applications of 3% GMS could be an alternative along with dry fertilizers at least once in three years according to soil/plant tissue analysis because spending a few dollars in testing soils every three years or plant tissues every year could return thousands from established hazelnut orchards while enhancing ecological sustainability.

Author Contributions

Author T.C. designed the study, conducted field trials, data curation and analysis, and produced the first draft of the manuscript. Authors J.L. and S.K. provided support in all phases of this research. All authors have read and agreed to the published version of the manuscript.

Funding

This study was supported by the Horticultural Crops Ontario (HCO) and Ontario Ministry of Agriculture, Food and Agribusiness (OMAFA).

Institutional Review Board Statement

Not applicable.

Informed Consent Statement

Not applicable.

Data Availability Statement

No new data were created or analyzed in this study. Data sharing is not applicable to this article.

Acknowledgments

We would like to thank the Horticultural Crops Ontario (HCO) and OMAFA for funding this project. We thank our collaborators Matt Walker, Martin Hodgson, Les High, and Kevin Hodge for lending their orchard trees for treatment applications. Also, summer students deserve special thanks for their assistance during treatment application.

Conflicts of Interest

The authors declare no conflict of interest.

List of Abbreviations

ANOVAAnalysis of Variance
ASAmmonium Sulphate (21-0-0, N-P-K)
EFBEastern Filbert Blight
GMSGrowers Mineral Solutions (10-20-10, NPK)
HCOHorticultural Crops Ontario
KPotassium
LOILoss-on-ignition
MAPMono-Ammonium Phosphate (11-52-0, N-P-K)
NNitrogen
OMAFAOntario Ministry of Agriculture, Food and Agribusiness
PPhosphorus
PCCPearson Correlation Coefficient
SOPSulphate of Potash/Potassium Sulphate (0-0-51, N-P-K)
USAUnited States of America

References

  1. Drake, E. Opportunity Grows on Ontario Hazelnut Trees. Available online: https://www.uoguelph.ca/oac/news/opportunity-grows-ontario-hazelnut-trees (accessed on 10 January 2025).
  2. Food and Agriculture Organization of the United Nations (FAO). Hazelnut Production. Available online: https://www.fao.org/4/x4484e/x4484e03.htm#TopOfPage (accessed on 10 January 2025).
  3. Olsen, J.; Growing Hazelnuts in the Pacific Northwest. OSU Extension Service Bulletin: EM 9072. 2023. Available online: https://extension.oregonstate.edu/collection/growing-hazelnuts-pacific-northwest (accessed on 10 January 2025).
  4. Tobin, B. Big Plans for Ontario Hazelnuts. Available online: https://www.realagriculture.com/2017/10/big-plans-for-ontario-hazelnuts/ (accessed on 10 January 2025).
  5. OMAFA. Publication 863: Guide to Hazelnut Production in Ontario. Available online: https://www.ontario.ca/page/publication-863-guide-hazelnut-production-ontario (accessed on 10 January 2025).
  6. Liu, J.; Chapagain, T. Fertility Trials in Hazelnuts: Comparison of Oregon and Ontario’s Guidelines over Farmer’s Practice in Ontario; Ontario Ministry of Agriculture, Food and Agribusiness (OMAFA): Guelph, ON, Canada, 2023.
  7. Braun, L.C.; Gillman, J.H. Fertilizer nitrogen timing and uptake efficiency of hybrid Hazelnuts in the Upper Midwest, USA. Hort. Sci. 2009, 44, 1688–1693. [Google Scholar] [CrossRef]
  8. Ontario Soil Management Committee—OSMC. Fertilizer Guidelines for Horticultural Crops; Ontario Ministry of Agriculture, Food and Agribusiness (OMAFA): Guelph, ON, Canada, 2016.
  9. Environment and Climate Change Canada. Historical Data. Available online: https://climate.weather.gc.ca/historical_data/search_historic_data_e.html (accessed on 10 January 2025).
  10. Ontario Ministry of Agriculture, Food and Agribusiness—OMAFA. Soil Fertility Handbook: OMAFRA Publication 611. Available online: https://files.ontario.ca/omafra-soil-fertility-handbook-en-2022-10-13.pdf (accessed on 10 January 2025).
  11. Kizilkaya, R.; Dumbadze, G.; Gülser, C.; Jgenti, L. Impact of NPK fertilization on hazelnut yield and soil chemical-microbiological properties of Hazelnut Orchards in Western Georgia. Eur. J. Soil. Sci. 2022, 11, 206–215. [Google Scholar] [CrossRef]
  12. Özenç, N.; Özenç, D.B.; Duyar, Ö. Nutritional composition of hazelnut (Corylus avellana L.) as influenced by basic fertilization. Acta Agric. Scand. 2014, 64, 710–721. [Google Scholar] [CrossRef]
  13. Olsen, J. Nitrogen management in Oregon hazelnut. Acta Hort. 1997, 445, 263–268. [Google Scholar] [CrossRef]
  14. Olsen, J.L.; Righetti, T.L.; Sanchez, E.I. Absorption and distribution of isotopically labeled nitrogen in the hazelnut tree following ground and foliar applications. Acta Hort. 2001, 556, 437–444. [Google Scholar] [CrossRef]
  15. Weinbaum, S.A.; Johnson, R.S.; DeJong, T.M. Causes and consequences of overfertilization in orchards. Horttech 1992, 2, 112–121. [Google Scholar] [CrossRef]
  16. Dong, S.; Scagel, C.F.; Cheng, L.; Fuchigami, L.H.; Rygiewicz, P.T. Soil temperature and plant growth stage influence nitrogen uptake and amino acid concentration of apple during early spring growth. Tree Physiol. 2001, 21, 541–547. [Google Scholar] [CrossRef] [PubMed]
  17. Baron, L.C.; Stebbins, R. Growing Filberts in Oregon; Oregon Extension Bulletin 628; Oregon State University: Corvallis, OR, USA, 1981. [Google Scholar]
  18. Kowalenko, C.G. Interpretation of autumn soil tests for hazelnut. Can. J. Soil Sci. 1996, 76, 195–202. [Google Scholar] [CrossRef]
  19. Titus, J.S.; Kang, S.M. Nitrogen metabolism, translocation, and recycling in apple trees. Hort. Rev. 1982, 4, 204–246. [Google Scholar]
  20. Munoz, N.; Guerri, J.; Legaz, F.; Primo-Millo, E. Seasonal uptake of 15N-nitrate and distribution of absorbed nitrogen in peach trees. Plant Soil 1993, 150, 263–269. [Google Scholar] [CrossRef]
  21. Weinbaum, S.A.; Merwin, M.L.; Muraoka, T.T. Seasonal variation in nitrate uptake efficiency and distribution of absorbed N in non-bearing prune trees. J. Amer. Soc. Hort. Sci. 1978, 103, 516–519. [Google Scholar] [CrossRef]
  22. Rosen, C.J.; Eliason, R. Nutrient Management for Commercial Fruit and Vegetable Crops in Minnesota; University of Minnesota Extension Services: St Paul, MN, USA, 2005. [Google Scholar]
  23. Gray, D.; Garrett, H.E.G. Nitrogen fertilization and aspects of fruit yield in a Missouri black walnut alley cropping practice. Agrofor. Syst. 1999, 44, 333–344. [Google Scholar] [CrossRef]
  24. Alva, A.K.; Fares, A.; Dou, H. Managing citrus to optimize dry mass and nutrient partitioning. J. Plant Nutr. 2003, 26, 1541–1559. [Google Scholar] [CrossRef]
  25. Sanchez, E.E.; Chimera, H.; Sugar, D.; Righetti, T.L. Nitrogen management in orchards. In Nitrogen Fertilization in the Environment; Bacon, P.E., Ed.; Marcel Decker: New York, NY, USA, 1995; pp. 327–380. [Google Scholar]
  26. Jacobs, D.C.; Revord, R.S.; Capik, J.M.; Molnar, T.J. Eastern filbert blight resistant Corylus avellana identified from 20 years of germplasm introduction and evaluation at Rutgers University, New Jersey, USA. Front. Plant Sci. 2024, 15, 1502392. [Google Scholar] [CrossRef] [PubMed]
Figure 1. Sites selected for fertility trials: (a) Orchard 1; (b) Orchard 2; (c) Orchard 3; and (d) Orchard 4.
Sustainability 17 01543 g001
Figure 2. Example pictures of band application of fertilizers: (a) Banding around the tree, 45 cm away from the trunk; (b) dry fertilizer application in the band; (c) covering fertilizers with the soils.
Sustainability 17 01543 g002
Figure 4. Production data from demonstration trials: (ad) Hazelnut yields as affected by fertilizer treatments and production years in Orchard 1–4; (e) kernel to shell ratio as affected by fertilizer treatments; (f) number of blank nuts as affected by fertilizer treatments; (g) number of decayed/molded nuts as affected by fertilizer treatments; (h) 100-nut yield as affected by fertilizer treatments; and (i) potential net economic returns as affected by fertilizer treatment and production years (tree age). Letters in the bar chart plots indicate statistical significance.
Sustainability 17 01543 g004aSustainability 17 01543 g004b
Figure 5. (ad) Symptoms of Eastern Filbert Blight: (a) Rows of raised bumps appearing on branches in late spring or early summer; (b) rows of mature black stromata running along the length of branches; (c) cankers that look more like cracks or flat sunken areas; and (d) the death of the twigs or branches; (e) symptom of chloride toxicity; (f) healthy leaves.
Sustainability 17 01543 g005
Table 1. Site and soil descriptions in each orchard.
DescriptionSites
Orchard 1Orchard 2Orchard 3Orchard 4
GPS Coordinates43°16′12″ N
80°18′5″ W
42°49′35″ N
80°38′40″ W
43°2′53″ N
80°26′37″ W
43°10′7″ N
79°21′5″ W
Elevation30025025090
Orchard Size (acre)1213108
Tree Density15 × 9 ft2
=323 trees per acre
18 × 9 ft2
=269 trees per acre
18 × 9 ft2
=269 trees per acre
18 × 16 ft2
=150 trees per acre
Orchard Age in 202266410
VarietyYamhill
Soil TextureSandy ClaySandy LoamSandy to Black LoamSandy Clay
Drainage CharacteristicsModerately FineModerately CoarseMediumFine
IrrigationDripDripDripNo
Tile DrainageNot in the trial siteNoYesYes
Baseline Soil Fertility
(0–20 cm depth)
pH: 6.9,
OM: 3.2%,
NO3-N: 8.5ppm,
P: 11 ppm, and
K: 101 ppm.
pH: 6.3,
OM: 3.1%,
NO3-N: 4 ppm,
P: 47 ppm, and
K: 101 ppm
pH: 7.3,
OM: 4.3%,
NO3-N: 12 ppm,
P: 18 ppm, and
K: 110 ppm.
pH: 5.4,
OM: 3.2%,
NO3-N: 3.9 ppm,
P: 59 ppm. and
K: 205 ppm
Table 2. Mean temperature (°C) and total precipitation (mm) observed across trial sites during the growing season of 2022–2024. Numbers in parentheses are total precipitation recorded in each month [9].
MonthsOrchard 1Orchard 2Orchard 3Orchard 4
202220232024202220232024202220232024202220232024
May14.7
(80.1)
12.9
(35.6)
15.5
(90.2)
15.1
(60.2)
12.8
(30.7)
15.0
(88.1)
14.7
(80.1)
12.9
(35.6)
15.5
(90.2)
14.1
(54.2)
12.7
(44.8)
15.9
(58.4)
June18.5
(45.7)
18.4
(64.9)
19.3
(91.1)
19.0
(81.2)
18.3
(79.9)
19.5
(105.5)
18.5
(45.7)
18.4
(64.9)
19.3
(91.1)
19.4
(71.7)
18.3
(65.3)
19.6
(82.8)
July21.2
(50.2)
20.8
(152.3)
21.4
(186.2)
20.9
(58.0)
20.8
(124.9)
21.2
(97.3)
21.2
(50.2)
20.8
(152.3)
21.4
(186.2)
22.1
(55.9)
22.4
(95.9)
22.6
(75.5)
August21.2
(40.9)
18.4
(84.3)
20.2
(39.3)
20.7
(68.3)
18.7
(79.1)
19.7
(116.2)
21.2
(40.9)
18.4
(84.3)
20.2
(39.3)
22.2
(75.8)
20.1
(75.0)
21.5
(69.4)
September16.5
(68.6)
17.2
(7.0)
18.0
(24.5)
16.3
(77.8)
17.2
(64.1)
17.5
(38.0)
16.5
(68.6)
17.2
(7.0)
18.0
(24.5)
17.9
(59.2)
18.7
(20.8)
18.6
(53.8)
Seasonal Average Temperature (°C)18.417.518.918.417.618.618.417.518.919.118.419.6
Seasonal
Total Precipitation (mm)
285.5344.1431.3345.4378.6445.0285.5344.1431.3316.8301.8339.9
Table 3. Standard fertilizer guidelines * and grower’s management adopted in each site [3,5,8].
TreatmentsSites
Orchard 1Orchard 2Orchard 3Orchard 4
Ontario Tree FruitsNitrogen
(Actual N)
0–2 years: no application; 3–5 years: 120 g/tree; 6–7 years: 192 g/tree;
8–9 years: 245 g/tree; 10–12 years: 310 g/tree
Phosphorus
(Actual P2O5)
8–12 ppm: 140 g/tree; 13–15 ppm: 122 g/tree; 16–20 ppm: 102 g/tree; 21–25 ppm: 80 g/tree; 26–30 ppm: 60 g/tree; 31–40 ppm: 40 g/tree; >41 ppm: no application
Potassium
(Actual K2O)
81–100 ppm: 160 g/tree; 101–120 ppm: 142 g/tree; 121–150: 122 g/tree;
151–180: 82 g/tree; >181 ppm: no application
Modified OregonNitrogen
(Actual N)
0–2 years: no application; 3–5 years: 114–150 g/tree; 6–7 years: 150–227 g/tree;
8–10 years: 227–340 g/tree
Phosphorus
(Actual P2O5)
8–12 ppm: 140 g/tree; 13–15 ppm: 122 g/tree; 16–20 ppm: 102 g/tree; 21–25 ppm: 80 g/tree; 26–30 ppm: 60 g/tree; 31–40 ppm: 40 g/tree; >41 ppm: no application
Potassium
(Actual K2O)
0–75 ppm: 680–900 g/tree, 75–150 ppm: 450–680 g/tree; >150 ppm: no application
Growers’ Management1% Growers Mineral Solutions (GMS; 10-20-10 N-P-K; 1 L in 100 L water);
4 applications starting from end of April/early May (i.e., bud break stage) at 2-week intervals; no application in July/August followed by fall application at leaf drop stage in October/November.
2–3 applications of GMS through fertigation program, 10:20 dilution; applications start from mid-April (i.e., bud break stage) to late May at 2-week intervals.2–3 applications of Impact (6-24-6, N-P-K), 1–2 L in 200 L tank; applications start from mid-April (i.e., bud break stage) to late May at 2-week intervals.3% GMS (3 L in 100 L water): 5 applications from mid-April to June; no application in July–August followed by 1 application in the fall (October–November).
* N, P, and K rates vary according to soil and plant tissue analysis. Tree planting density: 200 trees per acre.
Table 4. Critical values for N, P, K in hazelnut leaf tissue and guide for fertilizer application [3].
NutrientsDescriptionSevere DeficiencyDeficiencyOptimalExcess
Nitrogen
(N)
Critical Value (%)<1.81.8–2.22.2–2.5>2.5
Recommended N (lb/tree)3.02.0–3.01.5–2.00
Phosphorus
(P)
Critical Value (%)<0.100.11–0.130.14–0.45>0.45
Recommended P2O5 (lb/tree)Phosphorus deficiencies have not been observed in Oregon hazelnut orchards.
Potassium
(K)
Critical Value (%)<0.50.5–0.70.8–2.0>2.0
Recommended K2O (lb/tree)8.0–10.06.0–8.000
Table 5. Residual nutrients of N, P, and K in the soil as affected by fertility treatments.
TreatmentSiteSoil Nutrients (ppm)
NO3 NitrogenPhosphorus (P)Potassium (K)
Baseline 2022Spring 2023Spring 2024Baseline 2022Fall 2022Fall 2023Baseline 2022Fall 2022Fall 2023
Grower
Management
Orchard 18.487.246.0811111010110098
Orchard 24.044.144.674744431029999
Orchard 311.710.19.51181615111108106
Orchard 43.883.433.28595654204201199
Ontario GuidelinesOrchard 18.4810.814.8112238101155186
Orchard 24.048.7514.6474240102145181
Orchard 311.712.915.4182842111157187
Orchard 43.888.4114.2595149204202195
Table 6. Percentage of N, P, and K in the leaf tissues as affected by fertility treatments.
TreatmentSiteFall Tissue Nutrients (%)
NitrogenPhosphorus (P)Potassium (K)
Fall 2022Fall 2023Fall 2024Fall 2022Fall 2023Fall 2024Fall 2022Fall 2023Fall 2024
Grower
Management
Orchard 12.452.412.400.150.150.130.610.560.55
Orchard 22.472.572.490.150.160.140.630.630.62
Orchard 32.322.302.280.160.160.140.720.670.61
Orchard 42.202.252.190.130.140.140.710.680.62
Ontario GuidelinesOrchard 12.592.792.820.150.160.190.570.760.87
Orchard 22.622.702.780.160.180.210.731.011.09
Orchard 32.382.512.620.160.180.200.720.850.94
Orchard 42.352.492.590.140.160.190.710.870.92
Disclaimer/Publisher’s Note: The statements, opinions and data contained in all publications are solely those of the individual author(s) and contributor(s) and not of MDPI and/or the editor(s). MDPI and/or the editor(s) disclaim responsibility for any injury to people or property resulting from any ideas, methods, instructions or products referred to in the content.