Article

Sustainable Economic Development Through Crisis Detection Using AI Techniques

by
Kurban Kotan
1 and
Serdar Kırışoğlu
2,*
1
Department of Electrical-Electronics and Computer Engineering, Düzce University, 81620 Düzce, Türkiye
2
Department of Computer Engineering, Düzce University, 81620 Düzce, Türkiye
*
Author to whom correspondence should be addressed.
Sustainability 2025, 17(4), 1536; https://doi.org/10.3390/su17041536
Submission received: 5 December 2024 / Revised: 30 January 2025 / Accepted: 6 February 2025 / Published: 13 February 2025
(This article belongs to the Section Economic and Business Aspects of Sustainability)

Abstract

:
Economics is based on data and indicators. Although their interpretation can be complicated, their effects can be calculated in advance. In other words, economic crises are not as complicated and unpredictable as natural disasters. If economic news, news that reflects the thoughts of society, and especially the experiences and predictions of economic experts, is semantically processed from the news texts written by economic experts, economic crises can be predicted long in advance. In addition, the frequency of news about crises in society is also effective. Events that affect society are often mentioned. This can be an indication of some economic crises. In this research, we attempted to detect the economic crises and inflation increases in Turkey in December 2021 and in Germany in September 2022 several months in advance with natural language processing (NLP) models. In the study, the daily news retrieved via RSS from the leading news channels and newspapers was first preprocessed and then the similarities were checked with NLP models. Finally, similarities and changes were analyzed in comparison with inflation data. It was found that similar changes a few months ago had a high correlation with inflation data.

1. Introduction

The main purpose of this study is to investigate whether news texts can be analyzed using natural language processing (NLP) techniques during the economic crisis period experienced in Turkey in 2021 and Germany in 2022. Although various approaches for detecting and predicting economic crises have been discussed in the existing literature, there is a lack of comprehensive studies on the analysis of news data using language models. Filling this gap and identifying language patterns specific to crisis periods is expected to contribute to the early detection of economic crises.
Unlike sentiment analysis methods, NLP models have played an important role in extracting meaning from text and providing insights into various fields in recent years. Since sentiment analysis only shows the positive or negative states of the sentence, NLP models provide meaning and insights from this meaning. This is why it is called semantics. In this study, we investigate how the economic crises in Turkey in December 2021 and in Germany in September 2022, especially the increase in inflation, can be predicted several months in advance by training NLP models with text data retrieved via RSS from leading news channels and newspapers. Thus, this study uses the semantic analysis power of language representation models to deeply capture the contextual and semantic nuances of sentences in news texts and predict economic crises by finding the patterns of economic crises. To make the news unbiased, the news was filtered with special keywords, extracted from the news source, and preprocessed. The resulting texts were converted into texts with lemma root, texts with stem root, and texts without stem root. These text types were scored monthly by looking at the similarity of the expression “There is an economic crisis” with NLP models, and the combinations of NLP models with text types were evaluated.
The inflation data indicating the economic crisis are the monthly changes in the annual inflation rate of the Consumer Price Index (CPI) provided by the Turkish Statistical Institute (TurkStat) and the monthly changes in the annual inflation rate of the Consumer Price Index (CPI) provided by the German Statistical Office (DESTATIS).
The use of inflation data in the analysis of economic crises shaped the approach used in this study and became a source of inspiration for similar studies in the literature. Naghdi et al., in their study of the impact of oil prices on inflation in OPEC countries during the global financial crisis, found that a 1% increase in oil prices caused a 0.08% increase in inflation, highlighting the indirect effects of crises on inflation [1]. Reynard, studying the effects of monetary expansion policies on inflation during the economic crisis, found that such policies increased post-crisis inflation in countries such as Argentina [2]. Bijapur’s study showed that inflationary pressures were more pronounced during the post-crisis recovery phases in OECD countries, arguing that crises reduce productive capacity and thus amplify the impact on inflation [3].
The model can be applied in various fields such as public policy, financial market analysis, and early detection of economic crises. The model is a valuable tool for conducting risk assessments in financial institutions, implementing crisis management procedures in governments, and tracking economic indicators. This approach makes it possible to detect changes in the economy in a timely manner and to adjust strategy accordingly.
With developments in the field of artificial intelligence, the use of artificial intelligence as a tool for detecting economic crises has become very important.
For example, Reznikov evaluated NLP techniques for identifying crisis signals and highlighted the promise of NLP in economic forecasting. The research showed that NLP has a strong relationship with economic indicators [4]. Qi, L. focused on the prediction of global economic crises using NLP and machine learning techniques, emphasizing their role in the development of early warning systems [5]. BODISLAV et al. studied the application of natural language processing and machine learning systems in central bank risk management. The research showed that language, especially in financial news, serves as a valuable resource for economic forecasting [6]. Farahani analyzed the incorporation of language processing methods into business valuation models and outlined the benefits of NLP in essential areas such as crisis identification [7]. Ginsburg developed a method using NLP to provide economic forecasts by interpreting financial news. This work used NLP to process news data and used a context-aware methodology to predict crisis signals [8]. Anil Ari and colleagues studied the dynamics of problem loans during financial crises using machine learning and natural language processing techniques [9]. Kilimci et al. utilized word embedding and deep learning models to forecast the direction of the Istanbul Stock Exchange (BIST 100) using social media and financial news data [10]. Similarly, Othan et al. applied BERT and deep learning models for financial sentiment analysis to predict stock market movements [11]. More recently, Atak examined sentiment analysis in the context of Borsa Istanbul using deep learning approaches [12].
The methodology of this study has both parallels and differences with other studies in the literature. For example, Hellwig used machine learning algorithms to identify financial crises [13]. Similarly, Chen et al. investigated the prediction of financial crises using text mining and machine learning techniques [14]. In contrast to existing research, our proposed model improves the performance of semantic analysis by applying natural language processing (NLP) techniques and sophisticated language models such as BERT. For example, Chen et al. provide additional validation of the methodological advances introduced in this study with respect to large language models for financial analysis [15].
The relevance of machine learning methods and model interpretability has been explored in the early warning systems proposed by Reimann [16]. Our research extends this framework by associating sentiment scores derived from news articles with economic indicators, providing a more nuanced approach to early warning. While Nyman and Tuckett examined the correlation between news sentiment and economic instability, our work integrates sentiment analysis with contextual analysis for early detection of crises [17].
This work makes a significant contribution to the existing body of information. Specifically, it improves the use of natural language processing (NLP) tools for early detection of economic crises by providing more robust semantic analysis approaches. The use of advanced models such as BERT and GloVe shows improved accuracy compared to traditional machine learning methods. This work strengthens the link between financial sentiment analysis and early warning systems by comparing contextual sentiment analysis of news with economic indicators.
This research differs from previous studies by using a multi-lingual and cross-national approach, examining data from Turkey and Germany to provide broader applicability. This illustrates the practical application of large language models in economic forecasting and suggests a framework that can be applied to other nations or languages.
As a result, the potential of machine learning in detecting, preparing for, and intervening in economic crises and improving decision making has recently been well recognized. In addition, NLP’s use of social media and stock market news to detect economic crises has been frequently seen in recent studies. With NLP, you can gain valuable information about market trends and potential crisis indicators. These studies have generally used emotional analysis, but there are a few studies using semantic analysis. In this study, we focused on semantic analysis.

2. Materials and Methods

The methodology consists of performing some preprocessing operations, training the list of requirements with language representation models, finding the cosine similarity of the word “There is economic crisis” with the trained models, and calculating correlations from these similarities and similarity differences. The algorithm of all operations performed within the methodology is explained in Algorithm 1.
Algorithm 1. Pseudo Code for Economic Crisis Detection Using NLP.
1. 
START
2. 
Collect news articles from various sources.
3. 
Preprocess the collected articles by:
  • Removing stop words
  • Performing stemming or lemmatization
  • Tokenizing the text
4. 
Vectorize the preprocessed text using one of the following methods:
  • BERT
  • Word2Vec
  • GloVe
5. 
For each sentence, calculate the cosine similarity with the target phrase “There is economic crisis”.
6. 
Compute the average cosine similarity score for all sentences in a given time frame.
7. 
Perform time series analysis on the similarity scores over different time periods.
8. 
Visualize the results using appropriate plots (e.g., line charts).
9. 
Evaluate the results by comparing the trends in similarity scores with known economic indicators.
10. 
STOP
The Aylien News API, which gives users access to a large corpus of news stories from multiple sources, was used to collect the data for this study. This study includes all relevant data used in the analysis; raw data can be obtained directly from Aylien.com (accessed on 6 June 2024).

2.1. Dataset and Preprocessing

In this study, the analysis of news texts based on the semantic similarity of preprocessed text types with the NLP models is included. The obtained news texts were filtered with neutral keywords such as “stock market”, “stock”, “market”, “investment”, “economy”, “trade”, “finance”, “money market”, “capital market”, “foreign exchange”, “index”, “option”, “portfolio”, “asset management”, “risk management”, and “financial planning”, which are directly related to the economy and have low potential to create judgment, thus creating the most objective news dataset for the analysis to be made. The selected keywords were carefully chosen to create an unbiased view by eliminating possible biases from various news texts within the framework of economic terminology.
  • Removing HTML Tags: we cleaned the HTML and its derivative tags from the text.
  • Converting Numerical Expressions into Text: we converted the numbers in the text to word form so that the text could be processed more effectively by semantic analysis.
  • Clearing Non-Alphanumeric Symbols: we removed non-alphanumeric symbols from the text while preserving the characters of the alphabet.
  • Removing Stop Words: By removing stop words that have no meaning in the language, the text analysis focused on more meaningful words and reduced the impact of stop words on semantic analysis. Example: I, you, and, but, is, are, the, for, yet
  • Creating Text Types: In this step, raw, lemmatized, and stemmed forms of the message text were created. The root of a word found by removing its suffixes, usually without considering grammar rules, is called a stem. The root of a word found using grammar rules, context, and meaning is called a lemma.
    Example for stem: studies → studi
    Example for lemma: studies → study
After these stages, the preprocessed text types formed the basis for the similarity detection processes of the subsequent NLP models. Table 1 shows an example of preprocessed news data for January 2022.

2.2. Natural Language Processing Methods

After preprocessing and in this last part, similarities and their averages were calculated. For this purpose, each language representation model, i.e., NLP models, was trained with preprocessed messages, i.e., each NLP model creates a vector representation of the messages according to each NLP model. Each NLP model has a different method for generating the vector representation. This will be explained in detail in this section. In this way, the message texts were represented in a numerical form. The sentence “There is an economic crisis” was also converted into a vector representation according to each NLP model. After that, the vector representations of each model and each news text were calculated by the cosine similarity with the sentence “There is an economic crisis”. The result was numerical data about how similar the sentences were in meaning. The similarities were averaged on a monthly basis. Thus, the frequency of use in the news was also included in the calculation.
Natural language processing (NLP) is a field that involves the automated manipulation of natural language, such as narrative text and speech, for the purpose of extraction and structuring [18]. These automated areas include feature extraction, text analysis, sentiment analysis, information extraction from text, text summarization, and automatic translation.
The difficulties in natural language processing (NLP) can be related to several elements, including the complexity and diversity of language, context sensitivity, ambiguity, and structural variations among languages. NLP applications often integrate ideas from computer science, artificial intelligence, and linguistics to address these issues [19].
This section discusses some of the NLP methods and techniques used in this study.

2.2.1. Definition and Overview of Natural Language Processing

NLP is a field of computer science that learns to understand and generate written and spoken human language. NLP has many applications when it comes to text mining, text classification, sentiment analysis, language translation, automatic summarization, and much more [18,19]. The equivalents of some technical terms related to NLP are as follows.

2.2.2. Cosine Similarity

Cosine similarity is the calculation of the similarity of the directions of two vectors. The resulting similarity number is between −1 and 1 and is a metric of similarity. As the angle approaches zero, the two vectors become similar in direction. That is, they are in the same direction. If the angle between them is 180, i.e., two vectors are opposite, the similarity score is −1. If two vectors are perpendicular, the similarity score is 0. Equation (1) is the mathematical representation of this process.
              C o s i n e   s i m i l a r i t y = cos θ   = A · B A   | B | = i = 1 n A i · B i   i = 1 n A i 2 i = 1 n B i 2
As you can see in Figure 1, the sentence “This is a happy person” has the closest meaning with its vector representation “This is a very happy person”. If you take their projections from the cosine similarity and then multiply their norms, you obtain the largest value. Since the projections of the other sentences are smaller, they produce smaller values and are further away in meaning.

2.2.3. Distributional Similarity

Distributional similarity is a concept in which the meanings of words or phrases are determined by how they are used in a text. It is based on the principle that “a word gets its meaning from its context”. For example, “The people hugged each other with joy when they saw the arriving caravan herd” and “He went to see his father in prison. While in the first sentence the word “see” was used to mean seeing or choosing, in the second sentence it took on the meaning of visiting or going to him.

2.2.4. Distributional Hypothesis

In NLP, words are not randomly distributed. Words with similar meanings appear in similar linguistic contexts [17]. That is, it assumes that words used in similar contexts are similar. For example, “apple” and “pear” should be considered similar objects in the same context (when used around the activity of eating). As a result, vector representations should also be similar.

2.2.5. Distributional Representation

Distributional representation is called word representations obtained based on context. Context here means nearby words. They are based on a statistic calculated from the context. They are easy to interpret. They are usually high dimensional. They are rare by nature.
  • One Hot Encoding (OHE): Each word in a sentence is represented by a vector of a size equal to the number of unique words in the sentence. The value 1 in the vector representation of a word indicates the location of the word in the sentence.
  • Bag of Words (BoW): BoW refers to the representation of a text by ignoring contextual information such as word order or grammar, focusing only on the presence of the words it contains and the number of times those words occur in the text. Unique words in the text are identified and vocabulary is created. Each piece of text is represented as a vector according to the frequency of the words in the vocabulary in the text.
  • Bag of N-grams (BoN): BoN is a version of BoW. It was created to address the lack of contextual information in BoW. Instead of counting the frequency of words in BoN, we create groups of N tokens and count the words consisting of these N tokens instead. Each group is called an N-gram.
  • Term Frequency-Inverse Document Frequency (TF-IDF): This is a weighting technique used to determine how important a particular term is in a text (document). The TF-IDF score is equal to the product of TF (Term Frequency) and IDF (Inverse of Document Frequency) as shown in Equation (2) [20].
T F I D F = T F · I D F
TF indicates how often a word occurs in the sentence in which it is found, as shown in Equation (3) [20].
T F = N u m b e r   o f   o c c u r r e n c e s   o f   a   w o r d   i n   a   s e n t e n c e N u m b e r   o f   a l l   w o r d s   i n   t h e   s e n t e n c e
IDF measures how common or rare a word is. So, this scale is measured for each word. It is shown in Equation (4) [20].
I D F = L o g ( N u m b e r   o f   a l l   s e n t e n c e s   i n   t h e   t e x t N u m b e r   o f   o c c u r r e n c e s   o f   t h e   w o r d   i n   t h e   e n t i r e   t e x t )

2.2.6. Distributed Representations

They are generated from distributional representations. They are vector representations in which the properties or information of a word, phrase, or sentence are “distributed” among different parts of the vector. Because words have so many numerical and complex representations, they are very difficult to interpret. They are typically low dimensional. They are dense in nature.
1.
Continuous Bag of Words (CBoW): This is the method used to train word embedding words offered by Word2Vec. CBoW predicts the target word from the context, i.e., it tries to predict the word itself based on the surrounding words (context). The order of the words in the context is not important. For example, let us guess each word in the sentence “The stock market crash caused a severe recession” from the two words closest to it. This number 2 is called the window size.
The stock market crash caused a severe recession. → The
The stock market crash caused a severe recession. → stock
The stock market crash caused a severe recession. → market
The stock market crash caused a severe recession. → crash
The stock market crash caused a severe recession. → caused
The stock market crash caused a severe recession. → a
The stock market crash caused a severe recession. → severe
The stock market crash caused a severe recession. → recession
The model is trained so that the red word in each sentence is predicted by the blue words around it. Thus, the trained model gains the ability to predict the next word from the given words.
2.
Skip-Gram: This is the method used to train the word embedding words offered by Word2Vec. Skip-Gram, which is the opposite of CBoW, predicts from an input word the words in its context, i.e., the words around it. Using the example given in CBoW, the result would be as follows.
The stock market crash caused a severe recession. → stock, market
The stock market crash caused a severe recession. → The, market, crash
The stock market crash caused a severe recession. → The, stock, crash, caused
The stock market crash caused a severe recession. → stock, market, caused, a
The stock market crash caused a severe recession. → market, crash, a, severe
The stock market crash caused a severe recession. → crash, caused, severe, recession
The stock market crash caused a severe recession. → caused, a, recession
The stock market crash caused a severe recession. → a, severe
Here, the model is trained by giving red words as input and blue words as output. The trained model is then used to predict the surrounding words of a given word.

2.2.7. Word Embedding Methods

Word embedding displays the words in your data as vectors. This is a widely used technique in NLP. Since the similarities and differences of vectors are used to understand the similarities and differences between words, we express these operations mathematically, making these abstract tasks more concrete [21]. The image in Figure 2 contains examples that illustrate the concept of word embedding.
  • In the first image, the vector relationship between the words “king” and “man” is parallel to the vector relationship between the words “queen” and “woman”. This shows that the vector from ‘king’ to ‘queen’ is parallel to the vector from ‘man’ to ‘woman’. We can also express this mathematically as king–man = queen–woman. The equality here says that there will be almost similar vectors, though not exactly, and their projections onto each other will be close to the norms of those vectors. From this, we can say that similar results will occur if the words “boy” and “girl” are written instead of the words “man” and “woman”. We can also show our vector operation as king–boy = queen–girl.
  • Similarly, in the second image, the vector relations between ‘walked’ and ‘walking’ and ‘swam’ and ‘swimming’ show the regular transition between the past and present tense forms of these verbs.
  • The last figure shows that the vector representation of each country’s relationship with its capital is almost parallel to the vector representation of its relationship with the capitals of other countries.

2.2.8. Sentence Embedding (Language Representation Models)

Sentence embedding techniques enable the representation of sentences and expressions by mathematical vectors to capture the contextual and semantic richness of language, and therefore sentence embedding and language representation techniques have a very important place in NLP. Therefore, these models have a deep understanding of the contextual nuances of language, which enables more sophisticated understanding and generalization capabilities of these models in NLP tasks.
Figure 3 shows three vectors, each labeled with different sentences to show different semantic meanings, to illustrate the concept of sentence embedding. In a multidimensional vector space, each sentence is represented by a single vector. We mathematically capture the semantic content, or meaning, of these sentences with vectors.
In Figure 3, “The tiger hunts in this forest” is shown, with the blue vector representing the sentence “The lion is the king of the jungle”. Since the red vector representing the sentence reminds us of the cat species and the forest, the similarity of these two vectors in size and direction is very different from them in meaning. It is more than the green vector that represents the phrase.
Each vector in the multidimensional vector space encodes the complex relationships of the words in the sentence and the meanings these words bring together. The position of the vectors in space indicates the similarity of meaning between sentences: sentences with similar meanings are placed close together, while sentences with different meanings are placed farther apart. During sentence embedding, models perceive sentences semantically and use a vector that best reflects those meanings.
Therefore, the sentences “The tiger hunts in this forest” and “Lion is the king of the jungle” are placed closer together in the sentence embedding space, while the sentence “Everybody loves New York” is semantically separated from the other two sentences and placed at a different point in the embedding space.
Since each dimension represents a specific semantic or conceptual dimension in the multidimensional vector space, during vectorization, the multidimensional semantic richness of sentences and the nuances they contain is indicated by their unique positions in this space.
If we look at some of the prominent word embedding and sentence embedding models, GloVe (Global Vectors for Word Representation), which is used for word embedding but can be extended to the sentence level and is also used for sentence embedding, is a word embedding model introduced by Pennington et al. [22].
GloVe combines co-occurrence matrix and matrix factorization techniques derived from word co-occurrence analysis using probability statistics on large text sets to capture word meanings and relationships. Thus, GloVe is an unsupervised learning algorithm that learns word vectors.
Another important sentence embedding model is the BERT (Bidirectional Encoder Representations from Transformers) model. It can also be used to generate word-level embedding vectors. This model pre-trains the deep bidirectional representations it creates using the Transformer architecture and performs training in all layers based on left and right contexts. As a result, each word gains meaning in the context of the words before and after it. This allows the model to gain a deeper understanding of the context and meaning of words and sentences.
These models, which have achieved significant success in the field of NLP and are widely used, use different approaches to capture word meanings and relationships. The BERT model focuses on understanding the context of words and sentences using deep learning techniques. The GloVe model focuses on statistical information. Let us look at these different word and sentence embedding models, which are trained on the types of words generated after the preprocessing stage.
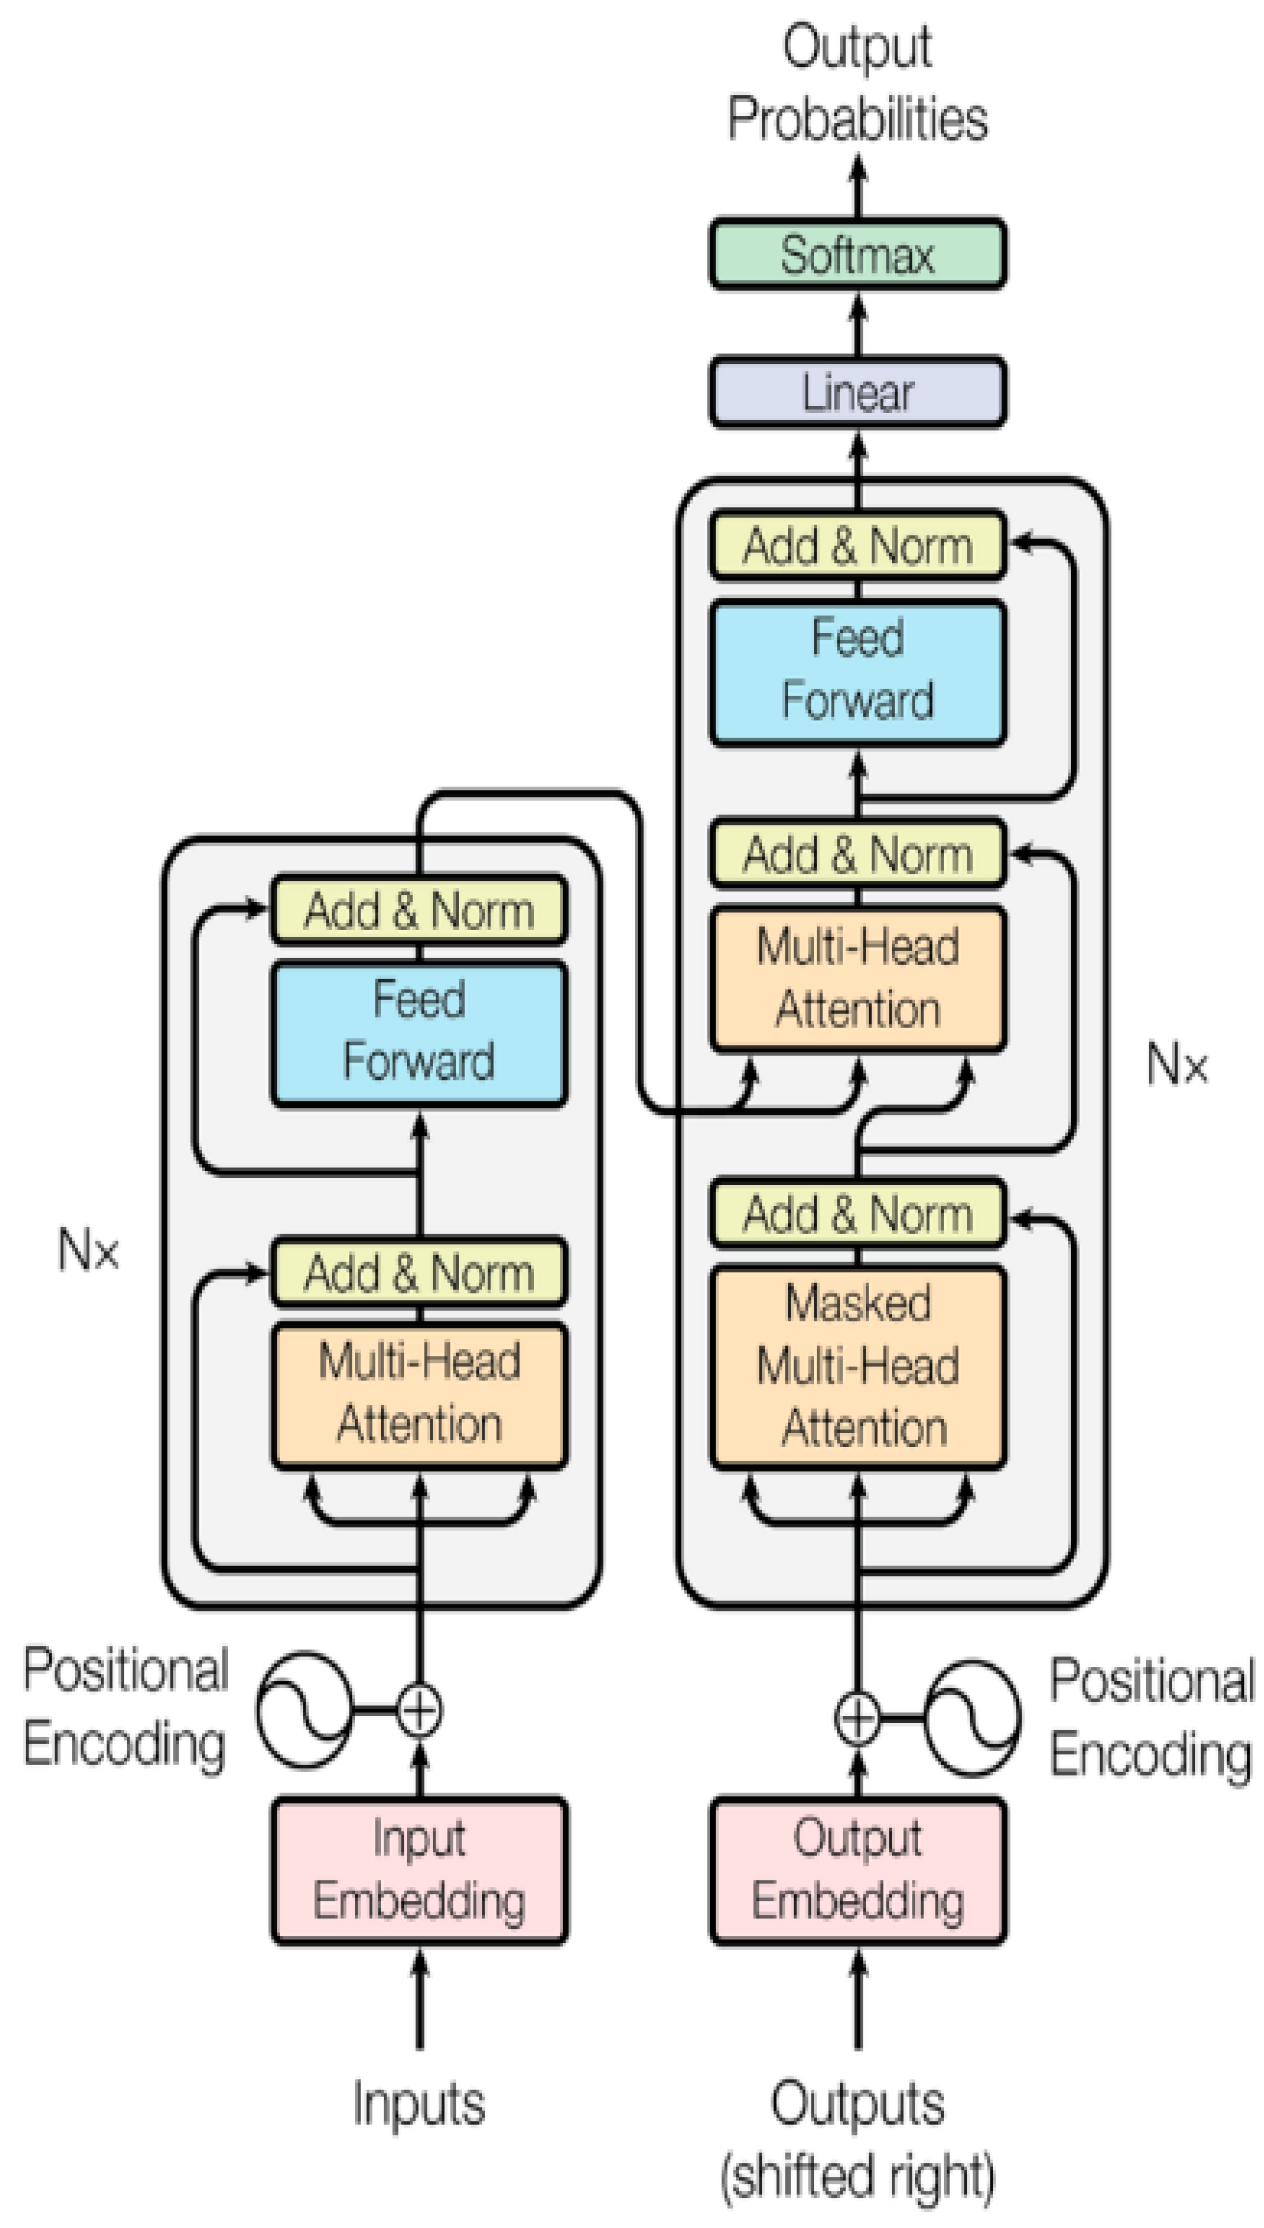
  • BERT (Bidirectional Encoder Representations from Transformers): BERT is a sentence embedding model, and recent research has extensively studied the construction and use of Bidirectional Encoder Representations of Transformers, i.e., the BERT model [23]. BERT and Transformer-like models such as BERT perform well in complex NLP tasks because they can better understand a broader context of the language. BERT plays a particularly important role in understanding the context of expressions and words. For example, in applications such as sentiment analysis of customer reviews on an e-commerce platform, this feature allows us to better understand what customers think about products and thus make more accurate business decisions [23]. BERT is a Transformer, and Transformer was first introduced by Vaswani et al. and is a pioneering model in the field of NLP [24]. Figure 4 shows the basic architecture of the Transformer model.
The Transformer consists of two parts: an Encoder and Decoder. Both Encoders and Decoders consist of at least one layer. N indicates the number of layers in the Transformer architecture and is shown as Nx in the figure to emphasize that there are N layers. One of these N similar layers is shown in detail in the figure. The visible layer consists of modules or components such as Multi-Head Attention, normalization, and Feed Forward.
The modules in the Encoder section are as follows:
  • The “Input Embedding” module creates fixed-size vector representations of words or tokens. In this way, each word or token is associated with a numerical vector that the model can learn. This is the first step for the model to understand the input.
  • “Positional Encoding” adds sequence information, i.e., the number of times the word occurs in the sentence. Although RNNs or LSTMs have input sequence information, Transformers do not have input sequence information and therefore cannot directly process sequential data. To overcome this limitation, this module passes the position of each word in the sentence to the model.
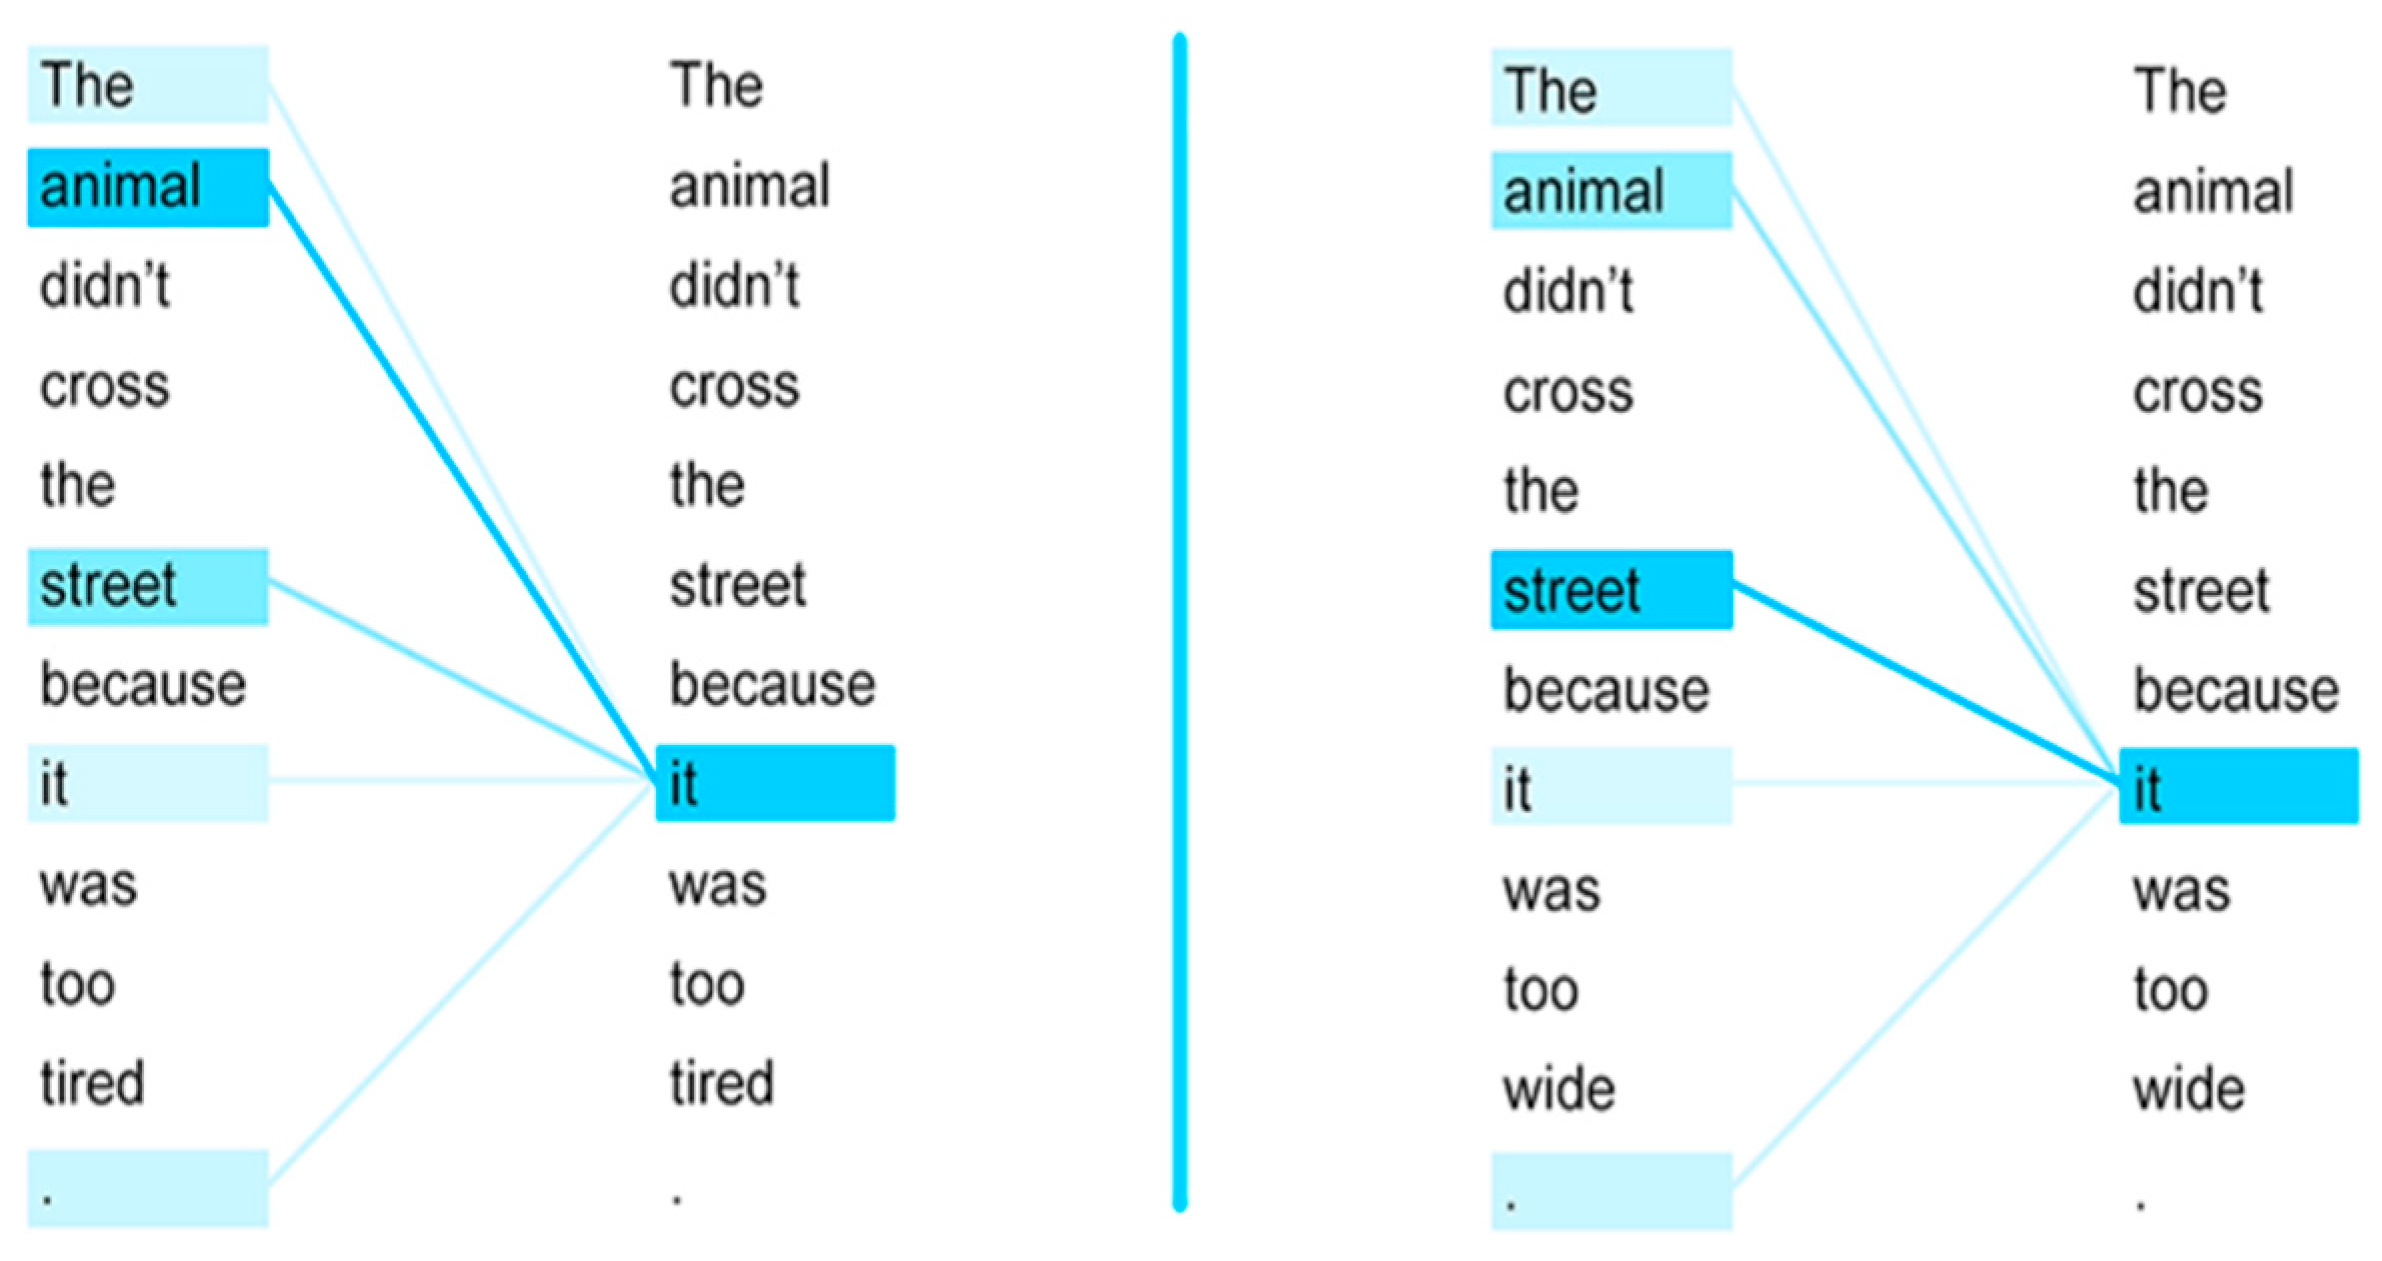
  • The “Multi-Head Attention” module allows the model to “pay attention” to information in different places at the same time to better understand the relationships between words. For example, this module shows whether the pronoun “it” in the sentence “The animal didn’t cross the street because it was too tired” is related to the word “animal” or the word “street”. In this way, the meaning of the word “it” in the sentence is more accurately determined. In Figure 5, to illustrate the mechanism of “Self-Attention” in this module, the colors of the words with which the word “it” is most related are shown in shades according to the level of relationship. In the sentence on the left, the word “it” is related to the word “animal”, while in the sentence on the right, the word “it” is related to the word “street”.
  • The “Add & Norm” module consists of parts that perform two separate functions. The addition part, with a structure known as Residual Connection, tries to prevent potential problems such as gradient disappearance in deep learning networks by collecting the output from each sublayer and the input before entering that layer to ensure that gradients in deep networks are propagated back more effectively. In the normalization part, the vector obtained after the addition process is subjected to layer normalization to accelerate learning and increase stability in different layers of the model.
  • The “Feed Forward” module has two important functions. The expansion and activation part, which allows the model to learn more complex relationships, and the contraction part, which brings the output of each layer to the appropriate size for the next layer.
The modules in the decoder section are as follows:
  • The “Masked Multi-Head Attention” module supports an autoregressive prediction structure by ensuring that the model only sees the words produced so far when generating a sentence. That is, it only considers the previous words when predicting the next word. It works very well in sequential data processing, such as text generation and translation, because it prevents information leakage about future words.
  • The “Output Embedding” module does the opposite of the word embedding carried out in the “Input Embedding” module in the Encoder section, i.e., it converts the output vectors into words.
  • The “Linear” module converts the size of the vectors output from the Decoder into the size of the vocabulary.
  • The “Softmax” module normalizes these scores by converting the scores from the linear layer into a probability distribution where the sum of all word probabilities is 1. It then predicts what the next word will be based on this probability distribution.
This architecture has demonstrated high performance in NLP tasks such as text translation, text summarization, and question–answer systems. The most striking and important parts of the Transformer are its parallelizable structure and its ability to effectively model long contextual information.
Unlike previous models, the BERT model pre-trains deep bidirectional representations from unlabeled text by conditioning right and left context across all layers. This design allows the model to recognize sentence and word context and meaning. A single output layer gives the pre-trained BERT model top performance in several natural language processing tasks [23]. Contextual knowledge and high-quality representations make BERT successful. Pre-training on large amounts of unlabeled text data teaches word–sentence correlations and subtask generalization. Fine-tuning the model to each task optimizes performance [23]. Transformer is an attention-only network without recurrent or convolutional neural networks. The Transformer architecture determines sentence context and word associations in BERT. BERT produces high-quality representations for language extraction, question answering, and text categorization [23]. BERT is popular and successful in NLP activities. Its overall language comprehension evaluation scores, multi-genre NLP inference accuracy, and question answering on the Stanford Question Answering dataset are very high [23]. It has also been applied to tasks such as temporal document retrieval [25], text classification [26,27], news image text classification [28], long document classification [29], question answering [30], and inferential text summarization [31].
2.
Word2Vec: The Word2Vec algorithm was introduced by Mikolov et al. [21,32]. Word2Vec is a popular unsupervised learning algorithm. It is not possible to extract the relationships between two different vectors with One Hot Coding. Additionally, when the number of words in sentences increases, the number of zero elements in the word representation vector will increase, which increases the memory requirement. Word2Vec uses 2 important methods to solve these two problems. As explained before, these are CBoW and Skip-Gram methods [32]. Both architectures have been shown to be capable of producing high-quality word embedding. TheWord2Vec algorithm is based on the distributional hypothesis described earlier, that is, the idea that words in similar contexts tend to have similar meanings [32]. Word2Vec learns distributed representations of words by training a neural network with data obtained from CBoW and Skip-Gram on a large text set [32].
These two methods used in Word2Vec use a similar neural network architecture, but the relationship between the input and output layers is different because, as explained before, in CBoW, more than one context word is used as input and one context word is produced as output, while in Skip-Gram, a single word is used as input and more than one context word is produced as output. In the Word2Vec model, the most appropriate of these two methods is selected and used for a task.
Word2Vec captures semantic links between words, which is another benefit. In addition to word similarity, learned word embedding can be employed for word analogies and document categorization [32]. Many fields and applications use Word2Vec. Biomedical researchers utilize Word2Vec to evaluate medical literature, detect drug–drug interactions, and forecast disease–gene connections [33]. Image description and visual question responding employ Word2Vec [32]. It is utilized in sentiment analysis, machine translation, and recommendation systems [32]. Word2Vec is a prominent word embedding model compared to GloVe, which has performed well in several tasks and is extensively used [34]. GloVe outperforms Word2Vec in benchmarks with less text and smaller vectors [34]. Choice between these two models relies on task and dataset.
3.
GloVe (Global Vectors for Word Representation): GloVe is an unsupervised learning algorithm that learns word vectors [22]. GloVe generates word vectors by analyzing the likelihood of word pairs appearing together in a given text corpus. The local context window and global matrix factorization form Glove’s count-based global log-bilinear regression model and it has been widely used in various natural language processing tasks [22]. The algorithm trains non-zero elements in a word–word co-occurrence matrix using statistical information [35]. With this method, GloVe captures fine-grained semantic and syntactic regularities using vector arithmetic [22].
Since only surrounding words are used for word embedding in Word2Vec, it causes word embedding to be in a limited context and may be restrictive in the long run. GloVe, on the other hand, uses the entire text to derive vector representations of the word to eliminate this limitation. GloVe uses word–word co-occurrence probabilities, a global statistic, to combine the gist of the entire corpus. A word–word co-occurrence matrix is a 2-dimensional array that stores the frequency of every possible word pair in the entire text. Instead of correlation values, it is a matrix with the frequency of 2 words found together in a given situation.
The basis of GloVe is co-occurrence statistics, i.e., statistics of how two words are related to each other, as shown in Equation (5).
P i , j = X i , j X i
Xi,j: number of occurrences of words “i” and “j” together.
Xi: total number of occurrences of the word “i”.
Relationships between words depend on differences in co-occurrence rates of word pairs, as shown in Equation (6).
P ( i , k ) P ( j , k )   X i , k X j , k
For example,
P ( q u e e n , c r o w n ) P ( k i n g , c r o w n )   P ( q u e e n , w o m a n ) P ( k i n g , m a n )
The term “crown” serves as the contextual word denoting the relationship between “queen” and “king,” which illustrates a semantic structure. The relationship between “man” and “woman” is likewise conveyed using a contextual term. GloVe derives word embedding vectors from the co-occurrence matrix to represent the proportional relationships among words in vector space and vectorizes the words using Equation (7) as follows.
w i · w j + b i + b j = l o g ( X i , j )
wi, wj: Vector representations of words i and j. These are the actual parameters that the GloVe model tries to learn.
bi, bj: bias values of words.
It has been found that GloVe outperforms other word embedding models such as Word2Vec in terms of accuracy and GloVe’s training is faster than Word2Vec’s training [36].

2.2.9. Detection of Crisis Moments with NLP

NLP techniques can be used to identify moments of crisis using data from social media platforms. Emotional analysis can be a useful tool for understanding community sentiment, especially before and during a crisis [37]. In this study, semantic analysis was used because it captures the contextual and semantic richness of language, which is more complex, despite the simple functionality of emotional analysis, such as measuring sensitivity.

2.2.10. Detection of Crisis Moments

The inflation data for Turkey are monthly changes in annual CPI inflation rates published by TURKSTAT, and the inflation data for Germany are monthly changes in annual CPI inflation rates published by DESTATIS.
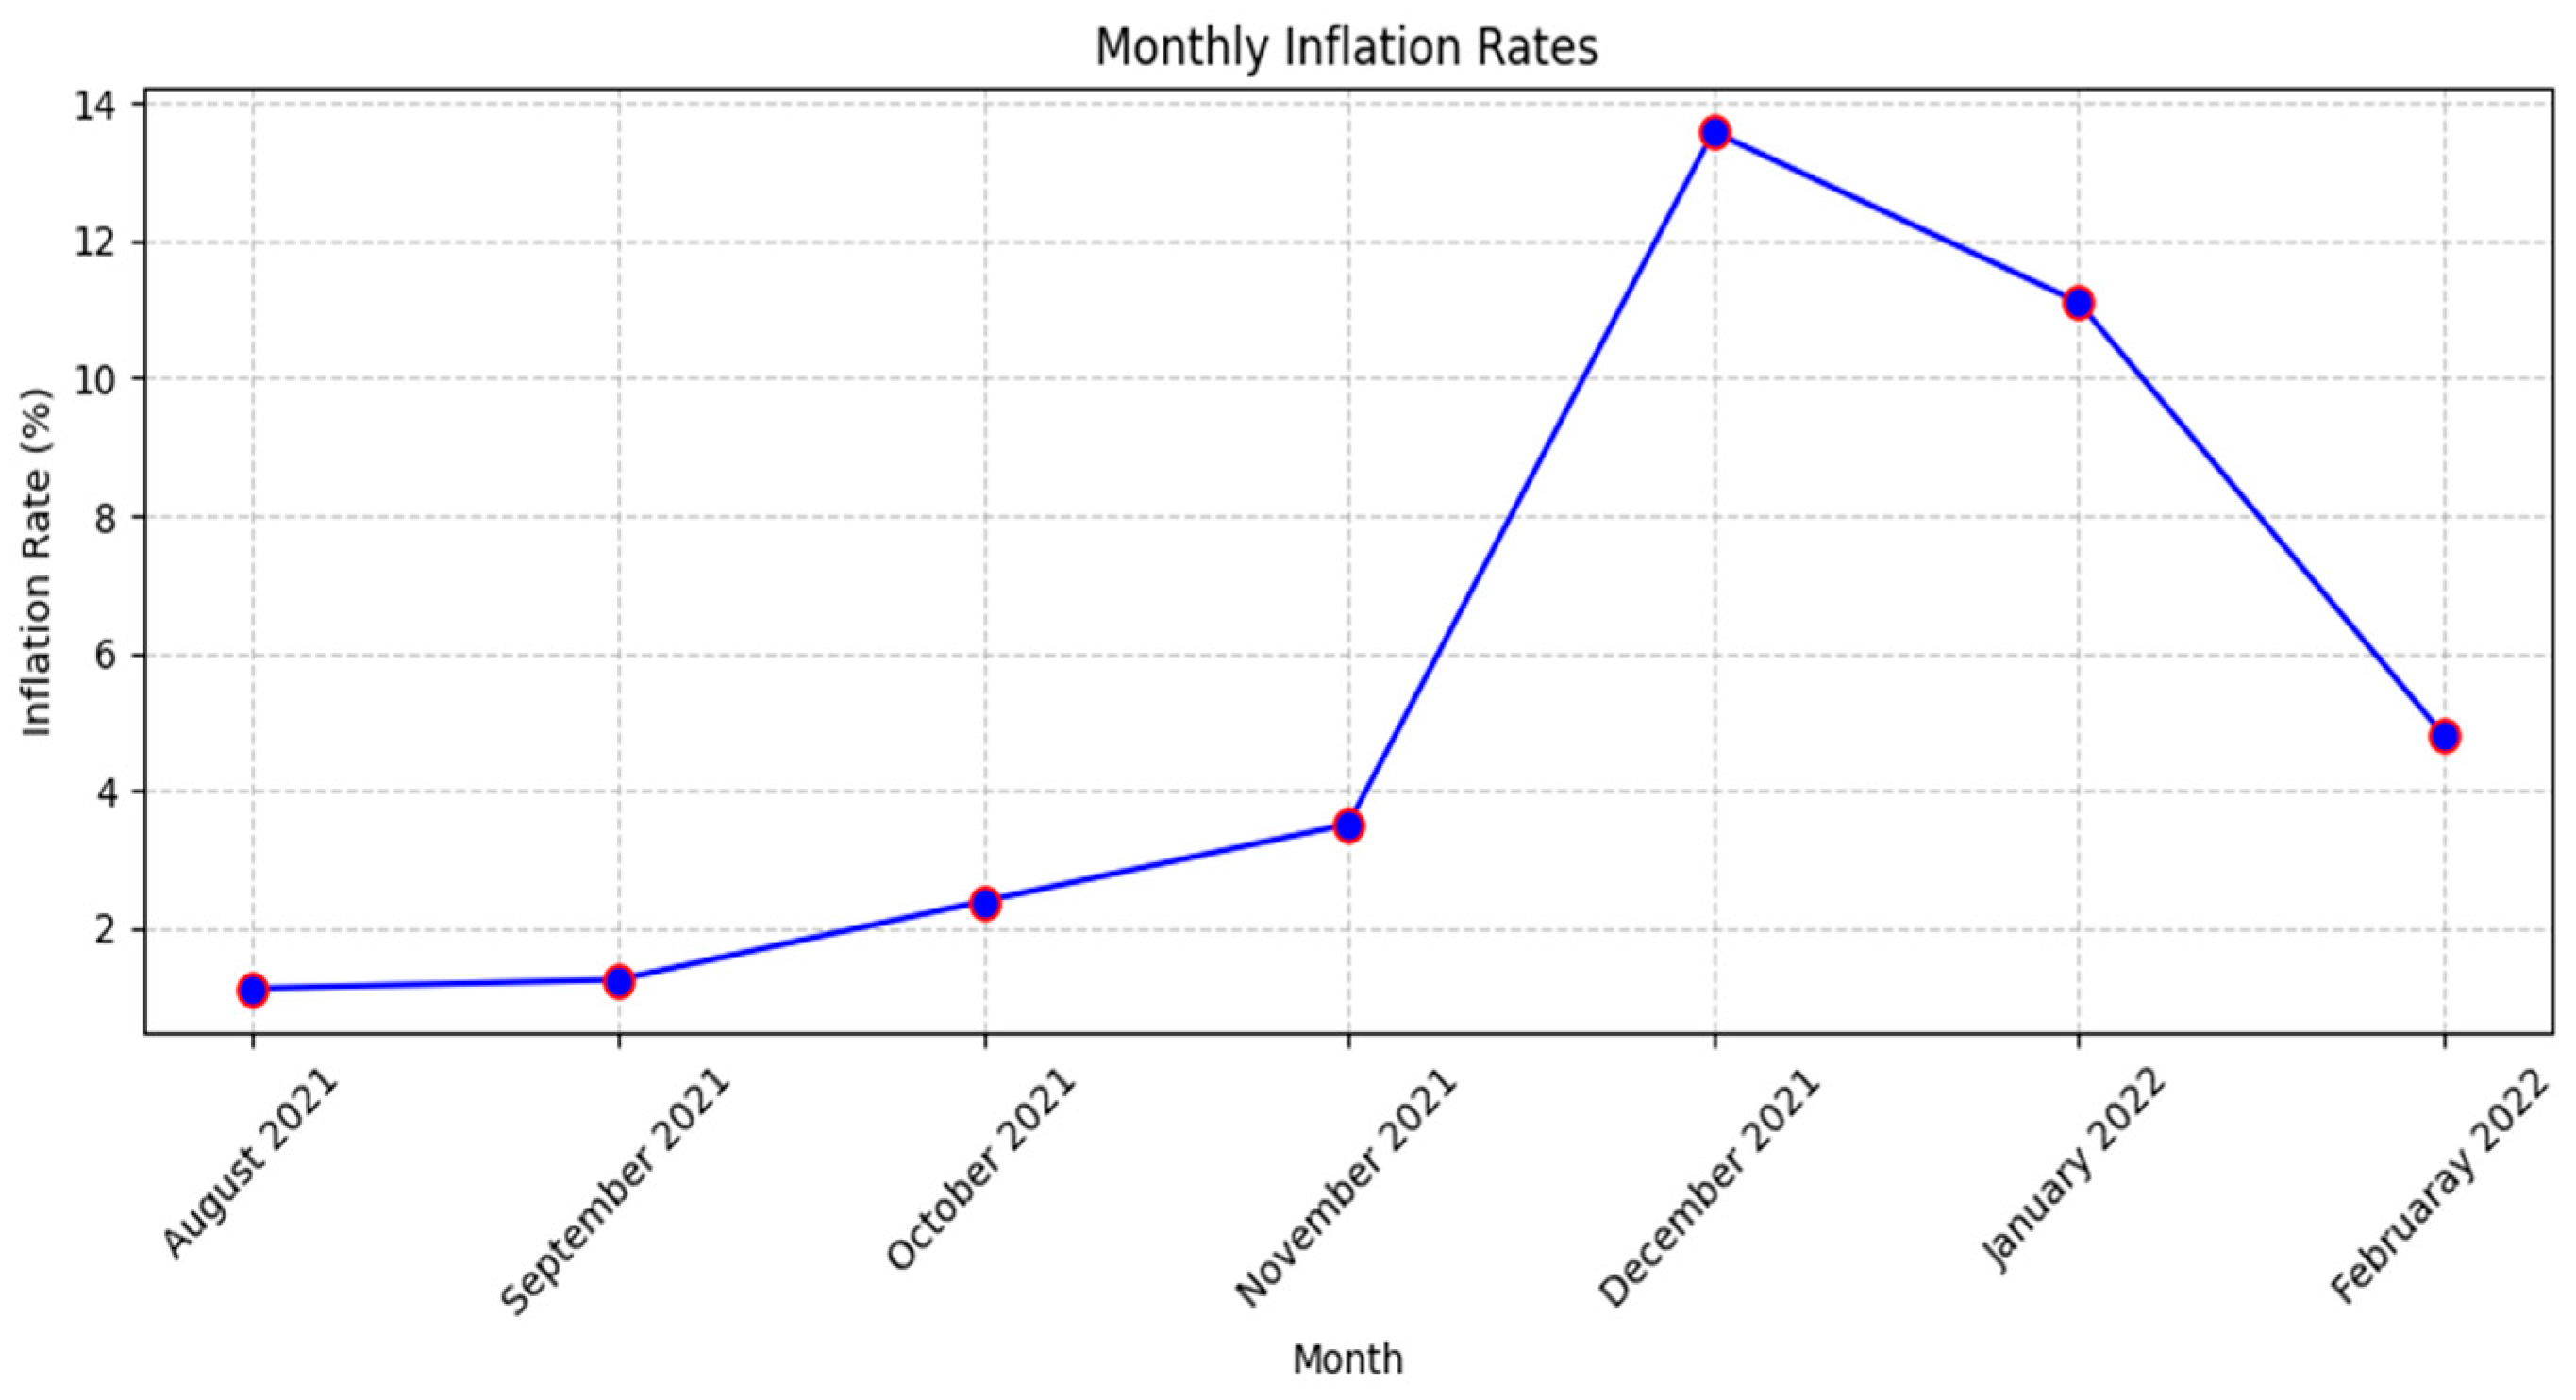
For Turkey, the analysis period covered the six-month period from August 2021 to January 2022 for the six-month DDI analyses of news coverage with RSS. The monthly inflation data published by TurkStat covered the period from August 2021 to February 2022 and are shown in Table 2.
Figure 6 shows the seven-month data of the monthly changes in the annual inflation rates of the TURKSTAT Consumer Price Index (CPI) from August 2021 to February 2022.
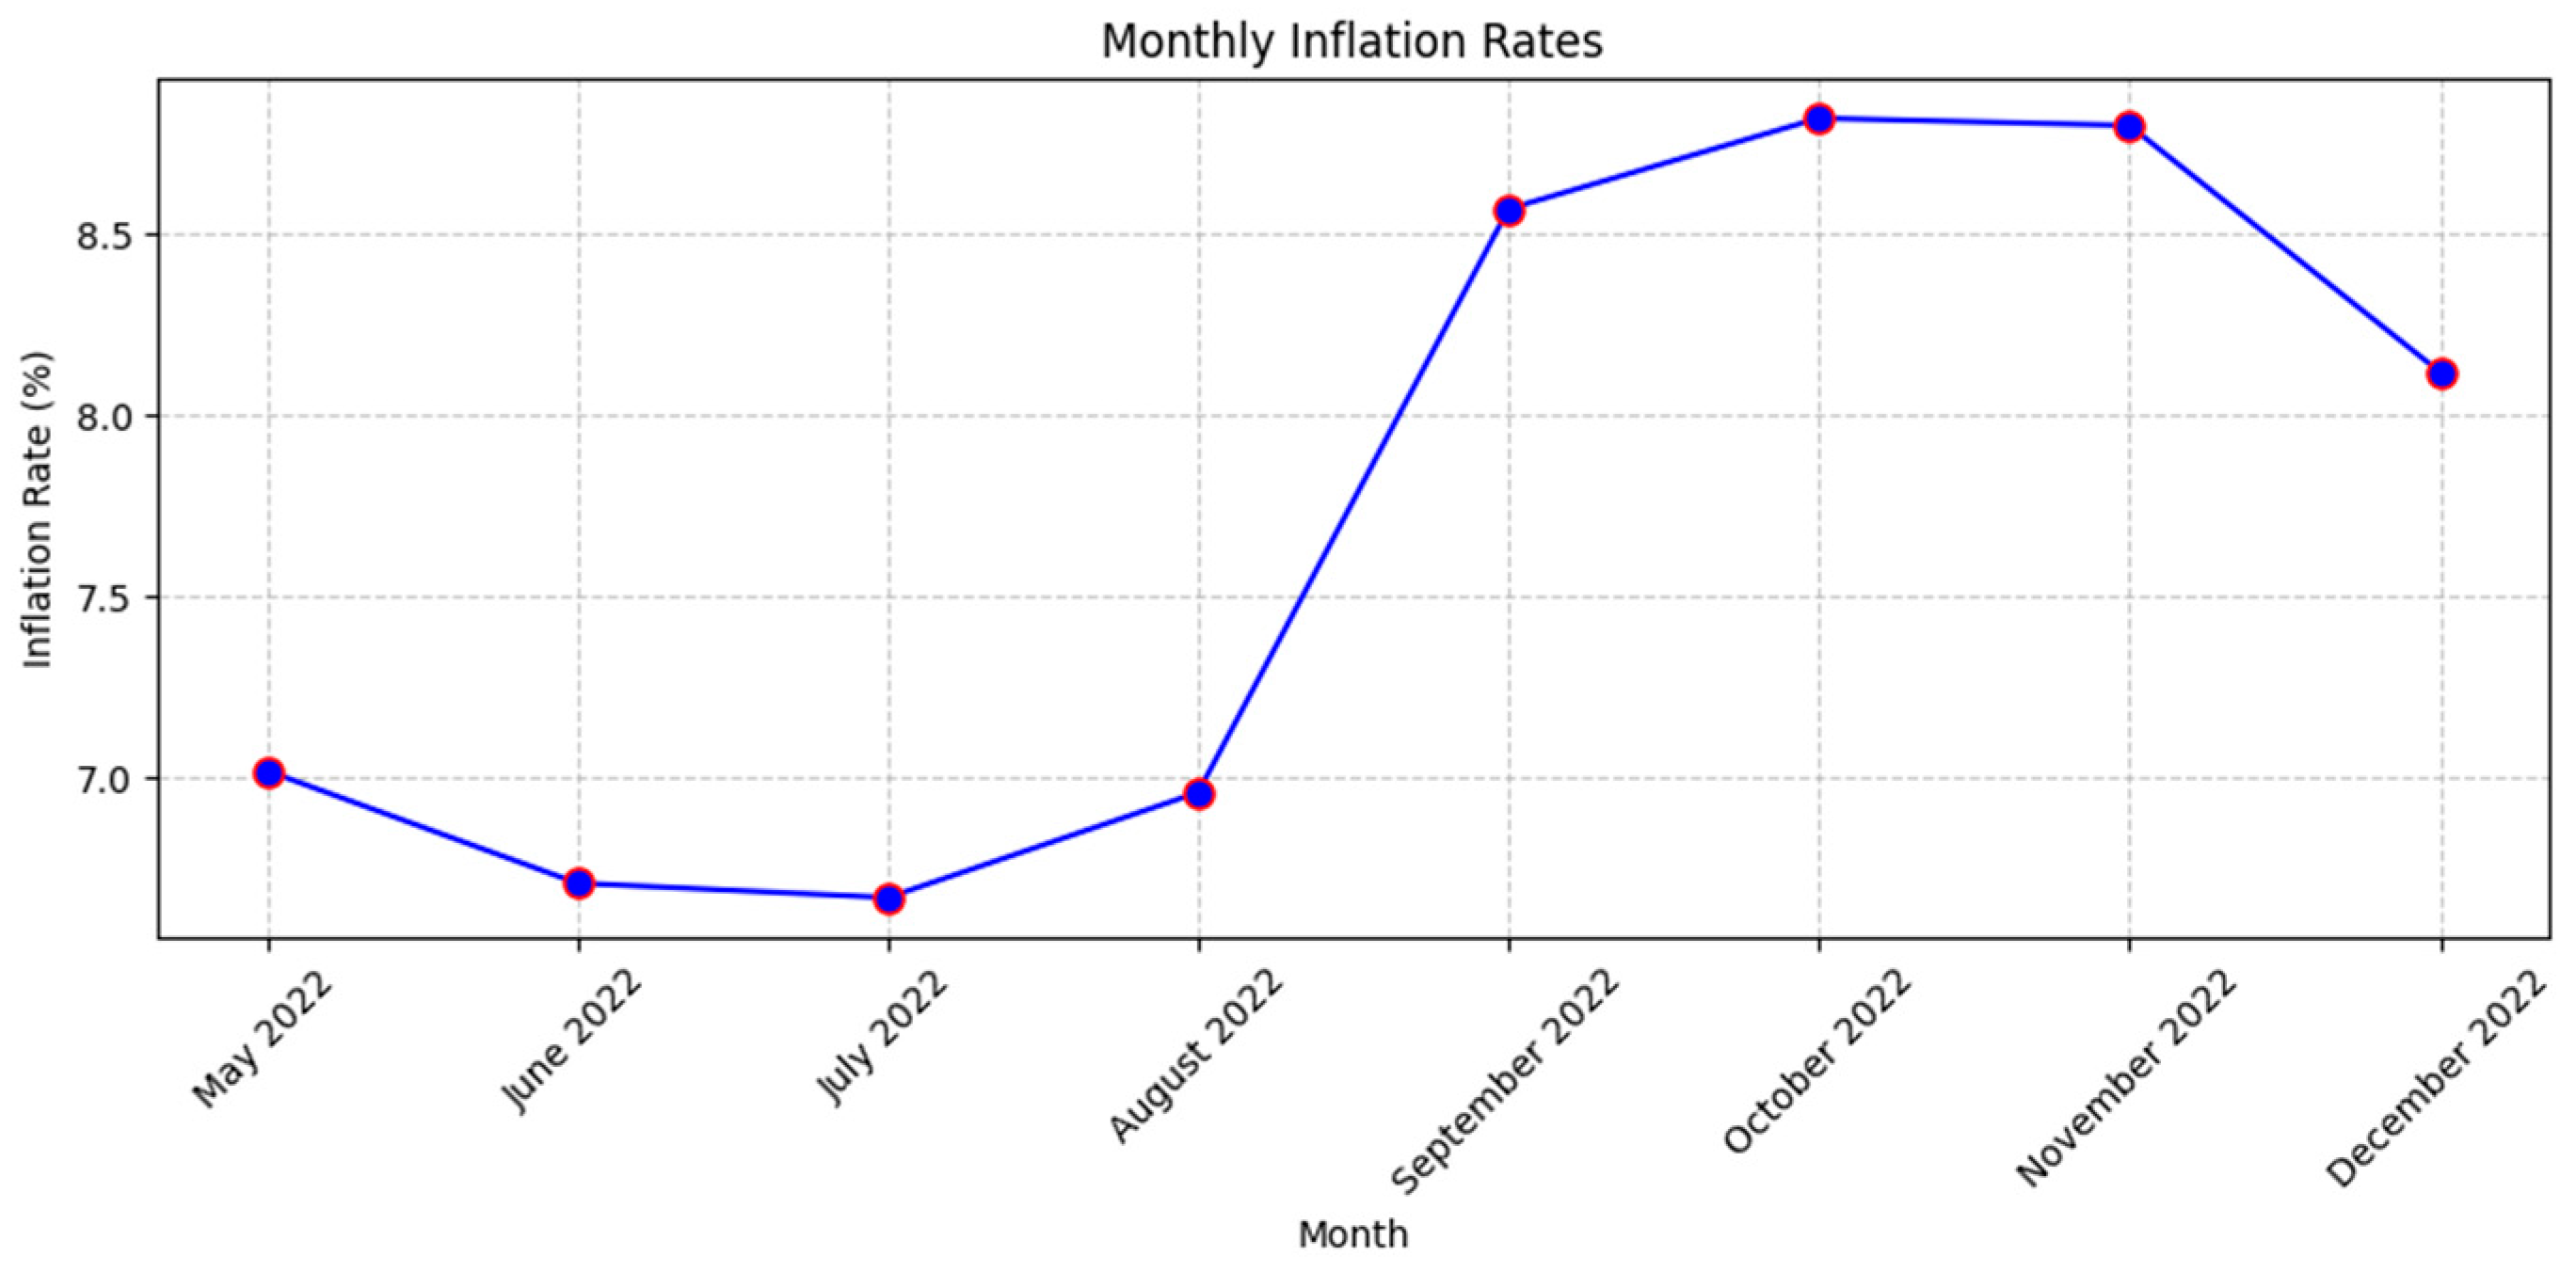
For Germany, the analysis period covers the eight-month period from May 2022 to December 2022 for the DDI analysis of RSS messages. The monthly inflation data made available to the public by DESTATIS covers the period from May 2022 to December 2022 and are shown in Table 3.
Figure 7 shows the monthly changes in the DESTATIS Consumer Price Index (CPI) annual inflation rates for the eight months from May 2022 to December 2022.
Notably, inflation in Turkey reached its highest level in December 2021 and then started to decline rapidly. In Germany, the high inflation continued to grow in September 2022 and then started to decline. This brings the thought that the two analyses will be different.

3. Results

This chapter discusses the results of the analysis of Turkey’s monthly economic news for the period from August 2021 to January 2022 and Germany’s monthly economic news for the period from May 2022 to November 2022, which are the focus of this paper. The results obtained show the effects of the proposed approaches and methods. This study uses Turkey’s RSS news data from August 2021 to January 2022 and Germany’s RSS news data from May 2022 to November 2022 to identify economic crisis periods with the help of NLP models. December 2021 for Turkey and September 2022 for Germany, according to many sources, are periods when the increase in inflation becomes evident. Experimental results were obtained using three different natural language processing models to evaluate the similarity of certain unbiased economic terms on RSS data from news channels. In addition, three different text types were created from the RSS data and similarity rates were calculated with these three NLP models.

3.1. Parameter Settings of the Models Used

Certain parameters are tuned for natural language processing (NLP) models. The BERT model represents text as vectors with 768 dimensions. When it comes to improving BERT’s performance in natural language processing tasks, this aspect is often selected. The Word2Vec model produces 300-dimensional vectors by using a pre-trained model that has been trained on the Google News dataset. Word2Vec is often used in academic publications due to its ability to effectively represent text in a lower dimensional space. Similarly, the GloVe model uses 300-dimensional vectors. GloVe’s ability to accurately represent the connections between word vectors comes from its extensive training dataset of web content.

3.2. Analyses

Let us start with an analysis of the RSS data in Turkey. Figure 8 shows the monthly changes in similarity scores in three language models of the phrase “There is an economic crisis” and the normalized inflation rates between August 2021 and January 2022.
If we look at the graph, we can see that while the similarity rates decreased rapidly in October 2021, they increased rapidly in November and reached the highest values. This not only shows that the similarity rates were highest in November but also that the month with the highest rate of change was November 2021. December 2021 shows that the high inflation rates in December 2021 were felt in November 2021 and that there was more news about it in the media and more mentions of the economic crisis in terms of content.
Figure 9 shows the monthly changes in the similarity scores calculated with three different language models for the expression “There is an economic crisis” in the same period. The purpose is to show the relationship between the rates of change and the rates of inflation. Again, the increase in the similarity scores of all models can be seen more clearly in November, just before December.
The point to note in the graph of changes in similarities is that the point where the changes reach the highest point in the positive direction is November 2021. That is, just before December 2021, when high inflation was experienced.
If we shift the normalized inflation rates in Figure 9 back one month, we obtain the graph in Figure 10. Here, we see that the correlations between the model similarity ratios and the normalized inflation rates are high. The correlation of the similarity ratios of the BERT model, which has the highest value of similarity ratios and is trained with lemmatized texts, with normalized inflation rates is 0.7757496734223899. This shows that monthly news rates have a high correlation with inflation rates rolled back 1 month.
The correlations of all models with 1-month shifted normalized inflation rates are shown in Table 4.
The high correlation of the monthly rates of change of the similarity rates generated by almost every model for each text type with the shifted inflation rates leads to the conclusion that the effects of inflation increases and decreases on the market are felt in society in advance.
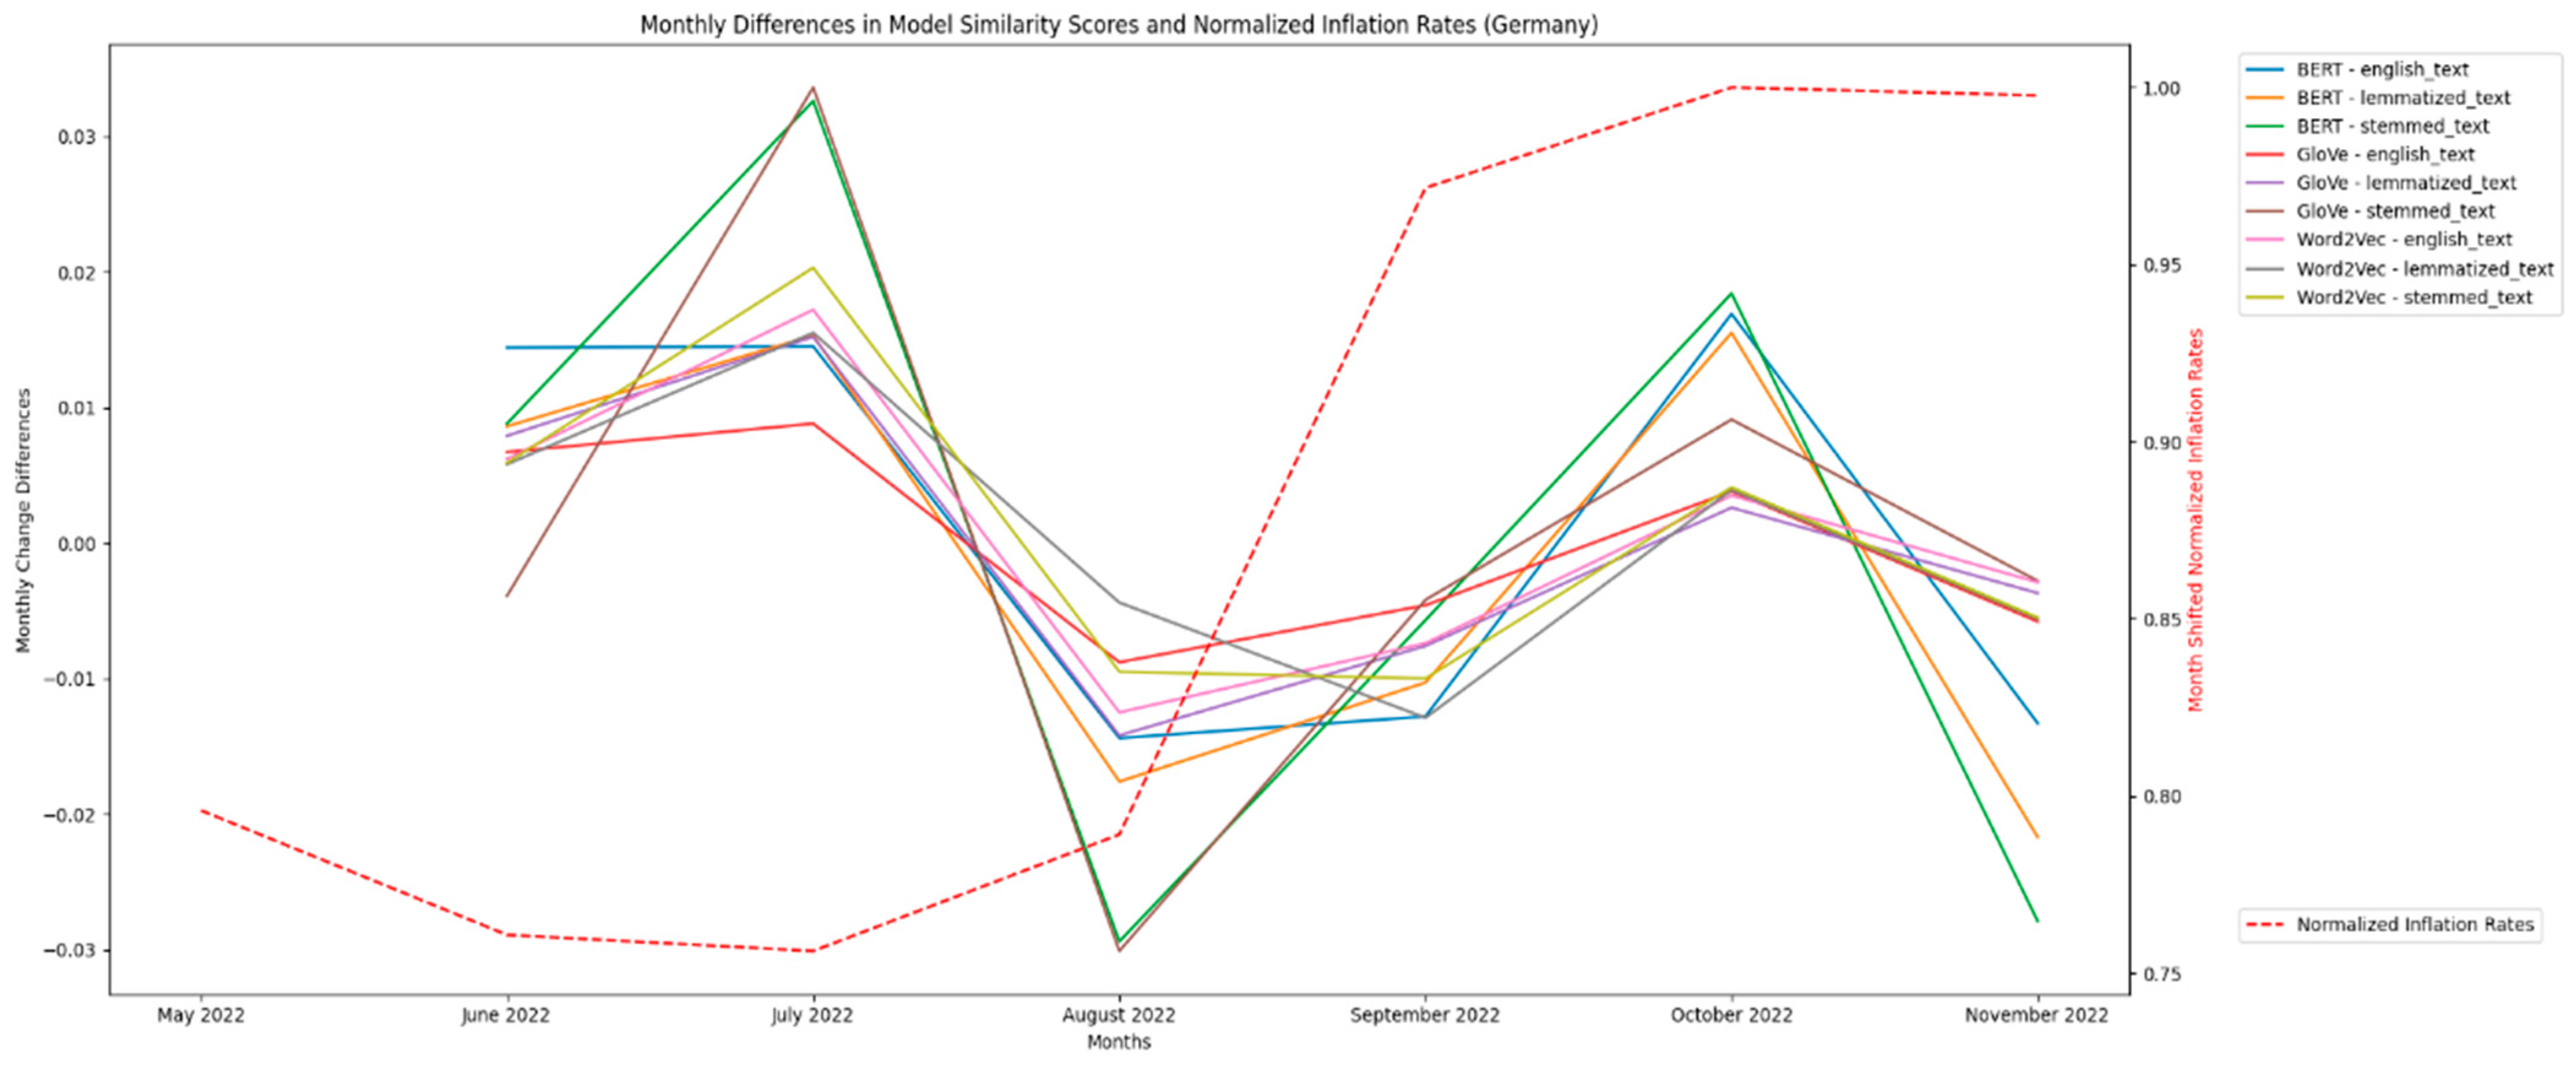
Let us now continue with the analysis of RSS data from Germany. Figure 11 shows the monthly changes in the similarity scores of the phrase “There is an economic crisis” in three language models and the normalized inflation rates between May 2022 and November 2022.
The graph shows that the similarity ratios increase in July 2022, and the similarity ra-tios in almost all models reach their highest value in this month. This is just before the high inflation that starts in September 2022 and lasts until December 2022.
Figure 12 shows the monthly changes in the similarity scores calculated with three different language models for the phrase “There is an economic crisis” in the same period. The relationship between the rates of change and the inflation rates is highlighted. Again, the increase in similarity scores of all models in July, just before September, is easier to see.
As can be seen in the graph, the month with the highest change in similarity ratios is July 2022. This month clearly shows that the news about the economic crisis increased in the media and that the effects of the economic crisis started to be felt in advance.
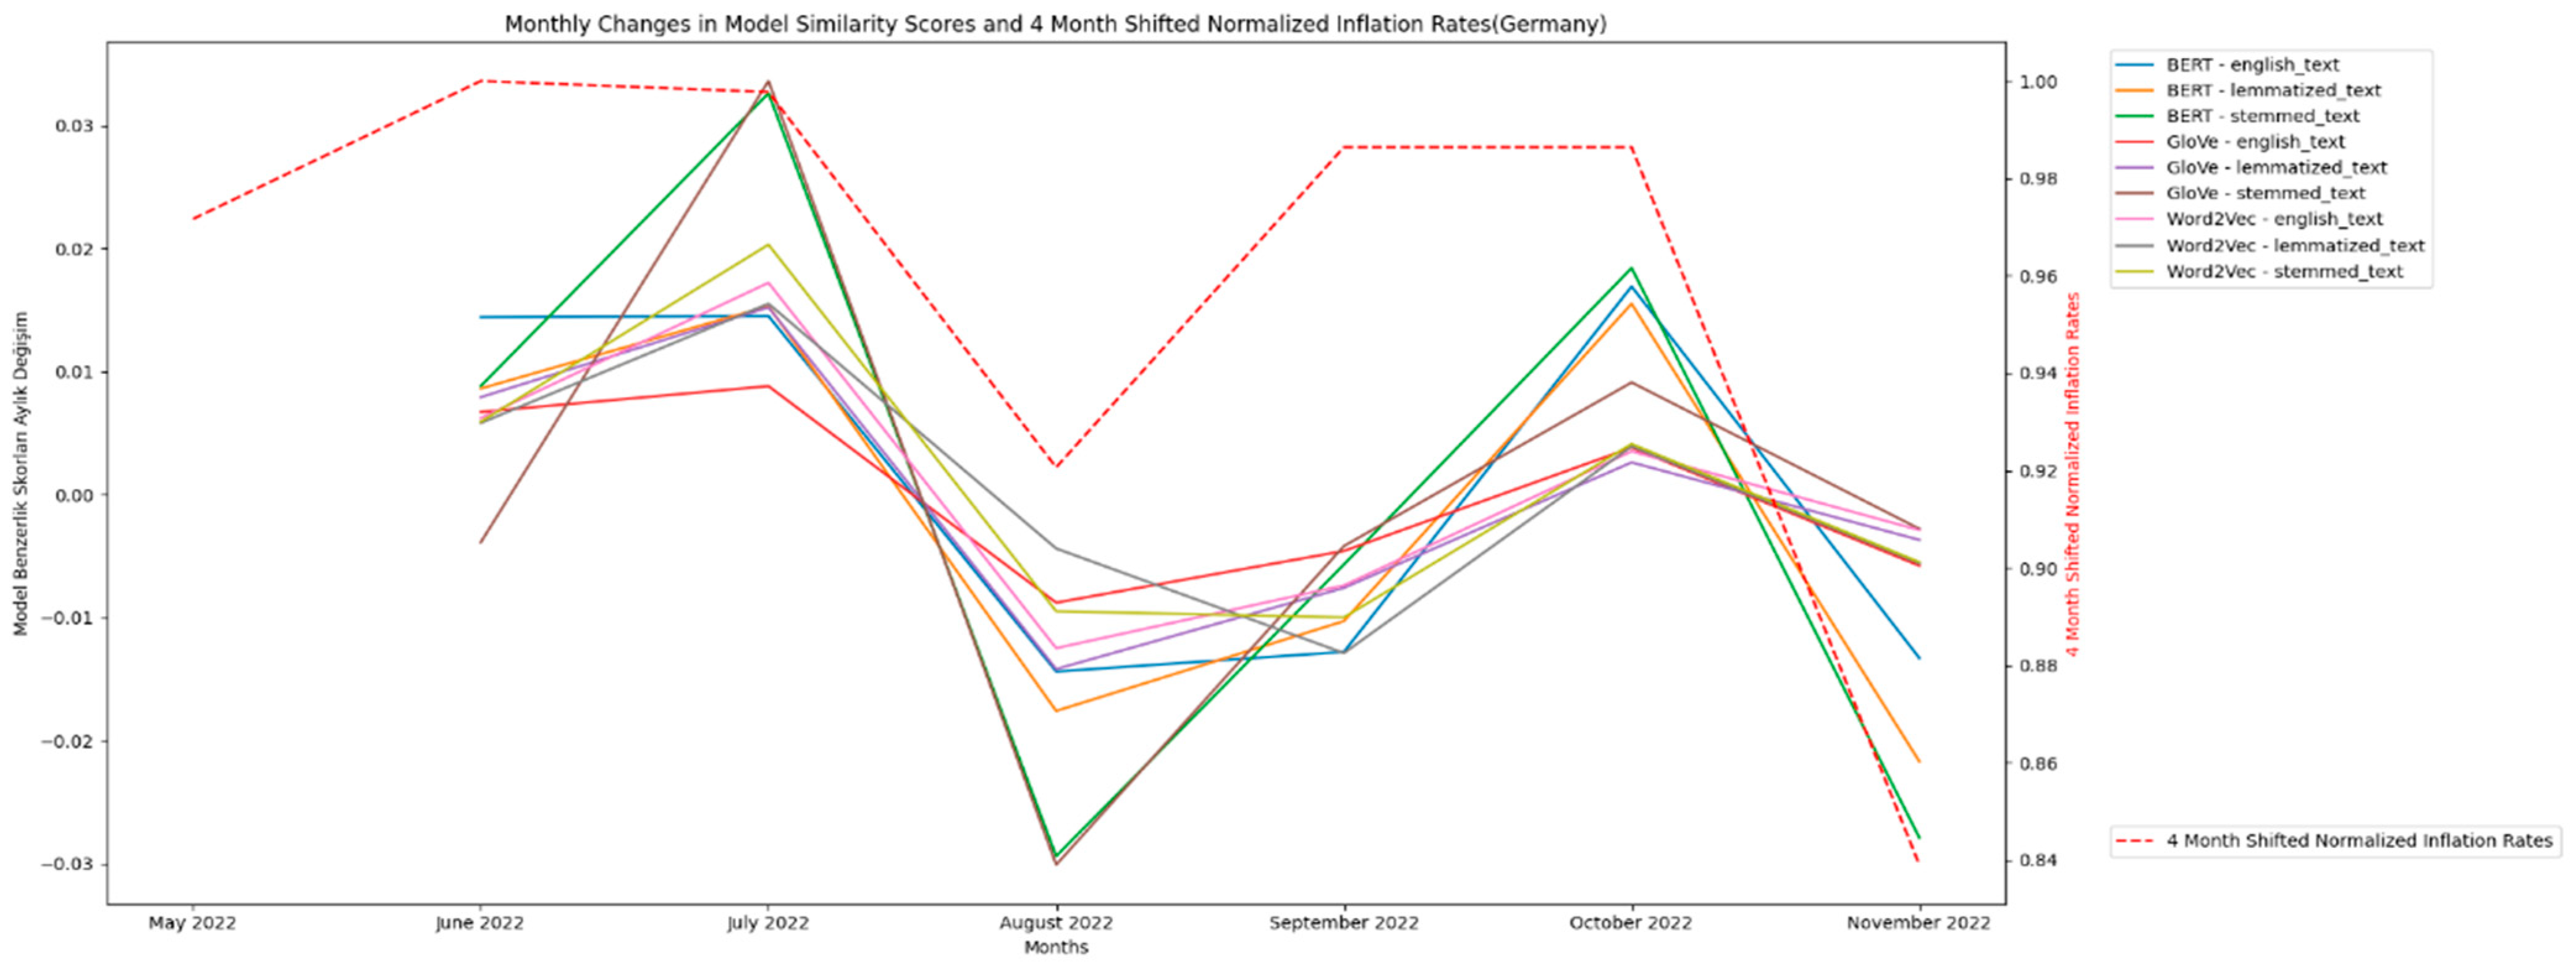
If we shift the normalized inflation rates in Figure 12 back 4 months, we obtain the graph in Figure 13. We can see that the correlations between the model similarity ratios and the normalized inflation rates are high. The correlation of the similarity ratios of the model trained with the lemma-rooted texts of BERT, which has the highest value of similarity ratios, with the normalized inflation rates is 0.8033144229669527. This shows that the monthly news rates have a high correlation with the inflation rates backdated 4 months.
The correlations of all models with four-month backward normalized inflation rates are shown in Table 5.
Figure 14 shows the heat map of the correlation value of the language representation models of both economic crises with the estimated inflation rates. Here, it represents the increase from dark blue to dark red.
The correlation between NLP-based forecasts and inflation rates provides important insights for the formulation of proactive economic policies. In terms of performance and reliability, BERT and GloVe models show the highest correlation with inflation rates, especially in unrooted and lemmatized news, indicating that these models can reliably capture signals related to economic volatility in Turkish news data. In Germany, BERT training with lemma-rooted news shows the highest performance. These models can be used as early warning systems with these aspects. Language representation models can provide insights by sector, revealing patterns across economic domains. If inflation indicators are closely linked to particular sectors, tailored subsidies or tax changes can be implemented to mitigate their effects. From a cross-national adaptation perspective, the efficacy of language representation models in one nation suggests that analogous NLP frameworks can be tailored for another nation, thereby enhancing its ability to address inflationary threats stemming from global or regional economic adversities. To mitigate economic volatility, it provides governments and central banks with a mechanism to track fluctuations in sentiment about inflationary pressures. By scrutinizing public narratives, policymakers can gain insight into inflation expectations and formulate communication strategies to stabilize those expectations. This strategy is constrained by the inherent biases and shortcomings of news. By incorporating data from social media, consumer confidence surveys, and foreign economic indicators, this method can be enhanced to provide a more comprehensive perspective on economic threats.

4. Discussion

Instead of sentiment analysis, which produces a one-dimensional result from sentences, semantic analysis extracts the deep meaning of a sentence and adds multiple dimensions to it. The results show that the patterns of premonitory signs of possible economic crises have already begun to emerge and can be captured by language representation models.
When the results of the analysis are examined, it is found that there are significant differences in the rates of change of the similarity scores of the models depending on the way the texts are processed. While some models gave very good results on lemma-rooted data, other models gave very good results on stem-rooted texts. This shows the importance of the way the texts are processed. This provides important information about how NLP models perceive the morphological structure of language.
The performance of the BERT model is particularly striking when all the ratios are compared. The significant change in similarity scores seen in November 2021 may be an indicator of rising inflation, suggesting that these models could potentially be used to identify periods of economic crisis. According to the results of the model, high similarity values of certain terms can indicate the presence of economic crises. These results show that NLP models can be effectively used to identify and monitor economic crises, and it also shows that NLP models can play an important role in the early detection of economic crises.
This study was conducted on the most recent economic crises. There are several reasons for choosing these two countries. Turkey has experienced several economic crises in the last three decades. Germany, on the other hand, has not experienced deep economic crises like Turkey in the last three decades. These economic crises have had a shocking effect in these countries and, as a result, their media have published news about economic crises intensively. Apart from this, in other countries that are in a permanent economic crisis, since it will not have a serious effect, the news about it will not be at the desired level in the media and it will be very difficult to detect the crisis. Examples of this are Venezuela and Argentina. In these countries, economic crises that have become permanent and normal will not be published in the media. This will make it almost impossible to detect economic crises with NLP. In order to generalize the methodology, the frequency of countries facing economic crises should be considered. If this frequency is very high, the methodology becomes very difficult to apply. If this frequency is low, the methodology is very applicable and has a very high rate of achieving very good results.
This study makes a significant contribution to the literature in terms of both approach and application. The use of pre-trained language representation models such as BERT, GloVe and Word2Vec for economic forecasting provides a novel method for semantic analysis and the investigation of semantic correlations. In this project, Turkish and German news data are translated into English and analyzed using language representation models. This is achieved by a sophisticated preprocessing method that guarantees high precision and uniformity. Furthermore, by detecting semantic patterns in financial news and analyzing linguistic aspects, robust relationships between semantic analysis and inflation trends are found. These results provide a comparable and reusable paradigm for understanding economic crises. The study illustrates the relevance of NLP in economic forecasting by integrating macroeconomic analysis with trends in language-based semantic analysis. It provides a reproducible and extensible methodology that integrates semantic analysis with inflation indicators, establishing a foundation for application to additional countries and datasets.
This study has certain methodological limitations. The neutrality and representativeness of the news data examined may affect the accuracy of the results. The methods used in the study rely on the translation of news texts into English, which has certain limitations. The process of language translation can result in the loss of context or meaning, thereby affecting model performance. Furthermore, although English language representation models were used, these models may not fully capture the grammatical and cultural characteristics of the source languages (Turkish or German).
In future studies, this study can be improved by taking the opinions of a large mass such as society through semantic analysis to be made with information such as posts, comments, etc., to be taken from social media. Other economic crises that cannot be included in this article also show that there is a public awareness of the economic crisis in society. And it has been shown that in societies that have been exposed to economic crises for a long time, this news is no longer broadcast due to desensitization and it is difficult to capture economic crisis patterns. A future study can be conducted on these issues. Another question is how to predict long-lasting economic crises. In addition, studying social media data and integrating textual information with economic indicators can improve the effectiveness of crisis prediction models. Hybrid models can mitigate information loss due to language translation and improve predictive effectiveness.

Author Contributions

Conceptualization, S.K.; methodology, K.K.; software, K.K.; validation, S.K.; formal analysis, K.K.; investigation, S.K.; resources, K.K.; writing—original draft preparation, K.K.; writing—review and editing, K.K.; visualization, S.K.; supervision, S.K. All authors have read and agreed to the published version of the manuscript.

Funding

This research received no external funding.

Institutional Review Board Statement

Not applicable.

Informed Consent Statement

Not applicable.

Data Availability Statement

The data presented in this study are available on request from the corresponding author.

Conflicts of Interest

The authors declare no conflicts of interest.

References

  1. Naghdi, Y.; Kaghazian, S.; Kakoei, N. Global Financial Crisis and Inflation: Evidence from OPEC. Middle-East J. Sci. Res. 2012, 11, 525–530. [Google Scholar]
  2. Reynard, S. Assessing Potential Inflation Consequences of QE after Financial Crises. Peterson Inst. Int. Econ. Work. Pap. 2012, 12, 22. [Google Scholar] [CrossRef]
  3. Bijapur, M. Do Financial Crises Erode Potential Output? Evidence from OECD Inflation Responses. Econ. Lett. 2012, 117, 700–703. [Google Scholar] [CrossRef]
  4. Reznikov, R. Data Science Methods and Models in Modern Economy. SSRN Electron. J. 2024. Available online: https://papers.ssrn.com/sol3/Delivery.cfm?abstractid=4851627 (accessed on 16 December 2024). [CrossRef]
  5. Qi, L. FITE4801 Final Year Project. The University of Hong Kong. 2024. Available online: https://wp2023.cs.hku.hk/fyp23021/wp-content/uploads/sites/22/FITE4801_Interim_Report_fyp23021.pdf (accessed on 16 December 2024).
  6. Bodislav, D.A.; Popescu, G.; Niculescu, I.; Mihalcea, A. The Integration of Machine Learning in Central Banks: Implications and Innovations. Eur. J. Sustain. Dev. 2024, 13, 23. [Google Scholar] [CrossRef]
  7. Farahani, M.S. Analysis of Business Valuation Models with AI Emphasis. Sustain. Econ. 2024, 2, 132. [Google Scholar] [CrossRef]
  8. Ginsburg, R. Harnessing AI for Accurate Financial Projections. ResearchGate. 2024. Available online: https://www.researchgate.net/profile/Husam-Rajab-4/publication/385385326_Harnessing_AI_for_Accurate_Financial_Projections/links/6722bf12ecbbde716b4c5469/Harnessing-AI-for-Accurate-Financial-Projections.pdf (accessed on 16 December 2024).
  9. Ari, M.A.; Chen, S.; Ratnovski, M.L. The Dynamics of Non-Performing Loans During Banking Crises: A New Database; IMF Working Paper; International Monetary Fund: Washington, DC, USA, 2019. [Google Scholar]
  10. Kilimci, Z.H.; Duvar, R. An Efficient Word Embedding and Deep Learning Based Model to Forecast the Direction of Stock Exchange Market Using Twitter and Financial News Sites: A Case of Istanbul Stock Exchange (BIST 100). IEEE Access 2020, 8, 188186–188198. [Google Scholar] [CrossRef]
  11. Othan, D.; Kilimci, Z.H.; Uysal, M. Financial Sentiment Analysis for Predicting Direction of Stocks Using Bidirectional Encoder Representations from Transformers (BERT) and Deep Learning Models. In Proceedings of the International Conference on Innovative Intelligent Technologies (ICIT), Istanbul, Turkey, 5–6 December 2019; pp. 30–35. [Google Scholar]
  12. Atak, A. Exploring the Sentiment in Borsa Istanbul with Deep Learning. Borsa Istanb. Rev. 2023, 23, S84–S95. [Google Scholar] [CrossRef]
  13. Hellwig, K.-P. Predicting Fiscal Crises: A Machine Learning Approach; International Monetary Fund: Washington, DC, USA, 2021. [Google Scholar]
  14. Chen, M.; DeHaven, M.; Kitschelt, I.; Lee, S.J.; Sicilian, M.J. Identifying Financial Crises Using Machine Learning on Textual Data. J. Risk Financ. Manag. 2023, 16, 161. [Google Scholar] [CrossRef]
  15. Chen, Y.; Kelly, B.T.; Xiu, D. Expected Returns and Large Language Models. SSRN 2022. Available online: https://ssrn.com/abstract=4416687 (accessed on 16 December 2024).
  16. Reimann, C. Predicting Financial Crises: An Evaluation of Machine Learning Algorithms and Model Explainability for Early Warning Systems. Rev. Evol. Polit. Econ. 2024, 1, 1–33. [Google Scholar] [CrossRef]
  17. Nyman, P.; Tuckett, D. Measuring Financial Sentiment to Predict Financial Instability: A New Approach Based on Text Analysis; University College London: London, UK, 2015. [Google Scholar]
  18. Usui, M.; Ishii, N.; Nakamura, K. Extraction and Standardization of Patient Complaints from Electronic Medication Histories for Pharmacovigilance: Natural Language Processing Analysis in Japanese. JMIR Med. Inform. 2018, 6, e11021. [Google Scholar] [CrossRef]
  19. Bird, S.; Klein, E.; Loper, E. Natural Language Processing with Python: Analyzing Text with the Natural Language Toolkit; O’Reilly Media: Sebastopol, CA, USA, 2009. [Google Scholar]
  20. Manning, C.D.; Raghavan, P.; Schütze, H. Boolean Retrieval. In Introduction to Information Retrieval; Cambridge University Press: Cambridge, UK, 2008; pp. 1–18. [Google Scholar]
  21. Harris, Z. Distributional Hypothesis. Word World 1954, 10, 146–162. [Google Scholar] [CrossRef]
  22. Pennington, J.; Socher, R.; Manning, C.D. GloVe: Global Vectors for Word Representation. In Proceedings of the 2014 Conference on Empirical Methods in Natural Language Processing (EMNLP), Doha, Qatar, 25–29 October 2014. [Google Scholar]
  23. Devlin, J.; Chang, M.-W.; Lee, K.; Toutanova, K. BERT: Pre-training of Deep Bidirectional Transformers for Language Understanding. arXiv 2018, arXiv:1810.04805. [Google Scholar]
  24. Vaswani, A.; Shazeer, N.; Parmar, N.; Uszkoreit, J.; Jones, L.; Gomez, A.N.; Kaiser, Ł.; Polosukhin, I. Attention Is All You Need. Adv. Neural Inf. Process. Syst. 2017, 30. [Google Scholar] [CrossRef]
  25. Dai, Z.; Callan, J. Deeper Text Understanding for IR with Contextual Neural Language Modeling. In Proceedings of the 42nd International ACM SIGIR Conference on Research and Development in Information Retrieval, Paris, France, 21–25 July 2019. [Google Scholar]
  26. Bao, T.; Wang, S.; Li, J.; Liu, B.; Chen, X. A BERT-Based Hybrid Short Text Classification Model Incorporating CNN and Attention-Based BiGRU. J. Organ. End User Comput. 2021, 33, 1–21. [Google Scholar] [CrossRef]
  27. Sun, C.; Qiu, X.; Huang, X. How to Fine-Tune BERT for Text Classification? In Proceedings of the 18th China National Conference on Chinese Computational Linguistics (CCL 2019), Kunming, China, 18–20 October 2019.
  28. Shi, Z.; Yuan, Z.; Wang, Q.; Song, J.; Zhang, J. News Image Text Classification Algorithm with Bidirectional Encoder Representations from Transformers Model. J. Electron. Imaging 2023, 32, 011217. [Google Scholar] [CrossRef]
  29. Khandve, S.I.; Bhave, S.; Nene, R.; Kulkarni, R.V. Hierarchical Neural Network Approaches for Long Document Classification. In Proceedings of the 14th International Conference on Machine Learning and Computing (ICMLC 2022), Guangzhou, China, 18–20 February 2022. [Google Scholar]
  30. Glass, M.; Subramanian, S.; Wang, Y.; Smith, N.A. Span Selection Pre-Training for Question Answering. arXiv 2019, arXiv:1909.04120. [Google Scholar]
  31. Abdel-Salam, S.; Rafea, A. Performance Study on Extractive Text Summarization Using BERT Models. Information 2022, 13, 67. [Google Scholar] [CrossRef]
  32. Chung, Y.-A.; Weng, S.-W.; Chen, Y.-S.; Glass, J. Audio Word2Vec: Unsupervised Learning of Audio Segment Representations Using Sequence-to-Sequence Autoencoder. arXiv 2016, arXiv:1603.00982. [Google Scholar]
  33. Tulu, C.N. Experimental Comparison of Pre-Trained Word Embedding Vectors of Word2Vec, Glove, FastText for Word Level Semantic Text Similarity Measurement in Turkish. Adv. Sci. Technol. Res. J. 2022, 16, 45–51. [Google Scholar] [CrossRef]
  34. Juneja, P.; Gupta, S.; Anand, A. Context-Aware Clustering Using GloVe and K-Means. Int. J. Softw. Eng. Appl. 2017, 8, 21–38. [Google Scholar] [CrossRef]
  35. Mafunda, M.C.; Mhlanga, S.; Dube, A.; Dlodlo, M. A Word Embedding Trained on South African News Data. Afr. J. Inf. Commun. 2022, 30, 1–24. [Google Scholar] [CrossRef]
  36. Kusum, S.P.P.; Soehardjo, S.K. Sentiment Analysis Using Global Vector and Long Short-Term Memory. Indones. J. Electr. Eng. Comput. Sci. 2022, 26, 414–422. [Google Scholar] [CrossRef]
  37. Nguyen, T.H.; Shirai, K.; Velcin, J. Sentiment Analysis on Social Media for Stock Movement Prediction. Expert Syst. Appl. 2015, 42, 9603–9611. [Google Scholar] [CrossRef]
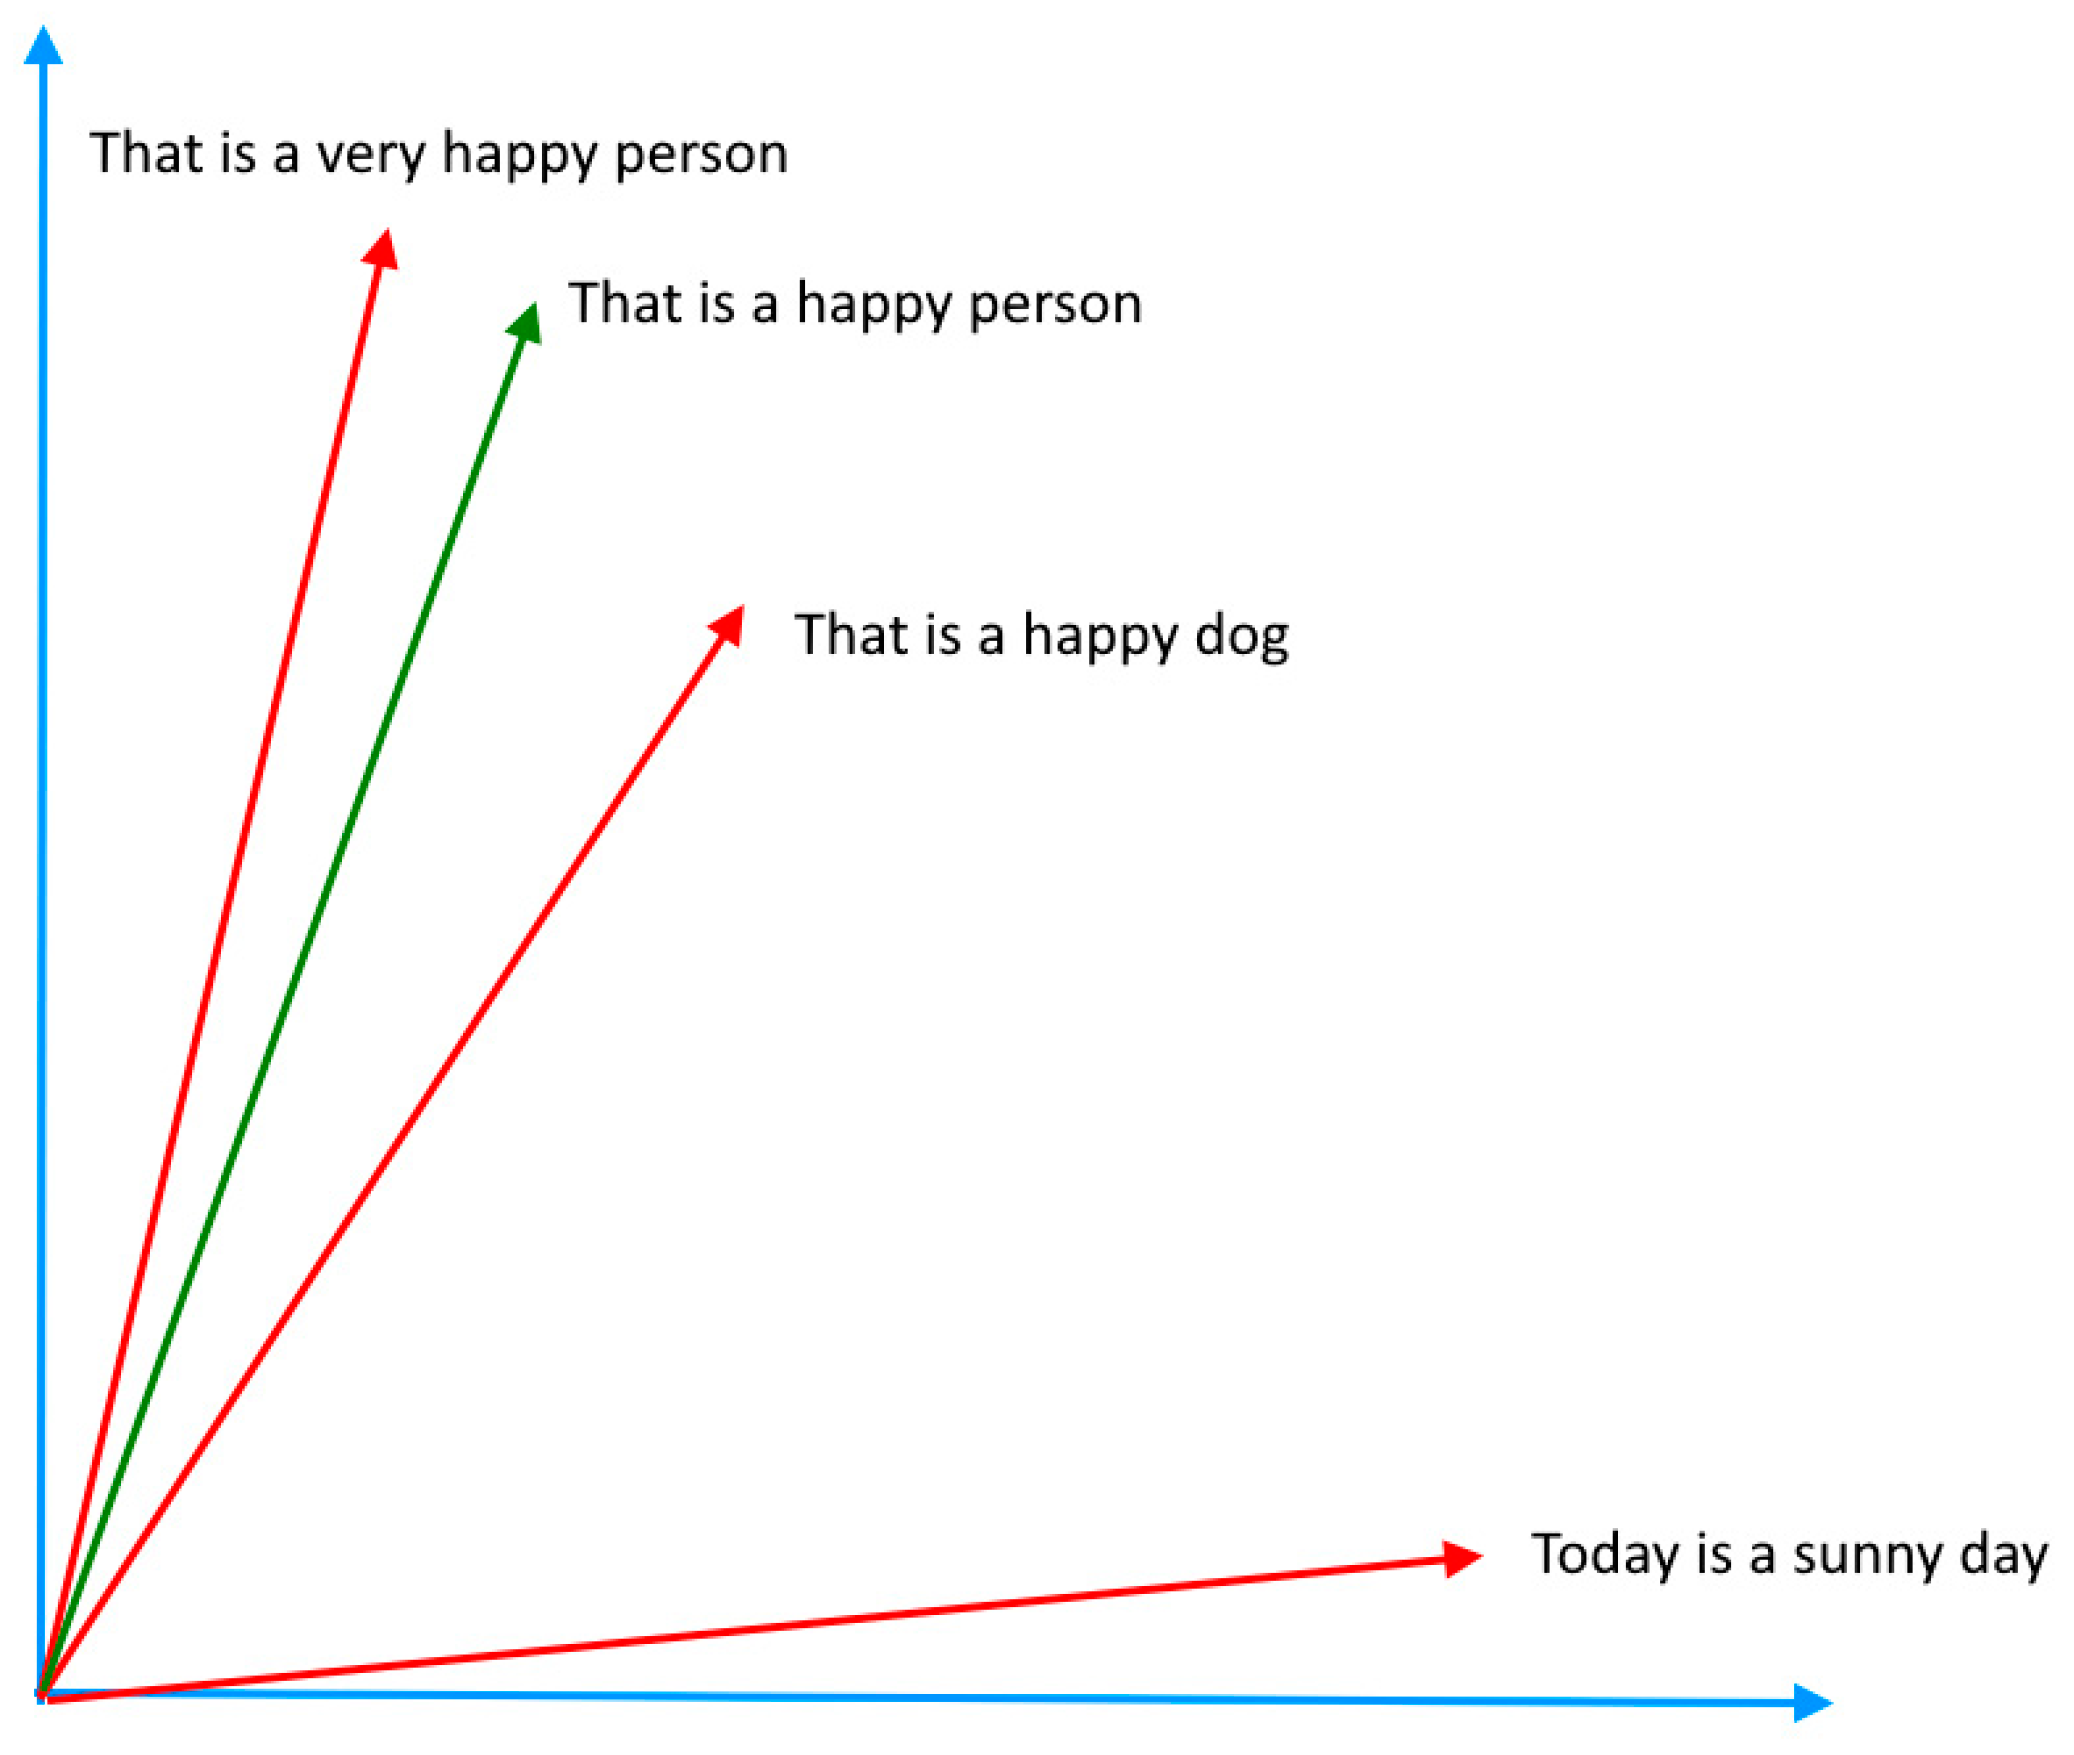
Figure 1. Cosine similarity.
Sustainability 17 01536 g001
Figure 2. Word embedding.
Sustainability 17 01536 g002
Figure 3. Sentence embedding.
Sustainability 17 01536 g003
Figure 4. Transformer model architecture [24].
Sustainability 17 01536 g004
Figure 5. Self-Attention example of Multi-Head Attention module.
Sustainability 17 01536 g005
Figure 6. TURKSTAT CPI rates.
Sustainability 17 01536 g006
Figure 7. DESTATIS CPI rates.
Sustainability 17 01536 g007
Figure 8. Similarity rates of the word ‘There is an Economic Crisis’ with trained NLP models (Turkey).
Sustainability 17 01536 g008
Figure 9. Monthly change rates of similarity rates of the word ‘There is an Economic Crisis’ with trained NLP models (Turkey).
Sustainability 17 01536 g009
Figure 10. One-month shifted normalized inflation rates and monthly change rates of similarity rates (Turkey).
Sustainability 17 01536 g010
Figure 11. Similarity rates of the word ‘There is an Economic Crisis’ with trained NLP models (Germany).
Sustainability 17 01536 g011
Figure 12. Monthly change rates of similarity rates of the word ‘There is an Economic Crisis’ with trained NLP models (Germany).
Sustainability 17 01536 g012
Figure 13. Four-month shifted normalized inflation rates and monthly change rates of similarity rates (Germany).
Sustainability 17 01536 g013
Figure 14. Heat map of correlation rates.
Sustainability 17 01536 g014
Table 1. Preprocessed January 2022 news dataset.
DateEnglish_TextLemmatized_TextStemmed_Text
1 January 2022 T23:56:43ZThe December inflation data, which concerns millions of people, will be announced today by the Turkish Statistical Institute, TurkStat. With the clarification…december inflation data concern million people announce today turkish statistical institute turkstat clarification…decemb inflat data concern million peopl announc today turkish statist institut turkstat clarif...
1 January 2022 T23:26:28ZAs of the first day of the new year, the electricity tariffs, which were switched to a gradual system, increased by an average of fifty-two percent to one hundred…first day new year electricity tariff switch gradual system increase average fifty two percent one hundred…first day new year electr tariff switch gradual system increas averag fifti two percent one hundr…
1 January 2022 T23:15:29ZHow can the price of red meat decrease? The decline in foreign exchange prices has not yet been reflected in market prices, especially red meat prices are high.price red meat decrease decline foreign exchange price yet reflect market price especially red meat price high.price red meat decreas declin foreign exchang price yet reflect market price especi red meat price high.
1 January 2022 T22:46:22ZThe wall was built on the Osmangazi Bridge, where a dollar-based transit guarantee was applied on the first day of Two Thousand and Twenty One, …wall built osmangazi bridge dollar base transit guarantee apply first day two thousand twenty one …wall built osmangazi bridg dollar base transit guarante appli first day two thousand twenti one …
Table 2. Monthly inflation rates (Turkey).
DateInflation Rate (%)
2021 August1.12
2021 September1.25
2021 October2.39
2021 November3.51
2021 December13.58
2022 January11.10
2022 February4.81
Table 3. Monthly inflation rates (Germany).
DateInflation Rate (%)
2022 May7.02
2022 June6.71
2022 July6.67
2022 August6.69
2022 September8.57
2022 October8.82
2022 November8.80
2022 December8.12
Table 4. Correlation rates (Turkey).
ModelCorrelation Rate (%)
BERT—english_text0.7773809409530984
BERT—lemmatized_text0.7757496734223899
BERT—stemmed_text0.7726356949494878
GloVe—english_text0.7770495657907177
GloVe—lemmatized_text0.7771488080800077
GloVe—stemmed_text0.7688405897606074
Word2Vec—english_text0.7729892929417653
Word2Vec—lemmatized_text0.4389700146889638
Word2Vec—stemmed_text0.7309490371841797
Table 5. Correlation rates (Germany).
ModelCorrelation Rate (%)
BERT—english_text0.6799395942765429
BERT—lemmatized_text0.8033144229669527
BERT—stemmed_text0.8012420137842662
GloVe—english_text0.6937973380871284
GloVe—lemmatized_text0.5154347580040074
GloVe—stemmed_text0.4173783860657952
Word2Vec—english_text0.4882908537947667
Word2Vec—lemmatized_text0.4483222620155073
Word2Vec—stemmed_text0.5128112255327603
Disclaimer/Publisher’s Note: The statements, opinions and data contained in all publications are solely those of the individual author(s) and contributor(s) and not of MDPI and/or the editor(s). MDPI and/or the editor(s) disclaim responsibility for any injury to people or property resulting from any ideas, methods, instructions or products referred to in the content.