
Application of Improved NSGA-II Multi-Objective Genetic Algorithm in Optimal Allocation of Water Resources in Main Tarim River Basin


Abstract
1. Background
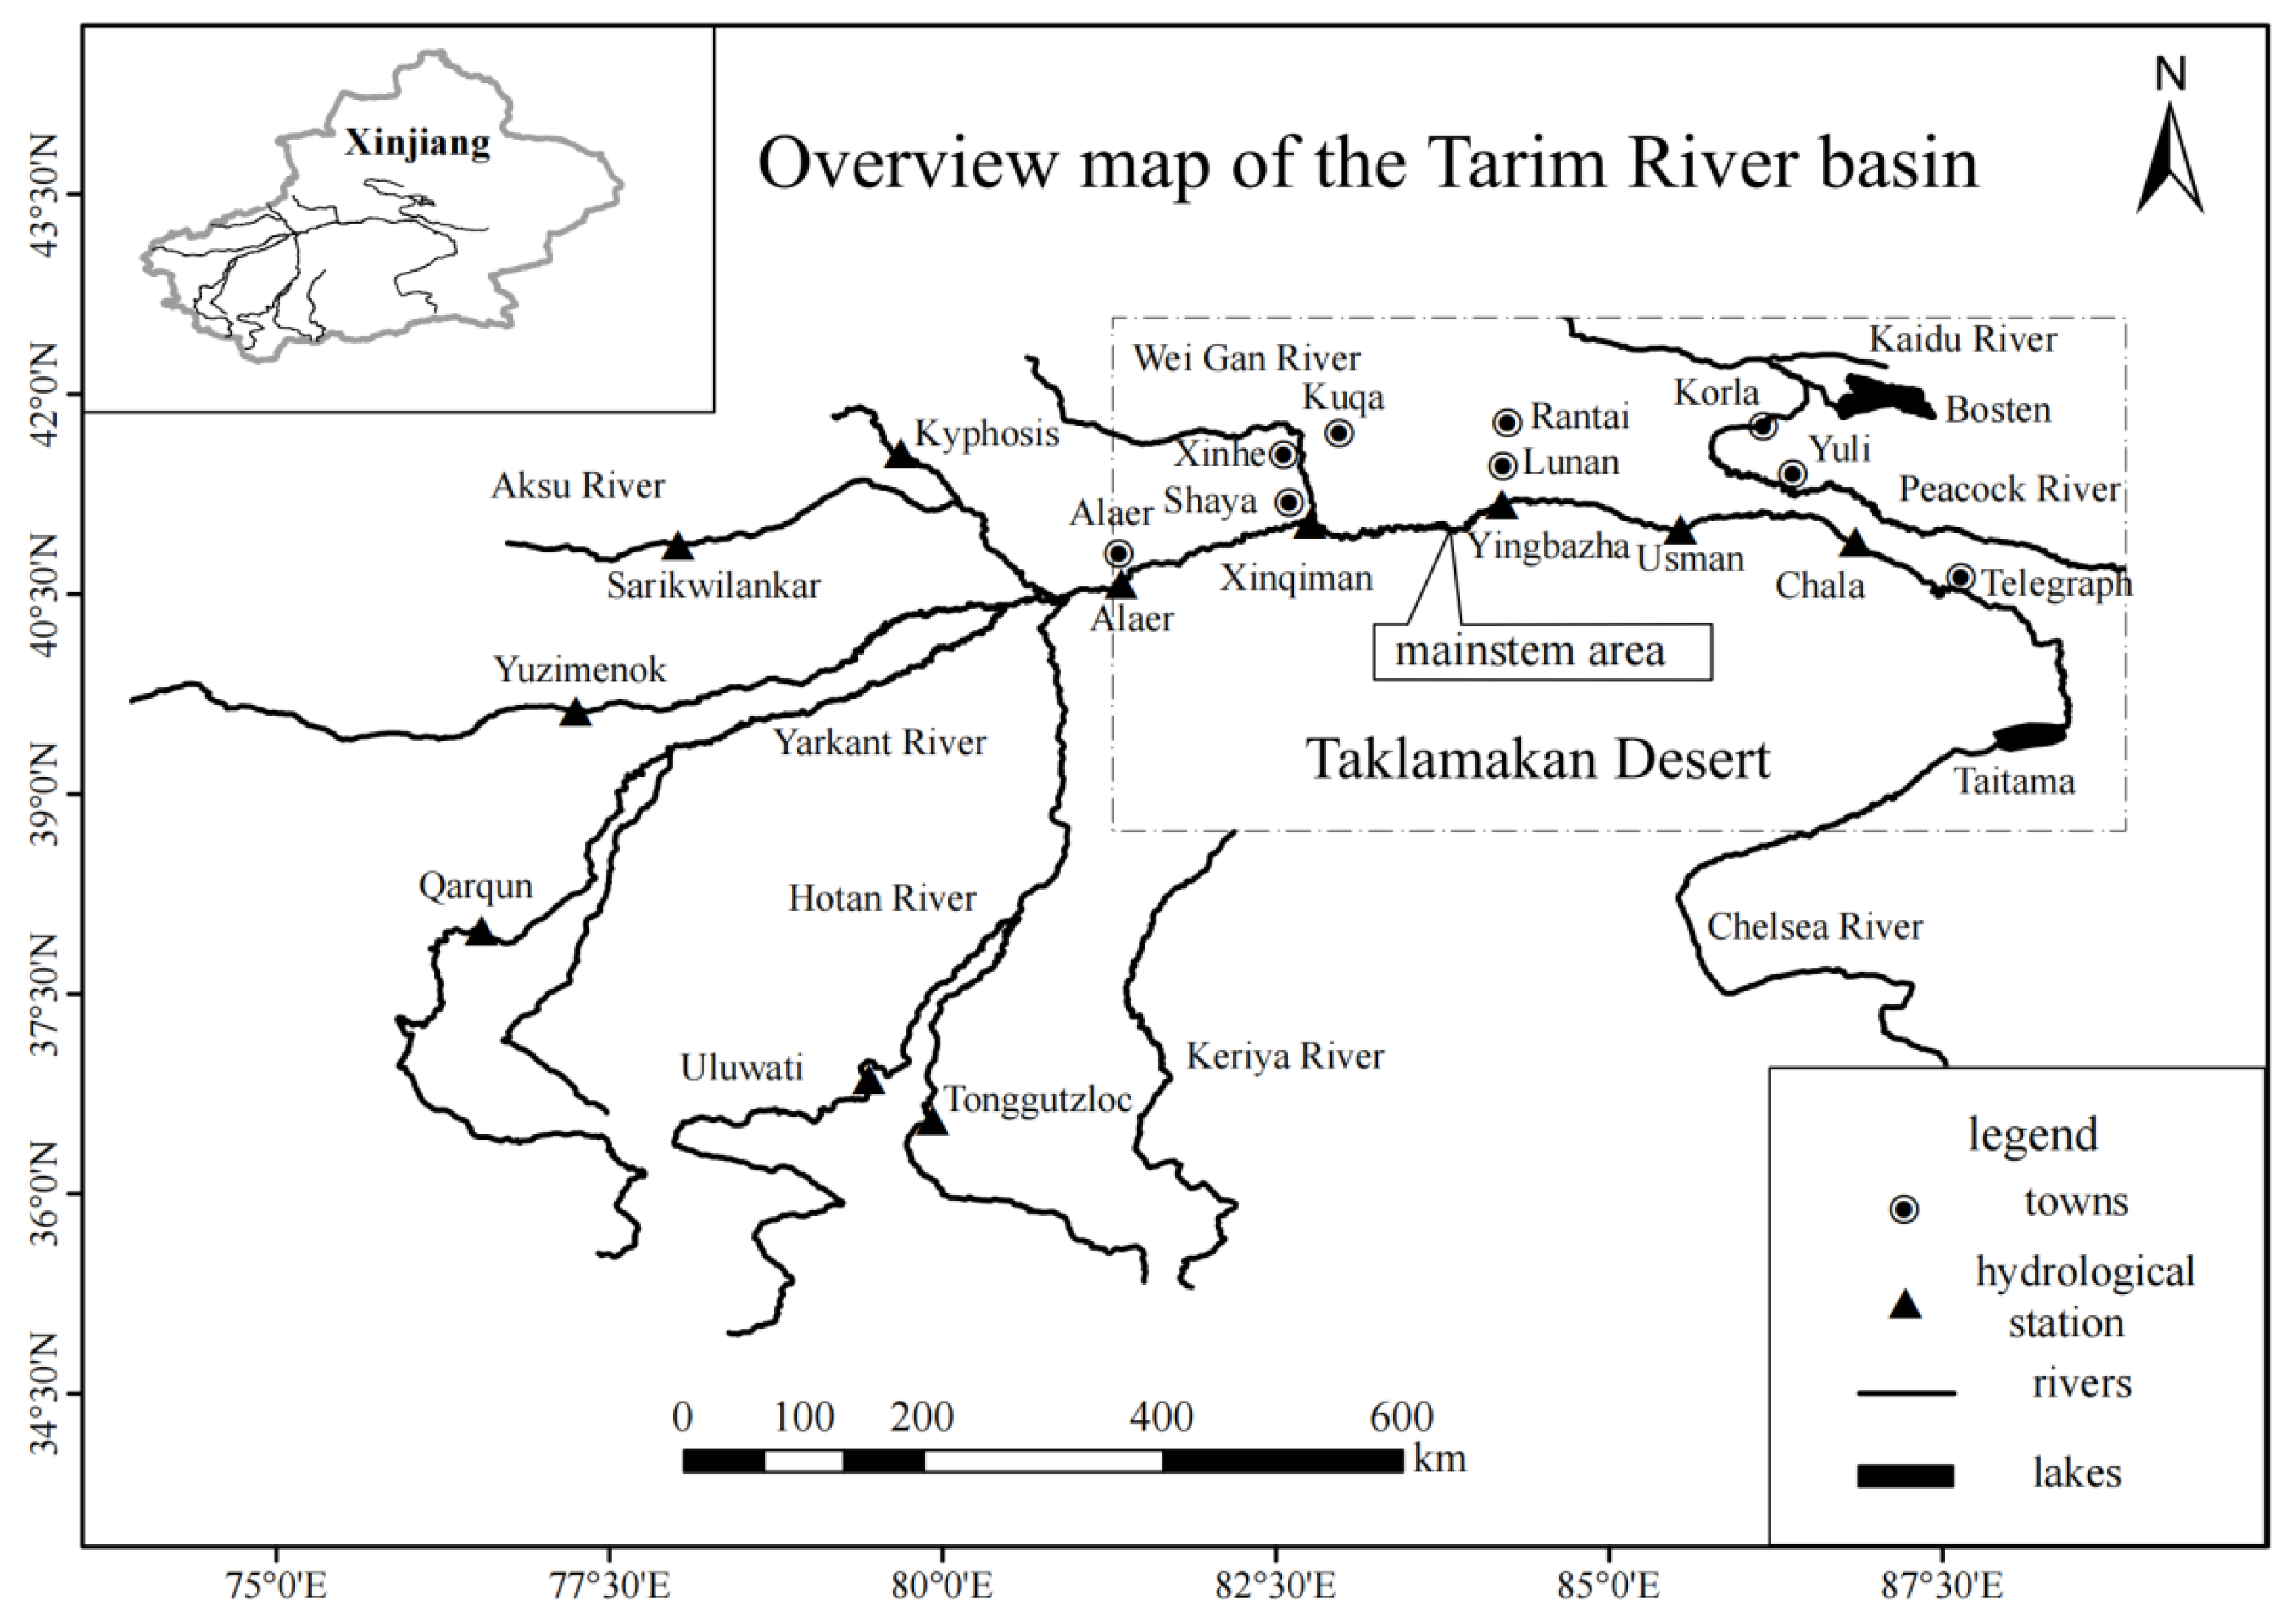
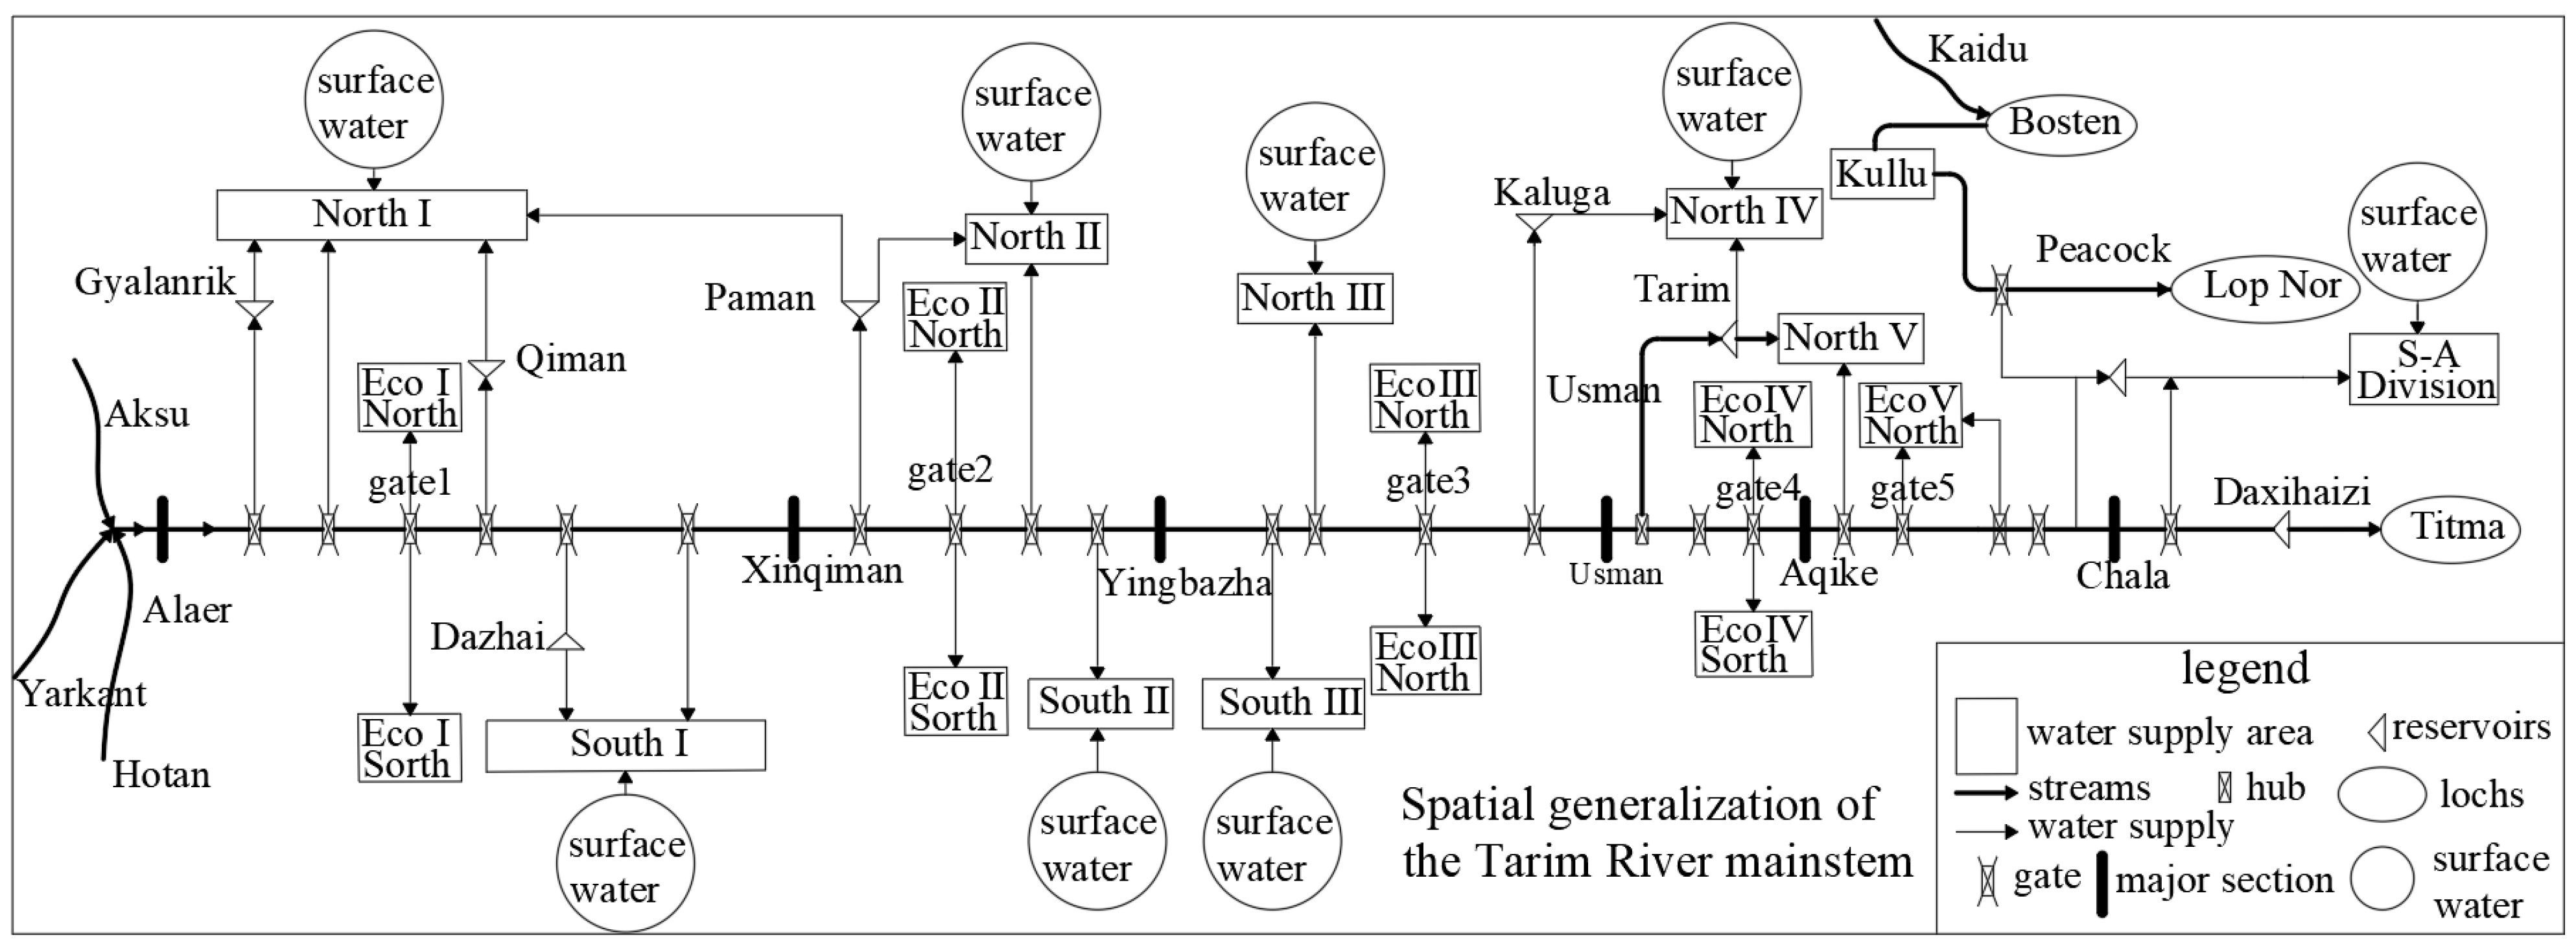
2. Study Area
3. Methodology
3.1. Improved NSGA-II Multi-Objective Genetic Algorithm
3.1.1. Improvement of Generation
3.1.2. Improvement of Selection
3.1.3. Improved Algorithmic Process
3.2. The Water Resources Optimal Allocation Model of the Main Tarim River Basin
3.2.1. Objective Function
3.2.2. Constraint Condition
- a.
- Total water resource constraints:
- b.
- Maximum agricultural water supply constraints:
- c.
- Minimum ecological water supply constraints:
- d.
- Non-negative constraints on variables:
3.3. Pearson-III Frequency Curve
4. Results and Analysis
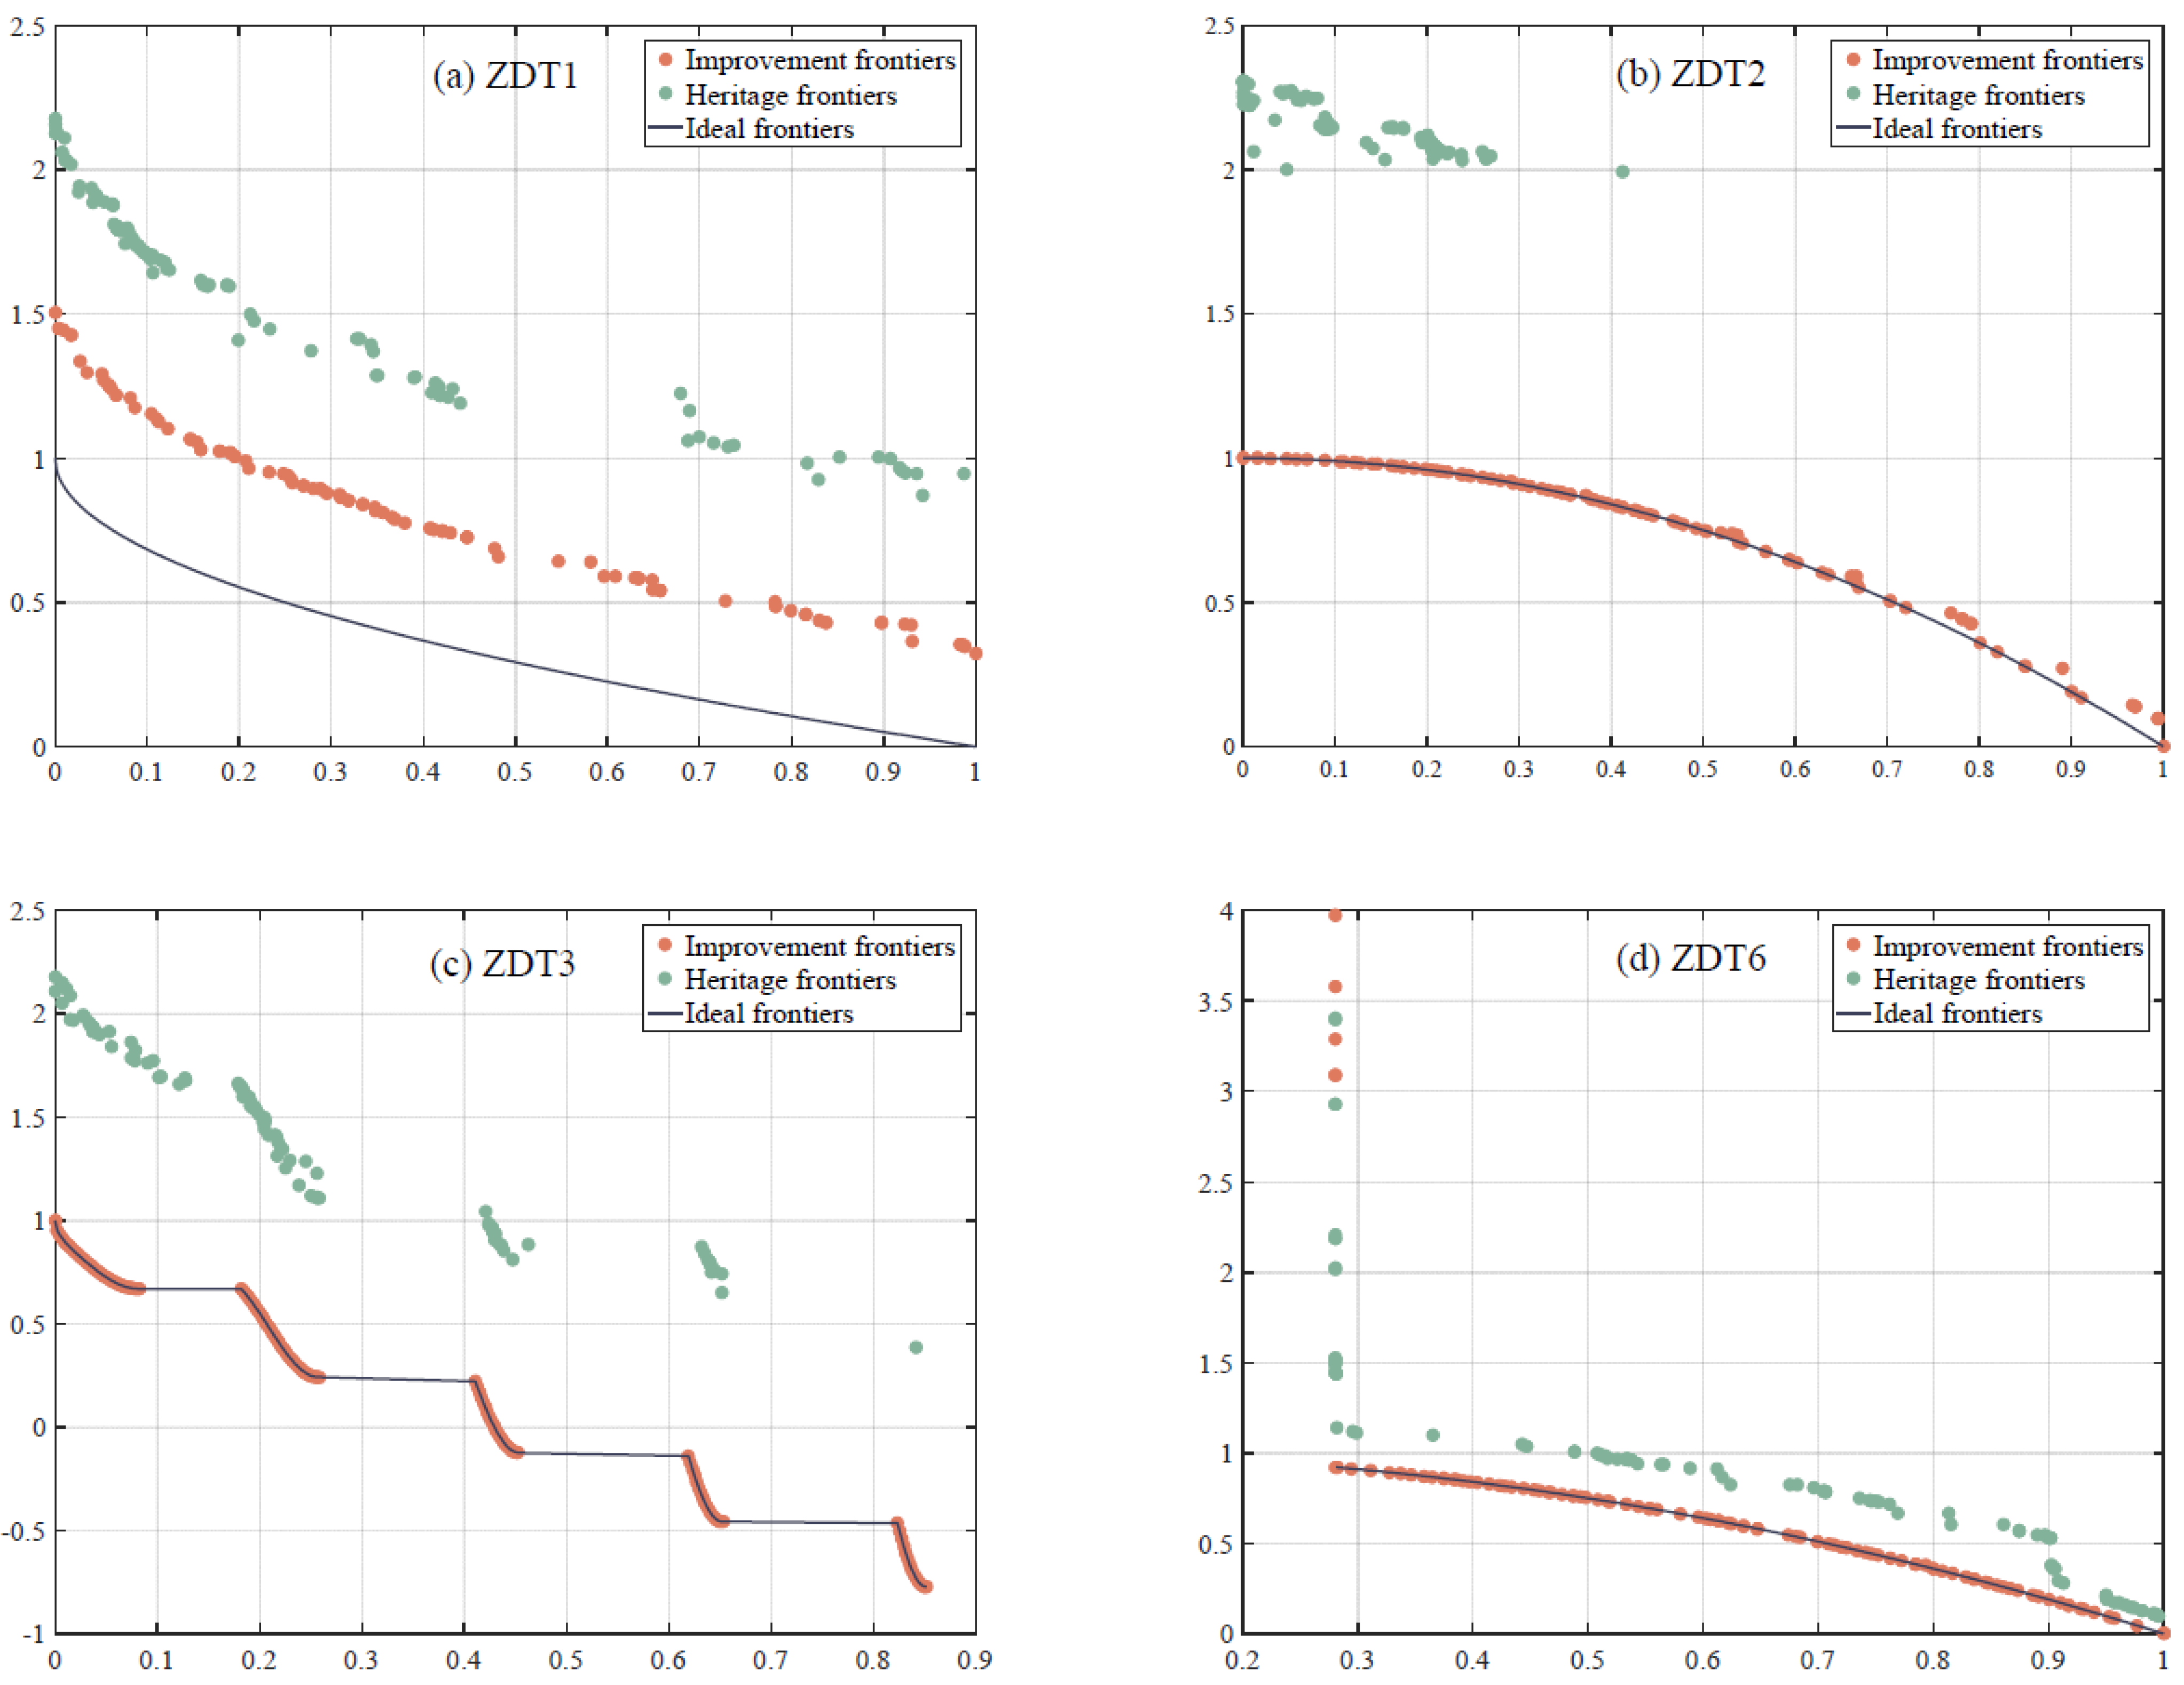
4.1. Testing Algorithm Improvement
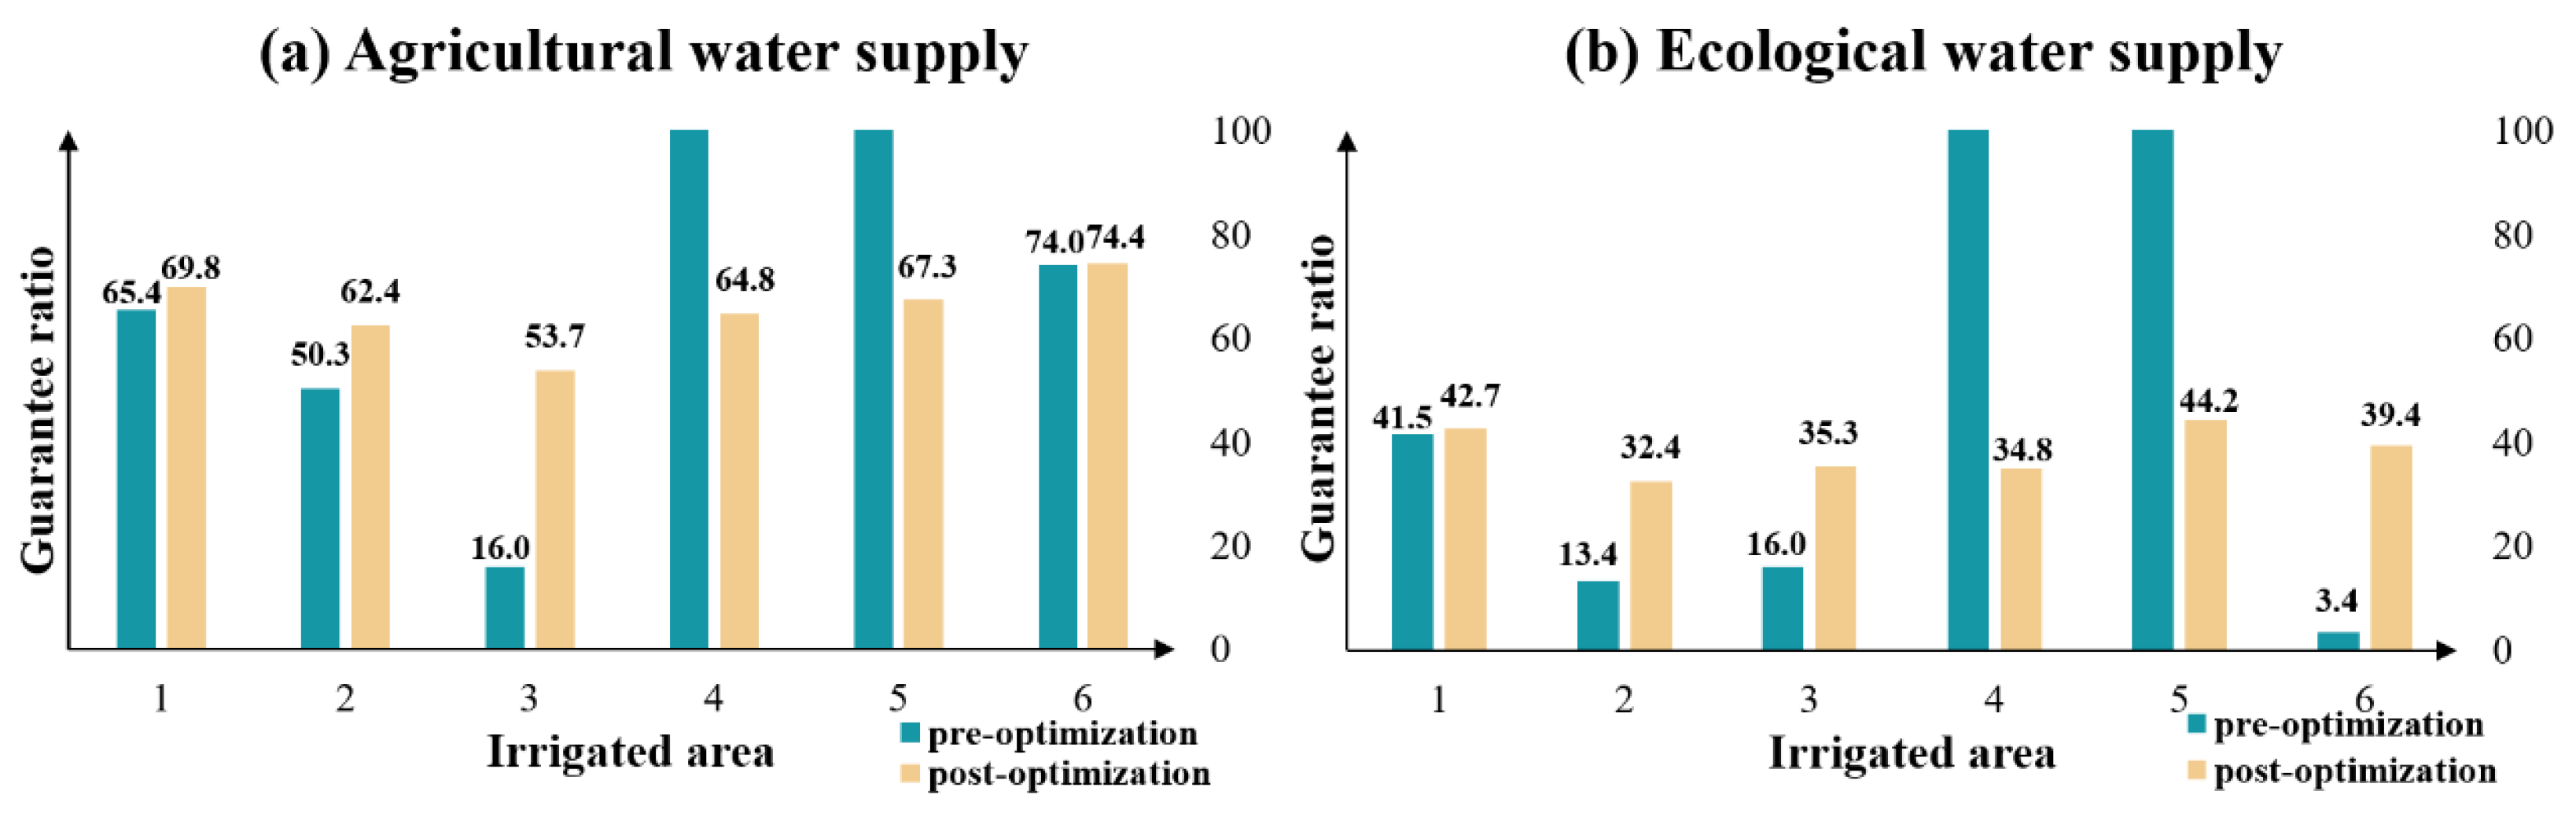
4.2. Comparisons Between Optimal Water Resource Allocation Schemes and Actual Water Resource Allocation Schemes in Year of 2020
4.3. The Optimal Water Resource Allocation Schemes Under Different Hydrological Frequency Scenarios in the Year of 2030
5. Discussion
6. Conclusions
Author Contributions
Funding
Institutional Review Board Statement
Informed Consent Statement
Data Availability Statement
Conflicts of Interest
References
- Qu, G. Study on Regional Water Resources Rational Allocation and Its Program Comprehensive Benefits Evaluation. Ph.D. Thesis, ZheJiang University, Hangzhou, China, 2014. [Google Scholar]
- Chu, y. Optimal water resource allocation of the river basin considering the water body satisfaction degree. Resour. Sci. 2018, 40, 117–124. [Google Scholar]
- Duan, S.; Jin, G.; Wang, X.; Wen, X.; Duan, H.Y.; Wang, S. The Optimal Allocation of Liaoyuan Water Resources Based on the Water Quantity-Quality Integrated Multiply Target Model. Math. Pract. Theory 2017, 47, 176–182. [Google Scholar]
- Fu, Q.; Wang, S.; Li, T. Optimal allocation of water resources under uncertainty considering risk of water shortage. J. Northeast Agric. Univ. 2018, 49, 52–61. [Google Scholar]
- Read, L.; Madani, K.; Inanloo, B. Optimality versus stability in water resource allocation. J. Environ. Manag. 2014, 133, 343–354. [Google Scholar] [CrossRef] [PubMed]
- Naghdi, S.; Bozorg-Haddad, O.; Khorsandi, M.; Chu, X. Multi-objective optimization for allocation of surface water and groundwater resources. Sci. Total Environ. 2021, 776, 146026. [Google Scholar] [CrossRef]
- Li, X.; Sha, J.; Liu, B.; Yan, Z.; Li, S.; Zhou, W. Optimal Allocation of Water Resources Based on Whale Optimization Algorithm. China Rural Water Hydropower 2018, 40–45+49. [Google Scholar]
- Sha, J.; Liu, B. Application of Improved Artificial Fish Swarm Algorithm in Optimal Allocation of Water Resources. Yellow River 2017, 39, 58–62. [Google Scholar]
- Fang, G.; Guo, Y.; Wen, X.; Huang, X. Appliacation of improved multi-objective quantum genetic algorithm on water resources optimal operation of Jiangsu Section of South-to-North Water Transfer East Route Project. Water Resour. Prot. 2018, 34, 34–41. [Google Scholar]
- Wu, Y.; Wu, M.; Yang, K.; Zhong, X.; Zhang, T. Research on the Optimal Allocation Model of Regional Water Resources Based on the Improved Moth-Flame. China Rural. Water Hydropower 2019, 9, 8–13. [Google Scholar]
- Zhong, M.; Fan, Y.; Xiang, L.; Liu, W. Study on the Strictest Water Resources Management and Optimal Allocation. Water Resour. Power 2018, 36, 26–29. [Google Scholar]
- Du, L. Optimal Allocation of Regional Water Resources Based on Improved Genetic Algorithm. Water Conserv. Sci. Technol. Econ. 2019, 25, 9–13. [Google Scholar]
- Zhu, C.; Dong, Z.; Li, B. Research on Water Resources Allocation Based on Spatial Equilibrium. China Rural. Water Hydropower 2018, 10, 64–68. [Google Scholar]
- Lyu, Y. Study on Asset-Based Management of Water Resources in Arid Zones. Ph.D. Thesis, Xinjiang University, Ürümqi, China, 2004. [Google Scholar]
- Chen, S. Optimal Allocation of Water Resources in the Tarim River Mainstream Based on “Three Red Lines”. Master’s Thesis, Huazhong University of Science and Technology, Wuhan, China, 2019. [Google Scholar]
- Cai, X. Optimal Allocation of Water Resources in Oasis Based on Sustainable Development—A Case Study from Tieganlike Oasis in the Lower Reaches Tarim River. J. Xinjiang Agric. Univ. 2009, 32, 55–59. [Google Scholar]
- Wang, L. Optimal Allocation of Water Resources in Tarim River Based on Virtual Water Balance Interval. Haihe Water Resour. 2023, 6, 5–7+22. [Google Scholar]
- Jia, Z. Study on Optimization of Ecological Water Allocation in the Tarim River Mainstem. Master’s Thesis, Huazhong University of Science and Technology, Wuhan, China, 2020. [Google Scholar]
- Ding, Q. Study on Optimal Allocation Plan of Water Resources of Tarim River. Energy Conserv. 2021, 6, 70–72. [Google Scholar]
- Guo, F.; He, W. The current situation of land rights determination and demarcation of water conservancy projects in the main stream of Tarim River and the countermeasures to speed up the promotion of the work. Inn. Mong. Water Resour. 2015, 3, 169–170. [Google Scholar]
- Liu, Z.; Wang, J. Existing Problems and Solutions to the Current Flood Control of the Tarim River Main Stream. Shaanxi Water Resour. 2014, 1, 57–58. [Google Scholar]
- Verma, S.; Pant, M.; Snasel, V. A Comprehensive Review on NSGA-II for Multi-Objective Combinatorial Optimization Problems. IEEE Access 2021, 9, 57757–57791. [Google Scholar] [CrossRef]
- Deb, K.; Agrawal, S.; Pratap, A.; Meyarivan, T. A fast elitist non-dominated sorting genetic algorithm for multi-objective optimization: NSGA-II. In Parallel Problem Solving from Nature PPSN VI; Springer: Berlin/Heidelberg, Germany, 2000. [Google Scholar]
- Li, W.; Jia, S.; Guo, C. NSGAⅡ Algorithm Combined with Local Search and Its Application to Load Distribution of Hot Strip Mill. Control. Eng. China 2012, 19, 1011–1014+1018. [Google Scholar]
- Yan, H. Characteristics of Ecological Water Demand and Vegetation Change in Tarim River Wetland. Ph.D. Thesis, Beijing Forestry University, Beijing, China, 2016. [Google Scholar]
- Schott, J.R. Fault-tolerant Design Using Single and Multicriteria Genetic Algotihm Optimization. Master’s Thesis, Air Force Insitute of Technology, Wright-Patterson AFB, OH, USA, 1995. [Google Scholar]
- Bai, X.; Jin, J.; Ning, S.; Wu, C.; Zhou, Y.; Zhang, L.; Cui, Y. Cloud Transform Algorithm Based Model for Hydrological Variable Frequency Analysis. Remote Sens. 2021, 13, 3586. [Google Scholar] [CrossRef]
- Yang, L.; Guo, Y. Prediction and Analysis of Water Resources Demand in Tunliu District Based on Quota Method. Haihe Water Resour. 2024, 5, 6–9. [Google Scholar]
- Kazemi, M.; Bozorg-Haddad, O.; Fallah-Mehdipour, E.; Chu, X. Optimal water resources allocation in transboundary river basins according to hydropolitical consideration. Environ. Dev. Sustain. 2022, 24, 1188–1206. [Google Scholar] [CrossRef]
- Li, X.; Shao, Z.; Qian, J. An Optimizing Method Based on Autonomous Animats: Fish-swarm Algorithm. Syst. Eng. Theory Pract. 2002, 22, 32–38. [Google Scholar]
- Liu, L.; Wang, B.; Peng, J.; Ye, Z. Multi-objective Optimal Control of Saturated Water-containing Fuel Based on Improved NSGA2-FLC. Aeroengine 2024, 1–7. Available online: http://kns.cnki.net/kcms/detail/21.1359.V.20241126.1719.006.html (accessed on 9 December 2024).
- Le, X.; Yu, J. Research on Solving Job-shop Scheduling Problem Based on Improved NSGA-II Algorithm. Mech. Electr. Eng. Technol. 2024, 53, 110–114. [Google Scholar]
- Rao, Y.; Yang, J.; Sun, G.; Zhang, W.; Shao, H.; Lin, J. Multi-beam satellite dynamic resource allocation method based on improved SA-NSGA2. Syst. Eng. Electron. 2024, 12, 1–11. [Google Scholar]
- Zhang, P.; Jia, W.; Cheng, X. Improved Cross Artificial Bee Colony Algorithm Based on Uniform Distribution Good Point Set. J. Hebei North Univ. (Nat. Sci. Ed.) 2022, 38, 13–20, 26. [Google Scholar]
- Kumar, K.; Kumar, S.; Kanaujia, B.K. Analytical modelling of ultra-small group delay variation of ultra-broadband RF power amplifier using NSGA-Ⅱ algorithm. Int. J. Numer. Model. Electron. Netw. Devices Fields 2024, 37, e3192.1–e3192.15. [Google Scholar] [CrossRef]
- Camara, M.V.O.; Ferrari, T.; Ribeiro, G.M. Modified NSGA-Ⅱ for solving Bi-objective support unit location problem to assist roadside traffic survey with multi-stages. Expert Syst. Appl. 2024, 249, 123448.1–123448.17. [Google Scholar] [CrossRef]
- Colorni, A.; Dorigo, M.; Maniezzo, V. Distributed optimization by ant colonies. In Proceedings of the First European Conference on Artificial Life, Paris, France, 11–13 December 1991; The MIT Press: Cambridge, MA, USA, 1991; pp. 134–142. [Google Scholar]
- Kennedy, J. Particle swarm optimization. In Encyclopedia of Machine Learning; Springer: Greer, SC, USA, 2001; pp. 760–766. [Google Scholar]
- Li, X. Summarization of water resources distribution research home and abroad. Haihe Water Resour. 2002, 5, 13–15. [Google Scholar]
- Krishnanand, K.N.; Ghose, D. Detection of multiple source locations using a glowworm metaphor with applications to collective robotics. In Proceedings of the Swarm Intelligence Symposium, Pasadena, CA, USA, 8–10 June 2005; IEEE Press: Piscataway, NJ, USA, 2005; pp. 84–91. [Google Scholar]
- Karaboga, D.; Basturk, B. On the performance of artificial bee colony(ABC)algorithm. Appl. Soft Comput. 2008, 8, 687–697. [Google Scholar] [CrossRef]
- Seifpour, M.; Asghari, S.A.; Ghobaei-Arani, M. A stochastic multi-objective optimization method for railways scheduling: A NSGA-Ⅱ-based hybrid approach. J. Supercomput. 2024, 80, 2128–2163. [Google Scholar] [CrossRef]


| Function | Pre-Improved ED | Improved ED | Performance Improvement | Pre-Improved SP | Improved SP | Performance Improvement |
|---|---|---|---|---|---|---|
| ZDT1 | 0.7613 | 0.2302 | 69.76% | 0.8917 | 0.5135 | 42.41% |
| ZDT2 | 1.1551 | 0.4143 | 64.14% | 1.0595 | 0.6971 | 34.20% |
| ZDT3 | 0.6548 | 0.2244 | 65.73% | 0.9976 | 0.6169 | 38.16% |
| ZDT6 | 0.5770 | 0.0013 | 99.77% | 0.8742 | 0.5712 | 34.66% |
| Agricultural Water Demand | Agricultural Water Supply | Water Deficit | Ecological Water Demand | Ecological Water Supply | Water Deficit | |
|---|---|---|---|---|---|---|
| ALE-XQM | 3.44 | 2.25 | 1.19 | 2.53 | 1.05 | 1.48 |
| XQM-YBZ | 4.49 | 2.26 | 2.23 | 3.36 | 0.45 | 2.91 |
| YBZ-USM | 1.87 | 0.3 | 1.57 | 7.93 | 1.27 | 6.66 |
| USM-AQK | 0.28 | 1.5 | −1.22 | 0.85 | 1.05 | −0.2 |
| AQK-CAL | 0.27 | 1.23 | −0.96 | 0.13 | 1.19 | −1.06 |
| CAL-DXHZ | 2.77 | 2.05 | 0.72 | 1.78 | 0.06 | 1.72 |
| total | 13.12 | 9.59 | 3.53 | 16.58 | 5.07 | 11.51 |
| Agricultural Water Demand | Agricultural Water Supply | Water Deficit | Ecological Water Demand | Ecological Water Supply | Water Deficit | |
|---|---|---|---|---|---|---|
| ALE-XQM | 3.44 | 2.40 | 1.04 | 2.53 | 1.00 | 1.53 |
| XQM-YBZ | 4.49 | 2.80 | 1.69 | 3.36 | 1.09 | 2.27 |
| YBZ-USM | 1.87 | 1.00 | 0.87 | 7.93 | 2.88 | 5.05 |
| USM-AQK | 0.28 | 0.18 | 0.10 | 0.85 | 0.30 | 0.55 |
| AQK-CAL | 0.27 | 0.18 | 0.09 | 0.13 | 0.06 | 0.07 |
| CAL-DXHZ | 2.77 | 2.06 | 0.71 | 1.78 | 0.70 | 1.08 |
| total | 13.12 | 8.63 | 4.49 | 16.58 | 6.03 | 10.55 |
| Agricultural Water Demand | Agricultural Water Supply | Water Deficit | Ecological Water Demand | Ecological Water Supply | Water Deficit | |
|---|---|---|---|---|---|---|
| ALE-XQM | 2.59 | 2.55 | 0.04 | 2.53 | 1.91 | 0.62 |
| XQM-YBZ | 3.18 | 3.15 | 0.03 | 3.36 | 2.61 | 0.75 |
| YBZ-USM | 1.44 | 1.39 | 0.05 | 7.93 | 5.56 | 2.37 |
| USM-AQK | 0.24 | 0.23 | 0.01 | 0.85 | 0.63 | 0.22 |
| AQK-CAL | 0.23 | 0.22 | 0.01 | 0.13 | 0.09 | 0.04 |
| CAL-DXHZ | 2.77 | 2.67 | 0.10 | 1.78 | 1.27 | 0.51 |
| total | 10.45 | 10.21 | 0.24 | 16.58 | 12.07 | 4.51 |
| Agricultural Water Demand | Agricultural Water Supply | Water Deficit | Ecological Water Demand | Ecological Water Supply | Water Deficit | |
|---|---|---|---|---|---|---|
| ALE-XQM | 2.59 | 1.97 | 0.62 | 2.53 | 1.42 | 1.11 |
| XQM-YBZ | 3.18 | 2.44 | 0.74 | 3.36 | 1.71 | 1.65 |
| YBZ-USM | 1.44 | 1.14 | 0.30 | 7.93 | 3.97 | 3.96 |
| USM-AQK | 0.24 | 0.20 | 0.04 | 0.85 | 0.43 | 0.42 |
| AQK-CAL | 0.23 | 0.18 | 0.05 | 0.13 | 0.07 | 0.06 |
| CAL-DXHZ | 2.77 | 2.14 | 0.63 | 1.78 | 1.06 | 0.72 |
| total | 10.45 | 8.07 | 2.38 | 16.58 | 8.66 | 7.92 |
| Agricultural Water Demand | Agricultural Water Supply | Water Deficit | Ecological Water Demand | Ecological Water Supply | Water Deficit | |
|---|---|---|---|---|---|---|
| ALE-XQM | 2.59 | 1.76 | 0.83 | 2.53 | 0.32 | 2.21 |
| XQM-YBZ | 3.18 | 2.01 | 1.17 | 3.36 | 0.47 | 2.89 |
| YBZ-USM | 1.44 | 1.09 | 0.35 | 7.93 | 1.24 | 6.69 |
| USM-AQK | 0.24 | 0.16 | 0.08 | 0.85 | 0.23 | 0.62 |
| AQK-CAL | 0.23 | 0.17 | 0.06 | 0.13 | 0.03 | 0.10 |
| CAL-DXHZ | 2.77 | 2.11 | 0.66 | 1.78 | 0.20 | 1.58 |
| total | 10.45 | 7.30 | 3.15 | 16.58 | 2.49 | 14.09 |
Disclaimer/Publisher’s Note: The statements, opinions and data contained in all publications are solely those of the individual author(s) and contributor(s) and not of MDPI and/or the editor(s). MDPI and/or the editor(s) disclaim responsibility for any injury to people or property resulting from any ideas, methods, instructions or products referred to in the content. |
© 2025 by the authors. Licensee MDPI, Basel, Switzerland. This article is an open access article distributed under the terms and conditions of the Creative Commons Attribution (CC BY) license (https://creativecommons.org/licenses/by/4.0/).
Share and Cite
Cheng, K.; Li, D.; Deng, M.; Li, X.; Fang, G. Application of Improved NSGA-II Multi-Objective Genetic Algorithm in Optimal Allocation of Water Resources in Main Tarim River Basin. Sustainability 2025, 17, 1526. https://doi.org/10.3390/su17041526
Cheng K, Li D, Deng M, Li X, Fang G. Application of Improved NSGA-II Multi-Objective Genetic Algorithm in Optimal Allocation of Water Resources in Main Tarim River Basin. Sustainability. 2025; 17(4):1526. https://doi.org/10.3390/su17041526
Chicago/Turabian StyleCheng, Kaiyi, Donghao Li, Mingjiang Deng, Xin Li, and Guohua Fang. 2025. "Application of Improved NSGA-II Multi-Objective Genetic Algorithm in Optimal Allocation of Water Resources in Main Tarim River Basin" Sustainability 17, no. 4: 1526. https://doi.org/10.3390/su17041526
APA StyleCheng, K., Li, D., Deng, M., Li, X., & Fang, G. (2025). Application of Improved NSGA-II Multi-Objective Genetic Algorithm in Optimal Allocation of Water Resources in Main Tarim River Basin. Sustainability, 17(4), 1526. https://doi.org/10.3390/su17041526