Article

Knowledge Graph- and Bayesian Network-Based Intelligent Diagnosis of Highway Diseases: A Case Study on Maintenance in Xinjiang

by
Abulimiti Wubuli
1,
Fangfang Li
2,
Chenxi Zhou
1,
Lingling Zhang
1,3,4,* and
Jiaru Jiang
1
1
School of Economics and Management, University of Chinese Academy of Sciences, Beijing 100190, China
2
School of Science and Technology, Changchun Humanities and Sciences College, Changchun 130117, China
3
MOE Social Science Laboratory of Digital Economic Forecasts and Policy Simulation at UCAS, Beijing 100190, China
4
Key Laboratory of Big Data Mining and Knowledge Management, Chinese Academy of Sciences, Beijing 100190, China
*
Author to whom correspondence should be addressed.
Sustainability 2025, 17(4), 1450; https://doi.org/10.3390/su17041450
Submission received: 3 December 2024 / Revised: 9 January 2025 / Accepted: 20 January 2025 / Published: 10 February 2025

Abstract

The management of highway diseases has entered an era of big data, necessitating advanced methodologies to handle complex, heterogeneous data from diverse sources. This study introduces a novel approach that integrates knowledge graphs and Bayesian networks to enhance the intelligent diagnosis of highway diseases, addressing the unique challenges of road maintenance in diverse geographical contexts. A Bayesian network model was developed by combining expert knowledge with local data features, mathematically representing diagnostic knowledge through a probability matrix. Training data were utilized to compute and identify the optimal Bayesian network, forming the basis of an intelligent diagnostic framework. Empirical analysis of maintenance records from highways in Xinjiang demonstrated the efficiency of this framework, accurately diagnosing both common and specialized diseases while outperforming traditional methods. This approach not only supports intelligent knowledge management and application in highway maintenance but also provides a scalable solution adaptable to varied geographical conditions. The findings offer a pathway for advancing highway disease management, promoting more efficient, precise, and sustainable road maintenance practices.

1. Introduction

China has achieved significant progress in infrastructure construction, particularly in transportation networks, establishing the country as a global leader in transportation amidst rapid economic growth [1]. However, after the completion of highway construction, efforts should primarily shift towards road maintenance to improve the quality of services and extend the lifespan of highways [2]. In recent years, frequent occurrences of highway diseases have caused substantial economic losses but have also generated a wealth of data related to highway management. These datasets serve as valuable resources for diagnosing and treating highway issues according to specific regional conditions [3]. The effective management and utilization of these highway disease data are essential for the prevention and mitigation of highway diseases, contributing to the long-term sustainability of infrastructure by minimizing premature road repairs and resource waste.
Traditional highway disease data management in China mainly relies on simple databases or graph-and-table approaches, leading to low utilization rates, challenges in updating information, and inefficiency. Some regions have implemented top-down highway disease management systems, but their complexity has limited adoption and effective application, preventing the achievement of original objectives. Traditional highway management methods are increasingly unable to meet modern requirements [4]. Improving diagnostic capabilities for highway diseases is critical for reducing their impact, maintaining traffic capacity, supporting social and economic development, and reducing the environmental and resource burdens associated with inefficient maintenance practices [5].
Scientific diagnosis and decision-making for highway maintenance are integral to ensuring successful highway operations [6]. Poorly designed diagnostic or treatment plans can lead to ineffective maintenance efforts, wasting resources and disrupting traffic. In some cases, inadequate maintenance not only fails to control highway diseases but may exacerbate problems due to delayed actions [7]. Currently, highway disease identification largely depends on visual inspections and the expertise of grassroots maintenance personnel, requiring them to have significant experience and theoretical knowledge. Due to the complexity of highway diseases and the varying skill levels of personnel, misjudgments or inaccuracies often occur in identifying subgrade diseases, directly affecting higher-level management and decision-making processes [8,9]. These inaccuracies can result in suboptimal design plans.
Therefore, the integration of artificial intelligence technology with expert knowledge and experience offers a promising solution. This combination effectively addresses common highway diseases with high accuracy and is equally applicable to handling rare and complex cases, enhancing the reliability of diagnostic models. Although the implementation of this approach involves relatively high time and financial costs, it enables frontline personnel to take timely and efficient measures to mitigate disaster consequences, thereby contributing to the sustainability of highway networks by optimizing resource usage and extending asset lifecycles.

2. Literature Review

By the 1970s, the construction of expressways in most countries around the world had largely been completed. However, with evolving societal demands, it became evident that existing transportation infrastructure could no longer fully address new requirements. Consequently, the optimization of expressway resource allocation emerged as a pressing priority, with expressway maintenance becoming a key area of development [10]. In the late 1970s, inspired by principles of systems engineering and operations research, renowned American professor Hudson developed a specialized system for pavement maintenance management. This work laid the foundation for the establishment of a network-level pavement management system in North America [11]. Building on these advances, the United States launched the “Highway Economic Requirements System (HERS)” research project in 1990 to further enhance highway management strategies [12]. In 1996, following evaluations of highway management projects, both the American Association of State Highway and Transportation Officials (AASHTO) and the Federal Highway Administration (FHWA) recognized that managing and maintaining the highway transportation system were far more complex than construction design. They concluded that only through strategic decision-making supported by scientific pavement management systems could limited resources be allocated efficiently [13,14].
In China, expressways and national highways serve as critical components of the road transportation network and are central to highway disease research. Wu investigated subgrade water seepage in a section of expressway in Shanxi, utilizing the transient electromagnetic method and ground-penetrating radar to detect potential subgrade diseases [15]. Similarly, Sha et al. applied convolutional neural network technology to analyze ground-penetrating radar images, significantly improving the accuracy and efficiency of subgrade disease detection [16]. Xiao et al. examined disease conditions in coastal expressways, focusing on three dimensions: disease weight, characteristics, and types [17]. Their study involved selecting 25 representative sections with distinct geological features and conducting comprehensive assessments using methods such as Rayleigh wave analysis, falling weight deflectometer, ground-penetrating radar, and dynamic cone penetrometer tests. The collected data enabled the development of a multi-angle and multi-level subgrade and base assessment standard. Ultimately, a precise highway disease diagnostic approach was established using a combination of exclusion methods and step-by-step analysis.
Huang et al. integrated the unique characteristics of highway maintenance into their study, leveraging big data to analyze highway conditions and provide timely warnings, effectively preventing unnecessary safety accidents. Their approach utilized various Internet of Things (IoT) sensing technologies in construction supervision robots to monitor construction safety, including infrared fence systems, thereby safeguarding the lives of maintenance personnel [18]. Xu applied big data technology to collect highway information, storing data such as construction drawings, traffic volume, inspections, evaluations, and maintenance records. Remote supervision was conducted using WeChat mini-programs or mobile applications, enhancing accessibility and efficiency [19]. Su et al. explored the definition and characteristics of highway transportation big data, identified the sources of highway big databases, and developed methods for collecting highway maintenance data. Their work established a standardized highway maintenance big data system and proposed a comprehensive framework for its implementation [20].
In general, existing research primarily emphasizes technical methods for highway disease detection, with limited focus on designing systematic and scientific processes for disease diagnosis. Additionally, the adoption and maintenance of advanced equipment are often constrained by challenges such as insufficient personnel, inadequate training, and limited technical expertise within highway maintenance departments. While some studies explore the use of big data, they tend to concentrate on data collection and database construction. These efforts often fall short in leveraging big data to inform practical highway maintenance strategies, making it challenging to identify effective maintenance plans from vast amounts of data. The knowledge graph offers the ability to uncover deeper relationships within existing knowledge architectures, providing a robust framework for relationship reasoning. When integrated with expert experience, it facilitates the intelligent diagnosis of disease causes, significantly reducing maintenance decision-making time and simplifying maintenance operations. The Bayesian network model proposed in this study combines the generalizability of expert-derived knowledge with the specificity of localized data, ensuring both the accuracy and practical applicability of the model.

3. Methodology

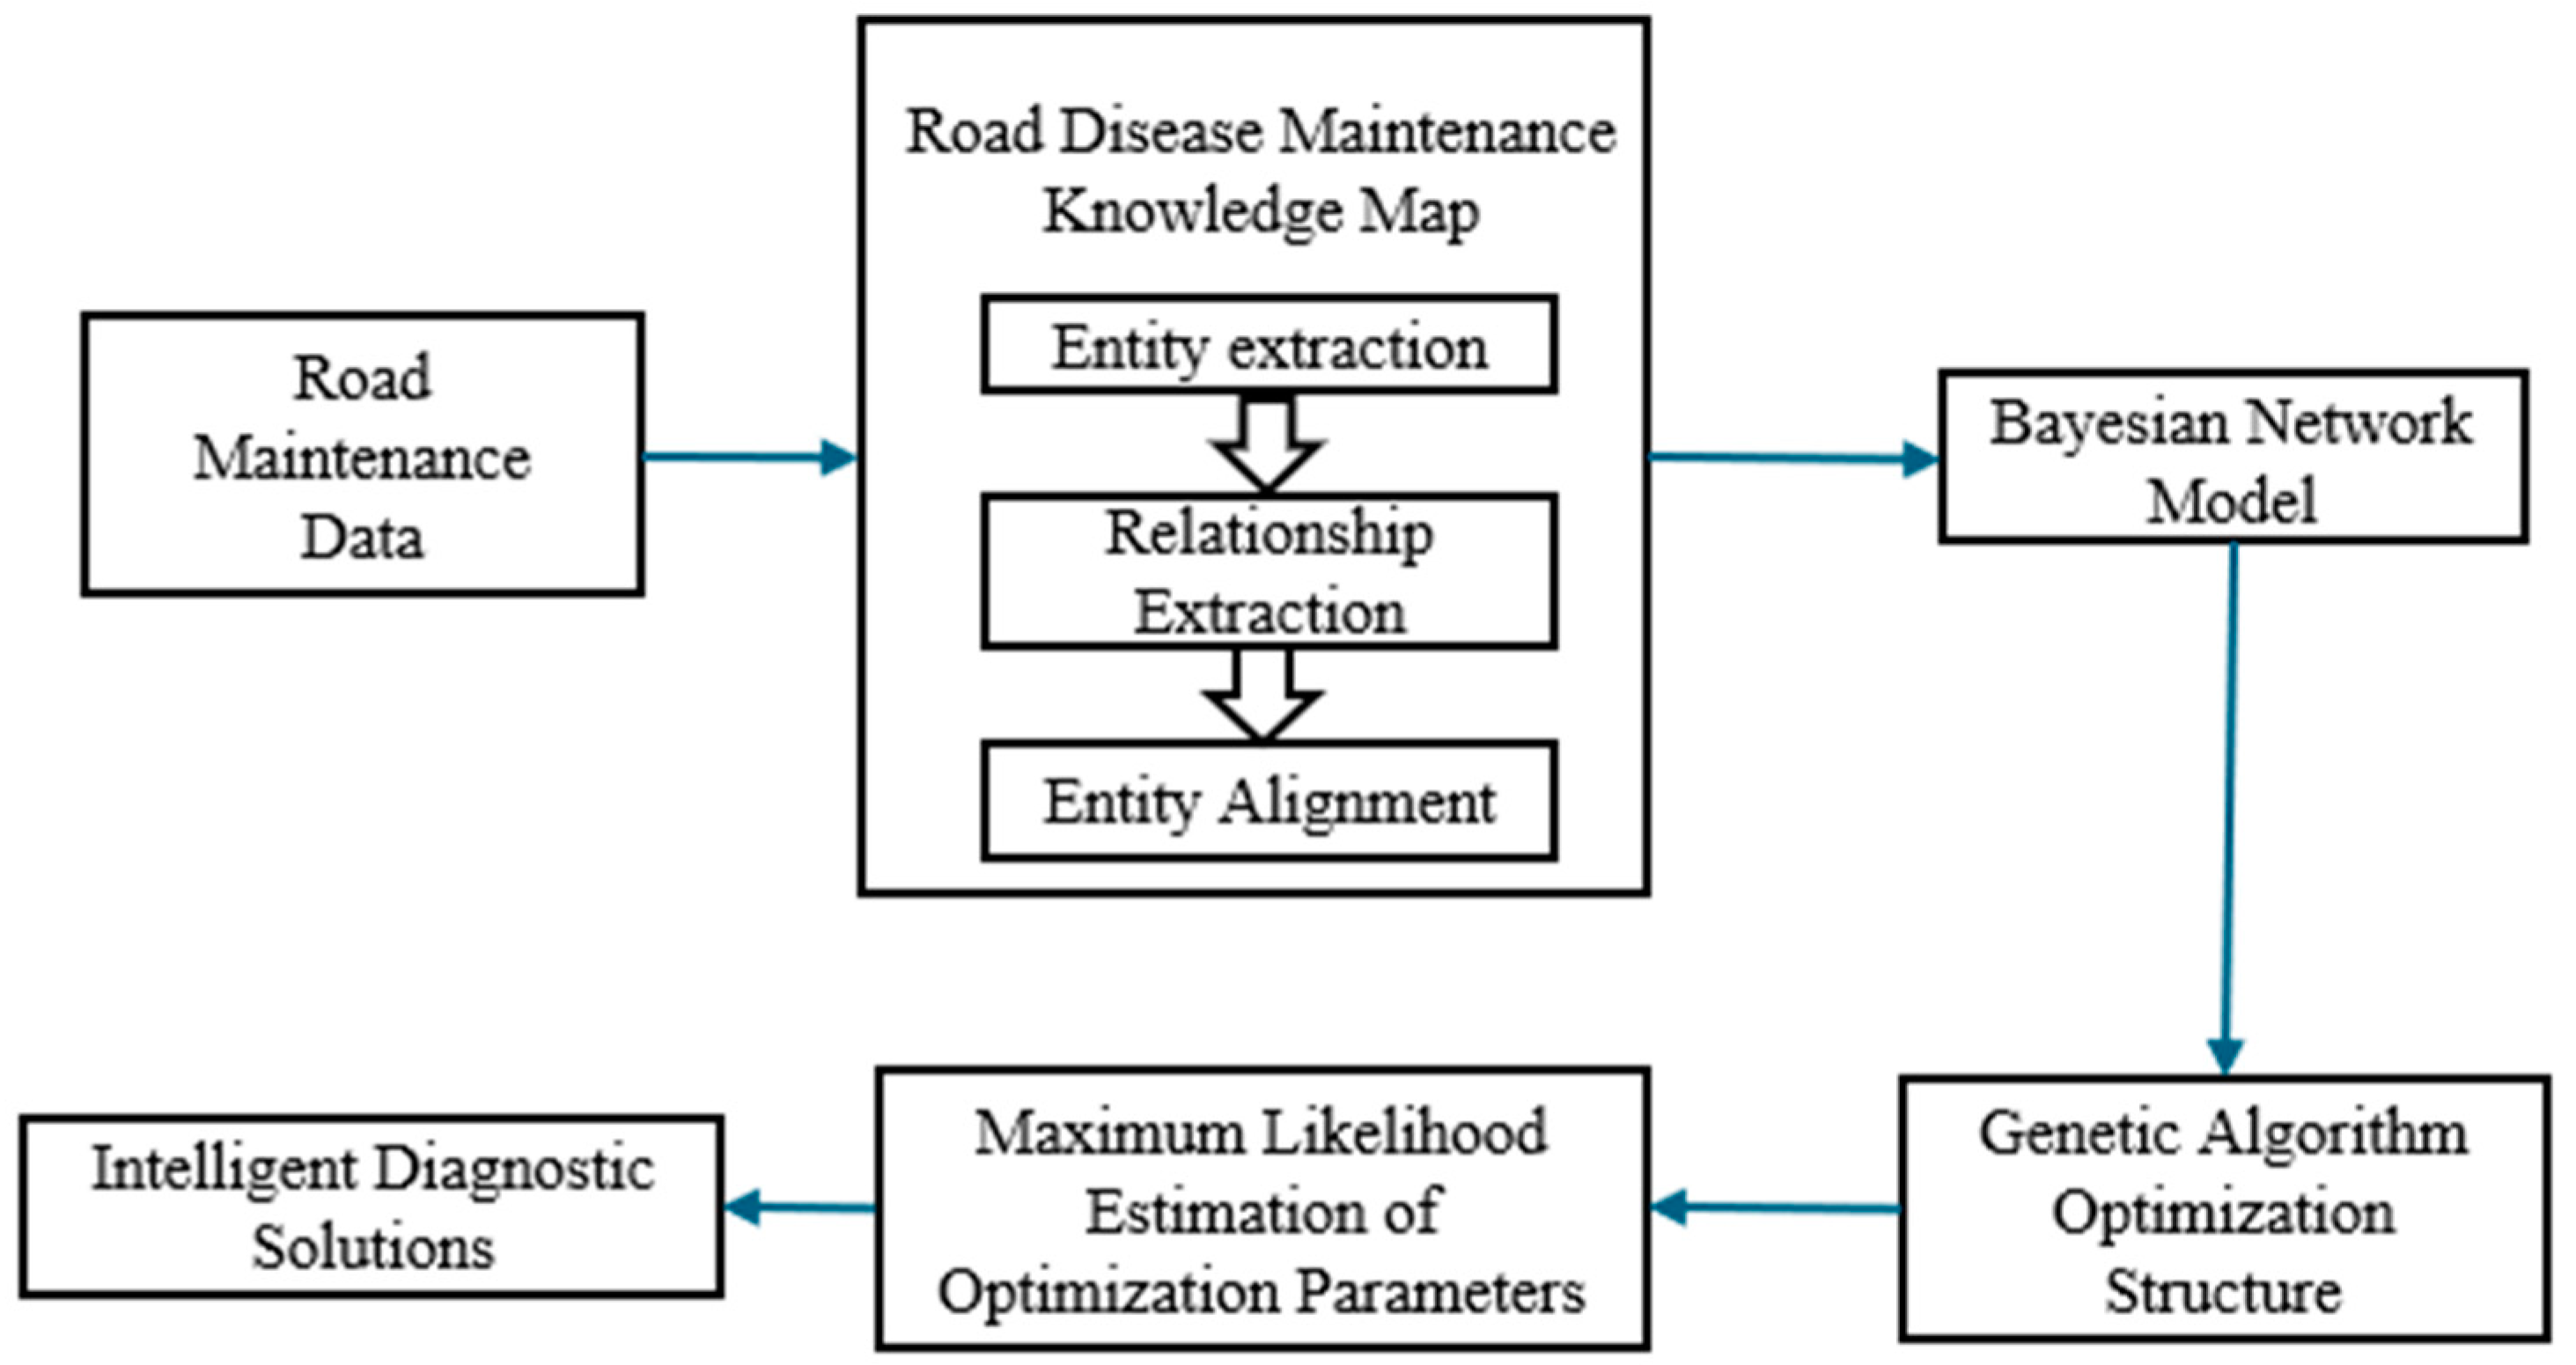
3.1. Highway Disease Diagnosis Method Based on Knowledge Graph and Bayesian Network

The application of knowledge graph technology in highway disease maintenance has the potential to transform traditional practices, enhancing the efficiency of highway disease diagnosis and reducing subsequent maintenance costs. This approach is particularly valuable for a country like China, which has an extensive highway network. From a theoretical perspective, establishing a knowledge graph in the field of highway disease maintenance enables the discovery of previously overlooked knowledge. Using this knowledge graph as a foundation, a highway disease diagnosis model can be developed. The core concept of this model involves organizing highway disease- and maintenance-related information into a structured knowledge set. This set encompasses common highway diseases and their associated maintenance practices. The Bayesian network algorithm is then integrated into the model to address gaps in the highway maintenance industry, fostering stronger connections between professional knowledge and logical processes. This integration enhances both the accuracy and interpretability of highway disease diagnoses.
From a practical standpoint, applying intelligent diagnostic technologies derived from knowledge graph systems to highway maintenance offers dual benefits. First, it enables maintenance personnel to address highway diseases with greater precision and ease. Second, it supports highway management agencies by reducing the costs associated with pavement maintenance and operational support. This dual impact underscores the significant theoretical and practical value of adopting knowledge graph technology in the highway maintenance domain. The overall structure of the paper is shown in Figure 1 below.

3.2. Construction of Knowledge Graph for Highway Disease Maintenance

The knowledge graph preprocesses structured, unstructured, and semi-structured data, representing them in the form of triples. This representation provides a visual perspective and is widely applied in areas such as intelligent question answering, reasoning, and decision support. Knowledge extraction primarily involves two components: entity extraction (identifying terms like location, time, and names) and attribute extraction (capturing the attributes of the entities). Following the extraction process, the data undergo preliminary knowledge representation. To enhance the quality of knowledge construction, challenges such as entity alignment, diversity, and ambiguity must also be addressed.
In this study, knowledge graph technology was applied to analyze 1131 papers related to highway diseases published in the past five years on the China National Knowledge Infrastructure (CNKI) platform. The knowledge graph was constructed by extracting and categorizing relevant entities and attributes, which are essential for representing the various relationships within highway disease maintenance. Key entities included:
(1)
Road Types: road categories such as highways, secondary roads, and local roads.
(2)
Highway Diseases: types of diseases affecting roads, including cracks, rutting, and potholes.
(3)
Geographical Locations: specific regions or cities, such as Urumqi or Karamay, where highway diseases have been observed.
(4)
Maintenance Methods: types of maintenance activities, such as resurfacing, crack sealing, and patching.
(5)
Time: the time frame during which diseases were identified or maintenance occurred.
For each entity, attributes are defined to capture their key characteristics. For example:
(1)
Road Types: attributes like “Material”, “Design Life”, and “Construction Year”.
(2)
Highway Diseases: attributes like “Severity”, “Cause”, and “Affected Area”.
(3)
Maintenance Methods: attributes such as “Cost”, “Effectiveness”, and “Duration”.
Based on the information extracted from the knowledge graph, a fuzzy matrix was constructed to facilitate further analysis. This fuzzy matrix captured the relationships between different entities and attributes, allowing us to model uncertainty and ambiguity in highway disease diagnosis. A partial view of the highway disease knowledge graph is presented in Figure 2, with its corresponding information summarized in Table 1.

3.3. Intelligent Diagnosis of Highway Diseases Based on Knowledge Graph

(1)
Intelligent diagnosis method
The Bayesian network, an autonomous learning model based on Bayesian probability, integrates the strengths of probability theory and graph theory [21]. It provides a graphical representation of multivariate statistical relationships, making it particularly effective for judgments and decisions in scenarios involving incomplete or uncertain information.
In constructing a highway disease diagnosis system, the Bayesian network extracts highway diseases and their associated phenomena from maintenance records and the related literature, representing them as nodes. Directed edges illustrate the causal relationships between diseases and phenomena, with conditional probabilities assigned to these edges to quantify the strength of these causal links. The innovative aspect of Bayesian network design lies in its departure from linear reasoning approaches. Instead, it employs a network-based structure that integrates the expertise and knowledge of domain specialists. This approach mimics human cognitive reasoning, enabling flexible and adaptive reasoning processes, unbound by fixed logic or traditional learning methods [22].
The methodology begins with creating a diagnostic scheme based on the experience and insights of domain experts. A fuzzy matrix is then employed to convert expert knowledge into mathematical language, which is subsequently input into the model for processing. In the next phase, genetic algorithms, guided by expert diagnostic schemes, are used to evolve the Bayesian network using a training dataset, which is a subset of the complete highway maintenance records. The model’s capabilities are then evaluated using a separate test dataset to assess its generalization ability and performance on unseen data. This iterative process continues until the network achieves an optimal structure that aligns with both expert knowledge and the training dataset. Parameters of the model are then optimized using maximum likelihood estimation. The final result is a comprehensive Bayesian network-based highway disease diagnosis system [23,24].
The Bayesian network has a directed acyclic structure and consists of two elements: nodes N = n 1 , , n a , representing random variables, and directed arrows E = n b , n c , , n x , n y , representing relationships between these variables. Figure 3 illustrates an example of a Bayesian network, where A ~ F are nodes formed by random variables. The relationships within the network are defined by directed arrows, where the arrow originates from the parent node and points to the child node. For instance, in Figure 3, node A is the parent node and connects to child node C through a directed arrow. In this example, nodes A and B serve as root nodes (starting points), while nodes D , E , and F are leaf nodes (end points). The remaining nodes are intermediate nodes.
The root nodes follow a prior probability distribution, while the conditional probability distribution of non-root nodes is expressed as P n i P a n i , where P a n i denotes the parent nodes of n i . The prior probability is derived from the historical frequency of similar events observed before sampling, reflecting expert experience. The conditional probability quantifies the likelihood of observing a child node given the occurrence of its parent node(s). When P a n i is determined, n i becomes conditionally independent of nodes that are not connected to it via directed arrows. For example, if node B occurs, then node D will also occur. However, node D is independent of other nodes that are not directly connected to it by directed arrows.
The joint probability distribution P n 1 , , n a represents the combined probabilities across all possible states of the random variable nodes n 1 , , n a . Considering the conditional probabilities and the independence relationships among the nodes, the joint probability distribution of the Bayesian network can be expressed as shown in Formula (1):
P n 1 , , n a = P n 1 P n 2 n 1 P n a n 1 , n 2 , , n a 1 = i = 1 a P n i P a n i
This formula reflects how the probabilities of individual nodes are determined by their parent nodes in the network. The Bayesian network effectively leverages these relationships to compute the joint probability distribution, enabling probabilistic reasoning and inference under conditions of uncertainty.
(2)
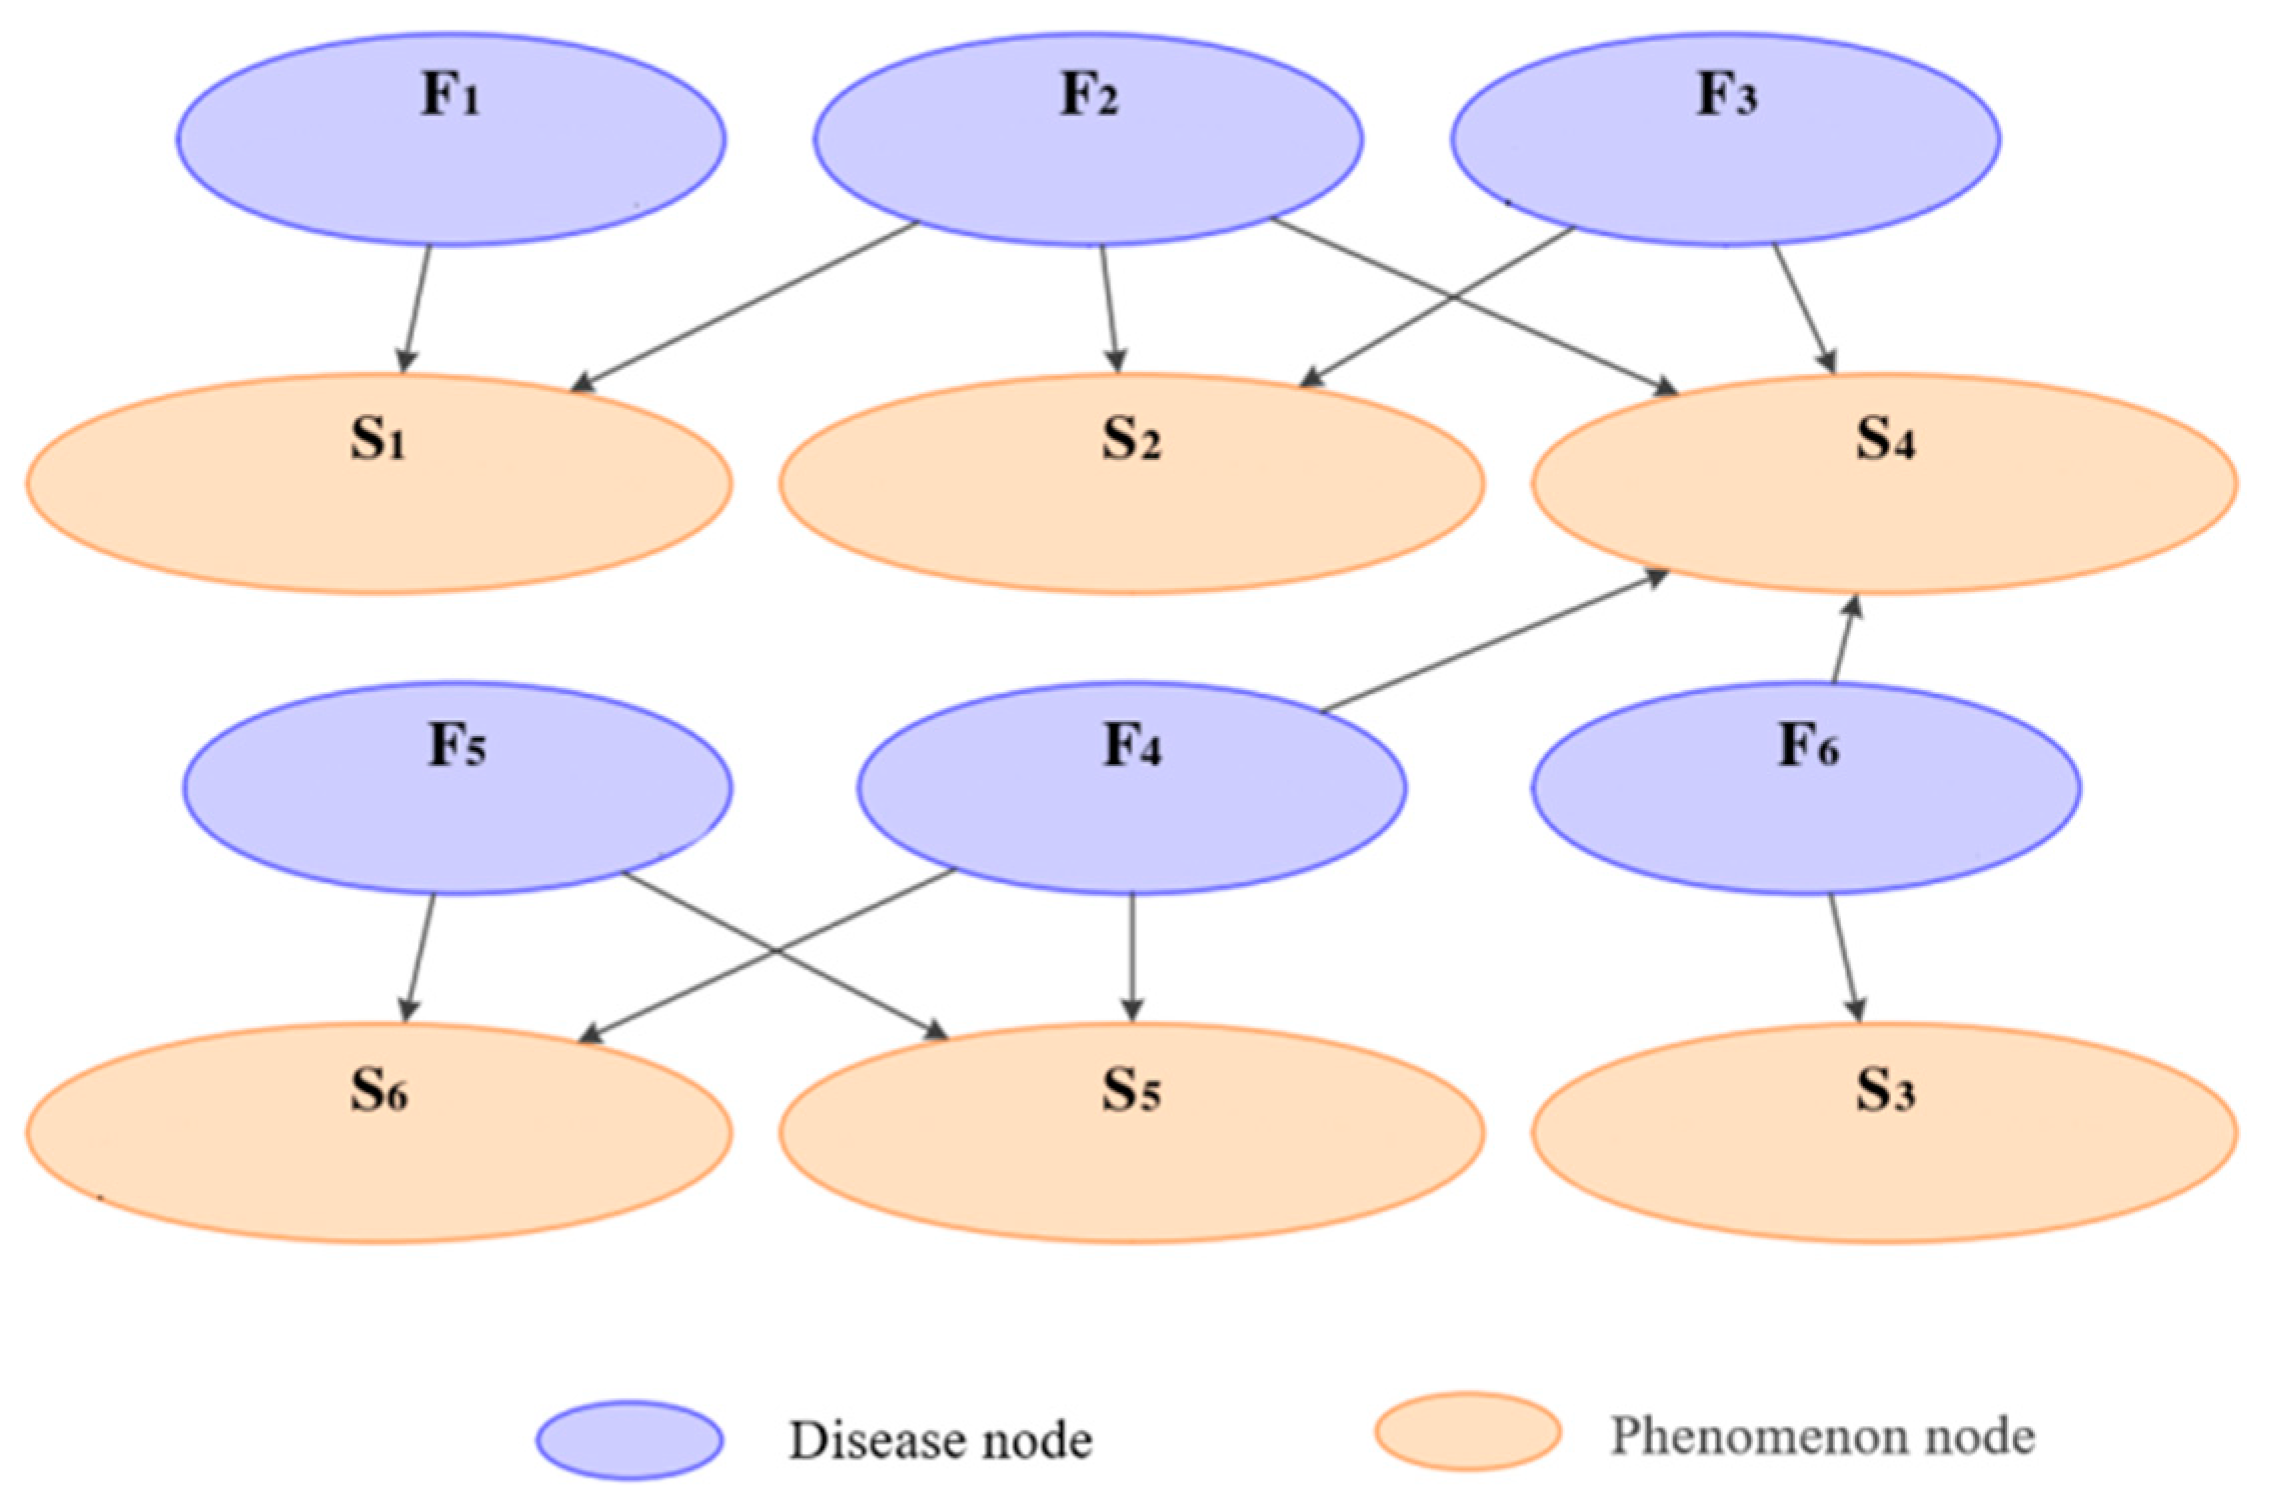
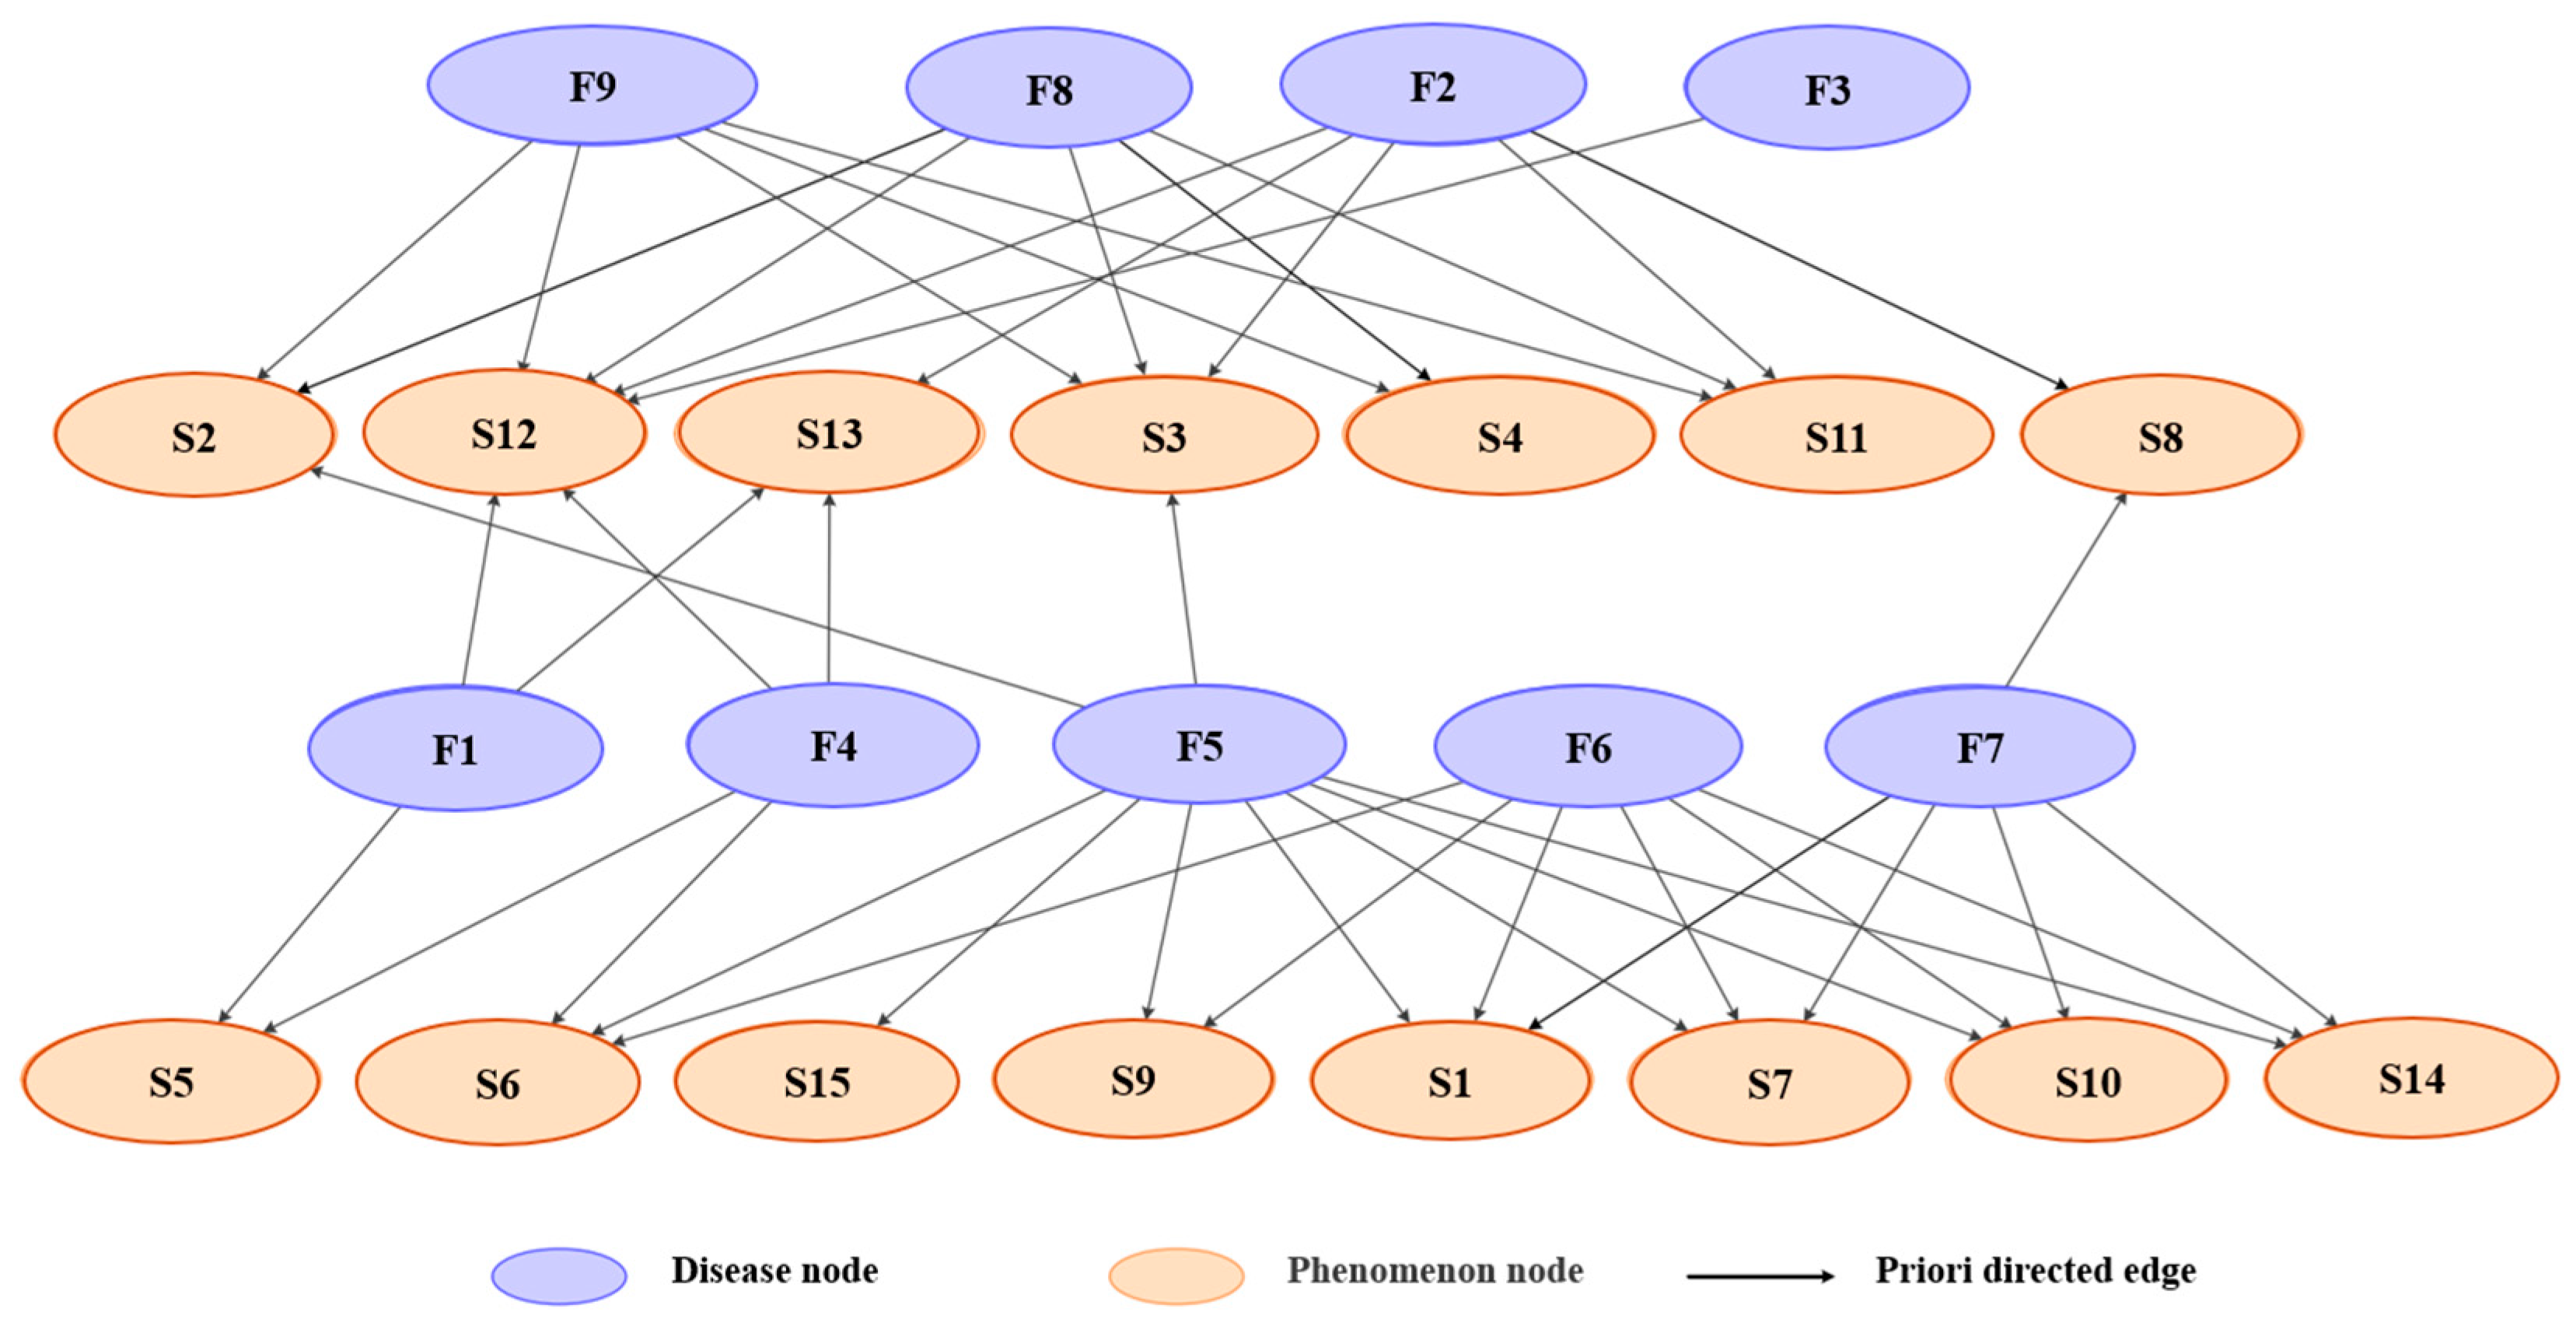
Model initialization guided by diagnostic knowledge
In the highway disease diagnosis model, a diagnosis unit represents the specific process used to diagnose a particular highway disease. Once a diagnosis unit is established, it can be reused when similar situations arise, significantly reducing the workload associated with building a new diagnosis model for each instance. The structure of the diagnosis unit model is illustrated in Figure 4.
(3)
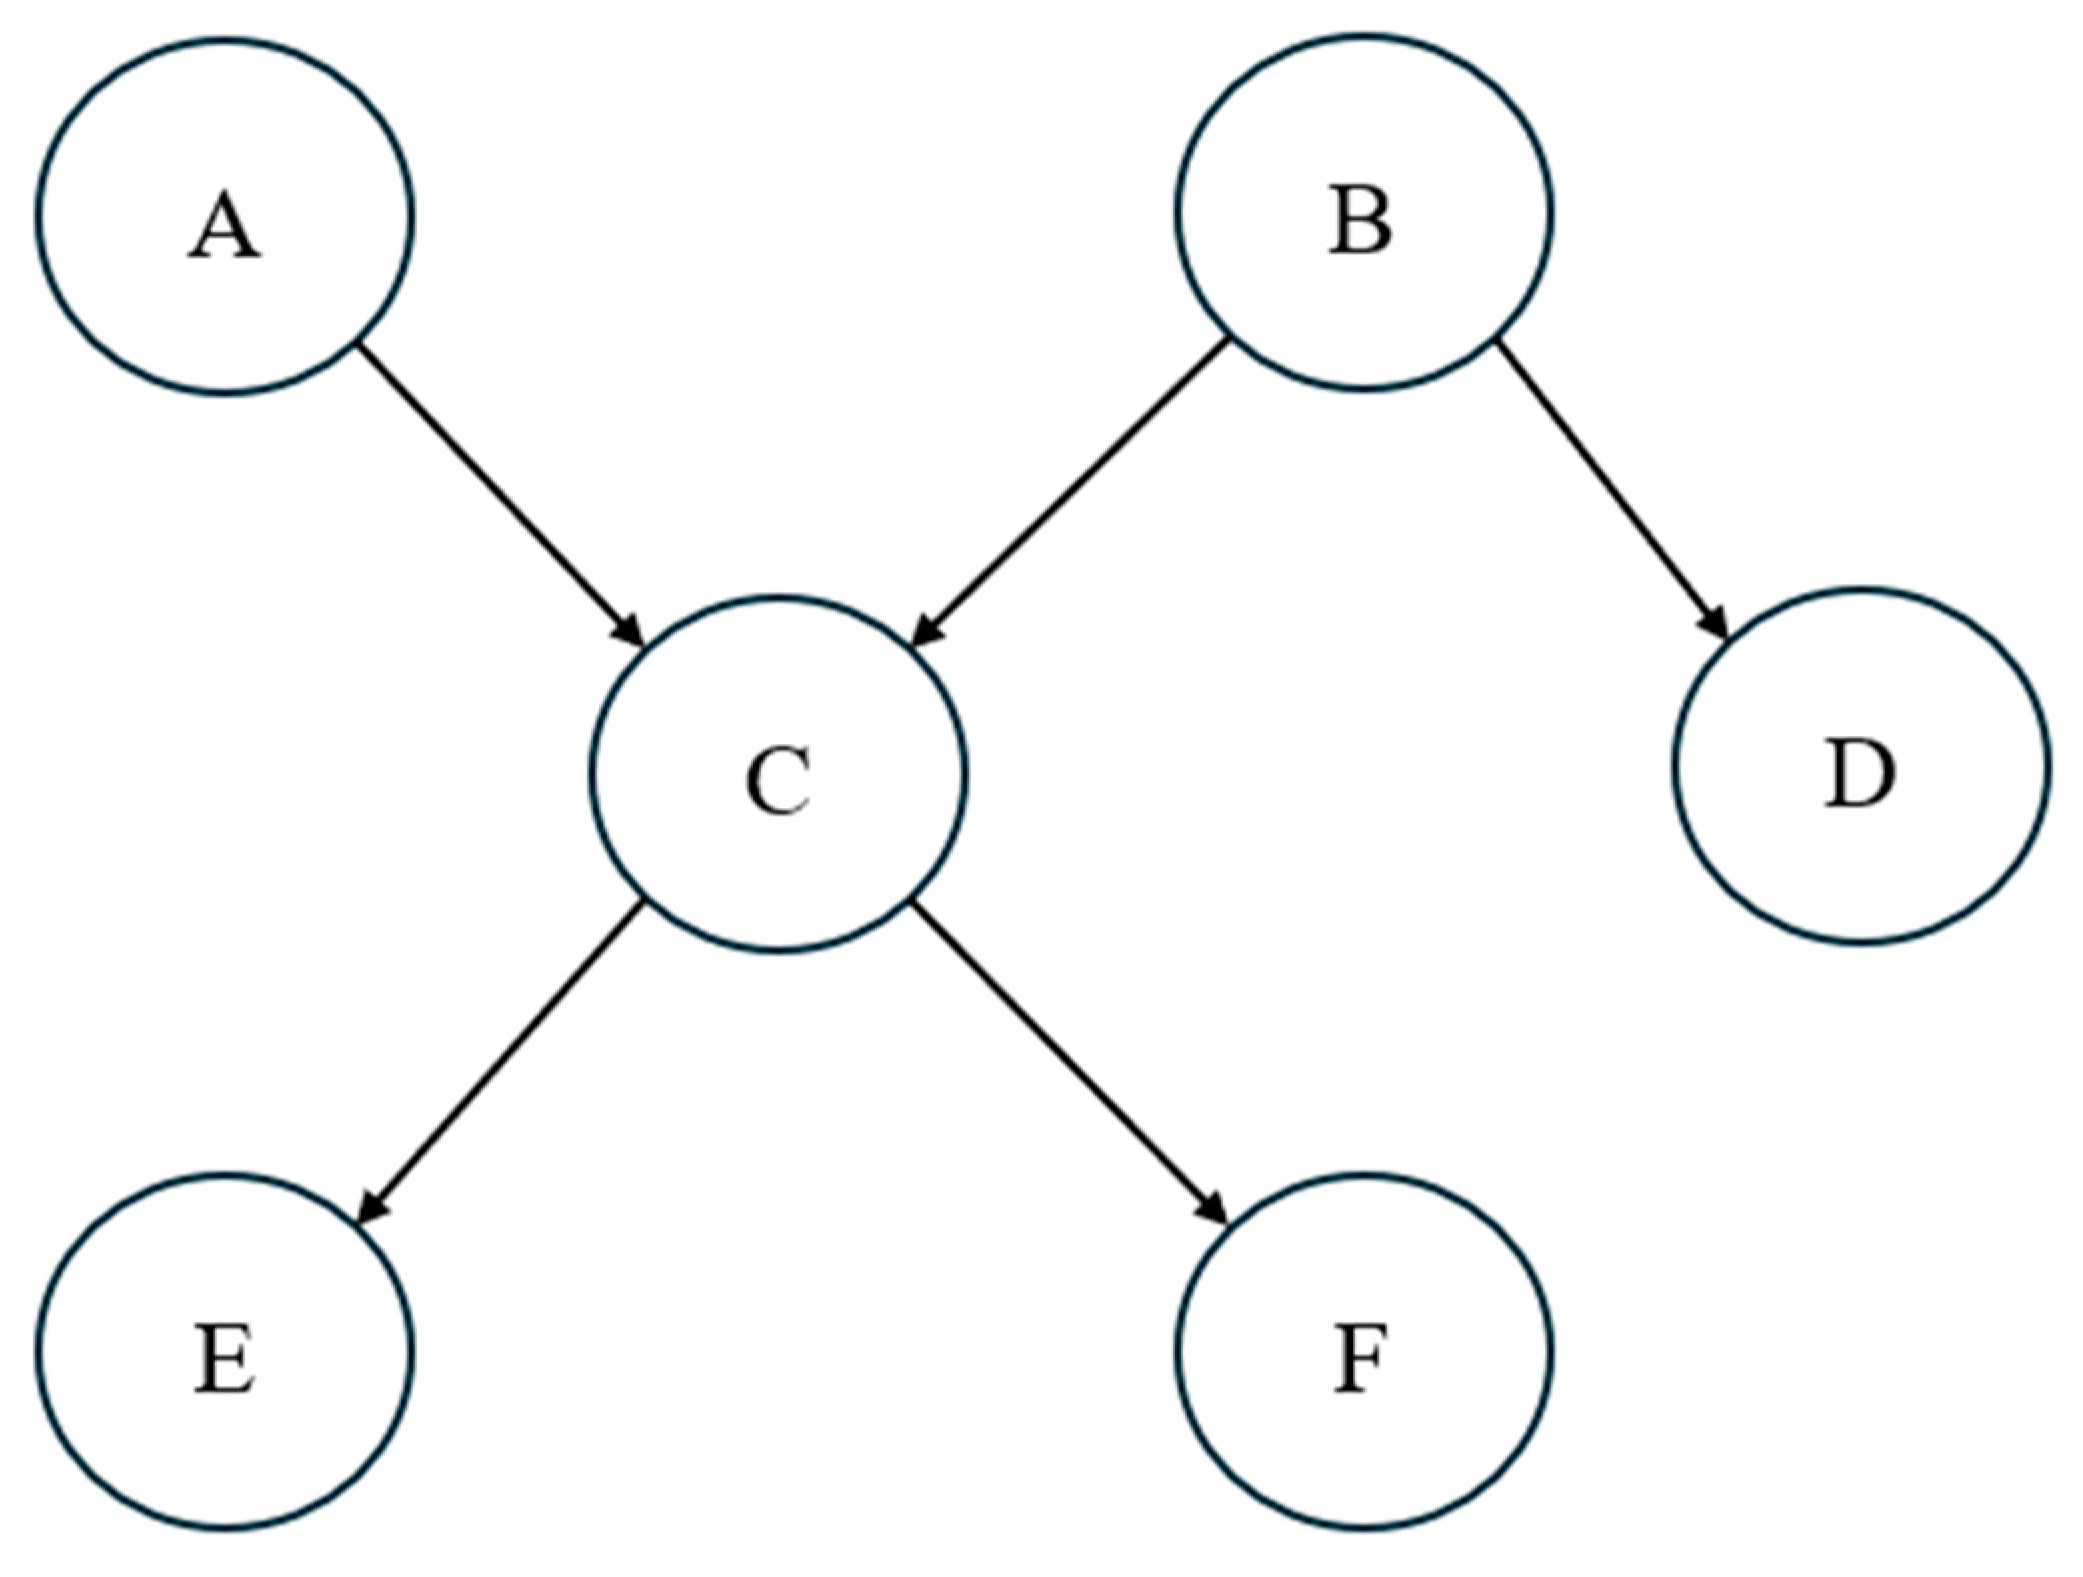
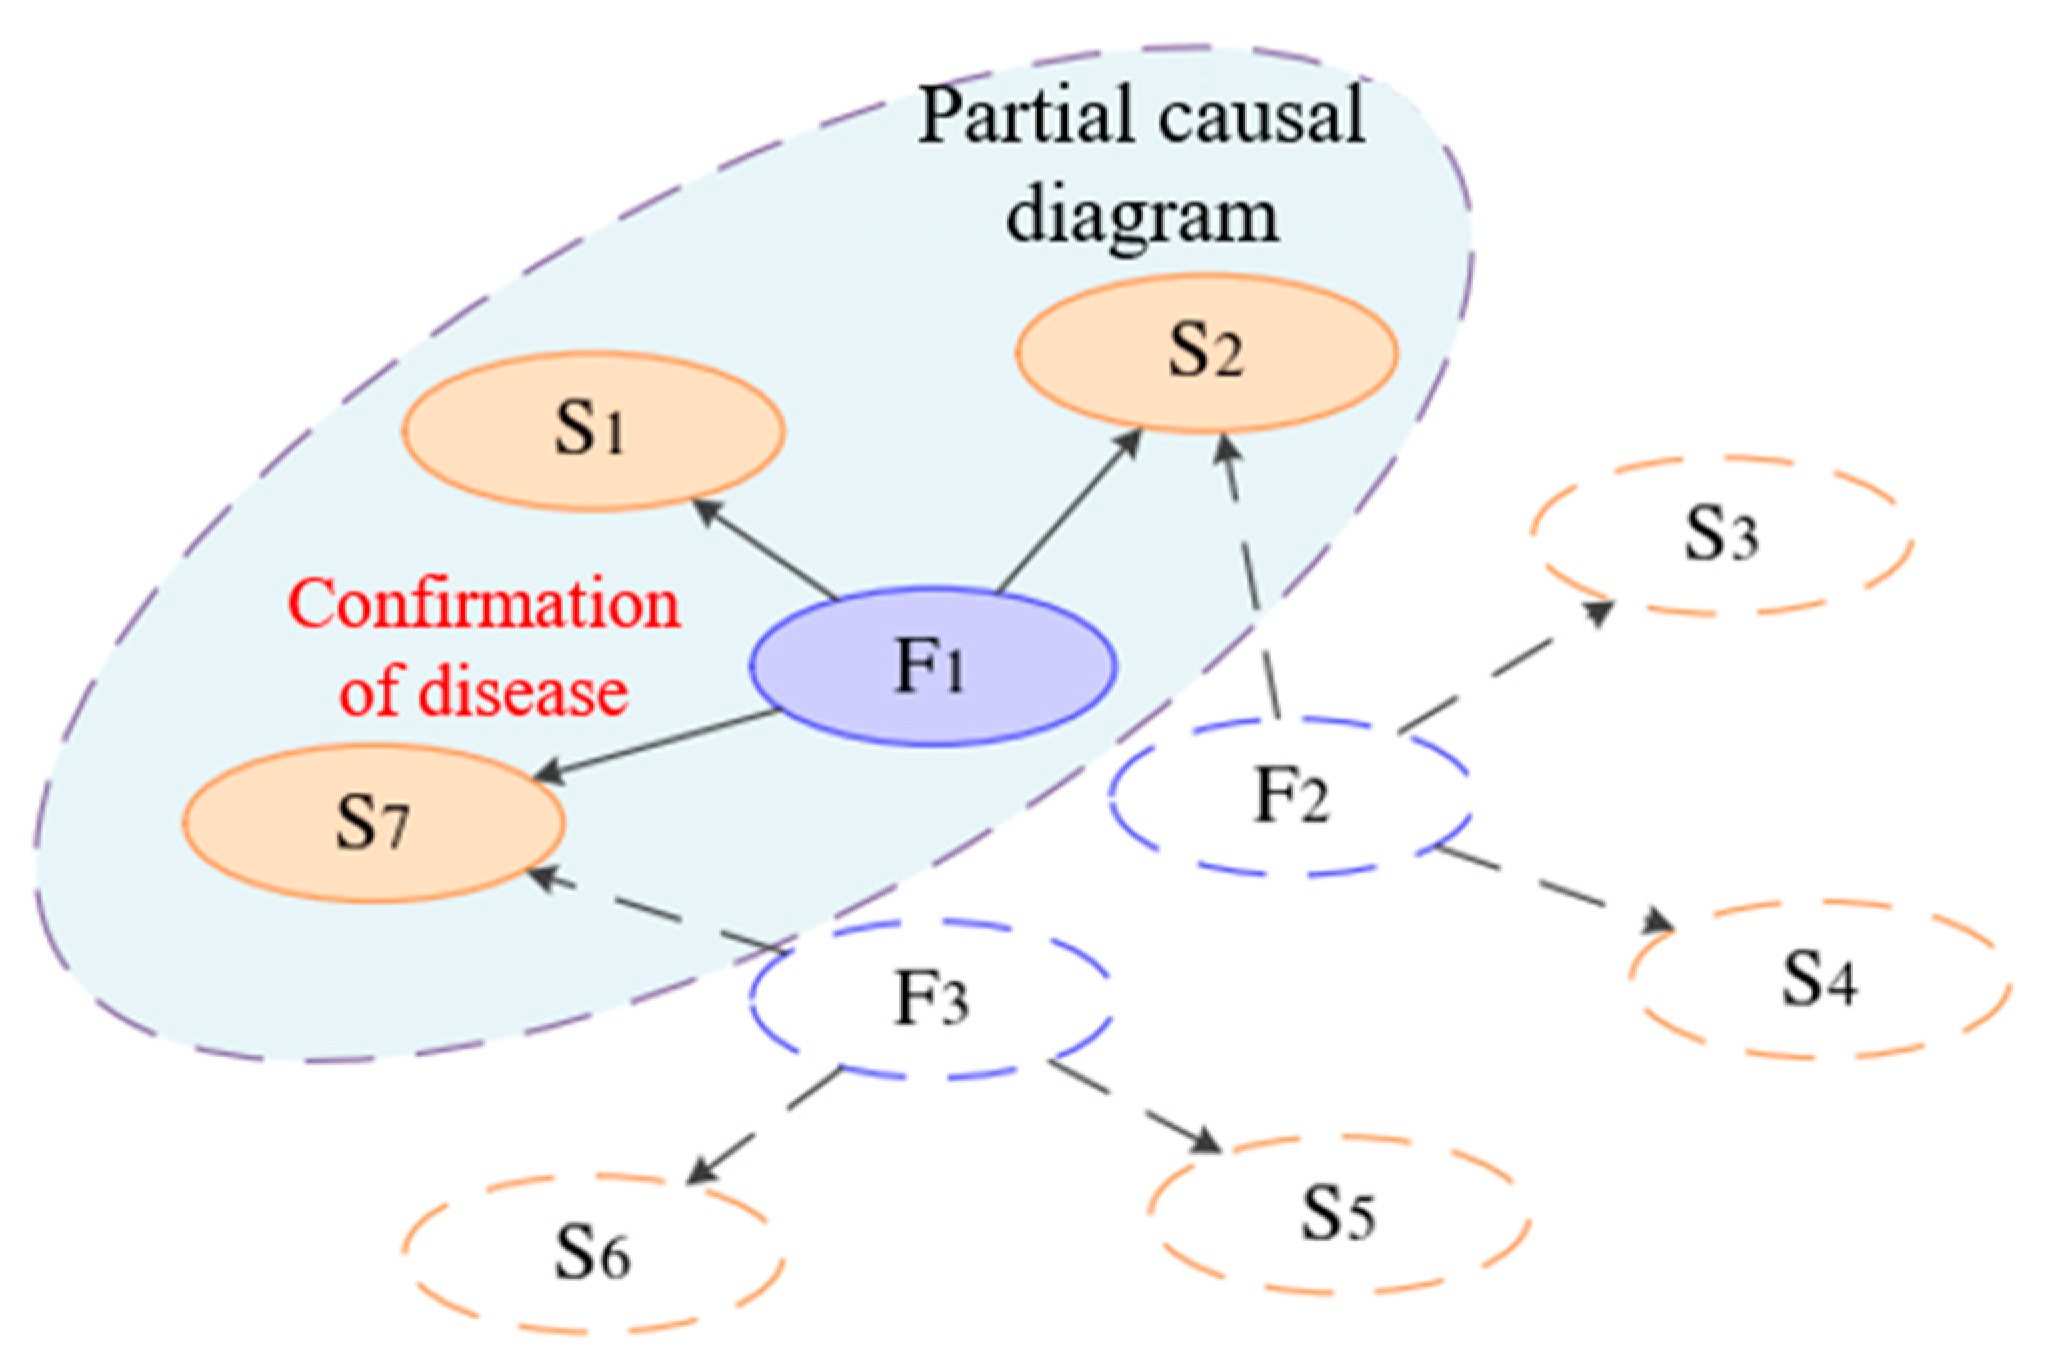
Bayesian network expression based on expert experience
This study employed an adjacency matrix to mathematically represent highway disease information. Assuming that the sample dataset includes n types of highway diseases and m types of disease phenomena, the corresponding highway disease diagnosis scheme can be abstractly expressed using a disease node set F = F 1 , F 2 , , F n and a phenomenon node set S = S 1 , S 2 , , S m . Since highway diseases act as causes and disease phenomena act as effects, in the Bayesian network highway disease diagnosis model, the directed edges representing causal relationships originate from disease nodes and point to phenomenon nodes. Consequently, the Bayesian network can be represented in matrix form as R = r i , j , where i = 1,2 , , n and j = 1,2 , , m , as illustrated in Formula (2).
R = r 1,1 r 1,2 r 1 , m r 2,1 r 2,2 r 2 , m r n , 1 r n , 2 r n , m
In the matrix, the element r i , j 0,1 represents the connection between disease nodes, as defined in Formula (3):
r i , j = 1 , F i   i s   t h e   p a r e n t   n o d e   o f   S j 0 , o t h e r w i s e
Experts, with extensive learning and experience in their fields, can preliminarily identify the causes of certain diseases based on observed phenomena. However, to minimize the potential negative impact of subjective judgment instability on the Bayesian network, this study introduced a probability matrix U = u i , j , where i = 1,2 , , n and j = 1,2 , , m , to capture fuzzy expert diagnosis knowledge, as shown in Formula (4):
U = u 1,1 u 1,2 u 1 , m u 2,1 u 2,2 u 2 , m u n , 1 u n , 2 u n , m
In matrix U , the element u i , j 0,1 represents the likelihood that experts believe there is a connection between a disease node and a phenomenon node. A larger u i , j value indicates a higher likelihood of the disease causing the phenomenon, while a smaller u i , j value suggests a lower likelihood. When u i , j is approximately 0.5, it reflects uncertainty, meaning experts cannot determine the cause of the phenomenon. In such cases, historical data must be used to train the model to identify whether a directed edge exists between F i and S j . In this study, expert-judged values for u i , j were classified into five levels of possibility, with each level selected by field experts based on their knowledge.
To incorporate uncertainty in expert judgment, a random variable a i , j was introduced, which was uniformly distributed between 0 and 1. Using the probability matrix U , a Bayesian network generated a prior model R p r i o r = r i , j , p r i o r , where i = 1,2 , , n and j = 1,2 , , m , which reflected the distribution of expert knowledge. Specifically, the element r i , j , p r i o r was determined by comparing the value of a i , j with the corresponding u i , j as follows:
r i , j , p r i o r 0 ,     i f   a i , j u i , j   1 ,     i f   a i , j < u i , j
where a i , j introduces randomness in the determination of whether there is a causal connection between disease node F i and phenomenon node S j . A higher value of u i , j increases the likelihood of a connection, while a smaller value of u i , j decreases this likelihood. When a i , j is close to u i , j , the model reflects a higher level of uncertainty, and historical data may be used to further refine the connections.
(4)
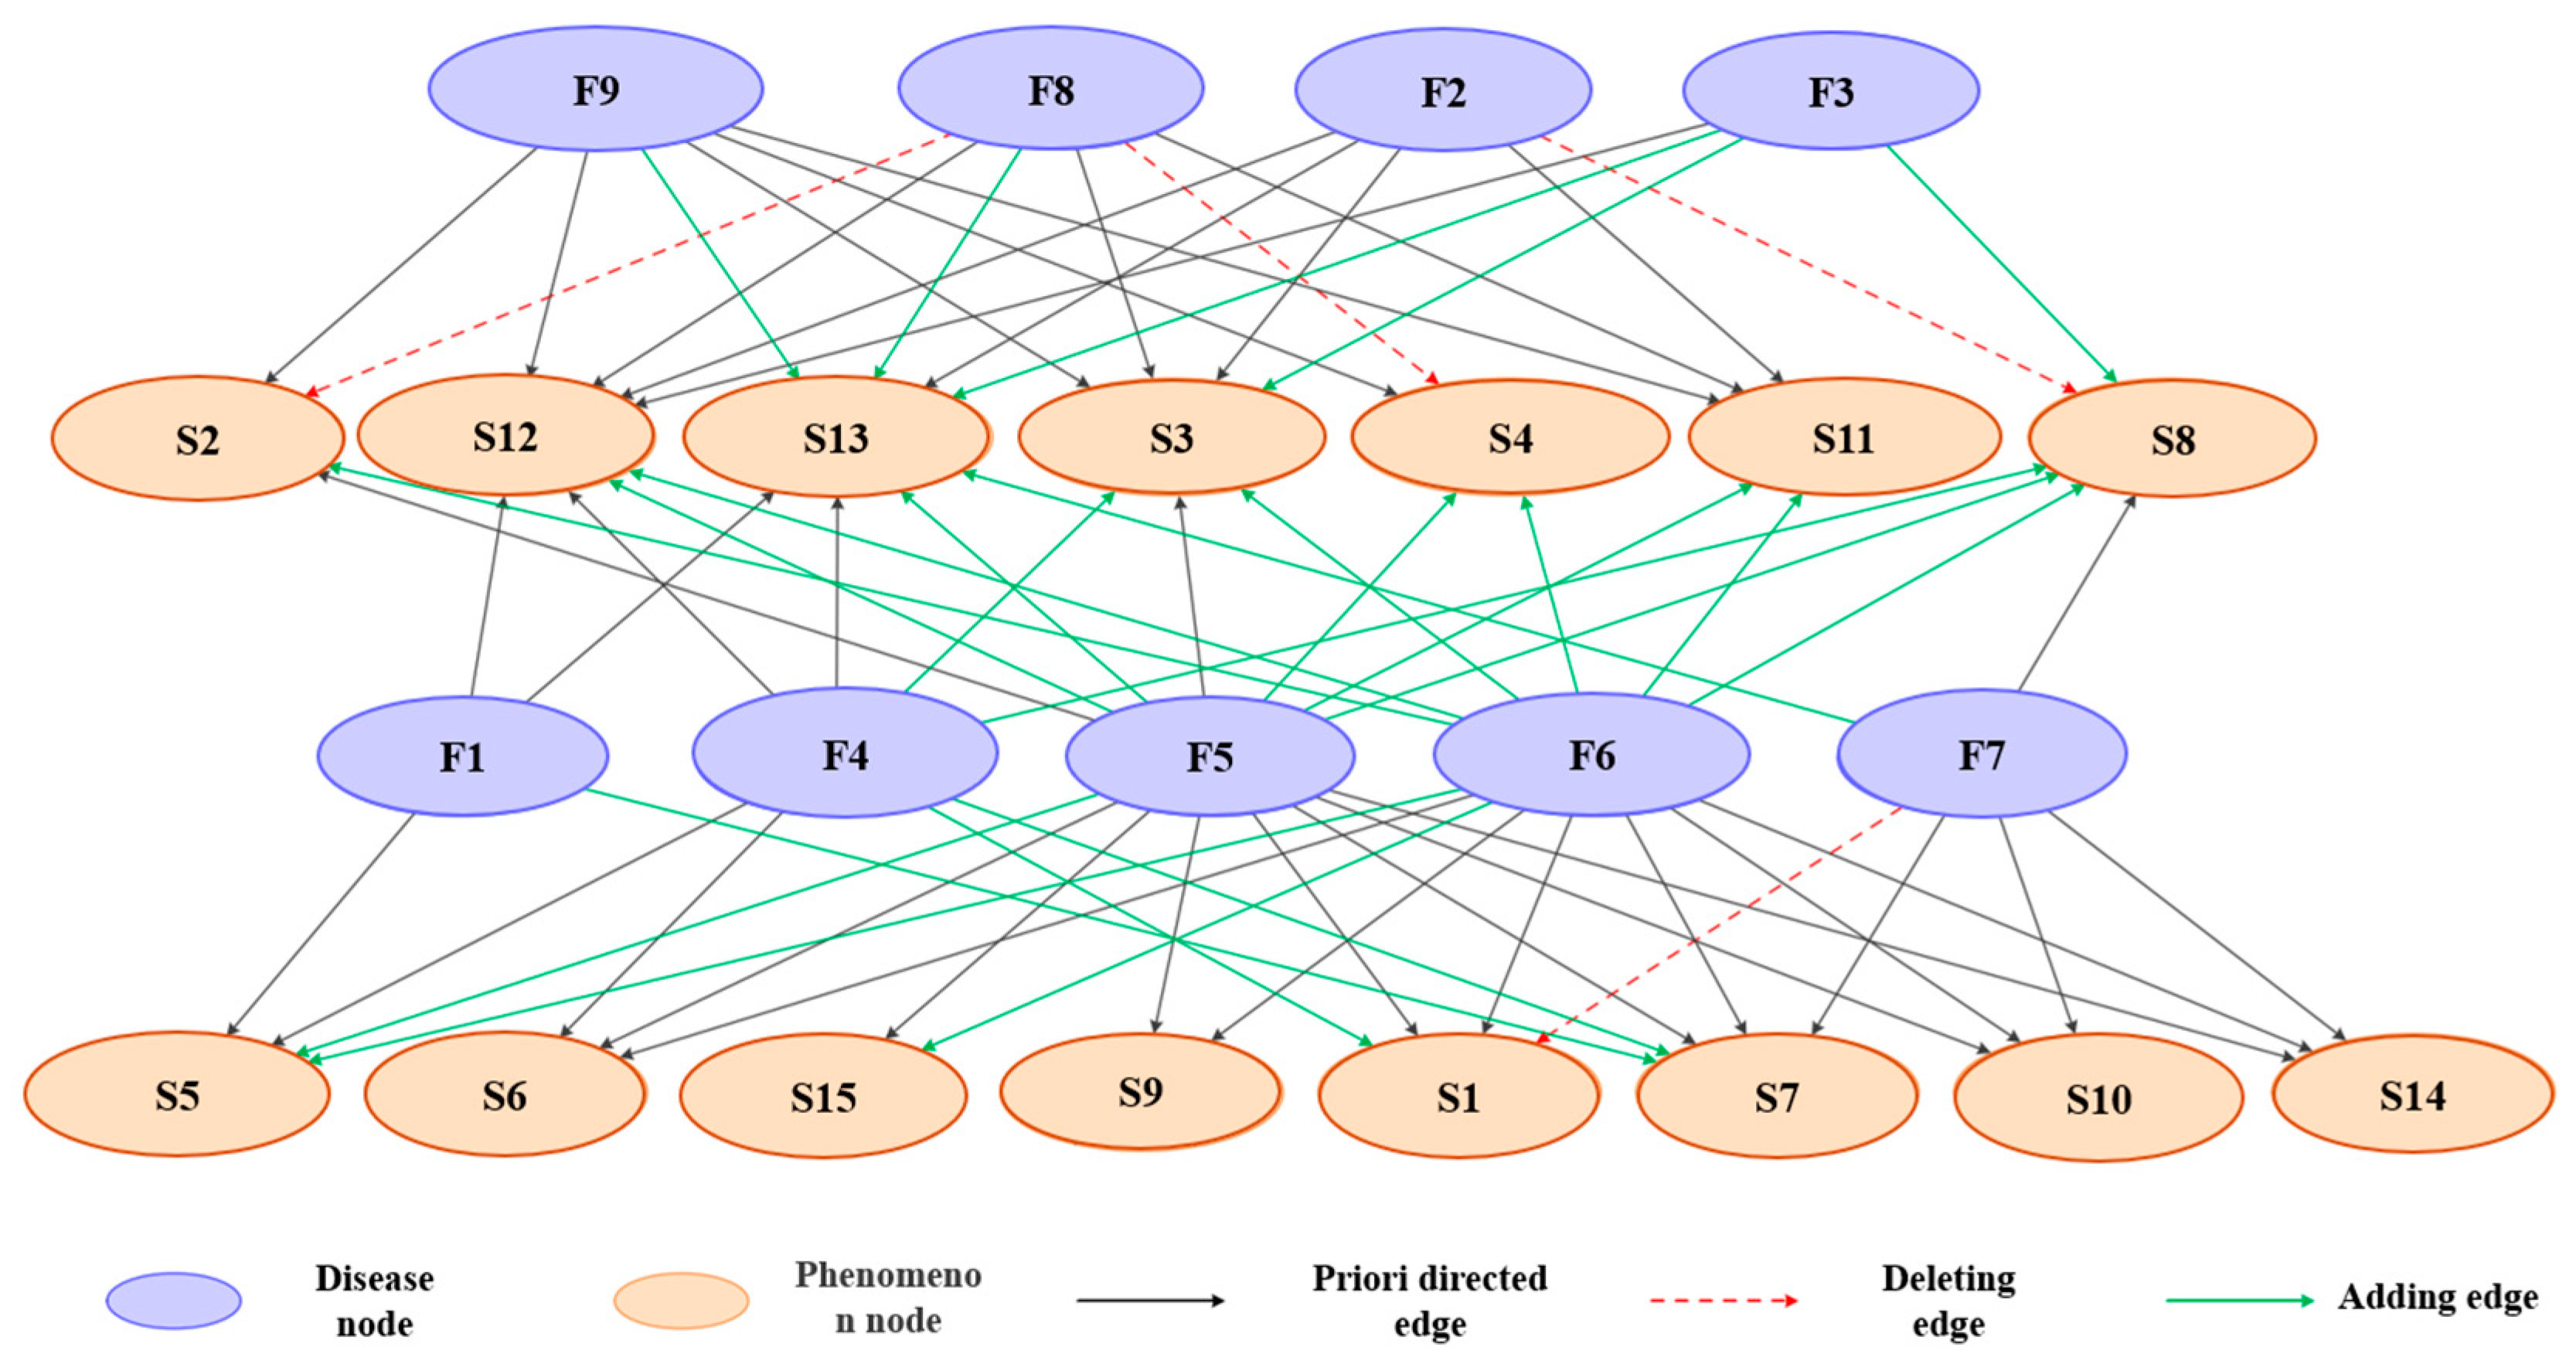
Knowledge-guided and heuristic network structure optimization
In traditional highway disease diagnosis, experts often relied on past experience to propose disposal plans. The Bayesian networks constructed in this manner followed a similar approach. While effective, this method risks missing crucial information or failing to uncover deeper associations, leading to limited model redundancy and an increased likelihood of misdiagnosis. To address these limitations, this study integrated a data-driven approach into Bayesian networks, utilizing machine autonomous learning to identify potential relationships and structures within training sample data.
Genetic algorithms, which mimic the randomness of natural evolution, were employed to enhance the Bayesian network. Rather than setting specific search goals, genetic algorithms use adaptability as a judgment criterion, incorporating processes such as genetic variation, evolutionary mechanisms, and cross-selection. These algorithms help select the optimal model structure that best fits the characteristics of the sample data. The primary goal of the Bayesian network in this study was to identify a model structure that could effectively explain the sample data, and genetic algorithms served as a key tool to achieve this objective.
However, highway maintenance text data have not yet reached the scale of big data, and the variety of disease labels remains limited. As a result, a Bayesian network constructed solely through data fitting lacks strong explanatory power for highway disease maintenance diagnosis and disposal schemes. Additionally, the model’s ability to generalize to external scenarios is constrained [25]. To overcome these challenges, this study combined expert knowledge and experience with Bayesian networks and genetic algorithms to jointly determine the model’s optimal structure. This approach preserves the wisdom and insights of experts while leveraging data to uncover hidden relationships, maximizing the effectiveness and applicability of the Bayesian network.
The specific integration process was as follows: First, a prior probability model was constructed based on expert experience. This model was then encoded and rewritten as the initial population for genetic algorithms. Next, a hybrid scoring function was defined to evaluate the evolution of the Bayesian network, providing a standardized metric for assessing the population’s adaptability. Through processes such as mutation and hybridization, successive generations were created until the optimal population with the highest adaptability was identified. The process was divided into three key steps, detailed below.
Step 1: Initialize the population
The prior probability model, represented by the Bayesian network from the previous section, was used as the initial population. Each prior model matrix R p r i o r in the initial population was encoded in binary to produce a corresponding binary bit string r 1,2 , , r 1 , m , r 2,1 , , r 2 , m , , r n , 1 , , r n , m . This encoding transformed each Bayesian network into a chromosome, representing an individual within the initial population. In this context, a Bayesian network with n phenomenon nodes and m disease nodes resulted in a chromosome length of n × m . This binary representation formed the foundation for the subsequent evolutionary steps.
Step 2: Obtain the fitness function
Each Bayesian network was treated as a chromosome within the genetic algorithm, and the fitness function evaluated the quality of individuals in subsequent generations. A hybrid scoring function was introduced to assess how well a Bayesian network aligned with the training sample data for highway disease diagnosis. This hybrid score served as the fitness index and is expressed in Formula (6):
S c o r e i m p r o v e d = S c o r e B D e u + k log f r i , j , u i , j
The hybrid scoring function consisted of two components: the data term S c o r e B D e u and the knowledge term log f r i , j , u i , j . The data term employed the Bayesian–Dirichlet equivalent uniform (BDeu) scoring criterion, which is widely used to evaluate the structure of Bayesian networks. It assessed whether the network’s composition aligned well with the training data samples, ensuring the model accurately represented underlying statistical relationships. The knowledge term evaluated the consistency between the model’s outputs and expert judgments, with the constraint coefficient k controlling the balance between data-driven and expert-driven inputs. To ensure that the logarithmic function in the hybrid scoring function remained well-defined when u i , j approached zero, we introduced a small constant ϵ such that l o g f u i j was calculated as l o g f u i j + ϵ when f u i j = 0 . This modification ensured numerical stability in the computation. Smaller k values made the model more reliant on statistical data, while larger k values increased the influence of expert knowledge. By integrating these two components, the hybrid scoring function ensured the Bayesian network effectively combined statistical insights with domain expertise, optimizing its diagnostic accuracy and reliability.
The scoring function S c o r e B D e u assumed that the prior probabilities of Bayesian network structures followed a uniform distribution, as expressed in Formula (7):
S c o r e B D e u = log P G + i = 1 n + m j = 1 q i l o g Γ α q i Γ α q i + N i j + k = 1 r i log Γ α r i q i + N i j k Γ α r i q i
where n represents the number of disease nodes, m represents the number of phenomenon nodes, r i denotes the number of states of a given node X i , and q i indicates the number of parent nodes of a particular node X i . N i j k represents the number of samples where node X i is in its k -th state, and the corresponding parent nodes are in their j -th state. N i j is calculated as k N i j k . P G denotes the prior probability distribution of the network structure G , and α is a hyperparameter controlling the strength of the prior.
To calculate the value of f r i , j , u i , j for the knowledge term in different scenarios, this study incorporated decision tree technology into the hybrid scoring function, as illustrated in Figure 5. The function f r i , j , u i , j adhered to the following three value-taking principles:
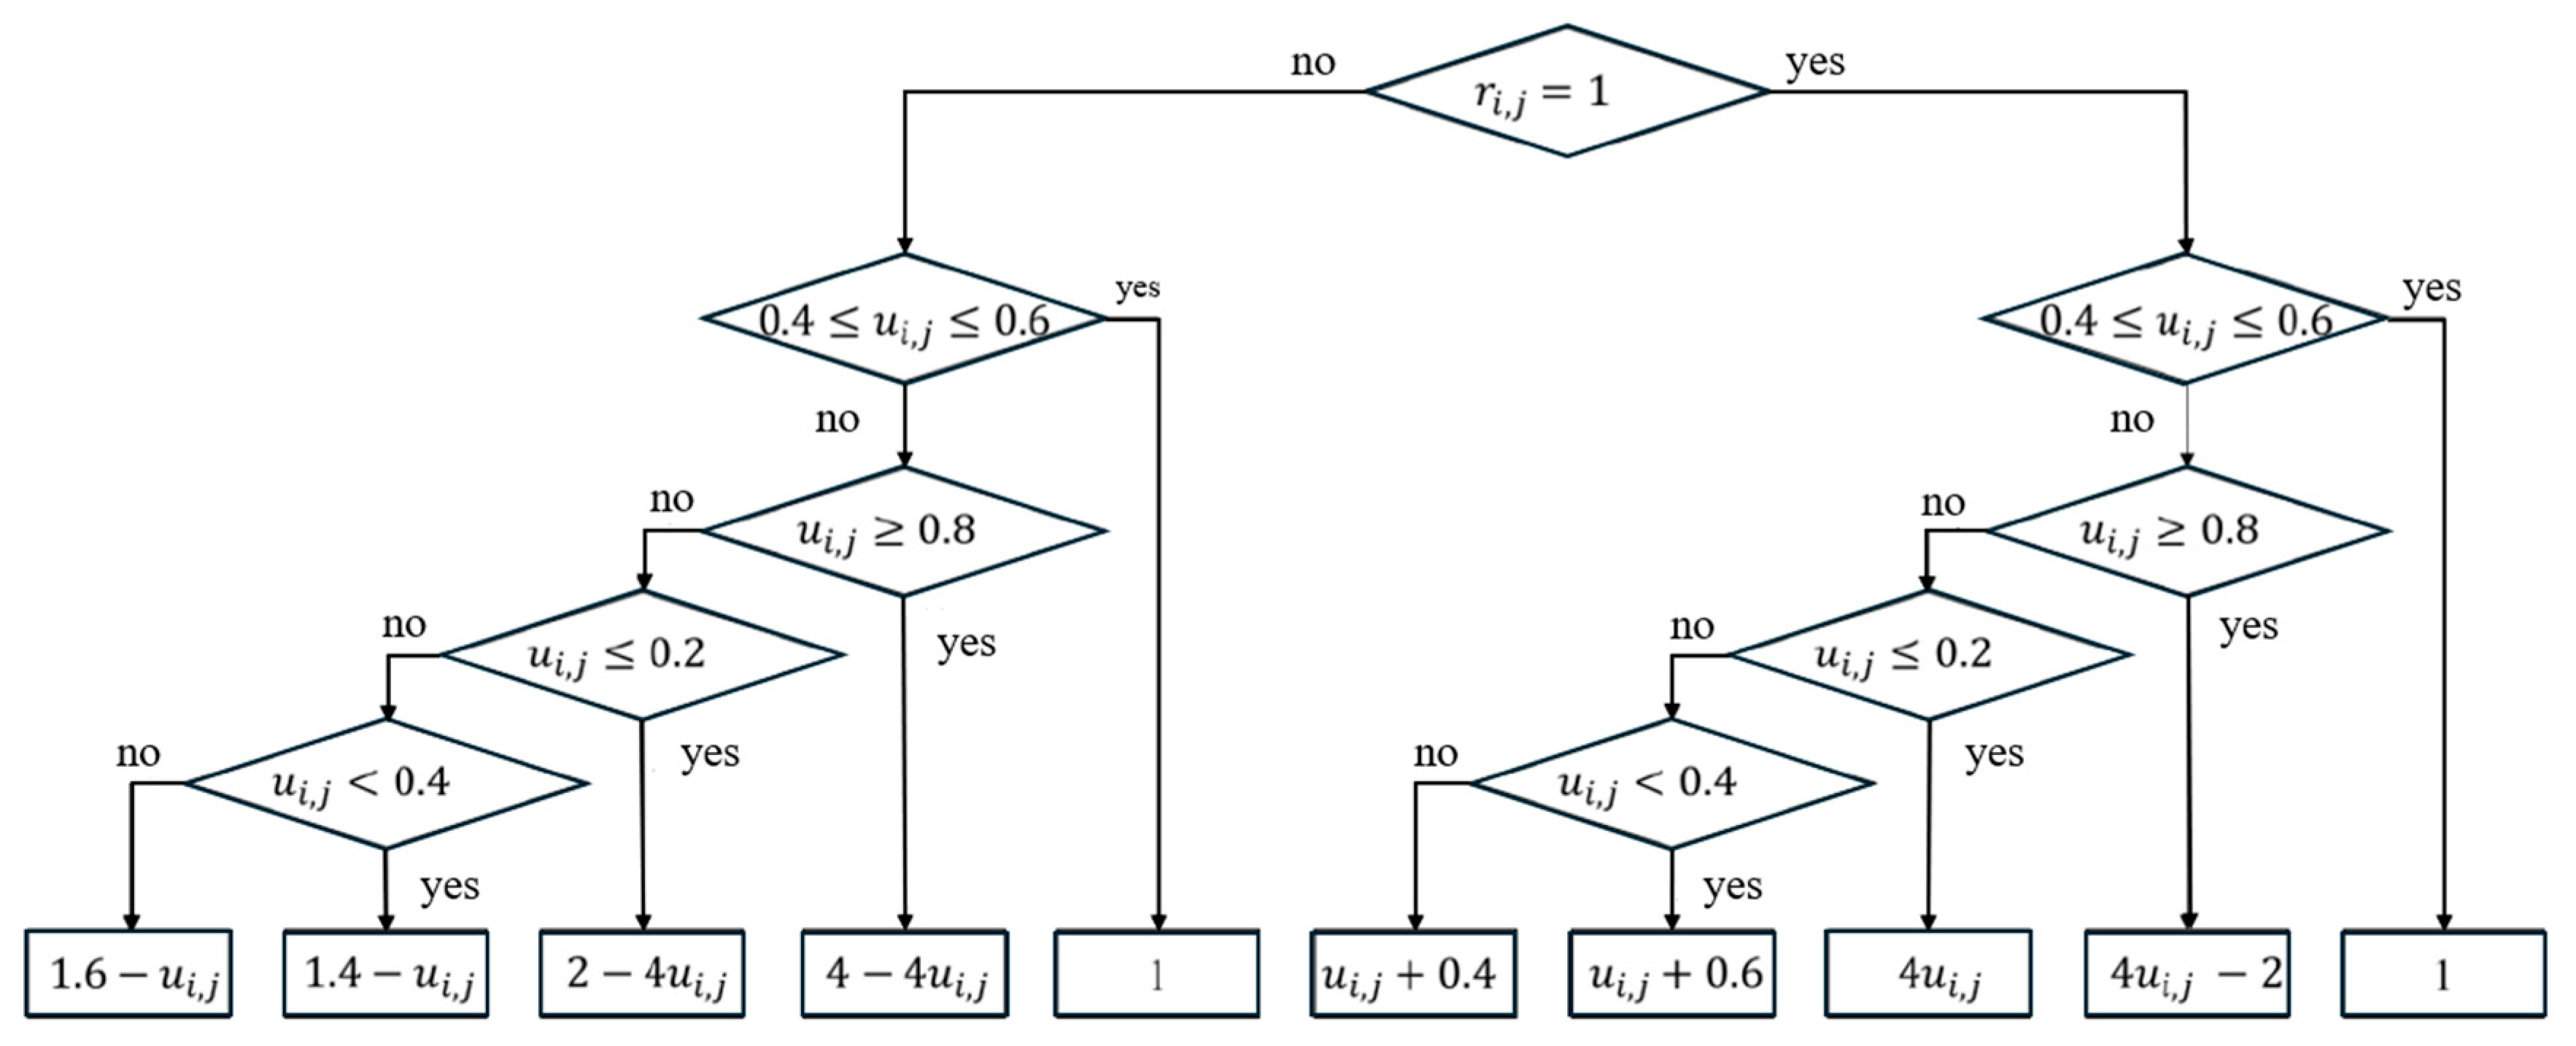
  • Uncertain Relationship: if experts cannot clearly determine whether there is a causal relationship between two nodes F i and S j (i.e., 0.45 u i , j 0.55 ), then f r i , j , u i , j = 1 . In this case, the second term in the scoring function became 0, indicating that the result was entirely derived from data-driven statistics.
  • Consistent Relationship: if the expert judgment aligns with the causal relationship between F i and S j (i.e., u i , j > 0.55 and r i , j = 1 or u i , j < 0.45 and r i , j = 0 ), then f r i , j , u i , j > 1 . In this case, the second term in the scoring function was positive. The closer r i , j and u i , j were to alignment, the larger the value of f r i , j , u i , j , resulting in a higher hybrid score.
  • Inconsistent Relationship: if the expert judgment contradicts the causal relationship between F i and S j (i.e., u i , j > 0.55 and r i , j = 0 or u i , j < 0.45 and r i , j = 1 ) , then f r i , j , u i , j < 1 . In this scenario, the second term in the scoring function was negative. The greater the discrepancy between r i , j and u i , j was, the smaller the value of f r i , j , u i , j   w a s , resulting in a lower hybrid score.
Step 3: Global optimization
To enable genetic algorithms to find the global optimal solution, populations must be iteratively generated and updated. A stronger iteration and update capability leads to more effective searching and identification of optimal solutions. Commonly used update operations in genetic algorithms include selection, crossover, and mutation. The optimal form of the network structure is achieved when the most efficient or advantageous path is identified. The roulette wheel algorithm is first used to select high-scoring populations for entry into the next generation. Crossover operators are then applied to hybridize the genes of different individuals, enhancing population diversity. Finally, mutation operations introduce new individuals to achieve novel configurations and explore additional possibilities.
In genetic algorithms, the mutation probability is typically fixed and plays a crucial role in determining the effectiveness of model optimization. A lower mutation probability reduces population diversity and risks converging on locally optimal solutions, which may lack generalizability to other datasets. Conversely, a higher mutation probability increases population diversity but also raises the likelihood of convergence issues, significantly slowing down the iteration process. In the context of highway disease diagnosis, mutation reflects whether a connection exists between two types of nodes: a value of r i , j = 0 indicates no connection, while r i , j = 1 indicates a connection. Mutation represents the creation or removal of these connections.
To refine the Bayesian network through iterative diagnosis, mutation probability guidance is employed. The mutation probability adjustment is dynamically based on whether the population falls within the optimal solution range. If optimization is unnecessary within this range, the mutation probability decreases. If optimization is required outside this range, the mutation probability increases. The specific calculation for mutation probability is shown in Formula (8), adhering to the following principles:
  • Uncertain Expert Opinion: when experts cannot determine a connection between F i and S j (i.e., 0.45 u i , j 0.55 ), the mutation probability p i , j increases p i , k p c to generate a more diverse population for random selection.
  • Expert Agreement: when experts agree on the connection between F i and S j (i.e., u i , j < 0.45 or u i , j > 0.55 ), the mutation probability p i , j decreases p i , k p c , enabling the local random search mechanism to accelerate convergence and find the optimal solution more efficiently. Particularly, as u i , j 0 or u i , j 1 , p i , j 0 .
    p i , j = 25 6 u i , j · 1 u i , j · p c
    where p c represents the base mutation probability.
(5)
Network parameter learning
In the Bayesian network, the disease node serves as the parent node, while the phenomenon node acts as its child. A single disease node can have one or more child nodes. To construct the model, the prior probability of each highway disease must be defined in advance, tailored to the characteristics of different road sections. These probabilities can be estimated by consulting historical maintenance records, interviewing grassroots maintenance personnel, and reviewing the relevant literature. For phenomenon nodes, the conditional probabilities under various conditions must also be defined, assuming the occurrence of the disease node. Calculating these probabilities using the Maximum Likelihood Estimation (MLE) algorithm provides an efficient approach to model learning. Suppose there is a historical dataset D = D 1 , D 2 , , D m . The maximum likelihood estimation l θ D of the conditional probability distribution θ for a phenomenon node can be calculated as follows (Formula (9)):
l θ D = log P θ D = log l P θ l D = l log P θ l D = i j k N i j k l o g θ i j k
where θ i j k = P X i = k P a X i = j represents the conditional probability of the child node X i being in the k -th state given that the parent node is in the j -th state. N i j k is the number of samples where X i is in the k -th state and the parent node is in the j -th state.
When l θ D reaches its maximum value, the estimated value θ i j k * for the conditional probability parameter is determined, as shown in Formula (10):
θ i j k * = N i j k N i j
where N i j = k N i j k , which represents the total number of samples where the parent node is in the j -th state.
(6)
Highway disease diagnosis, treatment plan, and interpretation
By calculating the posterior probability distribution of the j -th disease node F i corresponding to the observed combination of phenomenon nodes S , the potential diseases can be inferred. The calculation follows Formula (11):
P F i S = P ( F i ) P ( S | F i ) i = 1 n P F i P ( S | F i )
where n represents the total number of disease nodes. P F i is the prior probability distribution of the disease node F i . P S F i is the conditional probability distribution of the observed phenomenon nodes S under the condition of F i .
Once the highway disease diagnosis is complete, a local causal graph can be generated, providing valuable knowledge for future diagnoses. This graph serves two key purposes:
  • Model Validation and Revision: Experts can analyze the reasoning path of causal relationships within the graph to determine whether the diagnosis is reasonable. Based on this analysis, they can make necessary adjustments to the model, as illustrated in Figure 6.
  • Complex Disease Analysis: For highway diseases that are intricate and challenging to diagnose, the previously generated local causal graph can act as supplementary evidence. This graph aids experts in their research and judgment, offering insights into potential causes and solutions, as demonstrated in Figure 7.
This process not only enhances the accuracy and reliability of diagnoses but also builds a repository of accumulated knowledge to support ongoing improvements in highway disease management.

4. Results

4.1. Experimental Setup

This study examined a total of 483 maintenance schemes for a specific expressway section in Xinjiang. These schemes documented the reasons for highway maintenance and the corresponding treatment approaches in text form. Initially, a knowledge graph of disease maintenance for this highway was constructed based on the maintenance records, enabling the identification of common disease diagnosis units. Subsequently, a diagnosis scheme was developed using the Bayesian network model to validate the effectiveness of this approach in highway disease diagnosis. The maintenance record was like the following:
“V. Specific measures
  • Roadbed: G3012 line K1548+609-K1575+000 section to carry out cleaning debris, trimming shoulder slope weed operation, cleaning the central divider of debris and weeds, clearing the side ditch of silt, debris, and so on.
  • Pavement: The road section of G3012 line K1548+609-K1575+000 adopted slotting irrigation sealing to deal with 23,728.54 m of cracks on the road surface (outsourcing), 237 square meters of cracks on the road surface (self-packing) by anti-cracking paste (self-maintained), and comprehensive treatment of pavement and other impacts on traffic safety of the diseases, according to the maintenance plan for the road surface cleaning operations.
  • Facilities along roads: The guardrail end, round head reflective film renewal and replacement, and timely repair of damage, deformation, and rub along the facilities. Supplement the missing guardrail bolts every month. Clean the guardrail plate once a month. Keep the implementation along the demonstration road intact and flush the traffic signboards twice a year.
  • Bridge and culvert: Two fixed inspection reports about root shaking pinch, focusing on the disease of superstructure in one large bridge and two medium bridges. Culvert dredging of 106.5 cubic meters, to ensure the technically good condition of bridges and culverts.
The genetic algorithm (GA) was used to optimize the Bayesian network structure, with the following parameters: a population size of 100, a crossover rate of 0.8, a mutation rate of 0.02, and a total of 200 generations. Tournament selection was employed to choose individuals for reproduction. These parameters were selected to balance computational efficiency and the ability to explore a wide solution space while preventing premature convergence.

4.2. Experimental Results

After being organized through the knowledge graph, nine typical diseases were identified for this expressway, each with varying degrees of severity. These highway disease names and their respective degrees were represented as the disease node set, as shown in Table 2. Similarly, by analyzing the observable and measurable phenomena associated with highway diseases, 15 distinct highway disease phenomena were identified. Their corresponding states were represented as the highway disease phenomenon node set, as shown in Table 3.
Based on the extracted highway diseases and associated phenomena, experts were first consulted to propose an initial disease diagnosis scheme, which served as the foundational structure of the model. Next, the scheme was evaluated using the hybrid scoring function outlined in the second step of the knowledge-guided and heuristic network structure optimization process. This evaluation was then integrated into the Bayesian network and represented as a probability matrix:
U = 0.05 0.05 0.05 0.05 0.25 0.75 0.05 0.25 0.55 0.05 0.90 0.55 0.45 0.25 0.15 0.45 0.25 0.15 0.45 0.55 0.05 0.05 0.05 0.85 0.85 0.0 . 5 0.55 0.45 0.75 0.05 0.05 0.85 0.95 0.95 0.10 0.65 0.45 0.45 0.05 0.05 0.45 0.75 0.55 0.10 0.10 0.45 0.35 0.55 0.90 0.75 0.85 0.90 0.25 0.55 0.45 0.90 0.90 0.65 0.45 0.75 0.65 0.45 0.75 0.45 0.45 0.05 0.05 0.15 0.85 0.85 0.10 0.55 0.75 0.65 0.75 0.85 0.15 0.55 0.55 0.85 0.75 0.70 0.45 0.65 0.75 0.15 0.55 0.55 0.85 0.55 0.65 0.25 0.15 0.25 0.75 0.65 0.25 0.65 0.75 0.65 0.15 0.15 0.75 0.25 0.55 0.85 0.25 0.55 0.70 0.90 0.05 0.90 0.05 0.10 0.55 0.85 0.55 0.55 0.55 0.05 0.05 0.85 0.85 0.55 0.05 0.05 0.55 0.55 0.05 0.05 0.95 0.75 0.55 0.05 0.05
The probability matrix was then utilized to generate the initial population for structure optimization. The structure diagram of the most representative Bayesian network prior model is illustrated in Figure 8.
Next, genetic algorithms were employed for continuous iterations to identify the optimal network structure. The highway disease diagnosis scheme derived from the final Bayesian network structure achieved the best fit with the sample data. As shown in Figure 9, a comparison with the prior structure revealed that expert knowledge and experience do not always contribute to improving the model structure. In some cases, predefined relationships may lead to incorrect inferences about disease causes. To address this, directed edges that introduce unnecessary complexity were removed during the optimization process. In this study, the fitness function of the genetic algorithm was defined based on the model’s performance on the training set. Specifically, the fitness function evaluated the accuracy of the model in identifying highway diseases, considering both the network structure and its diagnostic accuracy. To mitigate the risk of overfitting, we utilized cross-validation during training, which involved evaluating the model on multiple subsets of data. Additionally, we imposed constraints on the model complexity to avoid overfitting by limiting the number of nodes and connections in the Bayesian network.
Additionally, when using genetic algorithms to search for the global optimal solution, previously unnoticed relationships between disease phenomena can be uncovered from the data. These newly discovered connections are represented as green solid lines in Figure 9, forming new directed edges. Following structure optimization, the model parameters were determined. The prior probability distribution of disease nodes was derived based on the frequency of disease occurrences, while the conditional probability distribution of phenomenon nodes was calculated using maximum likelihood estimation.

4.3. Example Analysis of Results

This study proposes two judgment rules to detect and diagnose highway diseases effectively:
1.
Disease Detection Rule: if the posterior probability of a node representing a disease being in a “no disease” state is less than or equal to 30%, it is detected that a disease has occurred at this node, even though the specific disease type may remain undetermined.
2.
Disease Diagnosis Rule: if the posterior probability of a node representing a disease being in a particular disease state is greater than or equal to 70%, the disease at this node is confirmed and its type is identified through probabilistic reasoning.
To quantitatively evaluate the effectiveness of highway disease diagnosis, three indicators were introduced:
3.
Detection Rate (DET): indicates the ability to detect the type of disease.
4.
Diagnosis Rate (DIA): measures the ability to detect the severity or state of the disease.
5.
False Alarm Rate (ERR): represents cases where a disease is falsely detected at a node.
The calculations for these indicators are defined as follows in Formulas (12)–(14):
D E T = i = 1 N j = 1 n { s g n ( q i , j ) · f i , j + [ 1 s g n ( q i , j ) · ( 1 f i , j ) ] } n · N
D I A = i = 1 N j = 1 n 1 s g n q i , j h i , j n · N
E R R = i = 1 N j = 1 n 1 s g n q i , j · f i , j n · N
where n represents the number of disease nodes and N denotes the total sample size. The variable q i , j refers to the label of the j -th disease node F j derived from data annotation, where q i , j = 0 indicates “no disease” and q i , j = c represents the c -th disease. The variable f i , j denotes the disease detection result, with f i , j = 0 meaning no disease is detected and f i , j = 1 indicating a disease is detected at F j . Similarly, h i , j represents the diagnosis result, where h i , j = 0 means no disease is diagnosed and h i , j = c indicates that the ccc-th disease state is diagnosed at F j . The function s g n x , or sign function, is defined as:
s g n x = 1 ,     x > 0 0 ,     x = 0 1 ,     x < 0
A comparison was conducted to evaluate the effectiveness of the Bayesian network obtained through traditional methods versus the optimized Bayesian network developed using data training and expert knowledge guidance, specifically in the context of highway disease diagnosis and maintenance schemes. The traditional Bayesian network approach requires experts to define the network structure beforehand, followed by training the conditional probabilities using data. The test results for the highway disease diagnosis schemes generated by both Bayesian network models are presented in Table 4. The proposed optimized diagnosis model demonstrated superior performance across all evaluation indicators. The total diseases in the schemes were 609. This improvement highlights the ability of the new model to uncover more hidden connections between diseases and phenomena, thereby significantly enhancing diagnostic accuracy. Furthermore, the relationships between disease phenomena inferred from theoretical knowledge in the professional domain align well with the prior probabilities. Additionally, the low false alarm rate underscores the reliability of the proposed model.
Additionally, the local causal graph derived from the model not only supports refining the model itself but also aids in analyzing and diagnosing complex cases. This contribution highlights its potential for advancing future research on highway disease diagnosis.

5. Discussion

Due to China’s vast territory and a wide range of working conditions for highway construction and operation, the factors to be considered and the forms of technical means that can be used are complex and diverse. The existing disease analysis and maintenance schemes in the field of highway disease maintenance are increasingly difficult to be accurately applied to the new working environment. Therefore, the disease diagnosis method proposed in this paper aimed to improve the accuracy and response speed of the decision-making process in highway maintenance work through computer technology. The fitness function used in the genetic algorithm was based on the model’s performance on the training set, which can potentially lead to overfitting. To address this issue, we employed cross-validation to ensure the model’s generalization ability. Furthermore, constraints were added to control the complexity of the Bayesian network, thus preventing overfitting by limiting unnecessary growth in network complexity. These steps together helped balance model accuracy and its generalization capability. Although this paper has made certain innovative progress in the research on highway disease diagnosis, whether it is the improvement of maintenance technical means or the improvement of the quality of grassroots staff in the field of highway disease maintenance, it will promote the data scale in the field of highway disease maintenance to grow day by day. At the same time, with the development of information technology and the improvement of highway disease maintenance requirements, it forces the update of highway disease maintenance technology and management. Currently, research related to the application of grassroots technologies in the field of public disease maintenance is relatively hot, while there is relatively little research on vertically integrating the maintenance technology industry chain. In addition, due to the lack of labeled prediction for highway maintenance that can be used for model training, it is still quite difficult to realize the knowledge graph and structuring of the entire field of highway maintenance.

6. Conclusions

This study enhances the traditional Bayesian network by incorporating a probabilistic description framework, using mathematical matrices to represent fuzzy elements in theoretical knowledge. This approach optimizes the path-solving process of the Bayesian network. By employing genetic algorithms and controlling the evolutionary process through strengthened constraint function conditions, the Bayesian network integrates features from both disease manifestation datasets and disease cause datasets. This ensures both the accuracy and broad applicability of the proposed disease diagnosis framework.
Empirical testing with highway data from Xinjiang demonstrates that incorporating knowledge-guided and data-driven learning methods into the Bayesian network achieves higher diagnostic accuracy for identifying disease causes compared to the traditional Bayesian network. Additionally, the enhanced framework provides an evidence chain for disease reasoning, assisting manual decision-making, significantly reducing the misdiagnosis rate, and offering richer diagnostic scheme information. This advancement contributes to more reliable and informed highway disease management.

Author Contributions

Conceptualization, A.W. and L.Z.; methodology, A.W., F.L., C.Z., and L.Z.; validation, A.W.; investigation, A.W., F.L., C.Z., and J.J.; data curation, F.L. and L.Z.; writing—original draft, A.W.; writing—review and editing, A.W.; supervision, A.W., F.L., C.Z., L.Z., and J.J. All authors have read and agreed to the published version of the manuscript.

Funding

This work is supported by the General Program of the National Natural Science Foundation of China (No. 72071194) and the program of MOE Social Science Laboratory of Digital Economic Forecasts and Policy Simulation at UCAS (No. E2810801).

Institutional Review Board Statement

This study did not require ethical approval as it did not involve human or animal subjects.

Informed Consent Statement

Not applicable. This study did not involve human participants.

Data Availability Statement

The data presented in this study are available on request from the corresponding author due to the inclusion of sensitive or proprietary information.

Conflicts of Interest

The authors declare no conflicts of interest.

References

  1. Ding, J. The Development Situation and Suggestions of Comprehensive Transportation in China in the New Era. J. Chongqing Jiaotong Univ. Soc. Sci. Ed. 2024, 24, 55–62+112. (In Chinese) [Google Scholar]
  2. Lakusic, S. Increasing life expectancy of road pavements. J. Croat. Assoc. Civ. Eng. 2020, 72, 515–522. (In Chinese) [Google Scholar] [CrossRef]
  3. Tuzhang Ming, X.Y.; Hu, G.; Wang, H. Research on the Mechanism of Pavement Diseases and Treatment Measures of Nanjing Airport Expressway. J. China Foreign Highw. 2007, 27, 59–61. (In Chinese) [Google Scholar]
  4. Ye, Q. Research on the Treatment Technology of Tunnel Pavement Diseases of Operating Expressway. Eng. Technol. Res. 2018, 16, 54–55+63. [Google Scholar]
  5. Zhang, J.; Liu, L.; Yang, H. An overview of intelligent construction and maintenance technology for highway subgrade engineering. Intell. Transp. Infrastruct. 2023, 2, liad019. [Google Scholar] [CrossRef]
  6. Wang, Y.; Chen, Y. Evaluation Method of Traffic Safety Maintenance of High-Grade Highway. Appl. Math. Nonlinear Sci. 2021, 6, 65–80. [Google Scholar] [CrossRef]
  7. Fallah-Fini, S.; Rahmandad, H.; Triantis, K.; de la Garza, J.M. Optimizing highway maintenance operations: Dynamic considerations. Syst. Dyn. Rev. 2010, 26, 216–238. [Google Scholar] [CrossRef]
  8. Yang, Z. Analysis on the Causes and Prevention Technologies of Typical Pavement Diseases of Expressway. West. China Commun. Sci. Technol. 2018, 7, 71–73+86. (In Chinese) [Google Scholar]
  9. Yang, P. Evaluation of Highway Maintenance Machinery Configuration Based on Fuzzy Comprehensive Evaluation Method. In Proceedings of the 2nd International Conference on Mechatronics and Intelligent Materials (MIM 2012), Guilin, China, 18–19 May 2012; pp. 319–324. [Google Scholar]
  10. Neves, L.C.; Frangopol, D.M. Condition, safety and cost profiles for deteriorating structures with emphasis on bridges. Reliab. Eng. Syst. Saf. 2005, 89, 185–198. [Google Scholar] [CrossRef]
  11. Hudson, W.R.; Haas, R. Future directions and need for innovation in pavement management. In Proceedings of the Third International Conference on Managing Pavements, San Antonio, TX, USA, 22–26 May 1994; National Academy Press: Washington, DC, USA; pp. 122–130. [Google Scholar]
  12. Söderlund, J. On the broadening scope of the research on projects: A review and a model for analysis. Int. J. Proj. Manag. 2004, 22, 655–667. [Google Scholar] [CrossRef]
  13. Finn, F.; Peterson, D.; Kulkarni, R. National Cooperative Highway Research Program Final Report. In AASHTO Guidelines for Pavement Management Systems; American Association of State Highway and Transportation Officials: Washington, DC, USA, 1990; pp. 20–27. [Google Scholar]
  14. Hall, K.T.; Lee, Y.H.; Darter, M.I.; Lippert, D.L. Forecasting pavement rehabilitation needs for Illinois interstate highway system. In Transportation Research Record 1455; National Academy Press: Washington, DC, USA, 1994; pp. 116–122. [Google Scholar]
  15. Wu, T. Application of Comprehensive Geophysical Prospecting Technology in the Detection of Highway Subgrade Diseases. Commun. Sci. Technol. Heilongjiang 2018, 7, 4–5. (In Chinese) [Google Scholar]
  16. Aimin Sha, R.C.; Gao, J.; Zheng, T.; Li, S. Highway Subgrade Disease Recognition Based on Cascade Convolutional Neural Network. J. Chang. Univ. Nat. Sci. Ed. 2019, 39, 1–9. (In Chinese) [Google Scholar]
  17. Xiao, G.J.W.; Wang, D. Research on the Accurate Diagnosis Technology of Expressway Diseases in Coastal Areas. Tianjin Constr. Sci. Technol. 2015, 25, 62–64. (In Chinese) [Google Scholar]
  18. Yihui, H.L.X.; Banghua, X. Application Research on Highway Maintenance Construction Safety Intelligent Supervision System Based on Internet of Things. Highway 2019, 64, 282–285. (In Chinese) [Google Scholar]
  19. Ran, X. Research and Analysis on Preventive Maintenance of Expressway Asphalt Pavement. Hous. Real Estate 2018, 34, 240. (In Chinese) [Google Scholar]
  20. Su, H.D.R.; Han, D.; Wang, X.; Yu, J. Research on the Collection, Classification and Storage of Road Maintenance Big Data. J. Highw. Transp. Res. Dev. Appl. Technol. Ed. 2019, 15, 256–259. (In Chinese) [Google Scholar]
  21. Pearl, J. Fusion, Propagation and Structuring in Belief Networks. Artif. Intell. 1986, 29, 241–288. [Google Scholar] [CrossRef]
  22. Herroelen, W.; Leus, R. Project scheduling under uncertainty: Survey and research potentials. Eur. J. Oper. Res. 2005, 165, 289–306. [Google Scholar] [CrossRef]
  23. Katipamula, S.; Brambley, M.R. Methods for fault detection, diagnostics, and prognostics for building systems—A review, part I. HVAC&R Res. 2005, 11, 3–25. [Google Scholar]
  24. Lou, C.; Li, X.; Atoui, M.A. Bayesian network based on an adaptive threshold scheme for fault detection and classification. Ind. Eng. Chem. Res. 2020, 59, 15155–15164. [Google Scholar] [CrossRef]
  25. Madsen, A.L.; Søndberg-Jeppesen, N.; Sayed, M.S.; Peschl, M.; Lohse, N. Applying object-oriented bayesian networks for smart diagnosis and health monitoring at both component and factory level. In Advances in Artificial Intelligence: From Theory to Practice: 30th International Conference on Industrial Engineering and Other Applications of Applied Intelligent Systems, IEA/AIE 2017, Arras, France, 27–30 June 2017, Proceedings, Part II; Springer: Cham, Switzerland, 2017; pp. 132–141. [Google Scholar]
Figure 1. Overall structure diagram.
Sustainability 17 01450 g001
Figure 2. Partial display of highway disease atlas.
Sustainability 17 01450 g002
Figure 3. Bayesian network example.
Sustainability 17 01450 g003
Figure 4. Bayesian network diagnostic unit model.
Sustainability 17 01450 g004
Figure 5. Numerical calculation decision tree of f r i , j , u i , j in hybrid scoring function.
Sustainability 17 01450 g005
Figure 6. Local causal diagram for explaining disease diagnosis results.
Sustainability 17 01450 g006
Figure 7. Local causal diagram for assisting in determining the root cause of diseases.
Sustainability 17 01450 g007
Figure 8. Bayesian network structure based on expert diagnosis.
Sustainability 17 01450 g008
Figure 9. Comparison between the optimized structure and the prior structure of Bayesian network.
Sustainability 17 01450 g009
Table 1. Dataset information.
DatasetHighway Diseases
Entity Quantity739
Quantity of Relationships51
Quantity of Attribute Types28
Table 2. Summary of highway disease nodes in Bayesian network.
Serial NumberHighway Disease NameDegree of Highway Disease
F1CollapseSlight, Medium, Severe
F2LandslideSmall, Medium, Large
F3SubsidenceDeep, Shallow
F4RuttingDeep, Shallow
F5Pushing upSmall Height Difference, Large Height Difference
F6Frost boilingNone, Not Obvious, Relatively Obvious, Obvious
F7PotholeDeep, Shallow
F8Block crackingLarge Block Size, Small Block Size
F9Edge failureLarge Width, Small Width
Table 3. Summary of highway disease phenomenon nodes in Bayesian network.
Serial NumberHighway Disease
Phenomenon Name
State of Highway Disease Phenomenon
S1LithologyExtremely Soft, Soft, Sub-Hard, Hard
S2Gradient of Slope<15°, 15–20°, 20–45°, >45°
S3Height of Slope<10 m, 10–30 m, 30–60 m, >60 m
S4Occurrence of Structural PlaneAlong Slope Direction, Oblique Intersection, Transverse
Intersection, Against Slope Direction
S5Connectivity of
Structural Plane
Good, Relatively Good, Fair, Poor
S6Filling CharacteristicsGood, Relatively Poor, Poor
S7Weak Bottom LayerNone, Poor Water Content in Interlayer, Half Water Content in Interlayer, Rich Water Content in Interlayer
S8Ground CrackNone, Not Obvious, Relatively Obvious, Very Obvious
S9Rear Edge FissureUnderdeveloped, Closed, Relatively Developed, Obvious
S10Boundary ConditionNone, Not Obvious, Slight, Clear
S11Groundwater LevelLower Than Subgrade Toe, Lower than One-Third of Subgrade Height, Lower than Subgrade Top Surface, Higher than
Subgrade Top Surface
S12Soil PropertySandy Gravel Soil, Cohesive Soil, Silty Soil, Soft Soil
S13Filling Height<2 m, 2–5 m, 5–10 m, >10 m
S14Subsidence Depth<30 mm, 30–50 mm, 50–100 mm, >100 mm
S15Subsidence Length<5 m, 5–10 m, 10–20 m, >20 m
Table 4. Comparison of the effects of traditional Bayesian network and optimized Bayesian network in diagnosing highway maintenance plans.
MethodDETDIAERR
Traditional Bayesian Network92.69%92.53%0.75%
Knowledge-Guided and Heuristic Bayesian Network95.17%95.53%0.72%
Disclaimer/Publisher’s Note: The statements, opinions and data contained in all publications are solely those of the individual author(s) and contributor(s) and not of MDPI and/or the editor(s). MDPI and/or the editor(s) disclaim responsibility for any injury to people or property resulting from any ideas, methods, instructions or products referred to in the content.

