Article

A Study of the Life Cycle Exergic Efficiency of Hydrogen Production Routes in China

by
Lixing Zheng
1,2,*,
Xuhui Jiang
1,
Xi Zhang
1,
Song Wang
1,
Ruiqiong Wang
1,
Linbin Hu
1,
Kaiji Xie
3,* and
Peng Wang
2
1
PowerChina Chongqing Engineering Co., Ltd., Chongqing 400060, China
2
Guangzhou Institute of Energy Conversion, Chinese Academy of Sciences, Guangzhou 510640, China
3
Chongqing Institute of Green and Intelligent Technology, Chinese Academy of Sciences, Chongqing 400713, China
*
Authors to whom correspondence should be addressed.
Sustainability 2025, 17(4), 1413; https://doi.org/10.3390/su17041413
Submission received: 12 December 2024 / Revised: 20 January 2025 / Accepted: 23 January 2025 / Published: 9 February 2025

Abstract

:
Hydrogen is a clean secondary energy source that plays an important role in promoting the region’s low-carbon energy mix transition. Currently, most of the evaluations of hydrogen production technologies in terms of energy consumption focus on energy efficiency, and fewer studies have been conducted at the level of exergy. In this paper, we use the life-cycle approach and the energy quality coefficient method to assess and discuss the exergic efficiency of three technology routes, namely hydrogen production from natural gas, propane dehydrogenation, and hydrogen production from green electricity, which were carried out in China. Hydrogen production from natural gas was found to have the lowest exergic efficiency, with exergic losses mainly from the compression process, high-temperature chemical reactions, and reduced catalyst activity. Propane dehydrogenation was found to be about 16% more exergic efficiency than natural gas to hydrogen, with exergic losses mainly from compression. Hydrogen production from wind power has the highest exergic efficiency, with exergic losses mainly due to the electricity required to run the electrolyzer. By analyzing the changes in energy consumption and exergy consumption of China’s future hydrogen supply, this paper found that the energy consumption per unit of hydrogen production will decrease to 9.2 kg of SC/kg of H2 and the exergy consumption per unit of hydrogen production will decrease to 9.6 kg of SC/kg of H2 in 2030. The exergic efficiency of the hydrogen production process in China will be further improved as the proportion of hydrogen production from electrolytic water in the hydrogen production structure increases.

1. Introduction

The rising energy demand and the decline of fossil fuels have prompted mankind to seek alternative sources of energy. Hydrogen, as a clean secondary energy source, can be obtained by different technological routes of hydrogen production. Currently, hydrogen production from fossil fuels is the main method for global hydrogen supplies.
Researchers have carried out more studies in the area of hydrogen production technology assessment. Dermühl evaluated the technological maturity, levelized cost and carbon footprint of several of the most promising routes to hydrogen production, such as hydrogen production from methane pyrolysis and electrolysis of water [1]. Ji (2023) conducted an LCA of the environmental impacts of high-temperature gas-cooled reactor gas hydrogen production technology based on the S-I cycle [2]. Zheng et al. (2022) conducted a comprehensive LCA of the energy consumption, carbon emissions and costs of several hydrogen production routes, including hydrogen from coal gasification, natural gas, propane dehydrogenation, wind power and photovoltaic, based on local Chinese data [3]. Although there are differences in the treatment of technology chain boundaries, the evaluation indicators are basically centered on the energy consumption, emissions and cost of hydrogen production.
In terms of energy flow analyses, most of the existing studies have been carried out at the energy consumption level, neglecting the issue of energy quality changes during hydrogen production. The evaluation of exergy-saving capacity enriches the judgement of the value of energy availability [4]. Additionally, a life-cycle exergy analysis of the hydrogen production route can also identify the links in the hydrogen production technology chain that led to exergic losses and the reasons for them, and suggest process optimization to reduce the irreversibility of the hydrogen production system.
In existing studies, ROSEN (1996) has performed process evaluations of the energy and exergic efficiency of hydrogen production from coal gasification, hydrogen production from natural gas reforming, and hydrogen production from water electrolysis, thus laying the foundation for process comparisons of energy and exergic efficiency in hydrogen production [5]. However, the ROSEN’s study was not carried out at the LCA scale, and the ROSEN energy analysis of the hydrogen production process still needs further validation due to the process development conditions. Ozbilen (2012) conducted a technology assessment of nuclear energy-based thermochemical hydrolysis for hydrogen production using a combination of the LCA methodology with the exergy analysis model (exergy life-cycle analysis, ExLCA) and found that the location of the greatest irreversibility (the greatest exergic losses) is in the uranium processing chain [6]. Granovskii (2007) used the ExLCA methodology to assess the exergic efficiency, economics and environmental impact of four technology routes: oil vehicle emissions, natural gas hydrogen vehicle water, solar energy hydrogen vehicle water, and wind energy hydrogen vehicle water [7]. Zhang et al. (2019) conducted a technology assessment of various biomass hydrogen production technologies using exergy analysis, and found that the factors affecting the exergic efficiency of biomass steam gasification for hydrogen production mainly include the yield of hydrogen and the chemical exergy contained in the biomass [8]. Ayşenur (2022) conducted an exergy analysis of hydrogen production using a thermochemical cycle driven by solar energy from the perspective of instantaneous solar radiation and concentration ratio [9]. Guo (2024) conducted an exergy analysis of two routes for hydrogen production from biomass and nuclear energy routes, and identified the process links that lead to exergic losses [10]. Ayhan (2025) studied the energy efficiency, exergic efficiency, carbon emission reduction and economic benefits of solar hydrogen production systems at different tilt angles [11].
This paper revealed the causes and evolution of energy and exergy consumption in hydrogen production process from the perspectives of energy saving and exergy saving through the life cycle exergy evaluation of hydrogen production routes in China. A method based on the energy quality coefficient method for life cycle exergy calculation according to the energy quality classes of different energy varieties was also proposed to simplify the process of exergy calculation.
In this paper, the exergy analyses of hydrogen production from natural gas, propane dehydrogenation, and hydrogen production from green power were performed, and process recommendations were made to reduce exergic losses in hydrogen productions. By comparing the energy efficiency and exergic efficiency of different hydrogen production routes, the evolution law of energy saving and exergy saving was studied. The results of this study can provide a scientific basis for the development and deployment of hydrogen production methods and roadmap design in China.

2. Methodology

2.1. Life Cycle Exergy Analysis

The life cycle assessment (LCA) method is a methodology for evaluating the inputs and loads of each unit of a functional product, and includes four parts: scoping, inventory analysis, impact assessment, and interpretation and discussion [12]. The boundary of the LCA method used in this paper is shown in Figure 1.
This paper conducts a technical assessment of LCA for three important hydrogen production routes in China (hydrogen production from natural gas, propane dehydrogenation, and hydrogen production from green electricity). A basic database for LCA research on hydrogen production in China has been collected and constructed. From a life cycle perspective, an energy-based assessment of the staged and overall exergic efficiency and exergic losses of the process chain was carried out to identify the process with the highest exergy losses for each hydrogen production route and to make process recommendations.
The three hydrogen production routes were selected based on the following considerations. In China, hydrogen production from natural gas reforming has a long history of development and a high degree of technical maturity. Some provinces in China have abundant natural gas resources and relatively low natural gas prices. Therefore, this method of hydrogen production is expected to become one of the near-term domestic methods of large-scale hydrogen production. Propane dehydrogenation technology is a hydrogen production technology that produces hydrogen as a by-product of the industry. It is a process that uses propane to produce propylene and combustible gas. The by-product hydrogen that is produced is collected and transported to the hydrogen end-use terminal. This is currently an important method of supplying hydrogen in Guangdong, Fujian, Shandong and other provinces. Hydrogen production from wind power and photovoltaic power generation are both forms of hydrogen production from renewable energy. This technology can utilize inexhaustible renewable energy, and the reaction of electrolyzing water to produce hydrogen does not emit carbon, which is the development direction of China’s hydrogen energy industry.
This paper takes the production of 1 kg H2 (25 °C, 20 MPa) as the object of accounting, with an analysis and assessment of its life cycle exergy loss Exdest (MJ/kgH2) and exergy efficiency Eη (%).

2.2. Exergy Calculation Method

“Exergy” is defined as the maximum amount of work that can be produced in a system or during the flow of matter or energy in a reference environment.
When a system or flow state is out of equilibrium with the base environment, the maximum value that can be changed is “exergy” [13].
Exergic efficiency [4]:
E x φ = E x b E x c
where: E x c is the inflow of exergy, which contains the inputs of exergy for the life-cycle process for each functional unit of product produced (1 kg H2 (25 °C, 20 MPa)), and E x b is the outflow of exergy.
The output exergy calculated in this paper only considers the hydrogen portion, and does not include steam, and other exergy from the by-product band.
Exergic losses [4]:
E x d e s t = E x c E x b
Exc is the inflow exergy, Exb is the outflow exergy.
Exergy consists of [4]:
E x = E x p h + E x c h
E x c is physical exergy, E x b is chemical exergy.
Chemical mixture exergy [4]
( E x c h ) A = i = 1 m N i [ ( e x c h ) i + R T 0 ln N i ]
Ni is the proportion of gas in the mixture. ( ex c h ) i is the chemical exergy contained in species i. R is a thermodynamic constant (R = 8.314 J·mol−1·K−1)
Thermal exergy [4]:
E X Q = Q ( 1 T 0 T i )
where: Q is the heat in the heat transfer process, Ti is the temperature of the heat source and T0 is the ambient temperature.
The exergy analysis for the hydrogen production route is to calculate how much exergy needs to be invested in each step of the life cycle of hydrogen preparation to prepare 1 kg H2 (25 °C, 20 MPa, exergy value 118.2 MJ [6], and the resulting exergy losses.
The higher the Exergic efficiency, the lower the irreversibility of the preparation process. The lower the exergic losses, the less effective energy needs to be devoted.

2.3. Energy Quality Coefficient Method

The energy quality coefficient is the ratio of the work that can be produced externally by different energy sources to total energy [14].
Energy quality coefficient [14]
λ = E x E
where: E is the energy contained in the corresponding substance.
The fuel energy quality coefficient is given by [14]:
λ f = 1 T 0 T f - T 0 ln T f T 0
λ f is the energy quality coefficient of the fuel and T f is the combustion temperature of the fuel.
The energy quality coefficients for different energy species are shown in Table 1.

3. Inventory of Life Cycle Data and Exergy Analysis of Hydrogen Production Routes in China

3.1. Hydrogen Production by Natural Gas Reforming

Natural gas reforming hydrogen production includes three stages: natural gas extraction, natural gas transportation and natural gas reforming hydrogen production. In the hydrogen production reaction stage, the main chemical reactions are the reforming reaction and the CO conversion reaction:
C H 4 + H 2 O C O + 3 H 2 ( T : 850   ° C )
C O + H 2 O C O 2 + H 2 ( T : 350   ° C )
The life cycle input and output data for hydrogen production by natural gas reforming are listed in the Table 2.
In order to obtain 1 kg of H2 (20 Mpa, 25 °C) exergy, a natural gas extraction company in China needs to extract 4 kg of natural gas [15] (containing 207.5 MJ of chemical reaction exergy) from a pristine gas field. This process consumes 5.1 MJ of diesel chemical reaction exergy, 2.8 MJ of methanol (for natural gas hydrate inhibitor) chemical reaction exergy, and 0.2 MJ of electric power exergy. The exergic efficiency of this stage is 84.7%, and the exergic loss is 37.7 MJ.
The 4 kg of natural gas obtained from extraction is transported through a pipeline to a 2 km natural gas to hydrogen plant, ignoring the natural gas that escapes during the process [16]. This stage contains 2.1 MJ of electricity in addition to the chemical reaction exergy carried by the natural gas itself, the exergic efficiency of this stage is 99% and the exergic loss is 2.1 MJ.
Upon arrival at the natural gas-to-hydrogen plant, natural gas is first injected as feedstock gas into a centrifugal compressor to pressurize to 2.5 MPa, consuming 2.1 MJ of electricity [18], and the exergic efficiency of this unit is 99.9%, with an exergic loss of 0.1 MJ. In the presence of hydrocarbon fuels, it is preheated in the reformer furnace to 360–380 °C, consuming 1.7 MJ of hydrocarbon fuel. The chemical reaction produces a physical exergy of 2.3 MJ for the natural gas addition, and a thermal exergy of 1.4 MJ for the steam at 360–380 °C. The reactor temperature is heated to 850 °C using a hydrocarbon fuel containing 12.7 MJ of chemically reactive exergy, and natural gas is mixed with water vapor to undergo a reforming reaction that produces a mixture containing 152.1 MJ of a mixture of (CH4 (5%), H2 (70%), CO (9%), CO2 (13%), and N2 (3%)) [17] of chemically reactive exergy as well as a mixture containing 20.7 MJ of thermal exergy in steam at 850 °C. The exergic efficiency of this unit is 71% and the exergic loss is 51.63 MJ.
The gas from the reforming reaction is cooled to 350 °C by a heat exchanger, and the reforming reaction occurs in the reformer furnace and produces a mixture containing 152.1 MJ of chemically reacted exergy (H2 (73%), CH4 (4%), CO (4%), CO2 (17%), and N2 (2%)), as well as the cooling water produced by heating the cooling water to 350 °C to produce 20.7 MJ of thermal exergy. The exergic efficiency of this unit is 98.1% and the exergic loss is 3.2 MJ.
The reacted gas was passed through a pressure-variable adsorption process (PSA) to obtain high-purity hydrogen, consuming 11.2 MJ of electrical exergy and generating 117.7 MJ of exergy contained in H2 at 0.1 MPa and 25 °C. The exergic efficiency of this unit is 65.1%, and the exergic loss is 63.1 MJ.
Finally, 22.6 MJ of electric exergy is applied to drive the hydrogen compressor to obtain 1 kg of H2 (20 MPa, 25 °C) containing 118.2 MJ of exergy, and the exergic efficiency of this unit is 84.2% with an exergic loss of 22.1 MJ.
The life cycle exergic efficiency and exergic loss distribution of hydrogen production from natural gas is shown in Figure 2.
As shown in Figure 3, the distribution of exergic losses for the life cycle of hydrogen production from natural gas by stages is shown. It can be seen that the exergic losses generated by the variable pressure adsorption unit have the largest share of 35%. This is due to the fact that the variable pressure adsorption process is the most irreversible due to its high power and is limited by the power of the piston compressor itself. Next is the steam reforming unit, where exergic losses account for 29% of the total. The cause of exergic losses in this section is mainly due to the natural gas gasification reaction and the heat transfer effect resulting from the reactor needing to be heated up to 850 °C. The steam reforming unit is the second most important part of the steam reforming unit. Next, exergic losses due to the natural gas extraction unit account for 21% of the total, and this stage requires the passage of key equipment such as turbine pumps and the consumption of large quantities of diesel fuel, with the efficiency of the equipment itself leading to a certain irreversibility of the process. The exergic losses of the hydrogen compression unit accounted for 12% of the overall, due to the smaller power compared to the compressor of the variable pressure adsorption unit, the electrical work consumed is smaller, the exergic losses are less, and the exergic losses of the other units are negligible.
In order to reduce the exergic losses in natural gas hydrogen production, the PSA process and the hydrogen compression process should be optimized to improve the compressor efficiency and reduce the power of the equipment to reduce the use of electric power. At the same time, the natural gas steam reforming unit should be improved to lower the reaction temperature and reduce the exergic losses due to the heat transfer process, and the exergic losses due to the chemical reaction of natural gas reforming should be reduced by adopting the natural gas partial oxidation, natural gas dry reforming and natural gas autothermal reforming technologies.
By optimizing the use of catalysts and accelerating the chemical reaction rate in natural gas reforming hydrogen production technology, the heat and power required for the chemical reaction external to the reforming hydrogen production can be effectively reduced, and the product conversion efficiency of natural gas hydrogen production can be improved. In the conventional natural gas-to-hydrogen process, nickel is the predominant catalyst in the reforming hydrogen technology, but the activity of the nickel catalyst decreases (i.e., catalyst poisoning occurs) with the long-term operation of the natural gas-to-hydrogen process. The electron cloud density of Ni catalysts can be increased, and the carbon buildup of the catalysts can be suppressed by using basic metals such as Na, Mg, Ca, K, rare earth metals, and transition metals such as MoO3 [19].
In order to improve the utilization of thermal hydropower, according to Wei-Hsin (2010), by improving the heating system for natural gas hydrogen production, such as preheating natural gas by using thermal cycling technology [20], it is possible to both increase the natural gas reaction temperature, reduce the reaction temperature difference, and reduce the hydropower loss due to the heat transfer process.

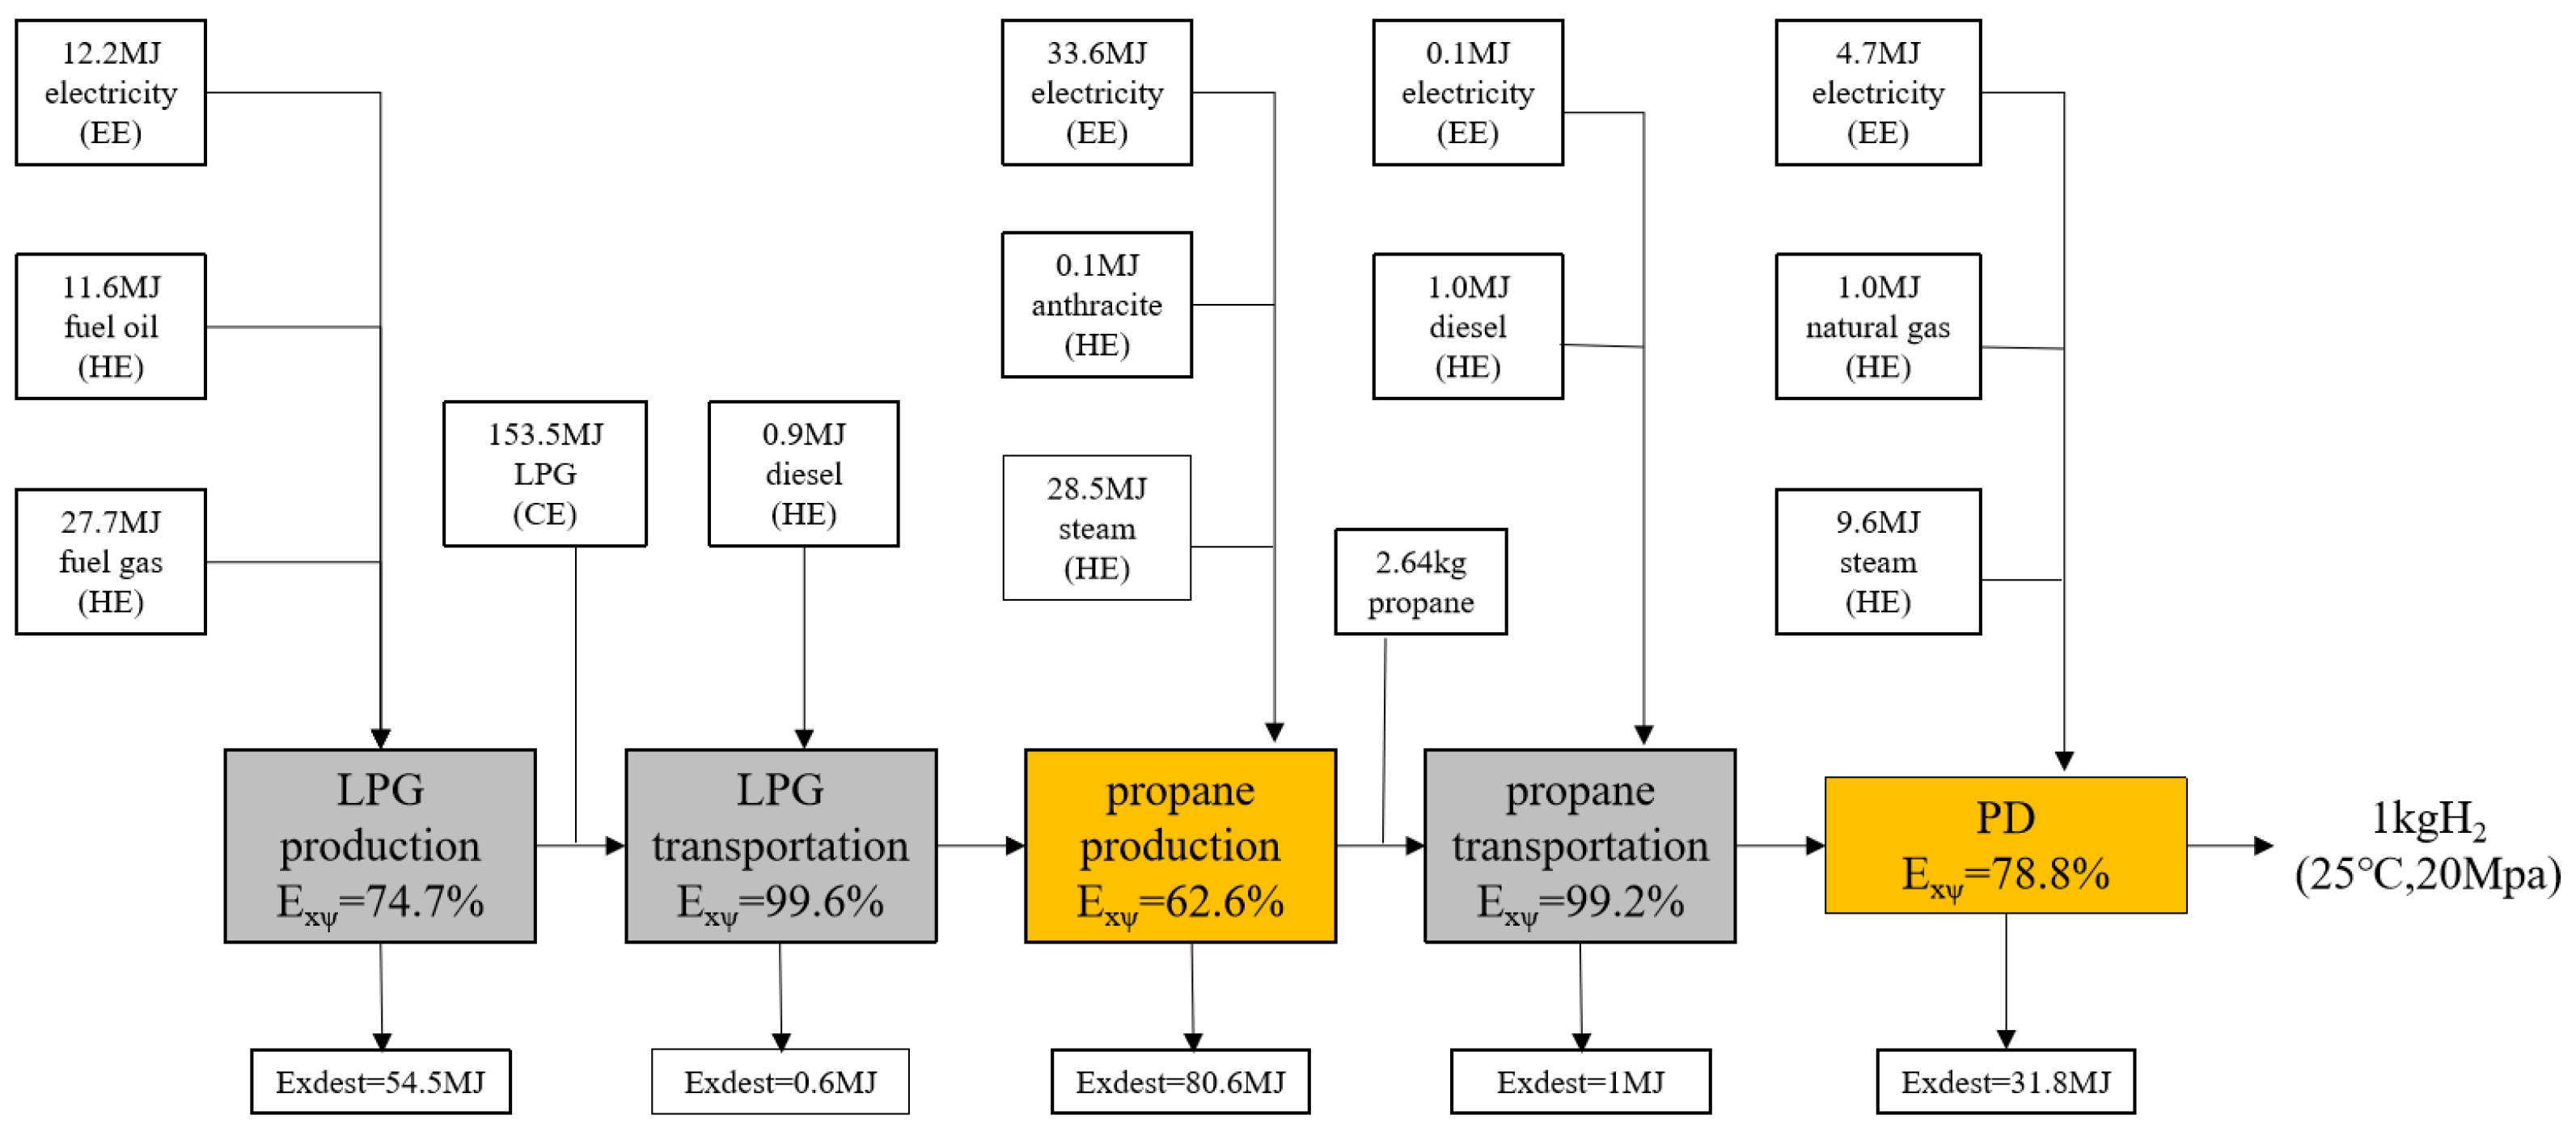
3.2. Propane Dehydrogenation

The life cycle process of propane dehydrogenation consists of several parts: LPG production and transportation, propane production and transportation, and the hydrogen production reaction. The main reaction is the Oleflex reaction [21]:
C 3 H 8 C 3 H 6 + H 2 ( T : 600 700   ° C )
A life-cycle inventory of input and emission data for propane dehydrogenation is shown in Table 3.
In order to obtain 1 kg H2 (20 Mpa, 25 °C) of exergy, a refinery in China processed the feedstock with a ratio of “crude oil: fuel oil = 6:20” into a finished product, and extracted LPG from the finished product (LPG constitutes 5.2% of the finished product [26]). In this stage it is necessary to consume fuel oil containing 11.6 MJ exergy, fuel gas containing 27.7 MJ exergy, and electricity containing 12.24 MJ exergy, and to obtain LPG containing 150.6 MJ exergy. The exergic efficiency of this stage is 74.5%, and the exergic loss is 54.5 MJ.
The 3 kg of LPG obtained from the production is sent to the propane production plant 100 km away by means of a transportation tanker, consuming electricity containing 0.04 MJ of exergy and diesel fuel containing 0.6 MJ of exergy, with an exergic efficiency of 99.58% and an exergic loss of 0.6 MJ at this stage. The LPG is condensed to below 0–5 °C, and the propane in the LPG is extracted by variable pressure adsorption [27], which consumes steam containing 28.5 MJ exergy, electricity containing 33.6 MJ exergy, and anthracite coal containing 0.1 MJ exergy at this stage, which has an exergic efficiency of 62.6%. The exergic loss is 80.6 MJ.
The produced propane is transported to the propane dehydrogenation plant at the 100 km location using trucks, and diesel fuel containing 1.0 MJ exergy is consumed in the process, with an exergic efficiency of 99.2% and an exergic loss of 1 MJ at this stage.
The propane was pretreated in a depropane tower to separate the non-propane hydrocarbons [28], and then the propane was sent to a propane dehydrogenation unit, where the Oleflex reaction took place at 600–700 °C and 1 kg of H2 was obtained by adsorption and by pressurization techniques (20 MPa, 25 °C).
In this process, propane containing 135.1 MJ exergy, steam containing 9.6 MJ exergy, electricity containing 4.7 MJ exergy, and natural gas containing 1.0 MJ exergy are input to obtain 1 kg H2 (20 MPa, 25 °C) containing 118.2 MJ exergy. The exergic efficiency of this unit was 78.8% and the exergic loss was 31.8 MJ.
The life cycle exergic efficiency and exergic loss distribution for the life cycle of propane dehydrogenation to hydrogen is shown in Figure 4.
As shown in Figure 5, the largest proportion of total exergic losses in the whole life cycle of propane dehydrogenation is in the “propane production” stage, accounting for 49%, which requires the use of refrigeration devices to keep the condensing temperature below 0–5 °C and drive the variable pressure adsorption equipment (pressure environment of 3.0 Mpa [17]), which utilizes the pressure difference to obtain LPG from crude oil. Obtaining LPG from crude oil results in exergic losses due to temperature differences as well as pressure differences. Next is the LPG production stage with a share of 31%, where the LPG production stage needs to maintain the reaction temperature (450 °C) and pressure environment (0.5–1.0 Mpa) [29]. The percentage of exergic loss in propane dehydrogenation reaction is 19%, and the Oleflex reaction requires reaction conditions of 600 °C to 700 °C, and the temperature difference effect leads to exergic loss.

3.3. Hydrogen Production from Green Electricity

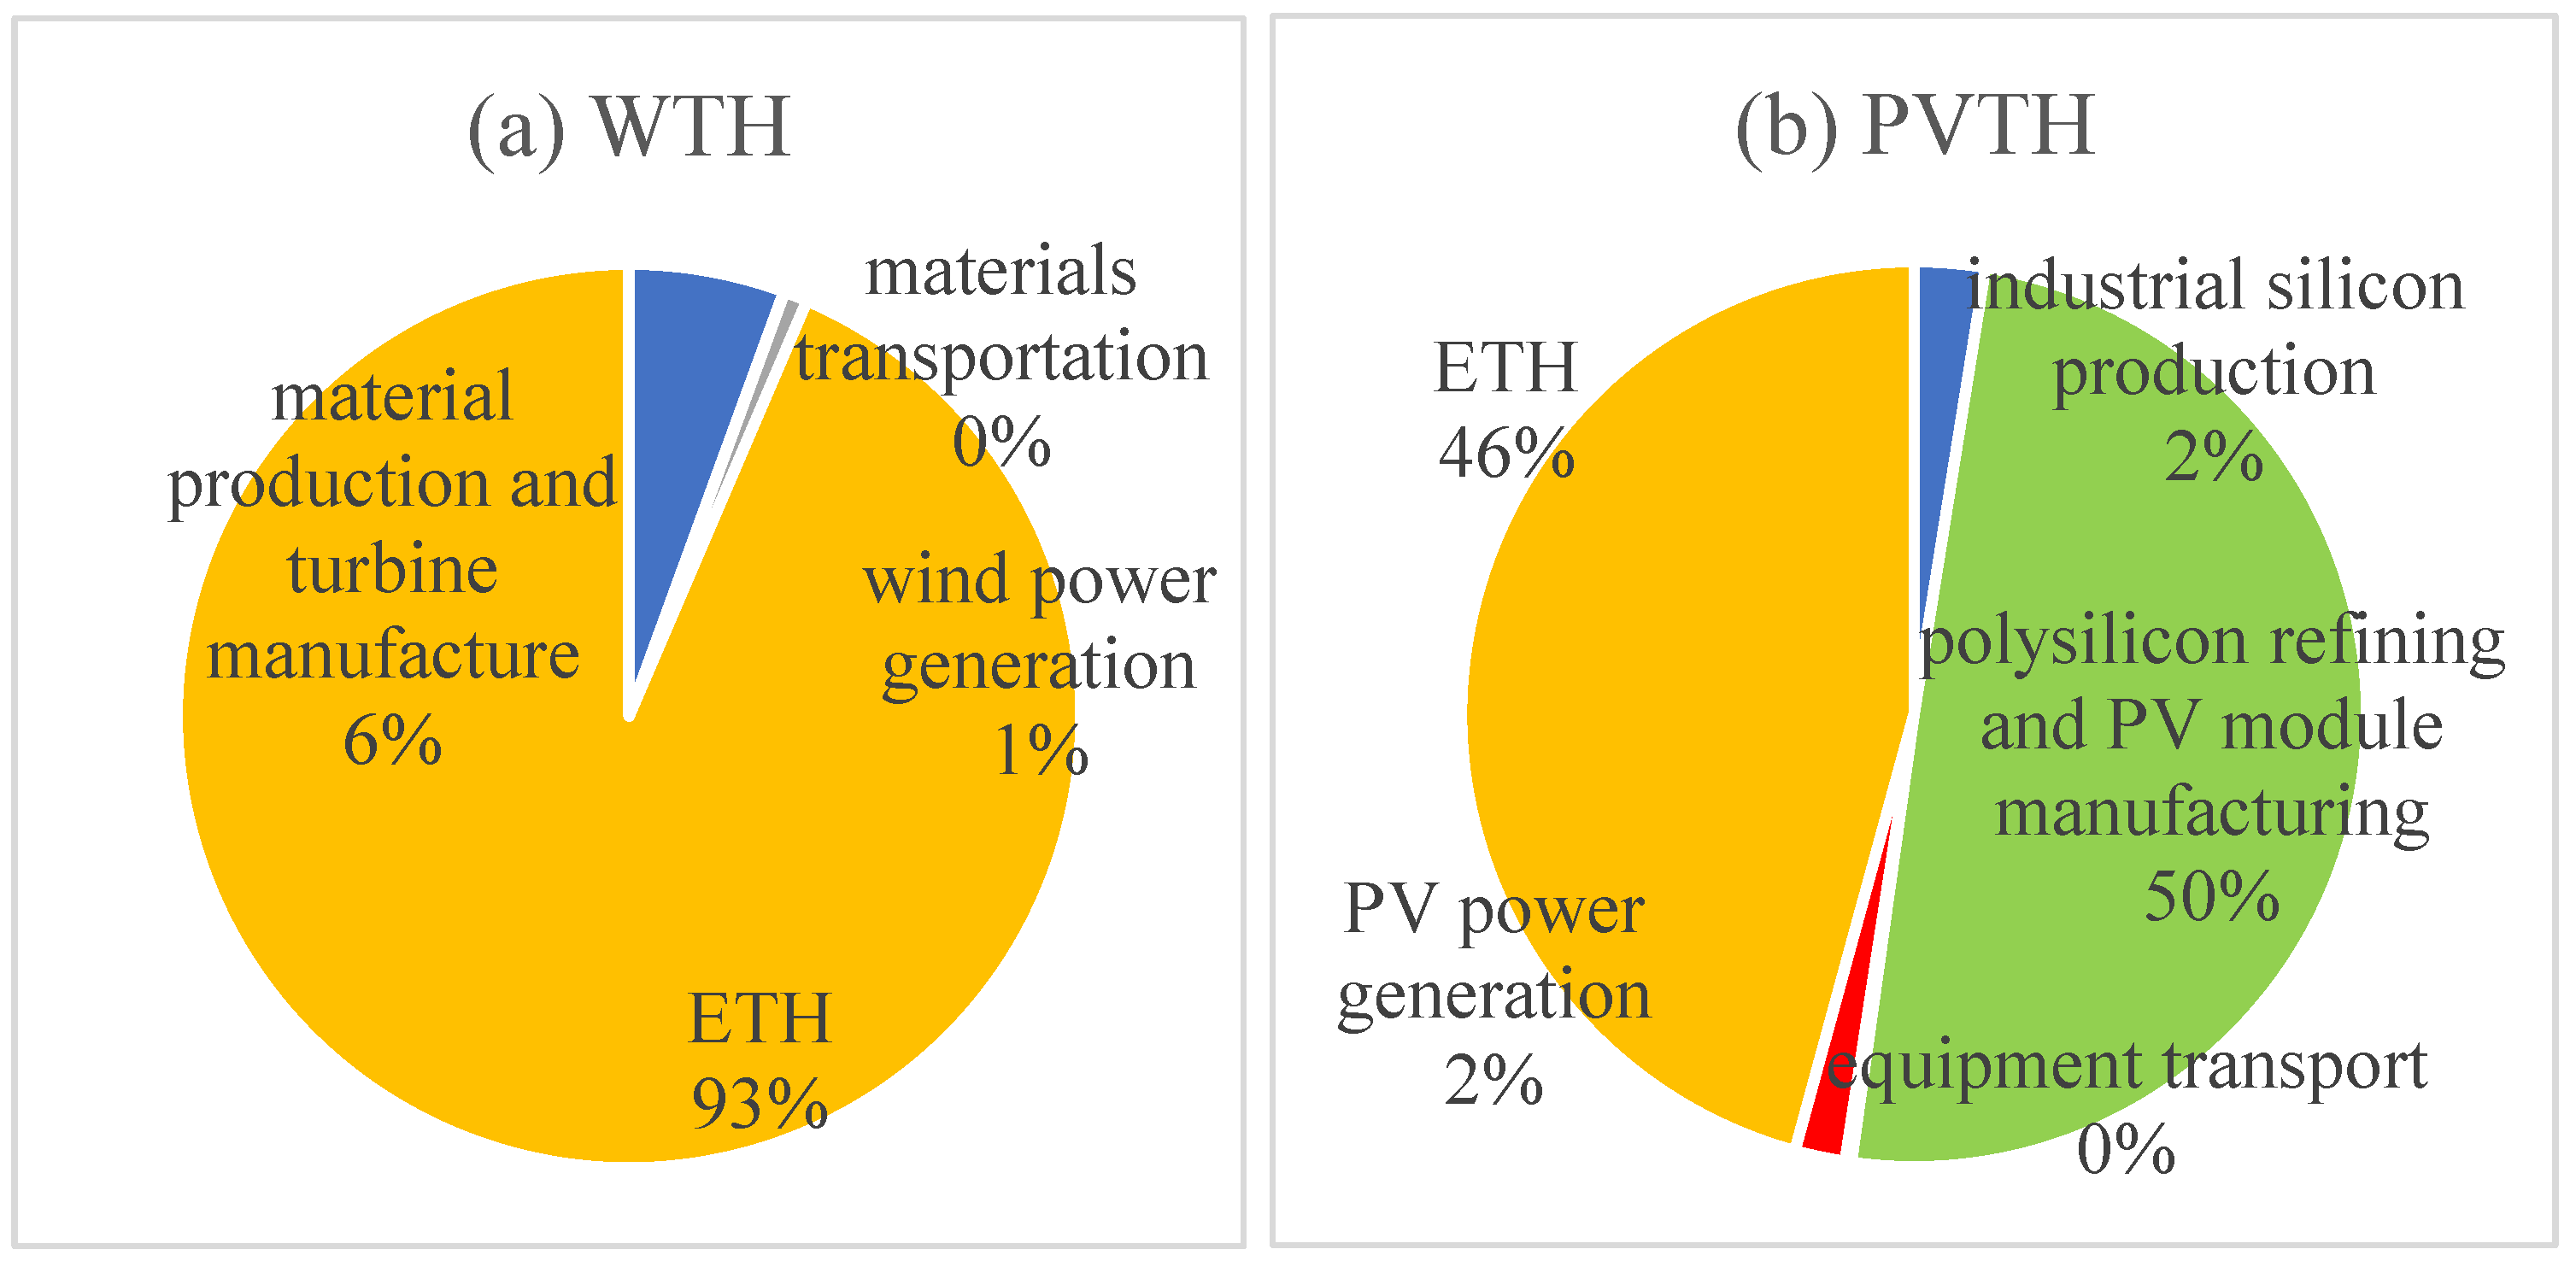
In hydrogen production from green power, hydrogen production from water electrolysis is a common stage in hydrogen production from photovoltaics and wind power. In order to generate renewable electricity, the upstream of hydrogen production from wind power involves the manufacturing and transportation of wind power equipment, while the upstream of hydrogen production from photovoltaics involves the production of industrial silicon, the refining of polysilicon and the manufacturing and transportation of photovoltaic modules.
A list of life-cycle input and emission data for hydrogen production from wind power is shown in Table 4.
To obtain 1 kg H2 (20 Mpa, 25 °C) of exergy, a component manufacturing plant for a wind turbine in China completed the production of materials for nacelles, rotors, towers and tower bases with component manufacturing using electricity containing 4.5 MJ of exergy [30], and the exergic efficiency at this stage was 97.7%, with an exergic loss of 4.8 MJ.
Using diesel fuel containing 0.03 MJ exergy, the wind power equipment is transported to the wind power plant 700 km away by 30% freight and 70% rail, the exergic efficiency at this stage is 99.99% and the exergic loss is 0.03 MJ.
Using electricity containing 0.72 MJ exergy to drive the wind engine to produce wind power containing 198 MJ exergy, the exergic efficiency at this stage is 99.64% and the exergic loss is 0.72 MJ.
In off-grid mode, wind power containing 198 MJ is fed into the electrolyzer to produce hydrogen, which undergoes a second stage of cooling [31] and undergoes a pressurization system to 20 MPa to obtain 1 kg of H2 (20 MPa, 25 °C) containing 118.2 MJ of exergy, which at this stage has an exergic efficiency of 59.7% and an exergic loss of 79.8 MJ.
A list of life cycle input and emission data for PV hydrogen production is shown in the Table 5.
To obtain 144 MJ of exergy for 1 kg H2 (20 Mpa, 25 °C), a Chinese industrial silicon producer used electricity containing 4.4 MJ of exergy to drive the chemical reaction of silica with a carbon reductant in an electric arc furnace to obtain reduced silica, and the exergic efficiency at this stage is 97.8%, with an exergic loss of 4.4 MJ.
The modified Siemens method of industrial silicon purification is used to obtain 99.9999% purity of polysilicon [32], then it will go through the melting and fixing process to get polysilicon ingots, through the cutting square, flat grinding chamfering, slicing and other industries to get polycrystalline silicon solar cells. They then go through the cell testing, welding, stringing, laying, laminating and other processes to make photovoltaic modules, this stage using contains 86 MJ exergy of electricity, diesel fuel containing 0.65 MJ exergy, and natural gas containing 0.006 MJ exergy, with an exergic efficiency of 70% and an exergic loss of 86.7 MJ.
The manufactured PV modules were transported to a PV power plant 100 km away using a truck, a process that used diesel fuel containing 0.39 MJ exergy, with an exergic efficiency of 99.8% and an exergic loss of 0.39 MJ.
To run the photovoltaic power generation facility, this process requires the consumption of coal containing 3.1 MJ exergy and diesel fuel containing 0.16 MJ exergy and obtains photovoltaic power containing 198 MJ exergy, with an exergic efficiency of 98.43% and an exergic loss of 3.15 MJ at this stage.
In the off-grid condition, hydrogen is produced by electrolysis of water in an alkaline electrolyzer using PV power containing 198 MJ exergy, and the resulting hydrogen is compressed to 20 MPa by secondary cooling to obtain 1 kg of H2 (20 MPa, 25 °C), containing 118.2 MJ exergy. The exergic efficiency at this stage is 59.7%, with an exergic loss of 79.8 MJ.
The distribution of exergic efficiency and exergic loss over the life cycle of green power hydrogen production is shown in Figure 6.
The distribution of exergic losses in the staged hydrogen production from green electricity is shown in Figure 7.
As shown in Figure 7a, the largest exergic loss in the life cycle of wind power hydrogen production is in the “electrolysis of water for hydrogen production”, which occupies 93% of the overall proportion. In the electrolyzer system, the exergic losses caused by the oxygen and hydrogen compressors are negligible (the impact of exergic losses is about 1%). The exergic losses in hydrogen production from water electrolysis depend on the energy efficiency of the electrolyzer. Therefore, in order to reduce the exergic losses in hydrogen production from wind power, it is necessary to improve the energy utilization efficiency of the PEM electrolyzer system.
As shown in Figure 7b, for PV hydrogen production, the largest exergic loss occurs in the “polysilicon refining and PV module manufacturing” part, which occupies 50% of the whole. The reason is that the production of polysilicon needs to be carried out in a high-temperature environment at about 1100 °C using the modified Siemens method [32]; the temperature difference factor is the main reason for the large exergic losses in this stage. The next stage is hydrogen production from electrolyzed water, which accounts for 46% of the hydropower losses, mainly due to the same reasons as the exergic losses in the electrolyzed water stage of wind power hydrogen production.

4. Discussion

4.1. Comparison of Hydrogen Production Energy Efficiency and Exergic Efficiency

A comparison of the life-cycle energy efficiency and exergic efficiency of different hydrogen production routes in 2020 is shown in Figure 8. Under the current technological conditions, the energy and exergic efficiencies of hydrogen production from natural gas are the lowest, followed by hydrogen production from photovoltaics, and the energy and exergic efficiencies of propane dehydrogenation are at the level of hydrogen production from green power, using hydrogen production from wind power as a reference.
In a comprehensive comparison, it can be seen that the energy efficiency and exergic efficiency of hydrogen production from natural gas is the lowest, so it is not recommended to be the main route for the large-scale development of hydrogen production industry in China. The energy efficiency and exergic efficiency of propane dehydrogenation is higher than that of PV hydrogen production, but lower than that of wind power hydrogen production, which can be considered as the most transitional stage hydrogen production route. Hydrogen production from wind power has the highest energy efficiency and exergic efficiency, which is the development direction of hydrogen production. Considering that to produce hydrogen, wind power needs to match the corresponding wind resource area, it is necessary to adapt to local conditions and explore the development of onshore wind power, in areas with better wind resources (e.g., Inner Mongolia, Hebei), and coastal provinces, which can vigorously develop offshore wind power to produce hydrogen.

4.2. Comparison of CO2 Emissions

A comparison of the LCA CO2 emissions of different hydrogen production routes is shown in Figure 9. It can be seen that the LCA CO2 emissions of hydrogen production from natural gas are the highest, with large CO2 emissions during the hydrogen production reaction and CO conversion. This method of hydrogen production is the least effective in reducing CO2 emissions from the energy system. Propane dehydrogenation reduces CO2 emissions by 32% compared to natural gas hydrogen production, but it has higher carbon emissions than green electricity hydrogen production, so it can be considered as a hydrogen production option in the transitional stage. Among green electricity hydrogen production, hydrogen production from wind power has the lowest LCA carbon emissions, therefore, it is the direction of development for regions to reduce carbon emissions from the energy system by producing hydrogen.

4.3. Trend Analysis of Exergic Efficiency Changes of Hydrogen Production Industry in China

This section uses a scenario analysis method to predict the efficiency and exergic efficiency of hydrogen production in China. The forecast is based on the China Hydrogen Energy Alliance’s forecast data for China’s hydrogen production structure in 2030 and 2050 [33], taking into account the maturity of technology. Due to the high technical maturity of hydrogen production technologies using natural gas and propane dehydrogenation, it is assumed that the energy efficiency and exergic efficiency per unit of hydrogen produced remain unchanged. For hydrogen production using green electricity, it is assumed that in 2030, China will have achieved the replacement of alkaline electrolyzers with PEM electrolyzers, and that in 2050, PEM electrolyzer technology will have reached maturity, with a 90% efficiency parameter setting [34].
In terms of China’s hydrogen production structure, according to the Medium- and Long-Term Plan for the Development of the Hydrogen Energy Industry (2021–2035), the amount of hydrogen produced in China in 2020 will be 33 million tons [35]. About 63.6% of hydrogen in China’s hydrogen production structure comes from coal, 13.8% from natural gas hydrogen production, 21.2% from industrial by-products hydrogen production, and 1.5% from electrolysis of water [33,36] (as shown in Figure 10a).
According to the forecast of China Hydrogen Energy Alliance, the annual demand of hydrogen in China will reach about 35 million tons in 2030, at which time hydrogen from fossil energy will account for 60%, hydrogen from industrial by-products will account for 23%, hydrogen from green power will account for 15%, and hydrogen from biomass will account for 2%. In 2050, the annual demand of hydrogen in China will increase to about 60 million tons, with 20% hydrogen from fossil energy, 70% hydrogen from green power and 10% of hydrogen from biomass [33]. Assuming that after 2020, the internal structure of hydrogen production from fossil energy and green power is consistent with the structure of China’s demand for primary energy in the same year [37,38], the distribution of China’s hydrogen production structure in 2030 and 2050 is obtained (shown in Figure 10b,c).
In terms of progress in hydrogen production technology, because of the high maturity of fossil energy hydrogen production and industrial by-product hydrogen production technologies, it is believed that the energy efficiency and exergic efficiency of these two hydrogen production methods will not be changed. On the other hand, the technology of hydrogen production from electrolyzed water is not yet mature, so there is still room for progress in the energy efficiency and exergic efficiency of hydrogen production from green electricity.
Table 6 shows the energy efficiency and exergic efficiency of hydrogen production from water electrolysis in different periods. Since 2020, China’s hydrogen production from electrolysis tanks have been dominated by alkaline electrolysis tanks, which have a higher degree of technological maturity and a lower cost. In 2020, with the rapid development and application of PEM electrolysis tanks, the efficiency of the electrolysis tanks was improved. According to the literature [34], 4–5 kWh of electricity is required for each cubic meter of hydrogen produced, with which the energy efficiency of the PEM electrolyzer is measured to be in the range of 72–90%, and the range of exergic efficiency is 59–74%. According to the authors’ previous work, in 2025 the PEM electrolyzer will be just technologically mature and will start to increase on a small scale [39]. In 2030, the energy efficiency of PEM electrolysis of water for hydrogen production will take 80% of the energy efficiency found in the literature [34], and at this time, the exergic efficiency will be 65.7%. Grid electricity hydrogen production without power volatility leads to an electrolytic hydrogen production instability problem, for the purpose of cost control, the unified alkaline electrolyzer program should still be used. In 2050, PEM electrolyzer technology will be very mature, at that time, according to the literature [34], the PEM electrolyzer energy consumption will be 90%, and the exergic efficiency will be 73.9%.
The effect of advances in electrolyzed water to hydrogen technology on the life cycle energy efficiency and exergic efficiency of green electricity to hydrogen is shown in Table 7.
Table 8 shows the energy and exergy consumption of hydrogen production in China under different time periods.
It can be seen that as the proportion of green hydrogen in China’s hydrogen production structure becomes higher, the overall energy and exergic efficiency of hydrogen production will be higher. The energy and exergy consumption per unit of hydrogen production is decreasing. Compared with 2020, China will save 2.4% of energy and 4.8% of exergy for every ton of hydrogen produced in 2030, and 15% of energy and 25% of exergy for every ton of hydrogen produced in 2050, reflecting the “energy-saving” and “exergy-saving” trends in China’s hydrogen industry. The magnitude of exergy saving exceeds that of energy saving.

5. Conclusions

This paper evaluates the life cycle exergic efficiencies and exergic losses of three highly important hydrogen production methods in China, namely, hydrogen from natural gas, propane dehydrogenation, and hydrogen production from green electricity, and the following main conclusions are drawn.
First, the life cycle exergic efficiency of NGTH is 39.7%. Exergic losses come from the compression process, high-temperature chemical reactions, and catalyst activity. To improve exergic efficiency, the reaction temperature difference can be reduced by preheating and reheating, improving compressor efficiency, and using higher performance catalysts.
Second, the life cycle exergic efficiency of PD is 46.2%, and the exergic loss mainly comes from the irreversibility of the compression process during the production of propane. The energy efficiency of PD is 34.7% higher than that of NGTH, the exergic ratio is 16.4% higher than that of NGTH, and the carbon emissions are 32% lower than those of NGTH. It has made a significant contribution to energy conservation and emission reduction. Therefore, it is recommended to be considered as the main hydrogen production route in the early stage of large-scale development of green hydrogen production.
Third, WTH has the highest life cycle exergic efficiency, which is 58.1%, and the lowest life-cycle carbon emissions, which is the development direction of hydrogen production technology. The reason for the loss of exergy in WTH is the irreversible nature of the water electrolysis reaction in terms of electrical energy consumption. PVTH, in addition to the electrolysis factor, also includes the polysilicon refining process, which requires electricity to produce heat for the waste of electrical energy. Therefore, in order to improve the exergic efficiency of hydrogen production from green electricity, it is necessary to improve the efficiency of the electrolyzer, and should also optimize the polysilicon preparation technology.
Fourth, by analyzing the energy efficiency and exergic efficiency of hydrogen production in China in the near future and long term, this paper proposes that the energy consumption per unit of hydrogen production in 2050 can be expected to decrease to 8.0 kg of SC/kg of H2, which is 15% less than the energy saving in 2020. The exergy consumption per unit of hydrogen production can be reduced to 7.5 kg of SC/kg of H2, reducing exergic losses by 25% compared to 2020, and the increase in exergic efficiency is greater than the energy efficiency. In the future, with the greening of the hydrogen production structure, the potential for exergic loss reduction will be greater than the energy saving potential.

Author Contributions

L.Z.: Conceptualization, Methodology, Data curation, Writing—original draft, Writing—review & editing, Project administration. X.J.: Methodology, Data curation, Writing—original draft, Investigation, Software. X.Z.: Writing—review & editing, Investigation. S.W.: Writing—review & editing, Investigation. R.W.: Writing—review & editing. L.H.: Writing—review & editing. K.X.: Conceptualization, Supervision, Writing—original draft, Writing—review & editing, Formal analysis. P.W.: Writing—review & editing, Formal analysis, Project administration. All authors have read and agreed to the published version of the manuscript.

Funding

This research was funded by CHINESE ACADEMY OF SCIENCES, grant number XDA29010500.

Institutional Review Board Statement

Not applicable.

Informed Consent Statement

Not applicable.

Data Availability Statement

The original contributions presented in this study are included in the article.

Conflicts of Interest

Authors Lixing Zheng, Xuhui Jiang, Xi Zhang, Song Wang, Ruiqiong Wang and Linbin Hu were employed by the company PowerChina Chongqing Engineering Co. Ltd. The remaining authors declare that the research was conducted in the absence of any commercial or financial relationships that could be construed as a potential conflict of interest.

Abbreviations

The following abbreviations are used in this manuscript:
ALKAlkaline Water Electrolysis
BTHHydrogen Production from Biomass
CEChemical Exergy
CTHHydrogen Production from Coal
EEElectric Exergy
EQCEnergy Quality Coefficient
ETHHydrogen Production from Electrolytic Water
HEHeat Exergy
IBPTHhydrogen Production from Industrial by-products
LCALife Cycle Assessment
LPGLiquefied Petroleum Gas
M&EMaterial and energy consumption
NGTHhydrogen production from natural gas
PDPropane Dehydrogenation
PEMProton Exchange Membrane
PSAPressure Swing Adsorption
PVPhotovoltaic
PVTHHydrogen Production from Photovoltaics
SCStandard Coal
SMRSteam Methane Reforming
WTHHydrogen Production from Wind Power

References

  1. Dermühl, S.; Riedel, U. A comparison of the most promising low-carbon hydrogen production technologies. Fuel 2023, 340, 127478. [Google Scholar] [CrossRef]
  2. Ji, M.; Shi, M.; Wang, J. Life cycle assessment of nuclear hydrogen production processes based on high temperature gas-cooled reactor. Int. J. Hydrog. Energy 2023, 48, 22302–22318. [Google Scholar] [CrossRef]
  3. Zheng, L.; Zhao, D.; Qi, X.; Chen, Y. Research on Energy Efficiency, Carbon Emission and Economy of Hydrogen Production Routes in China Based on Life Cycle Assessment Method. J. Eng. Thermophys. 2022, 43, 2306–2317. [Google Scholar]
  4. Zhu, M. Exergy Analysis of Energy Systems; Tsinghua University Press: Beijing, China, 1988. [Google Scholar]
  5. Rosen, M.A. Thermodynamic comparison of hydrogen production processes. Int. J. Hydrog. Energy 1996, 21, 349–365. [Google Scholar] [CrossRef]
  6. Ozbilen, A.; Dincer, I.; Rosen, M.A. Exergetic life cycle assessment of a hydrogen production process. Int. J. Hydrog. Energy 2012, 37, 5665–5675. [Google Scholar] [CrossRef]
  7. Granovskii, M.; Dincer, I.; Rosen, M.A. Exergetic life cycle assessment of hydrogen production from renewables. J. Power Sources 2007, 167, 461–471. [Google Scholar] [CrossRef]
  8. Zhang, Y.; Xu, P.; Liang, S.; Liu, B.; Shuai, Y.; Li, B. Exergy analysis of hydrogen production from steam gasification of biomass: A review. Int. J. Hydrog. Energy 2019, 44, 14290–14302. [Google Scholar] [CrossRef]
  9. Özdemir, A.; Gamze, G.E.N.Ç. A comprehensive comparative energy and exergy analysis in solar based hydrogen production systems. Int. J. Hydrog. Energy 2022, 47, 12189–12203. [Google Scholar] [CrossRef]
  10. Guo, S.; Zhang, D.; Li, X.; Wang, H.; Deng, J.; Zhang, X.; Tian, W.; Qiu, S.; Su, G.H. Exergy analysis of biomass and nuclear hydrogen production system. Int. J. Hydrog. Energy 2024, 57, 1354–1363. [Google Scholar] [CrossRef]
  11. Atiz, A. Evaluation of energy, exergy, economic, and carbon savings analyses, along with green hydrogen production of PVs and PVTs under daily solar radiation for various tilt angles and mass flow ratios. Int. J. Hydrog. Energy 2025, 98, 657–672. [Google Scholar] [CrossRef]
  12. ISO 10004:2018; Quality Management-Customer Satisfaction-Guidelines for Monitoring and Measuring. ISO: Geneva, Switzerland, 2008.
  13. Rosen, M.A.; Dincer, I.; Ozbilen, A. Exergy Analysis and its Connection to Life Cycle Assessment. In Life Cycle Assessment Handbook: A Guide for Environmentally Sustainable Products; Wiley-Scrivener: Beverly, MA, USA, 2012; pp. 185–215. [Google Scholar]
  14. Zhang, J. Geothermal Energy, Waste Heat Energy and Heat Pump Technology; Chemical Industry Publisher: Beijing, China, 2014. [Google Scholar]
  15. Shanxi Provincial Department of Ecology and Environment. Changqing Oilfield Branch First Gas Production Plant 1.78 Billion Cubic Metres Capacity Make-Up Project; Shanxi Provincial Department of Ecology and Environment: Xi’an, China, 2020. [Google Scholar]
  16. Liu, W.; Yang, C.; Song, Z. Life Cycle Assessment Analysis of Natural Gas for Different Uses. J. Shengli Coll. China Univ. Pet. 2017, 31, 32–37. [Google Scholar]
  17. Ministry of Environmental Protection. Anhui Runqian Energy-Saving Building Materials Technology Co. Biomass Gasification and Utilization (Multi-Energy Complementary) Project Environmental Impact Report; Ministry of Environmental Protection: Hefei, China, 2019. [Google Scholar]
  18. Chen, J.; Ge, W.; Wang, Z. Introduction and cost analysis of natural gas hydrogen production process. Coal Gas Heat 2017, 37, 8–11. [Google Scholar]
  19. Guo, Q.; Li, C.; Chang, J. Advances in the study of methanation catalysts and their deactivation. Ind. Catal. 2015, 23, 510–514. [Google Scholar]
  20. Chen, W.H.; Chiu, T.W.; Hung, C.I. Enhancement effect of heat recovery on hydrogen production from catalytic partial oxidation of methane. Int. J. Hydrog. Energy 2010, 35, 7427–7440. [Google Scholar] [CrossRef]
  21. Hui, H.G.; Yuan, Z. Key equipment layout and piping in oleflex propane dehydrogenation process. Huaxue Gongcheng/Chem. Eng. 2017, 45, 75–78. [Google Scholar] [CrossRef]
  22. Zhang, Z.; Hu, R.; Wu, J. Analysis of factors affecting hydrogen production from coal supercritical water gasification. Coal Chem. Ind. 2011, 39, 13–15+23. [Google Scholar]
  23. Dieterich, V.; Buttler, A.; Hanel, A.; Spliethoff, H.; Fendt, S. Power-to-liquid via synthesis of methanol, DME or Fischer–Tropsch-fuels: A review. Energy Environ. Sci. 2020, 13, 3207–3252. [Google Scholar] [CrossRef]
  24. Chen, S.; Zhang, K.; Chang, L. Overview of conventional and novel hydrogen production methods. Nat. Gas Chem. 2019, 44, 122–127. [Google Scholar]
  25. Zhu, L.; Wang, B.; Wu, H. Progress of hydrogen production technology from electrolytic coal water slurry. Chem. Prog. 2016, 35, 3129–3135. [Google Scholar]
  26. Li, B. Study on Life Cycle Cost of Local Refiners; China University of Petroleum: Beijing, China, 2016. [Google Scholar]
  27. Jiangsu Runhuan Environmental Science and Technology Co., Ltd. Environmental Impact Report of 300,000 tons/year Alkylation Plant and Matching Project of Sinopec Yangzi Petrochemical Co., Ltd.; Jiangsu Runhuan Environmental Science and Technology Co., Ltd.: Nanjing, China, 2017. [Google Scholar]
  28. Shandong Haimeinong Project Consulting Co., Ltd. Zibo Qixiang Tengda Chemical Co., Ltd. Environmental Impact Report of 700,000-tpa Propane Dehydrogenation Project; Shandong Haimeinong Project Consulting Co., Ltd.: Jinan, China, 2019. [Google Scholar]
  29. Okeke, I.J.; Saville, B.A.; MacLean, H.L. Low carbon hydrogen production in Canada via natural gas pyrolysis. Int. J. Hydrog. Energy 2023, 48, 12581–12599. [Google Scholar] [CrossRef]
  30. Gao, C.; Dong, J.; Zhu, W.; Wang, W. Environmental Load Analysis of Wind Turbine Based on LCA. J. Northeast. Univ. 2012, 33, 1034–1037. [Google Scholar]
  31. Li, L.; Liu, X. Control Strategy Optimization for Thermal Power Unit Adapted to Deep Peak Shaving for Large-Scale New Energy Source Integration. Electr. Power 2020, 53, 155–161. [Google Scholar]
  32. Xie, Z.; Ma, X.; Huang, Z.; Liao, Y. Full life cycle evaluation of solar photovoltaic power generation. Environ. Pollut. Prev. 2013, 35, 106–110. [Google Scholar]
  33. China Hydrogen Energy Alliance. China Hydrogen and Fuel Cell Industry White Paper; China Hydrogen Energy Alliance: Beijing, China, 2020. [Google Scholar]
  34. Yu, H.; Shao, Z.; Hou, M.; Yi, B.; Duan, F.; Yang, Y. Hydrogen Production by Water Electrolysis: Progress and Suggestions. Chin. J. Eng. Sci. 2021, 23, 146. [Google Scholar] [CrossRef]
  35. National Development and Reform Commission. Medium and Long-Term Plan for the Development of Hydrogen Energy Industry (2021–2035); National Development and Reform Commission: Beijing, China, 2022. [Google Scholar]
  36. China Hydrogen Alliance. White Paper on the Hydrogen Energy and Fuel Cell Industries in China; China Hydrogen Alliance: Beijing, China, 2019. [Google Scholar]
  37. China Energy Research Association. China Energy Outlook 2030; China Energy Research Association: Beijing, China, 2016. [Google Scholar]
  38. China Petroleum Institute of Economics and Technology. World and China Energy Outlook 2050, 2020 ed.; China Petroleum Institute of Economics and Technology: Beijing, China, 2020. [Google Scholar]
  39. Zheng, L.; Zhao, D.; Wang, W. Medium and long-term hydrogen production technology routes and hydrogen energy supply scenarios in Guangdong Province. Int. J. Hydrog. Energy 2024, 49, 1–15. [Google Scholar] [CrossRef]
Figure 1. Methods and processes in the LCA study.
Sustainability 17 01413 g001
Figure 2. Life cycle process exergy flow of NGTH. Note: The gray part is the LCA phase. The yellow part is the part with the greatest exergy loss.
Sustainability 17 01413 g002
Figure 3. Distribution of Exergic Losses for the Life Cycle Process of NGTH.
Sustainability 17 01413 g003
Figure 4. Life cycle process exergy flow of PD. Note: The gray part is the LCA phase. The yellow part is the part with the greatest exergy loss.
Sustainability 17 01413 g004
Figure 5. Distribution of exergic losses by stages of the life cycle process of PD.
Sustainability 17 01413 g005
Figure 6. Life cycle process exergy flow of WTH and PVTH. Note: The gray part is the LCA phase. The yellow part is the part with the greatest exergy loss.
Sustainability 17 01413 g006
Figure 7. Distribution of exergic losses in the life-cycle phases of WTH (a) and PVTH (b).
Sustainability 17 01413 g007
Figure 8. Comparison of energy efficiency and exergic efficiency from hydrogen production routes (China, 2020) [3].
Sustainability 17 01413 g008
Figure 9. Comparison of carbon emissions from hydrogen production routes (China, 2020) [3].
Sustainability 17 01413 g009
Figure 10. Structure of the hydrogen production routes in China ((a) 2020, (b) 2030, (c) 2050).
Sustainability 17 01413 g010aSustainability 17 01413 g010b
Table 1. Energy quality coefficients for Different Energy Species [14].
Energy VarietyEQC
electricity1
H20.82
mechanical energy1
CH40.6–0.68
diesel0.51
methanol0.62
coal0.41–0.46
vapor0.274
Table 2. Data Inventory of Life Cycle NGTH.
natural gas extraction [15]M&Ediesel67.9MJ
electricity0.23MJ
water19.602kg
methanol4.6MJ
emissionVOCs8.49 × 10−5kg
SO210.73 × 10−5kg
NOX21.37 × 10−5kg
dust2.86 × 10−5kg
natural gas transportation [16]M&Eelectricity2.1MJ
SMR [17,18]raw gas treatment unitM&Enatural gas200.5MJ
Cobalt-molybdenum catalysts5.23 × 10−5kg
Zinc oxide catalyst1.21 × 10−3kg
Electricity2.1MJ
Hydrocarbon fuels2587.2KJ
emissionWaste catalyst S11.27 × 10−3kg
steam reforming unitM&Edeionized water14.6kg
Nickel catalyst3.92 × 10−5kg
Hydrocarbon fuels19MJ
emissionWaste catalyst S23.92 × 10−5kg
CO conversion unitM&Echilled water67.42kg
Fe2O3 catalyst2.67 × 10−3kg
emissionWaste catalyst S32.67 × 10−3kg
waste water12.57kg
CO25.859kg
CO0.534kg
SO21.08 × 10−6kg
NOX1.46 × 10−3kg
PSAM&EElectricity (PSA)11.232MJ
hydrogen compression unitM&EElectricity (hydrogen compressors)22.6MJ
Table 3. List of life cycle data for PD.
LPG production [22]M&Efuel oil22.8MJ
fuel gas41.4MJ
electricity3.4kWh
emissionCO28.49 × 10−5kg
dustN.Akg
LPG transportation [23]M&Eelectricity0.01kWh
diesel1.17MJ
emissionCON.Akg
HCN.Akg
NOXN.Akg
PMN.Akg
CO20.1kg
Propane production [24]M&Ewater173.6kg
vapor38.5kg
electricity33.6MJ
anthracite coal0.186MJ
emissionSO20.011kg
NOX0.0178kg
dust0.006kg
Propane transportation [23]M&Eelectricity0.06MJ
diesel1.9MJ
emissionCO0.3g
HC0.017g
NOX0.78g
PM0.011g
CO20.2kg
Propane Dehydrogenation [25]M&Emethane2.64kg
fresh water0.426kg
reuse water1.126kg
vapor12.97kg
electricity4.655MJ
natural gas0.97MJ
emissionSO20.14kg
NOX0.47kg
particulate matter0.047kg
HCl0.0008kg
VOCs0.062kg
Note: N.A indicates that the data are unknown.
Table 4. Inventory of life-cycle data for WTH [30,31].
material production and turbine manufactureM&Eelectricity1.32kWh
emissionCO20.378kg
SO20.51g
NOx0.36g
CO0.11g
materials transportationM&Ediesel0.05MJ
emissionCO20.05kg
NOx0.42g
CO0.001g
wind power generationM&Ewind energy515MJ
electricity0.2kWh
emissionCO20kg
SO2N.Ag
NOxN.Ag
CON.Ag
ETHM&Eelectricity55kWh
Note: N.A indicates that the data are unknown.
Table 5. List of life cycle data for PVTH [32].
industrial silicon productionM&Eelectricity4.4MJ
emissionCO20.38kg
SO215.9kg
NOx5.12kg
polysilicon refining and PV module manufacturingM&Eelectricity86MJ
diesel0.03kg
natural gas0.00023M3
emissionCO24.69kg
SO20.04kg
NOx0.03kg
PM107.15g
equipment transportM&Ediesel0.018kg
emissionCO20.02kg
PV power generationM&Ecoal0.234kg
diesel0.0075kg
solar energy1070MJ
emissionCO20.28kg
dust0.03kg
ETHM&Eelectricity55kWh
Table 6. Prediction of energy efficiency and exergic efficiency for ETH.
ETH2020 (ALK)2030 (PEM)2050 (PEM)
energy efficiency (%)72.780.090.0
exergic efficiency (%)59.765.773.9
Table 7. Prediction of energy efficiency and exergic efficiency for WTH and PVTH.
Year20302050
energy efficiency of WTH77.7%87.1%
exergic efficiency of WTH63.8%71.5%
energy efficiency of PVTH53.0%57.2%
exergic efficiency of PVTH43.5%47.0%
Table 8. Prediction of energy and exergy consumption for hydrogen production in China (2020, 2030, 2050).
Year202020302050
energy consumption (tons of SC)31,10132,03947,960
energy efficiency (%)52.2%53.8%61.6%
energy consumption per unit of hydrogen production (kg of SC/kg of H2)9.49.28.0
exergy consumption (tons of SC)32,99433,45845,022
exergic efficiency (%)40.4%42.3%53.8%
unit hydrogen exergy consumption (kg SC/kg H2)10.09.67.5
Disclaimer/Publisher’s Note: The statements, opinions and data contained in all publications are solely those of the individual author(s) and contributor(s) and not of MDPI and/or the editor(s). MDPI and/or the editor(s) disclaim responsibility for any injury to people or property resulting from any ideas, methods, instructions or products referred to in the content.

