
Segmentation by Image Attributes in Island Marine Protected Areas: The Galapagos Islands, Ecuador

 ,
, 
Abstract
1. Introduction
2. Literature Review
2.1. The Cognitive and Conative Image in Island Marine Protected Areas
2.2. Image Attributes in Island Marine Protected Areas
2.3. Image Segmentation in Island Marine Protected Areas
2.4. Relationship Between Image Demand Segments with Satisfaction and Loyalty in Marine Protected Areas
2.5. Relationship of the Socio-Demographic Aspects of the Segments by Image in Island Marine Protected Areas
3. Methodology
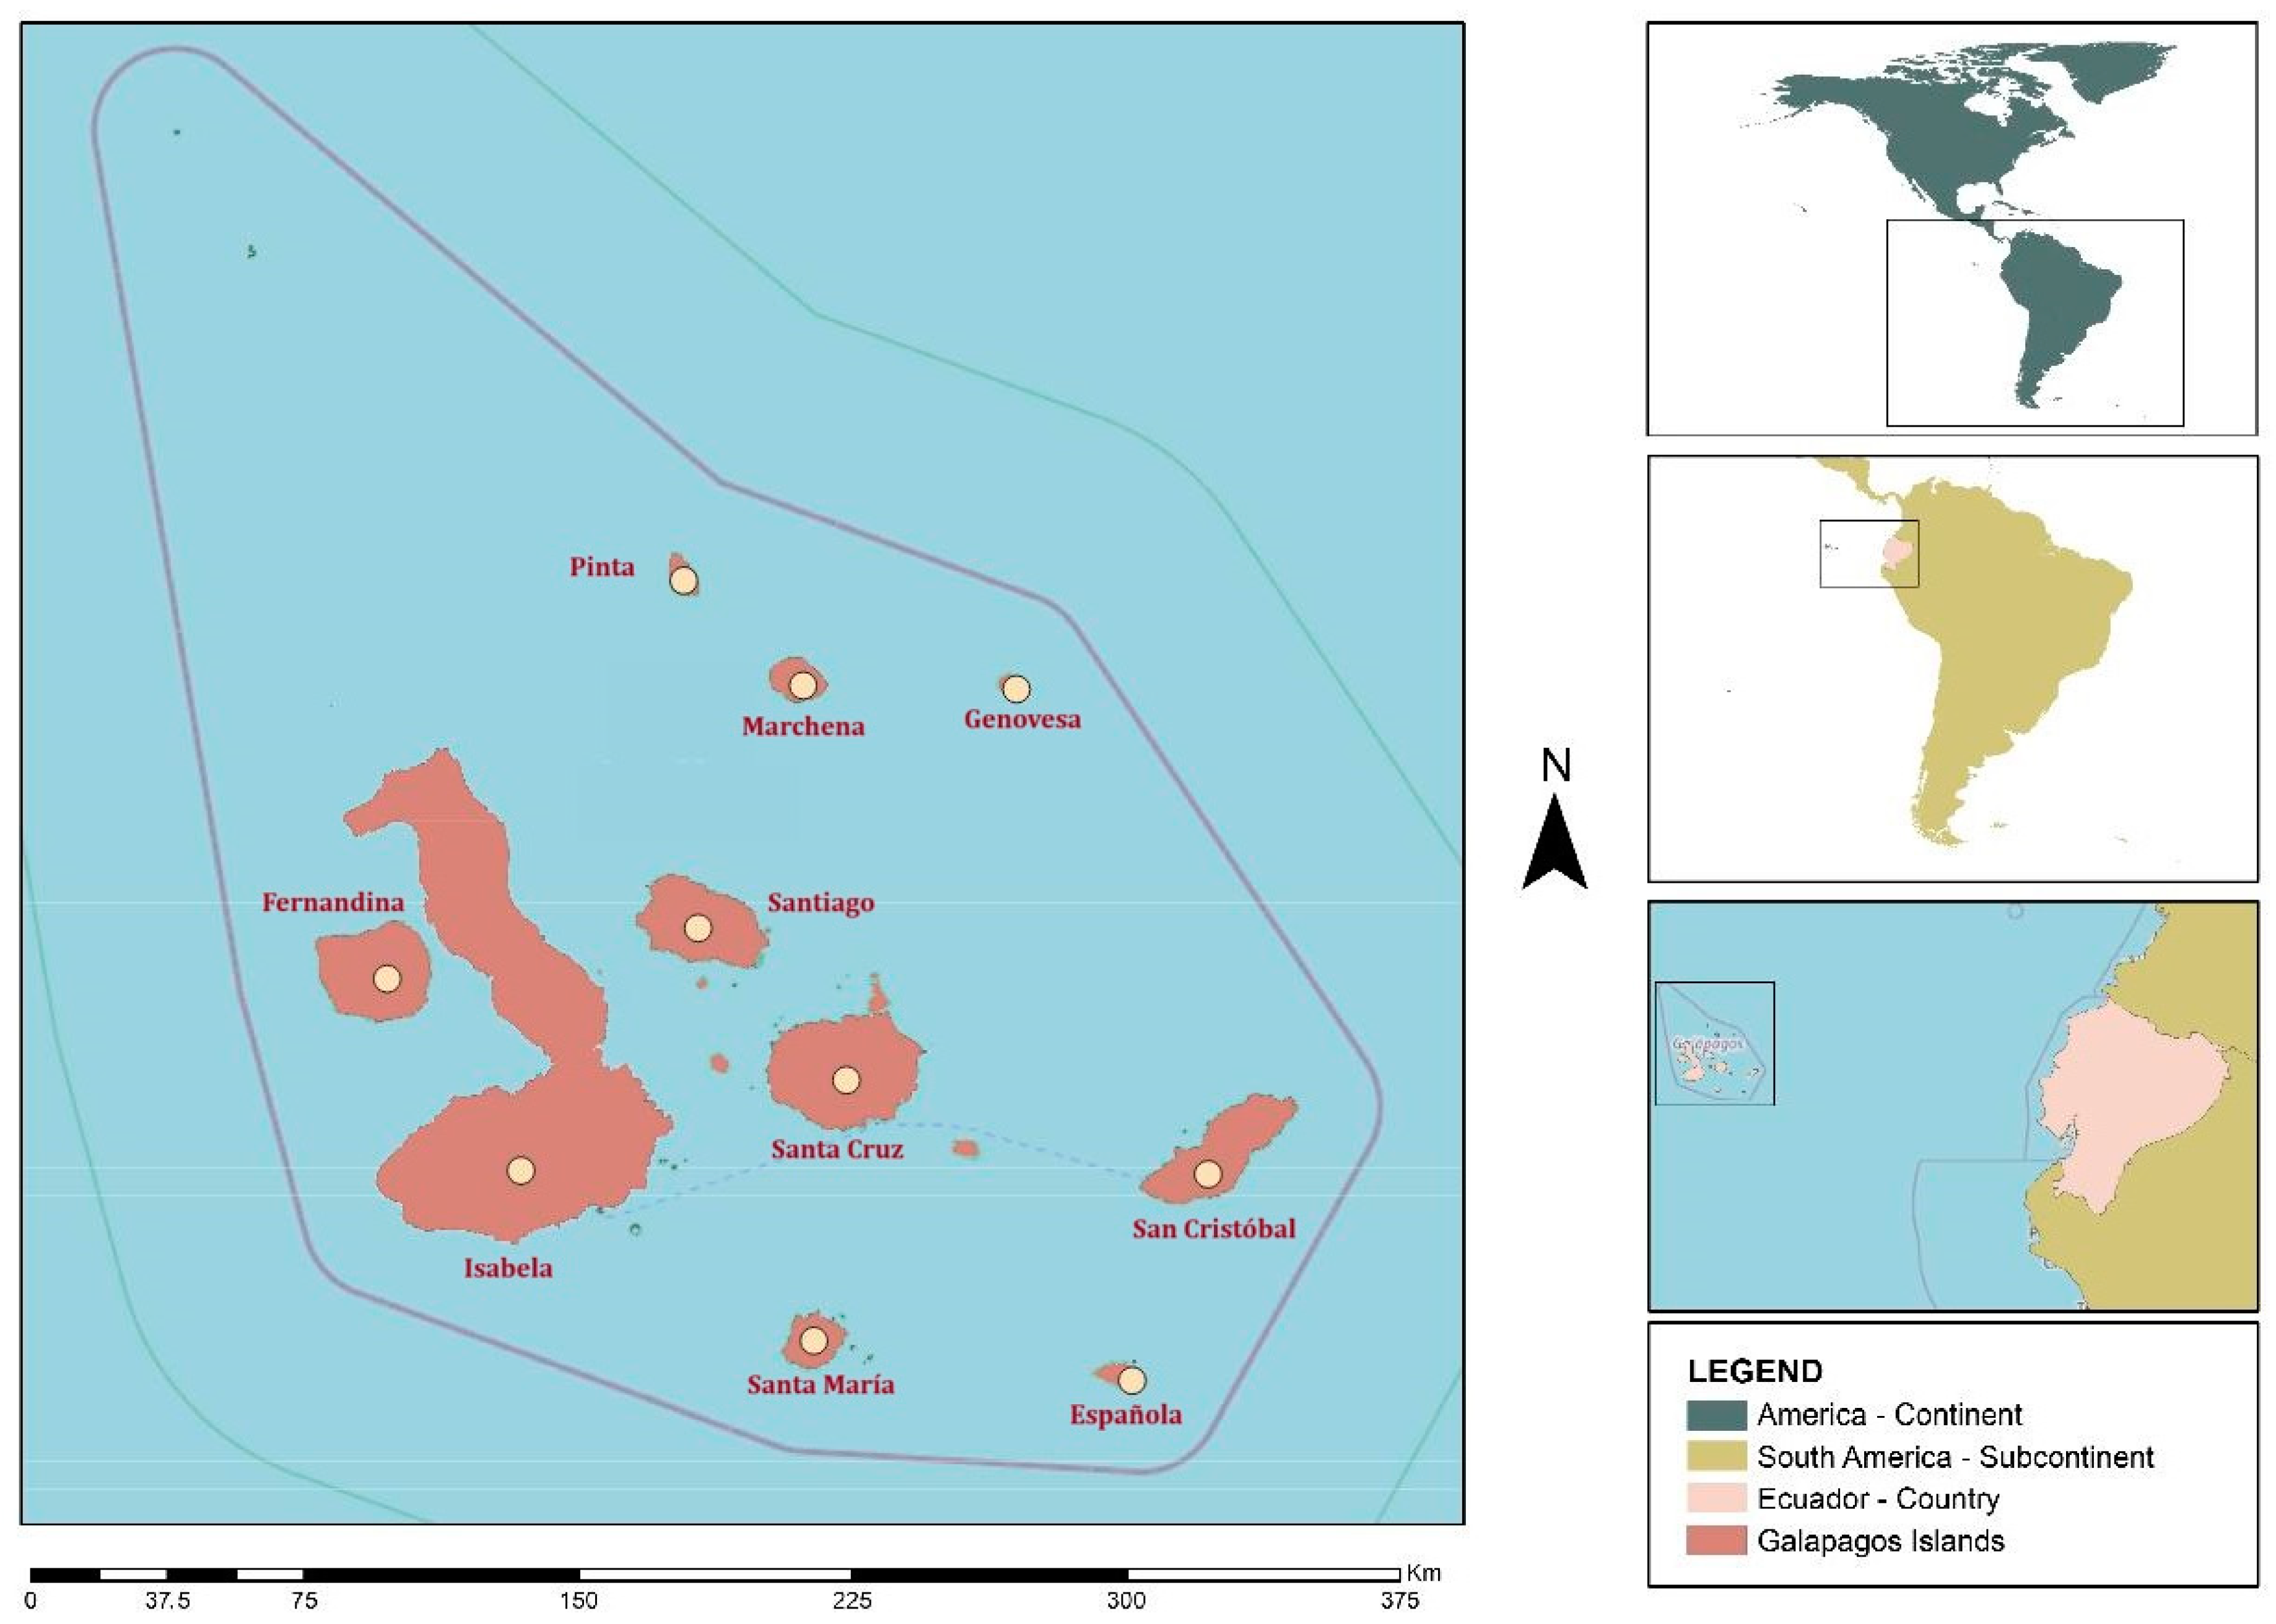
3.1. Study Area
3.2. Survey, Data Gathering, and Analysis
4. Results
4.1. Sample Profile
4.2. Image Attributes of an Island Marine Protected Area
4.3. Segmentation of Image Attributes of an Island Marine Protected Area
4.4. Segments by Image and Satisfaction and Loyalty Variables of an Island Marine Protected Area
4.5. Image Segments and Socio-Demographic Variables
5. Discussion
6. Conclusions
Author Contributions
Funding
Institutional Review Board Statement
Informed Consent Statement
Data Availability Statement
Conflicts of Interest
References
- Lalicic, L.; Marine-Roig, E.; Ferrer-Rosell, B.; Martin-Fuentes, E. Destination image analytics for tourism design: An approach through Airbnb reviews. Ann. Tour. Res. 2021, 86, 103100. [Google Scholar] [CrossRef]
- Dolnicar, S.; Grün, B. Validly measuring destination image in survey studies. J. Travel Res. 2013, 52, 3–14. [Google Scholar] [CrossRef]
- Hosany, S.; Gilbert, D. Measuring tourists’ emotional experiences toward hedonic holiday destinations. J. Travel Res. 2010, 49, 513–526. [Google Scholar] [CrossRef]
- Mak, A.H.N. Online destination image: Comparing national tourism organisation’s and tourists’ perspectives. Tour. Manag. 2017, 60, 280–297. [Google Scholar] [CrossRef]
- Pike, S. Destination positioning and temporality: Tracking relative strengths and weaknesses over time. J. Hosp. Tour. Manag. 2017, 31, 126–133. [Google Scholar] [CrossRef]
- Lai, K.; Li, X. Tourism destination image: Conceptual problems and definitional solutions. J. Travel Res. 2016, 55, 1065–1080. [Google Scholar] [CrossRef]
- Michael, N.; James, R.; Michael, I. Australia’s cognitive, affective and conative destination image: An Emirati tourist perspective. J. Islam. Mark. 2018, 9, 36–59. [Google Scholar] [CrossRef]
- Almeida-García, F.; Domigunez-Azcue, J.; Mercadé-Melé, P.; Pérez-Tapia, G. Can a destination really change its image? The roles of information sources, motivations, and visits. Tour. Manag. Perspect. 2020, 34, 100662. [Google Scholar] [CrossRef]
- Neuts, B.; Romao, J.; Nijkamp, P.; Shikida, A. Market segmentation and their potential economic impacts in an ecotourism destination: An applied modelling study on Hokkaido, Japan. Tour. Econ. 2016, 22, 793–808. [Google Scholar] [CrossRef]
- Paker, N.; Vural, C.A. Customer segmentation for marinas: Evaluating marinas as destinations. Tour. Manag. 2016, 56, 156–171. [Google Scholar] [CrossRef]
- Lee, T.H.; Jan, F.H.; Tseng, C.H.; Lin, Y.F. Segmentation by recreation experience in island-based tourism: A case study of Taiwan’s Liuqiu Island. J. Sustain. Tour. 2018, 26, 362–378. [Google Scholar] [CrossRef]
- Prayag, G. Paradise for who? Segmenting visitors’ satisfaction with cognitive image and predicting behavioural loyalty. Int. J. Tour. Res. 2011, 14, 1–15. [Google Scholar] [CrossRef]
- Carvache-Franco, M.; Carvache-Franco, W.; Carvache-Franco, O.; Hernández-Lara, A.B.; Buele, C.V. Segmentation, motivation, and socio-demographic aspects of tourist demand in a coastal marine destination: A case study in Manta (Ecuador). Curr. Issues Tour. 2020, 23, 1234–1247. [Google Scholar] [CrossRef]
- World Tourism Organization UNWTO. Glossary of Tourism Terms. 2019. Available online: https://www.unwto.org/glossary-tourism-terms (accessed on 1 August 2024).
- Mestanza-Ramón, C.; Capa, M.S.; Saavedra, H.F.; Paredes, J.R. Integrated coastal zone management in continental Ecuador and Galapagos Islands: Challenges and opportunities in a changing tourism and economic context. Sustainability 2019, 11, 6386. [Google Scholar] [CrossRef]
- Carvache-Franco, W.; Carvache-Franco, M.; Hernández-Lara, A.B. From motivation to segmentation in coastal and marine destinations: A study from the Galapagos Islands, Ecuador. Curr. Issues Tour. 2020, 24, 2325–2341. [Google Scholar] [CrossRef]
- Carvache-Franco, M.; Carvache-Franco, O.; Carvache-Franco, W.; Alvarez-Risco, A.; Estrada-Merino, A. Motivations and segmentation of the demand for coastal cities: A study in Lima, Peru. Int. J. Tour. Res. 2021, 23, 517–531. [Google Scholar] [CrossRef]
- Li, X.; Stepchenkova, S. Chinese outbound tourists’ destination image of America: Part I. J. Travel Res. 2012, 51, 250–266. [Google Scholar] [CrossRef]
- Zhang, H.; Fu, X.; Cai, L.A.; Lu, L. Destination image and tourist loyalty: A meta-analysis. Tour. Manag. 2014, 40, 213–223. [Google Scholar] [CrossRef]
- Abodeeb, J.; Wilson, E.; Moyle, B. Shaping destination image and identity: Insights for Arab tourism at the Gold Coast, Australia. Int. J. Cult. Tour. Hosp. Res. 2015, 9, 6–21. [Google Scholar] [CrossRef]
- Esper, F.S.; Rateike, J.Á. Tourism destination image and motivations: The Spanish perspective of Mexico. J. Travel Tour. Mark. 2010, 27, 349–360. [Google Scholar] [CrossRef]
- Hasan, M.K.; Abdullah, S.K.; Lew, T.Y.; Islam, M.F. Determining factors of tourists’ loyalty to beach tourism destinations: A structural model. Asia Pac. J. Mark. Logist. 2019, 32, 169–187. [Google Scholar] [CrossRef]
- Pham, T.T.T. Tourism in marine protected areas: Can it be considered as an alternative livelihood for local communities? Mar. Policy 2020, 115, 103891. [Google Scholar] [CrossRef]
- Prayag, G.; Ryan, C. Antecedents of tourists’ loyalty to Mauritius: The role and influence of destination image, place attachment, personal involvement, and satisfaction. J. Travel Res. 2012, 51, 342–356. [Google Scholar] [CrossRef]
- Stylidis, D.; Belhassen, Y.; Shani, A. Three tales of a city: Stakeholders’ images of Eilat as a tourist destination. J. Travel Res. 2015, 54, 702–716. [Google Scholar] [CrossRef]
- Stylos, N.; Vassiliadis, C.A.; Bellou, V.; Andronikidis, A. Destination images, holistic images and personal normative beliefs: Predictors of intention to revisit a destination. Tour. Manag. 2016, 53, 40–60. [Google Scholar] [CrossRef]
- Martín-Santana, J.D.; Beerli-Palacio, A.; Nazzareno, P.A. Antecedents and consequences of destination image gap. Ann. Tour. Res. 2017, 62, 13–25. [Google Scholar] [CrossRef]
- Kastenholz, E.; Carneiro, M.J.; Marques, C.P.; Loureiro SM, C. The dimensions of rural tourism experience: Impacts on arousal, memory, and satisfaction. J. Travel Tour. Mark. 2017, 35, 189–201. [Google Scholar] [CrossRef]
- Stepchenkova, S.; Mills, J.E. Destination image: A meta-analysis of 2000–2007 research. J. Hosp. Mark. Manag. 2010, 19, 575–609. [Google Scholar] [CrossRef]
- Isaac, R.K.; Eid, T.A. Tourists’ destination image: An exploratory study of alternative tourism in Palestine. Curr. Issues Tour. 2019, 22, 1499–1522. [Google Scholar] [CrossRef]
- Chiu YT, H.; Lee, W.I.; Chen, T.H. Environmentally responsible behavior in ecotourism: Exploring the role of destination image and value perception. Asia Pac. J. Tour. Res. 2014, 19, 876–889. [Google Scholar] [CrossRef]
- Gartner, W.; Ruzzier, M. Tourism destination brand equity dimensions: Renewal versus repeat market. J. Travel Res. 2011, 50, 471–481. [Google Scholar] [CrossRef]
- Chen, C.F.; Phou, S. A closer look at destination: Image, personality, relationship and loyalty. Tour. Manag. 2013, 36, 269–278. [Google Scholar] [CrossRef]
- Wu, C.W. Destination loyalty modeling of the global tourism. J. Bus. Res. 2016, 69, 2213–2219. [Google Scholar] [CrossRef]
- Hasan, M.K.; Abdullah, S.K.; Lew, T.Y.; Islam, M.F. The antecedents of tourist attitudes to revisit and revisit intentions for coastal tourism. Int. J. Cult. Tour. Hosp. Res. 2019, 13, 218–234. [Google Scholar] [CrossRef]
- Lam-González, Y.E.; Leon, C.J.; Gonzalez Hernandez, M.M.; De Leon, J. The structural relationships of destination image, satisfaction, expenditure and loyalty in the context of fishing tourism. Scand. J. Hosp. Tour. 2021, 21, 422–441. [Google Scholar] [CrossRef]
- Akgün, A.E.; Senturk, H.A.; Keskin, H.; Onal, I. The relationships among nostalgic emotion, destination images, and tourist behaviors: An empirical study of Istanbul. J. Destin. Mark. Manag. 2019, 16, 100355. [Google Scholar] [CrossRef]
- Carvache-Franco, M.; Solis-Radilla, M.M.; Carvache-Franco, W.; Carvache-Franco, O. The Cognitive Image and Behavioral Loyalty of A Coastal and Marine Destination: A Study in Acapulco, Mexico. J. Qual. Assur. Hosp. Tour. 2023, 24, 146–168. [Google Scholar] [CrossRef]
- Carvache-Franco, M.; Carvache-Franco, W.; Solis-Radilla, M.M.; Carvache-Franco, O. Segmentation based on recreational experiences in coastal and marine destinations: A study in Acapulco, Mexico. J. Policy Res. Tour. Leis. Events 2023, 15, 336–352. [Google Scholar] [CrossRef]
- Agapito, D.; Do Valle, P.O.; Mendes, J.D.C. Understanding tourist recommendation through destination image: A chaid analysis. Tour. Manag. Stud. 2012, 7, 33–42. Available online: https://www.tmstudies.net/index.php/ectms/article/view/332 (accessed on 1 August 2024).
- Sánchez-Rivero, M.; Pulido-Fernández, J.I. Testing Heterogeneous Image in Cultural/Non-cultural Tourism Markets: A Latent Model Approach. Int. J. Tour. Res. 2012, 14, 250–268. [Google Scholar] [CrossRef]
- Hair, J.F.; Black, W.C.; Babin, B.J.; Anderson, R.E.; Tatham, R.L. Multivariate Data Analysis, 7th ed.; Pearson Education: Upper Saddle River, NJ, USA, 2010; Available online: https://www.drnishikantjha.com/papersCollection/Multivariate%20Data%20Analysis.pdf (accessed on 1 August 2024).
- Galapagos Tourism Observatory. Tourist Arrivals and Tourist Profile to Galapagos. 2024. Available online: https://www.observatoriogalapagos.gob.ec/arribos-anuales (accessed on 1 August 2024).
- Governing Council of the Galapagos Special Regime. Technical Report Regarding the Distribution and Income Rate Update by Conservation of Protected Natural Areas. 2023. Available online: https://www.gobiernogalapagos.gob.ec/wp-content/uploads/downloads/2024/03/c.2.-informe_tecnico_st_-_aprobado_por_ctpt.pdf (accessed on 1 August 2024).

| Variable | Categories | Percentage |
|---|---|---|
| Gender | Male | 44.0 |
| Female | 55.8 | |
| Marital Status | Single | 59.2 |
| Married | 30.0 | |
| Other | 8.8 | |
| Age | Less than 20 years old | 5.7 |
| 21–30 | 42.1 | |
| 31–40 | 35.0 | |
| 41–50 | 10.8 | |
| 61–60 | 4.4 | |
| More than 61 years old | 2.0 | |
| Education Level | Primary | 2.7 |
| Secondary | 12.8 | |
| University | 62.9 | |
| Postgraduate/Master/Ph.D. | 21.6 | |
| Occupation | Student | 25.8 |
| Researcher/Scientist | 4.7 | |
| Businessman | 15.7 | |
| Private Employee | 30.7 | |
| Public Employee | 14.3 | |
| Pensioner | 2.9 | |
| Unemployed | 2.0 | |
| Other | 3.9 | |
| With whom do you travel | Alone | 26.3 |
| With family | 17.7 | |
| With friends | 18.4 | |
| With partner | 26.0 | |
| Other | 11.3 | |
| Income level | Less than USD 500 | 10.8 |
| From USD 501 to USD 1000 | 22.6 | |
| From USD 1001 to USD 1500 | 27.3 | |
| From USD 1501 to USD 2000 | 12.5 | |
| From USD 2001 to USD 2500 | 9.8 | |
| From USD 2501 to USD 3000 | 7.9 | |
| More than USD 3000 | 9.1 | |
| Average daily expense | Less than USD 50 | 10.8 |
| USD 50.01–USD 100 | 33.7 | |
| USD 101.01–USD 150 | 29.5 | |
| USD 150.01–USD 200 | 15.0 | |
| USD 200.01–USD 250 | 5.7 | |
| More than USD 250 | 5.4 |
| Variable | Staff Attention | Tourist Facilities | Nature and People | Cultural Attractions |
|---|---|---|---|---|
| Kindness of hotel employees | 0.875 | |||
| Attitude of hotel employees towards family | 0.856 | |||
| Welcome and respect received from hotel employees | 0.833 | |||
| Courtesy of hotel employees | 0.816 | |||
| Hotel employees’ attention to my needs | 0.809 | |||
| Signaling | 0.510 | |||
| Store facilities for shopping | 0.765 | |||
| Variety of restaurants and bars | 0.757 | |||
| Local gastronomy | 0.738 | |||
| Accessibility to get to the destination | 0.708 | |||
| As a family vacation spot | 0.705 | |||
| Local transportation | 0.651 | |||
| Landscapes and natural attractions | 0.827 | |||
| Natural environment | 0.781 | |||
| Weather and climate | 0.708 | |||
| Kindness of people | 0.702 | |||
| Tourist crowd | 0.507 | |||
| Exoticism of the location | 0.500 | |||
| Cultural diversity of the location | 0.846 | |||
| Cultural and historical attractions | 0.795 | |||
| The towns and city | 0.787 | |||
| Variety and quality of accommodation | 0.618 | |||
| Cronbach’s Alpha | 0.931 | 0.882 | 0.855 | 0.866 |
| Eigenvalue | 9.731 | 2.157 | 1.722 | 1.422 |
| Variance explained (%) | 44.231 | 9.805 | 7.828 | 6.466 |
| Cumulative variance explained (%) | 44.231 | 54.036 | 61.863 | 68.329 |
| Variable | Passive | Nature | Want It All | Kruskal–Wallis | Sig. | Mann–Whitney U |
|---|---|---|---|---|---|---|
| Kindness of people | 2.55 | 3.57 | 4.61 | 165.72 | 0.000 | All |
| Natural environment | 2.73 | 3.77 | 4.7 | 152.55 | 0.000 | All |
| Landscapes and natural attractions | 3.41 | 4.18 | 4.59 | 50.190 | 0.000 | All |
| Weather and climate | 3.14 | 3.79 | 4.55 | 102.62 | 0.000 | All |
| Tourist crowd | 3.07 | 3.46 | 4.36 | 106.29 | 0.000 | All |
| Cultural and historical attractions | 2.97 | 3.55 | 4.39 | 104.87 | 0.000 | All |
| Cultural diversity of the location | 2.90 | 3.31 | 4.35 | 113.25 | 0.000 | All |
| Towns and city | 2.62 | 3.22 | 4.32 | 136.82 | 0.000 | All |
| Variety and quality of accommodation | 2.77 | 3.24 | 4.36 | 145.42 | 0.000 | All |
| Local transportation | 2.56 | 3.18 | 4.03 | 99.33 | 0.000 | All |
| Store facilities for shopping | 2.48 | 3.40 | 4.12 | 112.12 | 0.000 | All |
| As a family vacation spot | 2.51 | 4.07 | 4.52 | 151.17 | 0.000 | All |
| Local gastronomy | 2.44 | 3.74 | 4.4 | 148.18 | 0.000 | All |
| Variety of restaurants and bars | 2.25 | 3.59 | 4.33 | 166.44 | 0.000 | All |
| Accessibility to get to the destination | 2.46 | 3.67 | 4.34 | 139.96 | 0.000 | All |
| Exoticism of the location | 3.18 | 4 | 4.55 | 86.650 | 0.000 | All |
| Signaling | 2.86 | 3.51 | 4.45 | 137.36 | 0.000 | All |
| Hotel employees’ attention to my needs | 3.21 | 3.37 | 4.55 | 144.93 | 0.000 | All except 1–2 |
| Courtesy of hotel employees | 3.08 | 3.26 | 4.56 | 154.63 | 0.000 | All except 1–2 |
| Kindness of hotel employees | 3.45 | 3.38 | 4.61 | 141.36 | 0.000 | All except 1–2 |
| Attitude of hotel employees towards family | 3.35 | 3.37 | 4.61 | 137.36 | 0.000 | All except 1–2 |
| Welcome and respect received from hotel employees | 3.31 | 3.36 | 4.61 | 142.89 | 0.000 | All except 1–2 |
| Variables | Passive | Nature | Want It All | Chi-Squared | Sig. |
|---|---|---|---|---|---|
| Overall satisfaction | 3.41 | 4.07 | 4.61 | 126,602 | 0.00 |
| I intend to come back to this destination | 3.10 | 3.54 | 4.31 | 77,695 | 0.00 |
| I intend to recommend this destination | 3.38 | 4.18 | 4.72 | 128,363 | 0.00 |
| I will say positive things when I talk about this marine protected area | 3.80 | 4.32 | 4.75 | 88,975 | 0.00 |
| Variable | Categories | Passive | Nature | Want It All | Chi-Squared | Sig. |
|---|---|---|---|---|---|---|
| Occupation | Student | 25.4% | 27.5% | 25% | 30.843 | 0.000 |
| Researcher/Scientist | 2.8% | 3.3% | 5.7% | |||
| Businessman | 8.5% | 8.8% | 20.5% | |||
| Private Employee | 45.1% | 33% | 25.8% | |||
| Public Employee | 14.1% | 19.8% | 12.3% | |||
| Pensioner | 1.1% | 4.5% | ||||
| Unemployed | 4.2% | 2.2% | 1.2% | |||
| Other | 4.4% | 4.9% | ||||
| With whom do you travel | Alone | 43.7% | 29.7% | 20.1% | 28.148 | 0.000 |
| With family | 5.6% | 18.7% | 20.9% | |||
| With friends | 19.7% | 12.1% | 20.5% | |||
| With partner | 21.1% | 22.0% | 29.1% | |||
| Other | 9.9% | 17.6% | 9.4% | |||
| How many days does the stay last in this island marine protected area? | 1 day | 1.4% | 5.5% | 2.5% | 23.264 | 0.000 |
| 2 days and 1 night | 26.8% | 12.1% | 13.9% | |||
| 3 days and 2 nights | 29.6% | 22.0% | 20.9% | |||
| 4 days and 3 nights | 12.7% | 22.0% | 14.8% | |||
| 5 days and 4 nights | 26.8% | 38.5% | 47.1% | |||
| More than 5 days | 2.8% | 0.8% |
Disclaimer/Publisher’s Note: The statements, opinions and data contained in all publications are solely those of the individual author(s) and contributor(s) and not of MDPI and/or the editor(s). MDPI and/or the editor(s) disclaim responsibility for any injury to people or property resulting from any ideas, methods, instructions or products referred to in the content. |
© 2025 by the authors. Licensee MDPI, Basel, Switzerland. This article is an open access article distributed under the terms and conditions of the Creative Commons Attribution (CC BY) license (https://creativecommons.org/licenses/by/4.0/).
Share and Cite
Carvache-Franco, M.; Carvache-Franco, O.; Hassan, T.; León-Espinoza, I.; Carvache-Franco, W. Segmentation by Image Attributes in Island Marine Protected Areas: The Galapagos Islands, Ecuador. Sustainability 2025, 17, 1375. https://doi.org/10.3390/su17041375
Carvache-Franco M, Carvache-Franco O, Hassan T, León-Espinoza I, Carvache-Franco W. Segmentation by Image Attributes in Island Marine Protected Areas: The Galapagos Islands, Ecuador. Sustainability. 2025; 17(4):1375. https://doi.org/10.3390/su17041375
Chicago/Turabian StyleCarvache-Franco, Mauricio, Orly Carvache-Franco, Tahani Hassan, Ivonne León-Espinoza, and Wilmer Carvache-Franco. 2025. "Segmentation by Image Attributes in Island Marine Protected Areas: The Galapagos Islands, Ecuador" Sustainability 17, no. 4: 1375. https://doi.org/10.3390/su17041375
APA StyleCarvache-Franco, M., Carvache-Franco, O., Hassan, T., León-Espinoza, I., & Carvache-Franco, W. (2025). Segmentation by Image Attributes in Island Marine Protected Areas: The Galapagos Islands, Ecuador. Sustainability, 17(4), 1375. https://doi.org/10.3390/su17041375