
Optimization of Carbon Emission Reduction Path in the Beijing–Tianjin–Hebei Region Based on System Dynamics


Abstract
1. Introduction
2. Literature Review
3. Status of Carbon Emissions in the BTH Region
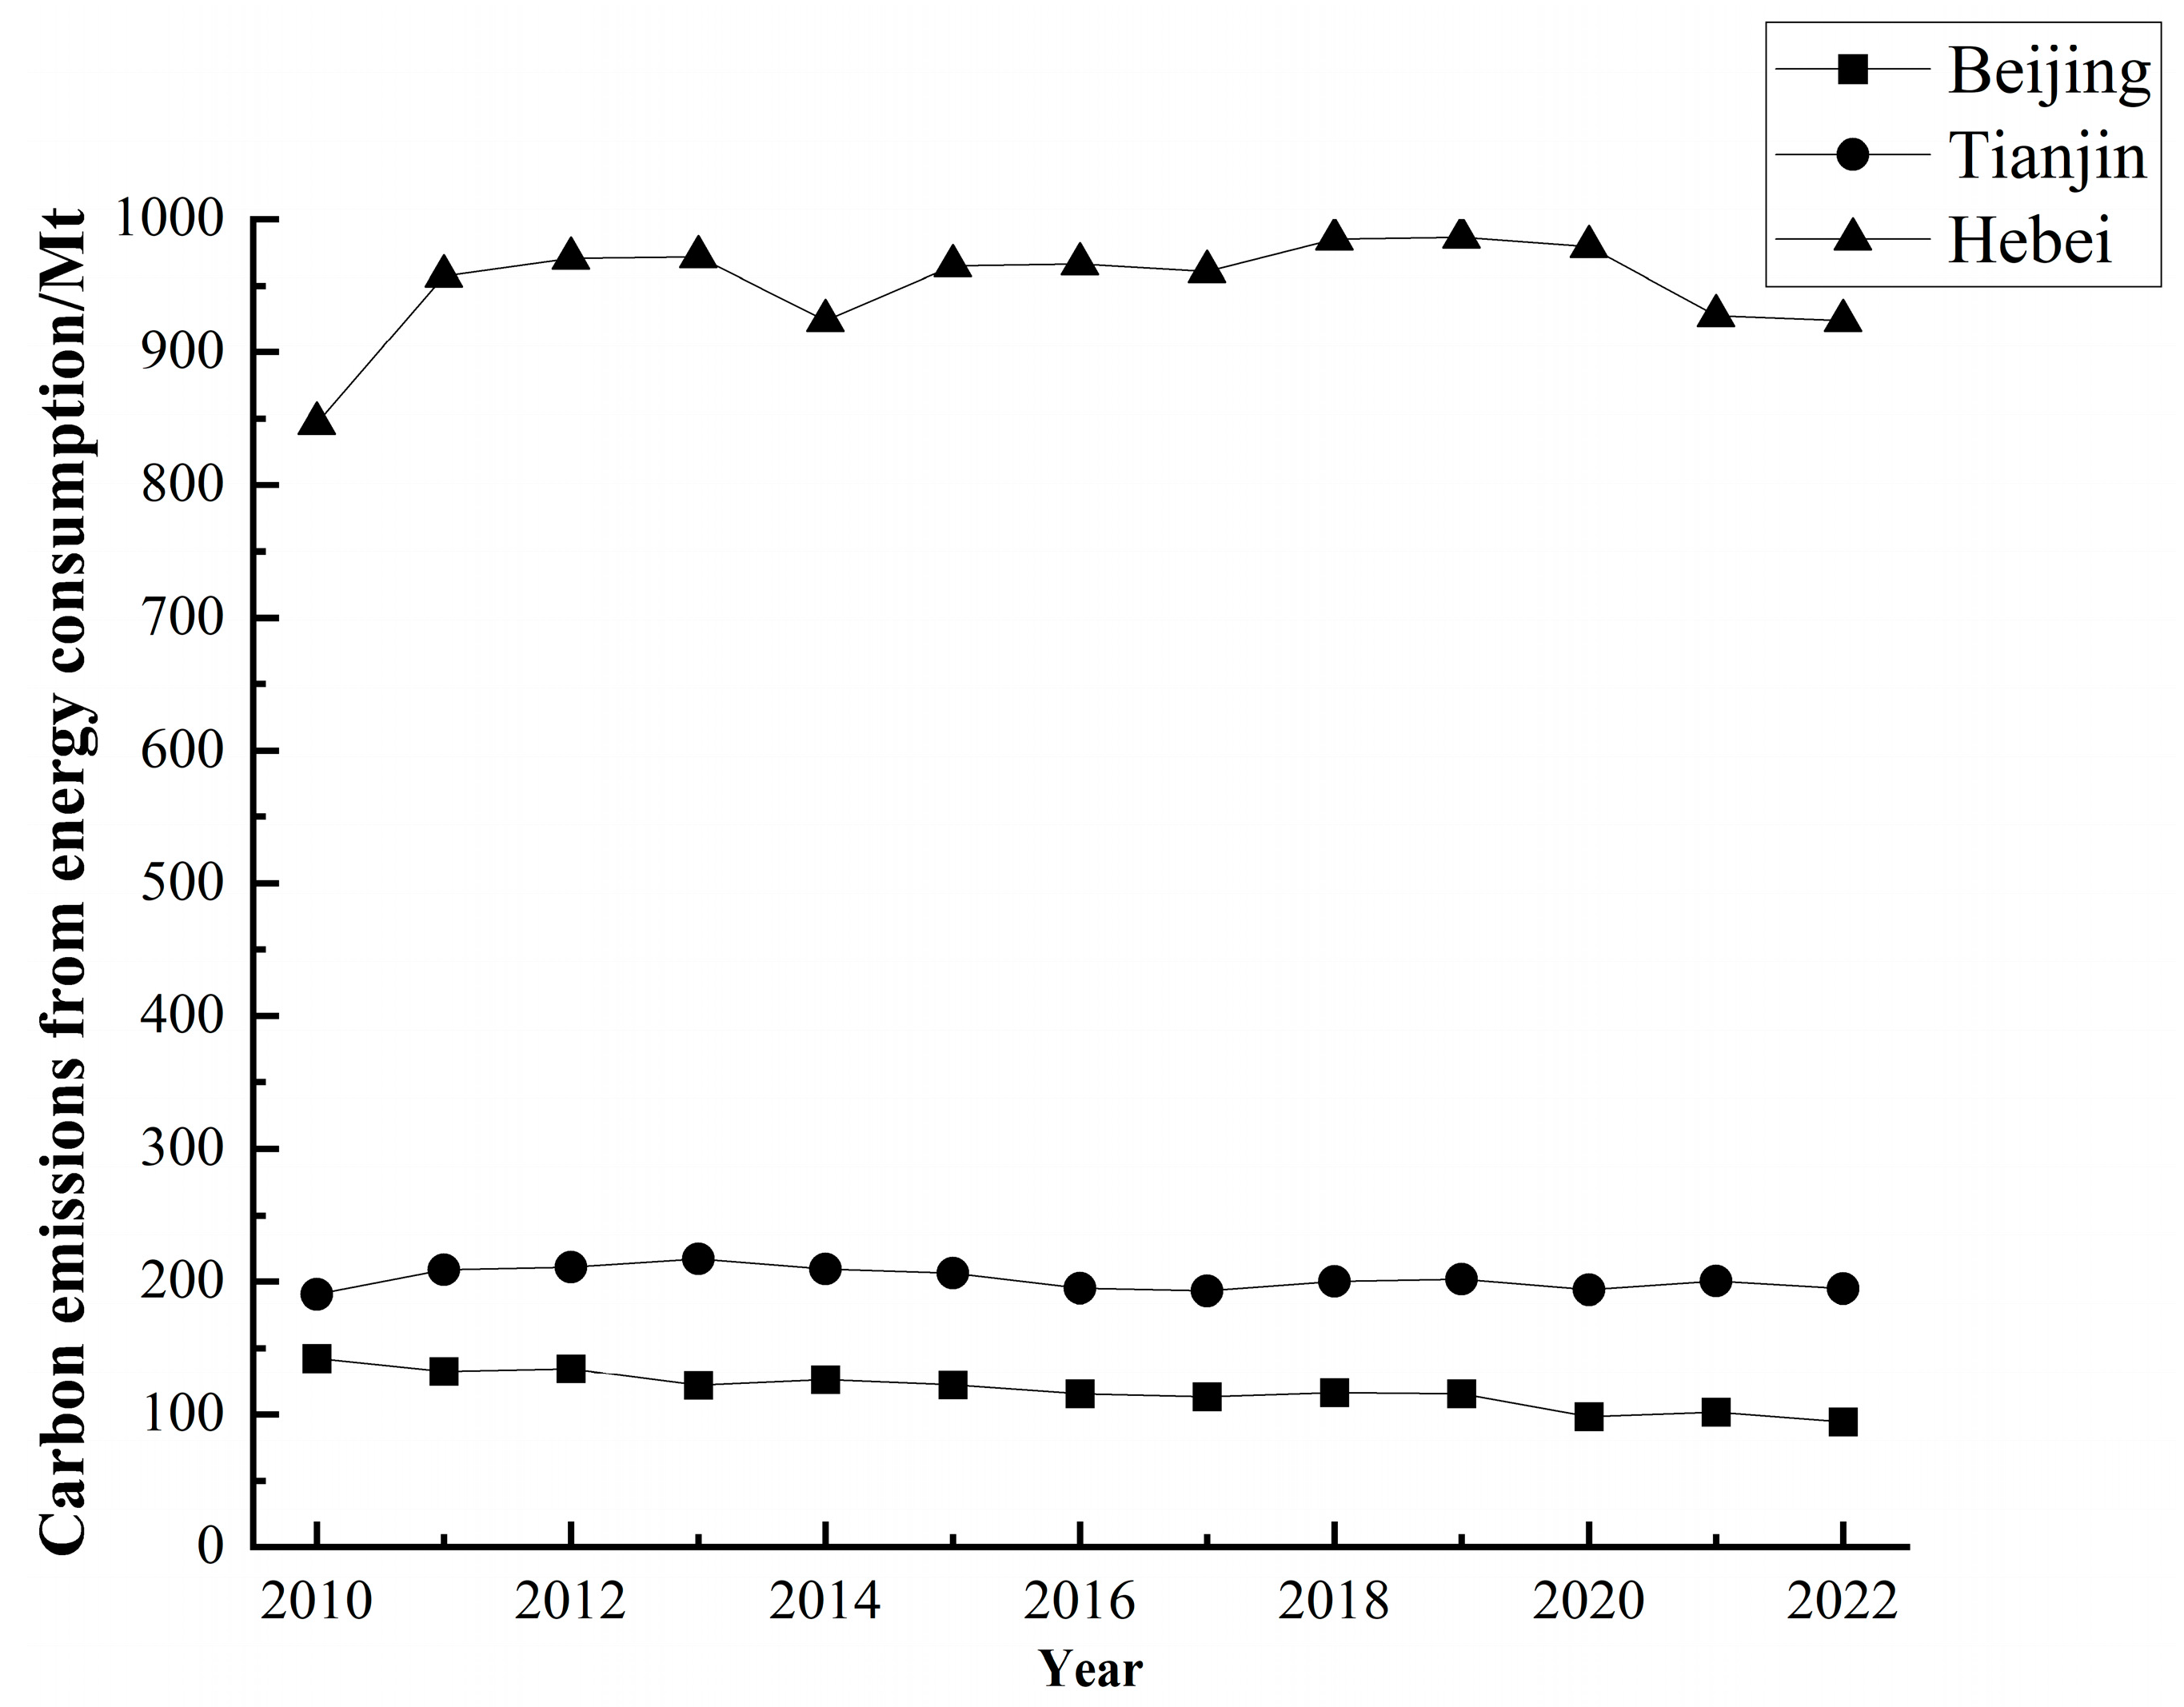
3.1. Total Carbon Emissions in the Beijing–Tianjin–Hebei Region
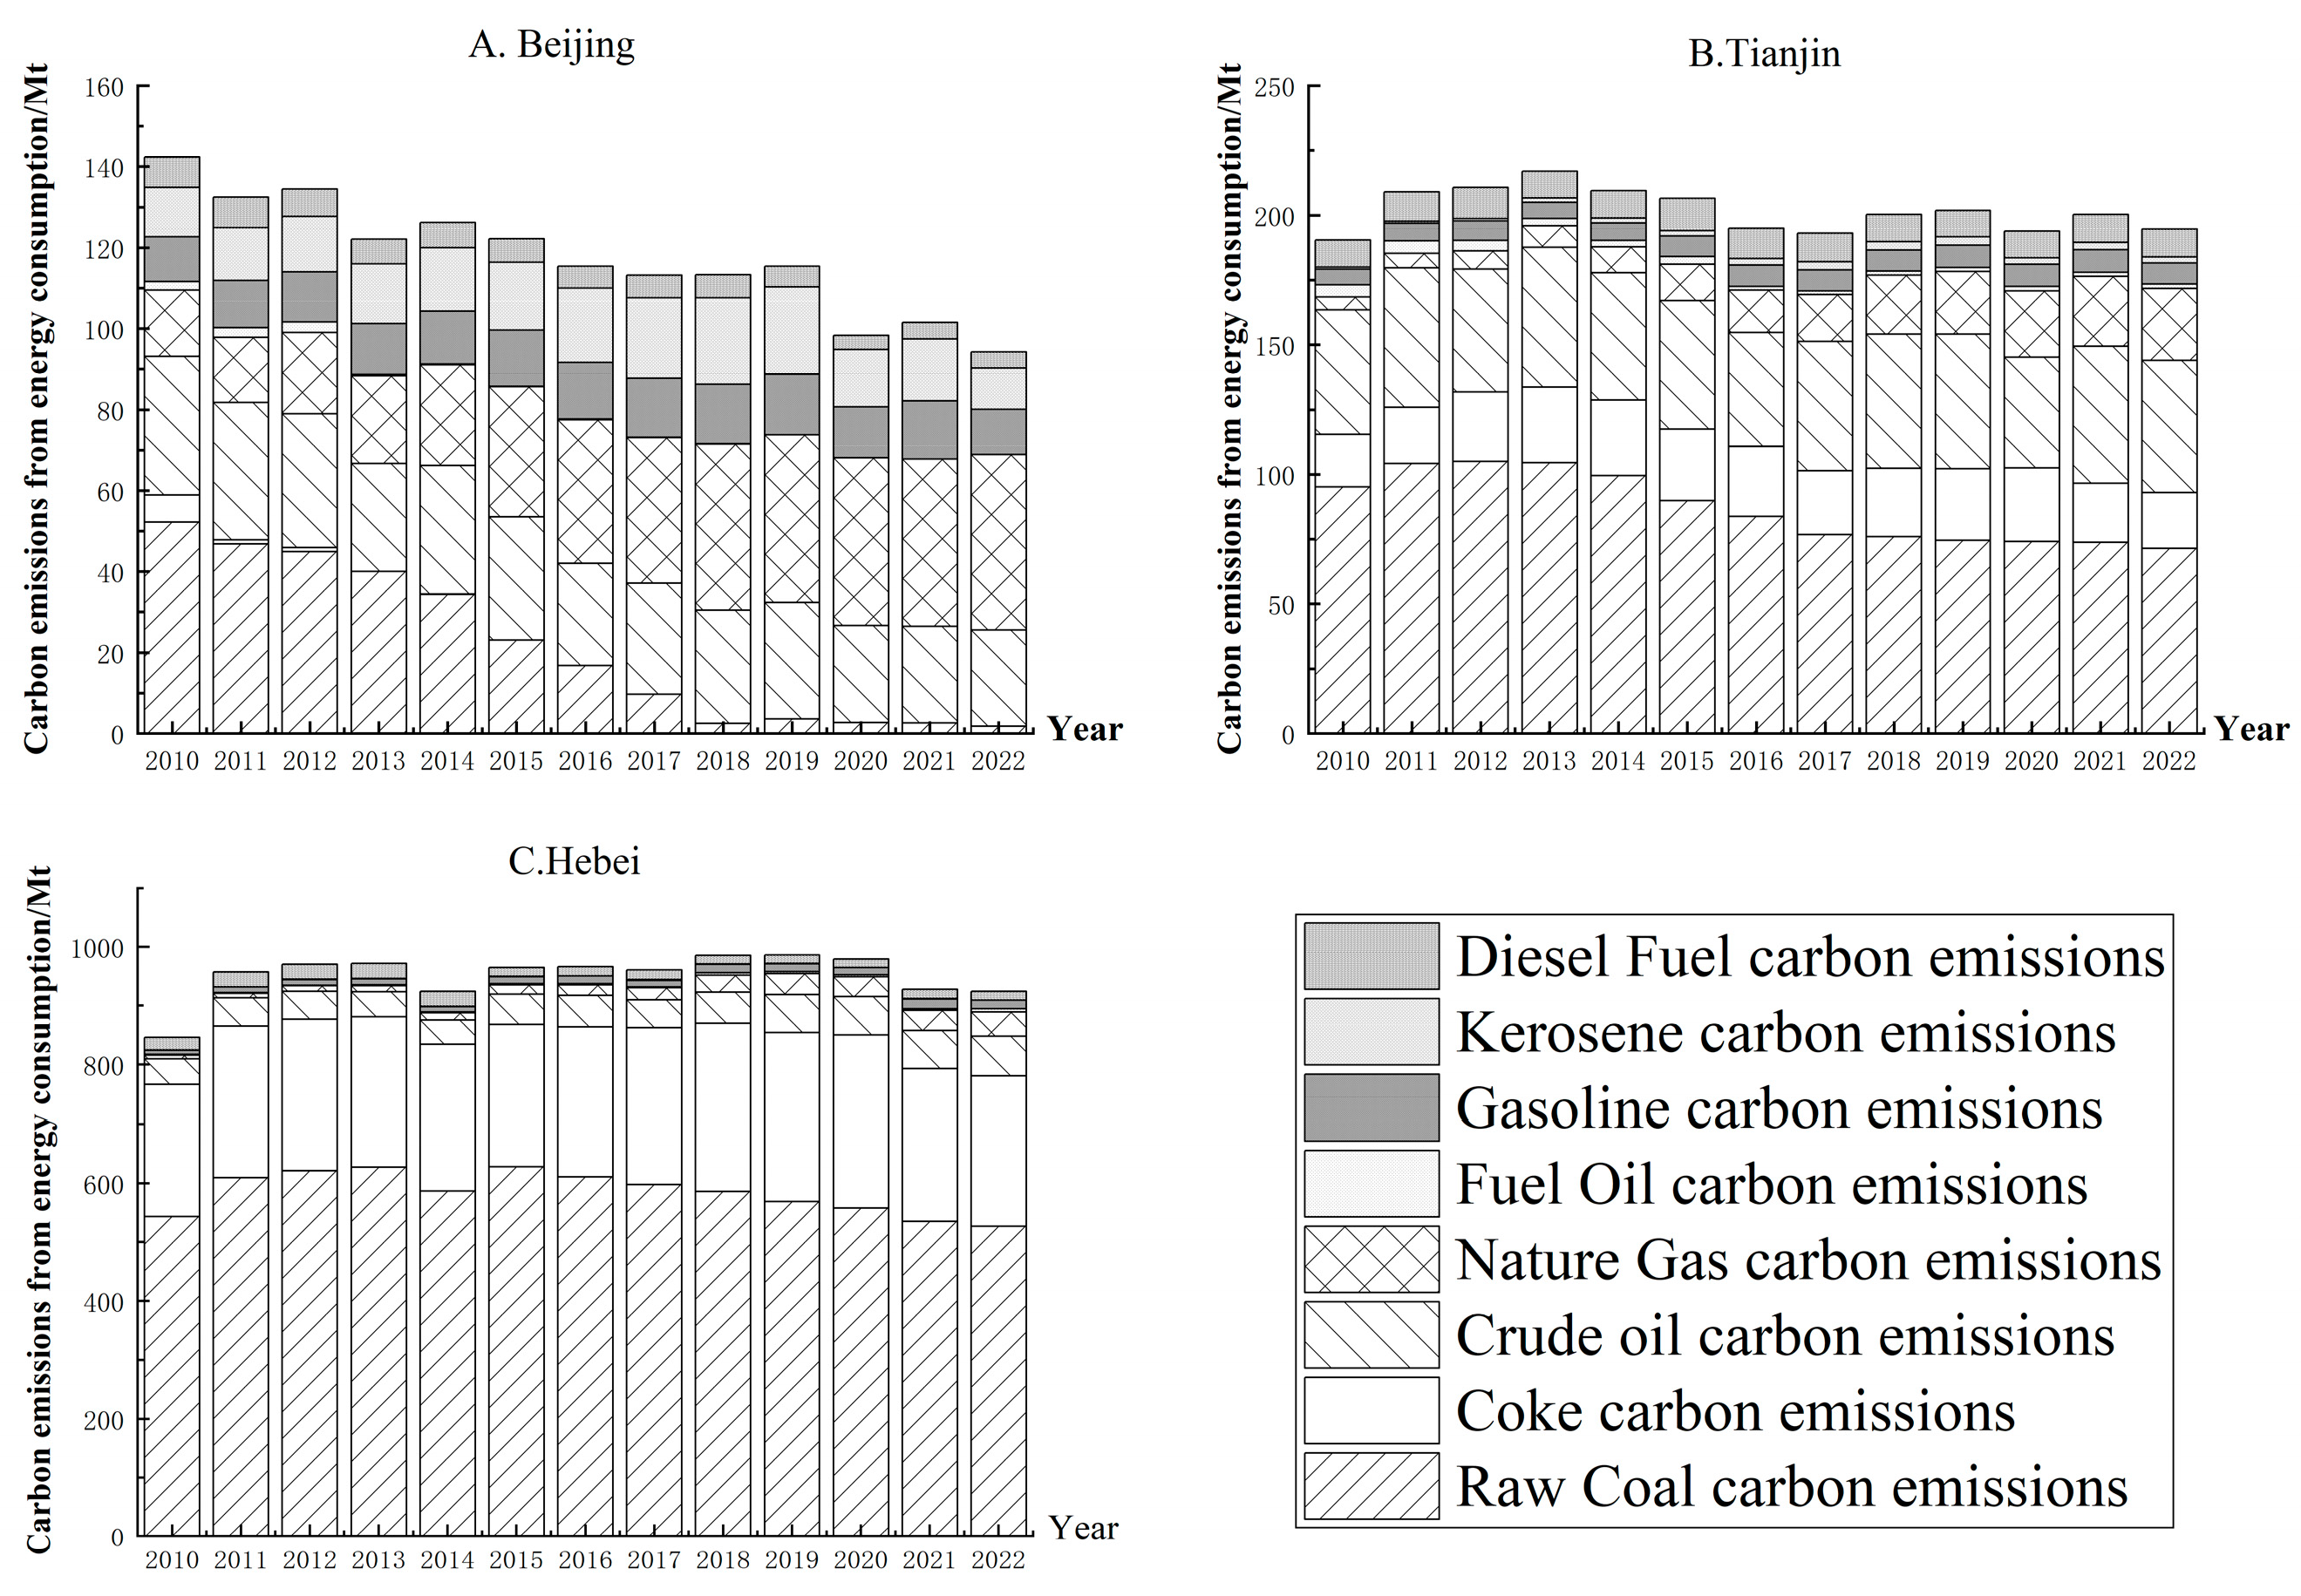
3.2. Characteristics of Carbon Emissions from Energy Consumption in the BTH Region
3.2.1. Carbon Emission Characteristics of Energy Consumption in Beijing
3.2.2. Carbon Emission Characteristics of Energy Consumption in Tianjin
3.2.3. Carbon Emission Characteristics of Energy Consumption in Hebei
4. System Dynamics Modeling and Scenario Analysis
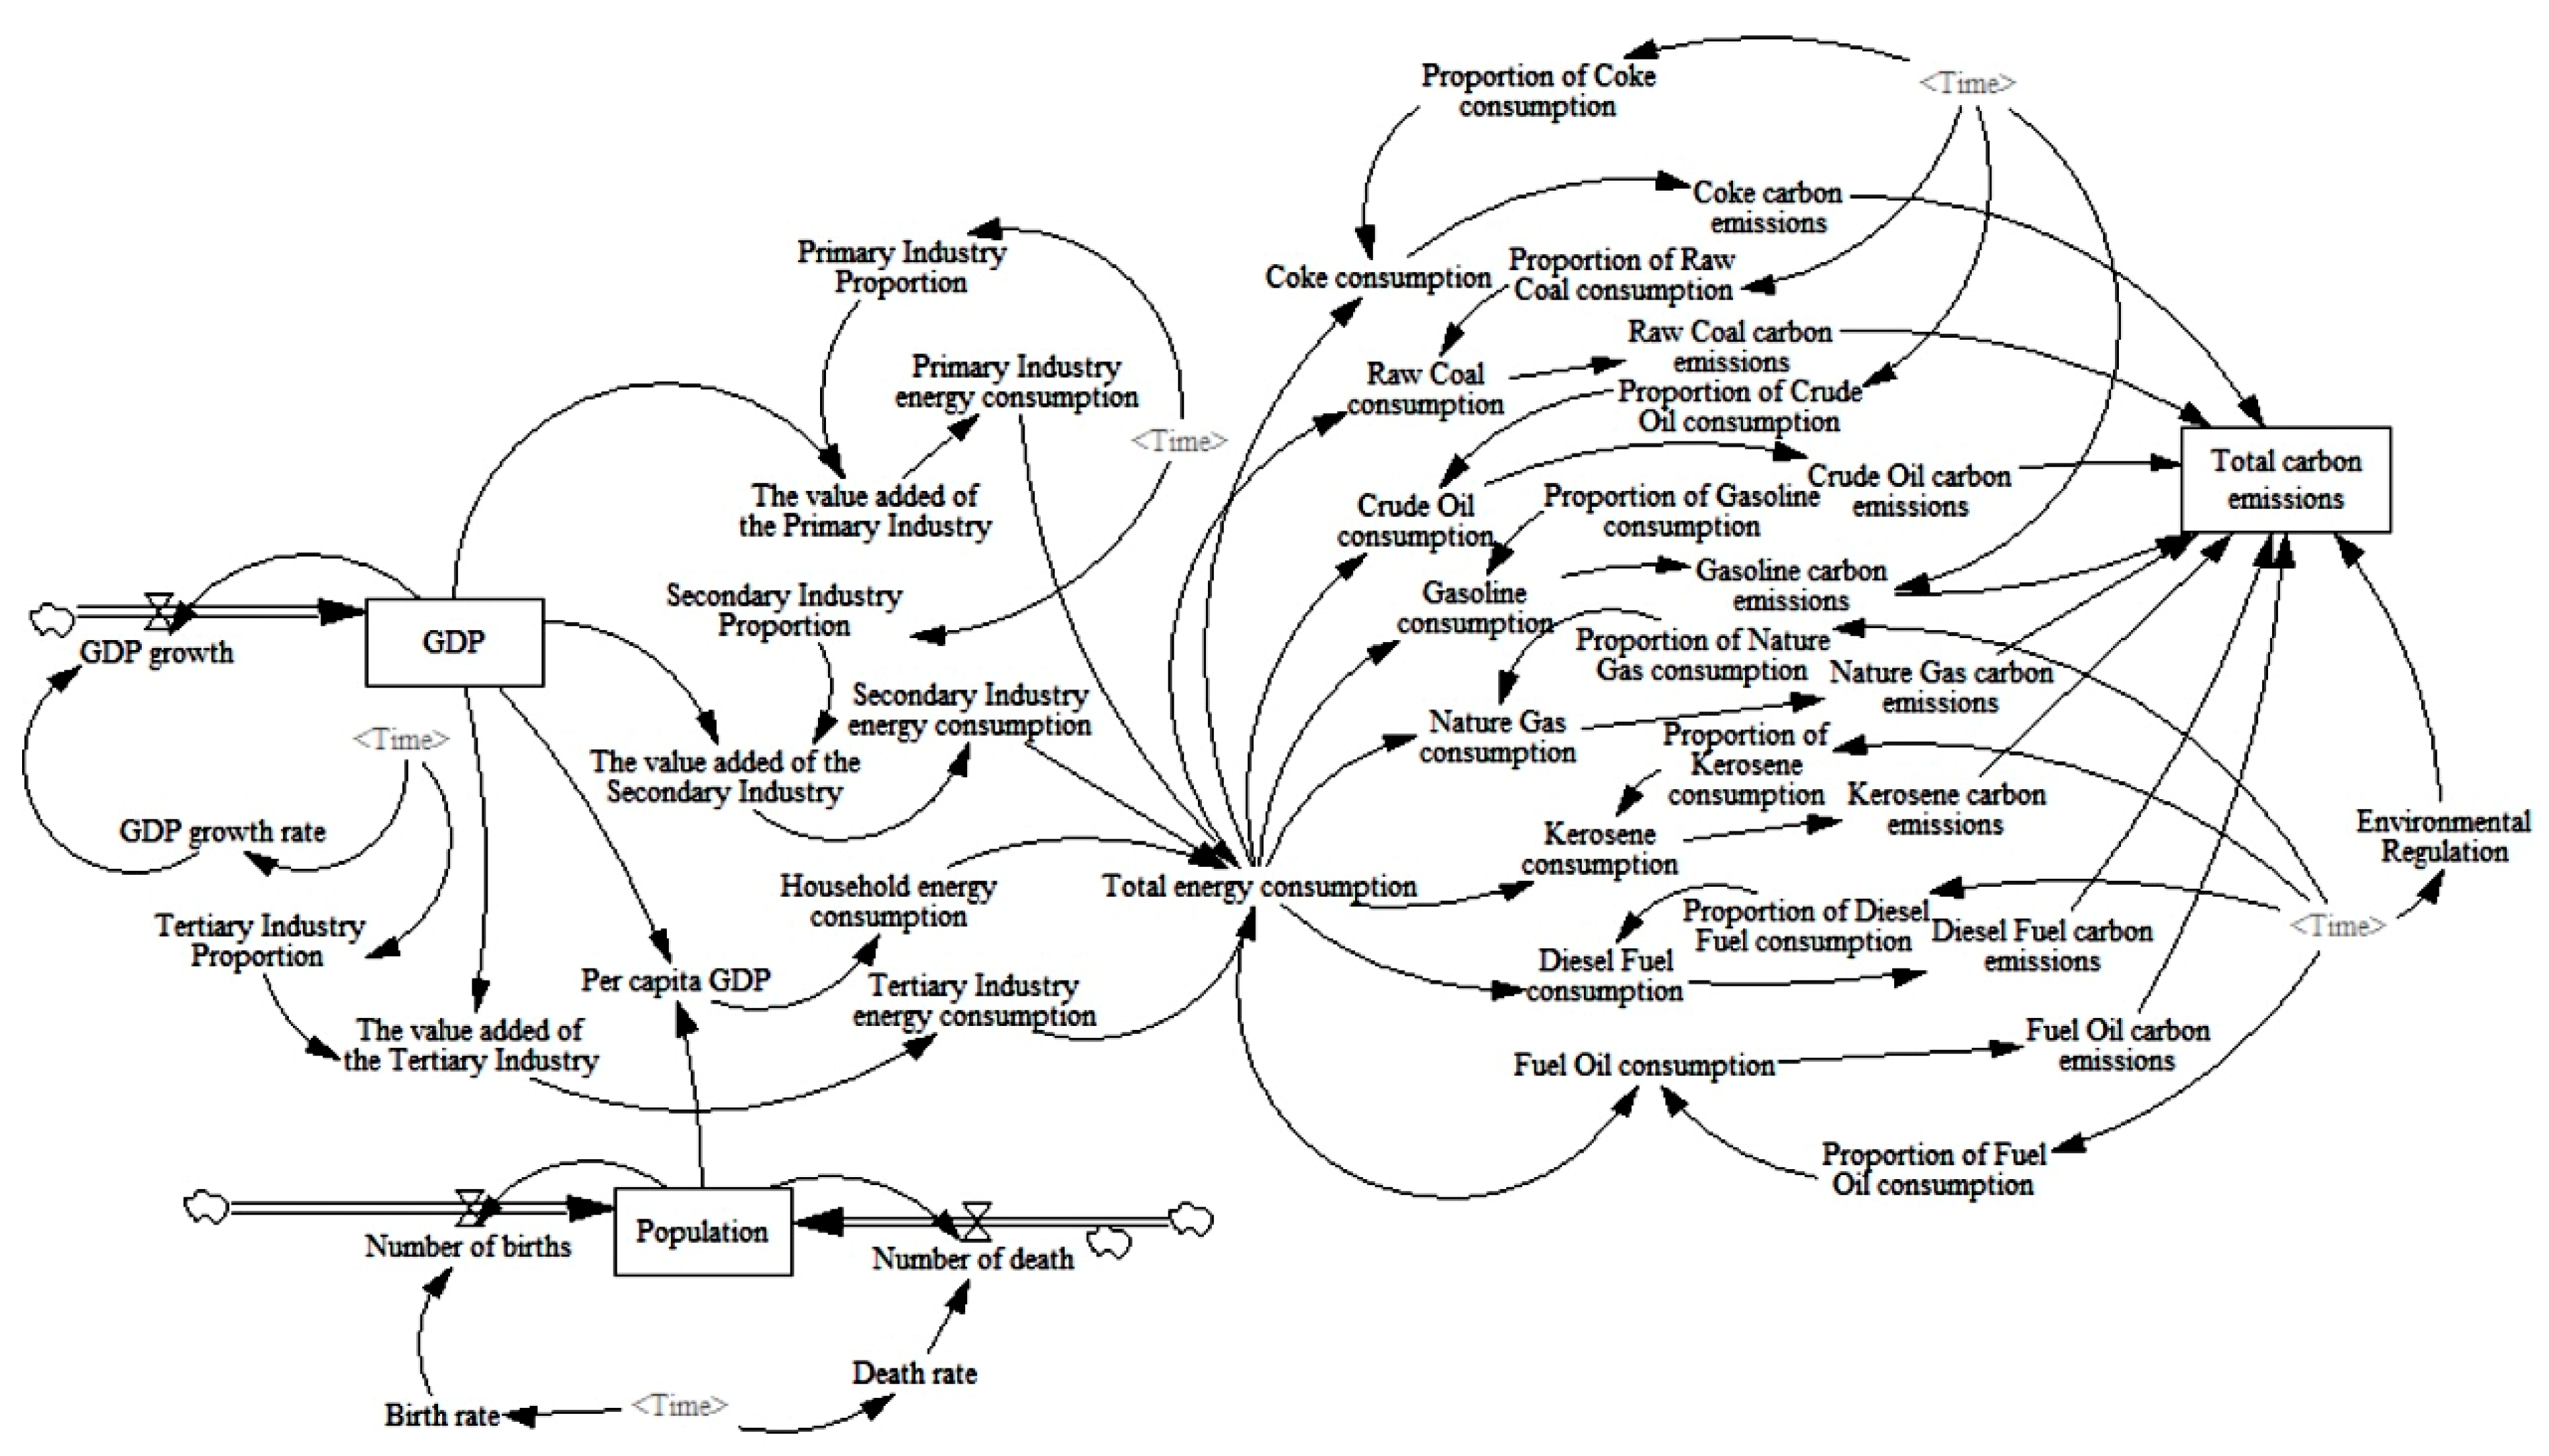
4.1. Construction of a System Dynamics Model
- (1)
- Economic Subsystem
- (2)
- Population Subsystem
- (3)
- Energy Subsystem
- (4)
- Environment Subsystem
4.2. System Parameterization and Data Sources
- (1)
- Table Function Method: For variables that undergo non-linear changes, table functions provide a more precise description of parameter variations. Examples include the proportion of tertiary industries and the configuration of environmental regulation variables.
- (2)
- Literature Reference Method: The carbon emission coefficients for various energy sources are determined by consulting pertinent literature and referencing the China Energy Statistical Yearbook.
4.3. Evaluating Key Influcing Factors Based on Sensitivity Analysis
4.4. Validity Testing
4.5. Scenario Setting and Scenario Analysis
4.5.1. Scenario Setting and Parameter Setting
- 1.
- Proportion of the Tertiary Industry in GDP
- 2.
- Energy Structure
- 3.
- Environmental Regulation
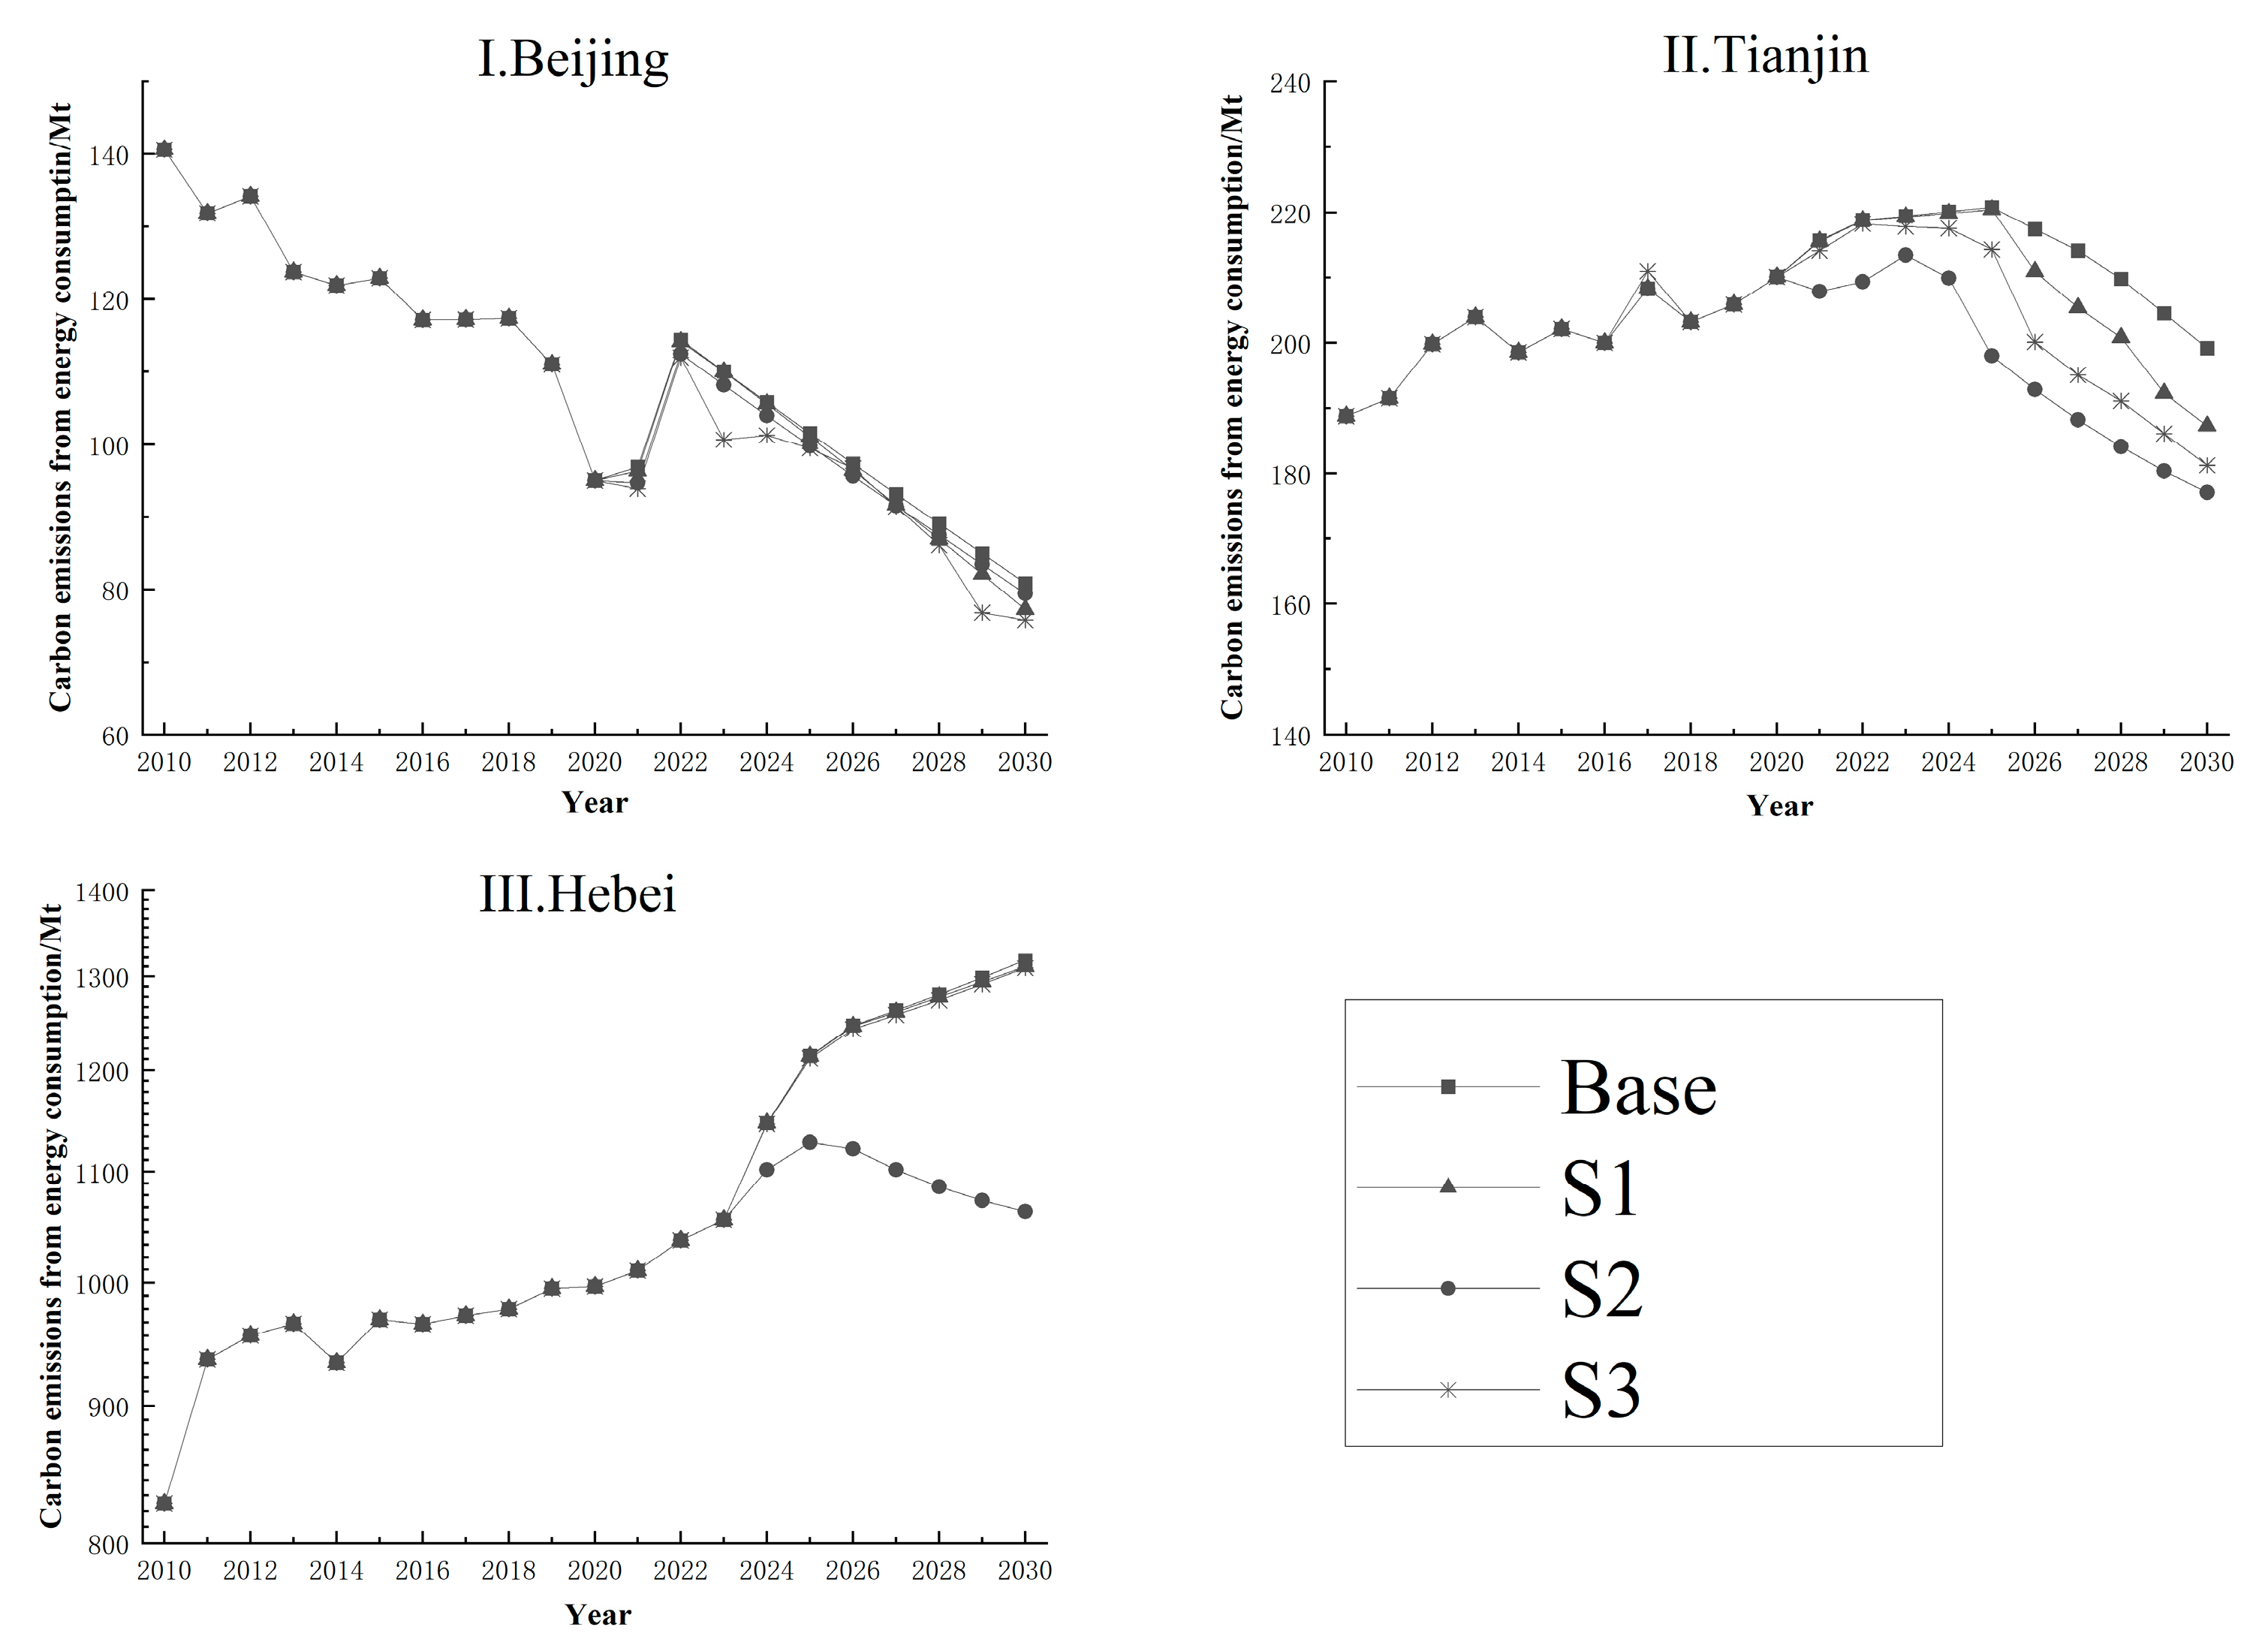
4.5.2. Forecast Results and Analysis
- 1.
- Baseline Scenario
- 2.
- Industrial Structure Optimization Scenario
- 3.
- Energy Structure Optimization Scenario
- 4.
- Environmental Protection Scenario
- 5.
- Coordinated Development Scenario
5. Optimization Path and Response Strategy for Carbon Emission Reduction in the BTH Region
5.1. Path Selection
5.2. Countermeasures for Implementation
6. Discussion
6.1. Uncertainty Analysis
6.2. Limitation
Author Contributions
Funding
Institutional Review Board Statement
Informed Consent Statement
Data Availability Statement
Conflicts of Interest
References
- Wang, H.; Lu, X.; Deng, Y.; Sun, Y.; Nielsen, C.P.; Liu, Y.; Zhu, G.; Bu, M.; Bi, J.; Mcelroy, M.B. China’s CO2 peak before 2030 implied from characteristics and growth of cities. Nat. Sustain. 2019, 2, 748–754. [Google Scholar] [CrossRef]
- Peng, S.; Tan, J.; Ma, H. Carbon emission prediction of construction industry in Sichuan Province based on the GA-BP model. Environ. Sci. Pollut. Res. 2024, 31, 24567–24583. [Google Scholar] [CrossRef] [PubMed]
- Feng, Y.Y.; Chen, S.Q.; Zhang, L.X. System dynamics modeling for urban energy consumption and CO2 emissions: A case study of Beijing, China. Ecol. Modell. 2013, 252, 44–52. [Google Scholar] [CrossRef]
- Robalino-López, A.; Mena-Nieto, A.; García-Ramos, J.E. System dynamics modeling for renewable energy and CO2 emissions: A case study of Ecuador. Energy Sustain. Dev. 2014, 20, 11–20. [Google Scholar] [CrossRef]
- de O. Fontes, C.H.; Freires, F.G.M. Sustainable and renewable energy supply chain: A system dynamics overview. Renew. Sustain. Energy Rev. 2018, 82, 247–259. [Google Scholar] [CrossRef]
- Ye, A.; Li, X.; Deng, Y.; Li, G. Research on China’s Carbon Peak Prediction and Emission Reduction Path under the “DualCarbon” Goal. Sci. Technol. Ind. 2023, 23, 34–43. [Google Scholar]
- Zhang, P.Y.; He, J.J.; Hong, X.; Zhang, W.; Qin, C.Z.; Pang, B.; Li, Y.Y.; Liu, Y. Regional-Level Carbon Emissions Modelling and Scenario Analysis: A STIRPAT Case Study in Henan Province, China. Sustainability 2017, 9, 2342. [Google Scholar] [CrossRef]
- Niu, H.; Chen, S.; Xiao, D. Multi-Scenario land cover changes and carbon emissions prediction for peak carbon emissions in the Yellow River Basin, China. Ecol. Indic. 2024, 168, 112794. [Google Scholar] [CrossRef]
- Wang, Y.; Dong, L. Research on Carbon Peak Prediction of Various Prefecture-Level Cities in Jiangsu Province Based on Factors Influencing Carbon Emissions. Sustainability 2024, 16, 7105. [Google Scholar] [CrossRef]
- Grossman, G.; Krueger, A. Environmental Impacts of a North American Free Trade Agreement; National Bureau of Economic Research, Inc.: Cambridge, MA, USA, 1991. [Google Scholar]
- De Bruyn, S.M. Explaining the environmental Kuznets curve: Structural change and international agreements in reducing sulphur emissions. Environ. Dev. Econ. 1997, 2, 485–503. [Google Scholar] [CrossRef]
- Shrestha, R.M.; Timilsina, G.R. Factors affecting CO2 intensities of power sector in Asia: A Divisia decomposition analysis. Energy Econ. 1996, 18, 283–293. [Google Scholar] [CrossRef]
- Wu, L.; Kaneko, S.; Matsuoka, S. Driving forces behind the stagnancy of China’s energy-related CO2 emissions from 1996 to 1999: The relative importance of structural change, intensity change and scale change. Energy Policy 2005, 33, 319–335. [Google Scholar] [CrossRef]
- Zhang, X.; Wu, L.; Zhang, R.; Deng, S.; Zhang, Y.; Wu, J.; Li, Y.; Lin, L.; Li, L.; Wang, Y.; et al. Evaluating the relationships among economic growth, energy consumption, air emissions and air environmental protection investment in China. Renew. Sustain. Energy Rev. 2013, 18, 259–270. [Google Scholar] [CrossRef]
- Cai, Y.; Sam, C.Y.; Chang, T. Nexus between clean energy consumption, economic growth and CO2 emissions. J. Clean. Prod. 2018, 182, 1001–1011. [Google Scholar] [CrossRef]
- Wang, Q.; Zhang, F. Does increasing investment in research and development promote economic growth decoupling from carbon emission growth? An empirical analysis of BRICS countries. J. Clean. Prod. 2020, 252, 119853. [Google Scholar] [CrossRef]
- Pan, X.; Wang, M.; Li, M. Low-carbon policy and industrial structure upgrading: Based on the perspective of strategic interaction among local governments. Energy Policy 2023, 183, 113794. [Google Scholar] [CrossRef]
- You, J.; Zhang, W. How heterogeneous technological progress promotes industrial structure upgrading and industrial carbon efficiency? Evidence from China’s industries. Energy 2022, 247, 123386. [Google Scholar] [CrossRef]
- Pan, X.; Guo, S.; Xu, H.; Tian, M.; Pan, X.; Chu, J. China’s carbon intensity factor decomposition and carbon emission decoupling analysis. Energy 2022, 239, 122175. [Google Scholar] [CrossRef]
- Liu, W.; Li, H. Improving energy consumption structure: A comprehensive assessment of fossil energy subsidies reform in China. Energy Policy 2011, 39, 4134–4143. [Google Scholar] [CrossRef]
- Fan, G.; Zhu, A.; Xu, H. Analysis of the Impact of Industrial Structure Upgrading and Energy Structure Optimization on Carbon Emission Reduction. Sustainability 2023, 15, 3489. [Google Scholar] [CrossRef]
- Wang, J.; Ju, Y.; Fujikawa, K. Climate Policies in China: Renewable Energy Introduction and National Emissions Trading Scheme. In Empirical Research on Environmental Policies in China: China Towards Decarbonization and Recycle Economy; Fujikawa, K., Ed.; Springer Nature Singapore: Singapore, 2023; pp. 3–18. [Google Scholar]
- Shafiei, S.; Salim, R.A. Non-renewable and renewable energy consumption and CO2 emissions in OECD countries: A comparative analysis. Energy Policy 2014, 66, 547–556. [Google Scholar] [CrossRef]
- Chontanawat, J. Driving Forces of Energy-Related CO2 Emissions Based on Expanded IPAT Decomposition Analysis: Evidence from ASEAN and Four Selected Countries. Energies 2019, 12, 764. [Google Scholar] [CrossRef]
- Wang, Z.-B.; Li, J.-X.; Liang, L.-W. Spatio-temporal evolution of ozone pollution and its influencing factors in the Beijing-Tianjin-Hebei Urban Agglomeration. Environ. Pollut. 2020, 256, 113419. [Google Scholar] [CrossRef]
- Zhou, T.T.; Luo, X.; Liu, X.J.; Zhai, X.X.; Sun, Y.K.; Liu, G.C.; Liu, J.H.; Gao, Y.R.; Dang, D.F.; Li, N. The green and low-carbon development pathways in the urban and rural building sector in Shaanxi Province, China. Energy Build. 2024, 306, 113952. [Google Scholar] [CrossRef]
- Qin, X.H.; Xu, X.Y.; Yang, Q.K. Carbon peak prediction and emission reduction pathways of China’s low-carbon pilot cities: A case study of Wuxi city in Jiangsu province. J. Clean. Prod. 2024, 447, 141385. [Google Scholar] [CrossRef]
- Jian, K.R.; Shi, R.Y.; Zhang, Y.X.; Liao, Z.G. Research on Carbon Emission Characteristics and Differentiated Carbon Reduction Pathways in the Yangtze River Delta Region Based on the STIRPAT Model. Sustainability 2023, 15, 15659. [Google Scholar] [CrossRef]
- Mu, J.Y.; Wang, J.M.; Liu, B.; Yang, M. Spatiotemporal dynamics and influencing factors of CO2 emissions under regional collaboration: Evidence from the Beijing-Tianjin-Hebei region in China. Environ. Pollut. 2024, 357, 124403. [Google Scholar] [CrossRef]
- Zeng, Y.; Zhang, W.G.; Sun, J.W.; Sun, L.A.; Wu, J. Research on Regional Carbon Emission Reduction in the Beijing–Tianjin–Hebei Urban Agglomeration Based on System Dynamics: Key Factors and Policy Analysis. Energies 2023, 16, 6654. [Google Scholar] [CrossRef]
- Zhao, A.; Song, X.; Li, J.; Yuan, Q.; Pei, Y.; Li, R.; Hitch, M. Effects of Carbon Tax on Urban Carbon Emission Reduction: Evidence in China Environmental Governance. Int. J. Environ. Res. Public Health 2023, 20, 2289. [Google Scholar] [CrossRef] [PubMed]
- 2006 IPCC Guidelines for National Greenhouse Gas Inventories. Available online: https://www.ipcc-nggip.iges.or.jp/public/2006gl/chinese/index.html (accessed on 10 January 2025).
- Gu, R.D.; Li, C.F.; Li, D.D.; Yang, Y.Y.; Gu, S. The Impact of Rationalization and Upgrading of Industrial Structure on Carbon Emissions in the Beijing-Tianjin-Hebei Urban Agglomeration. Int. J. Environ. Res. Public Health 2022, 19, 7997. [Google Scholar] [CrossRef] [PubMed]
- Yin, J.; Ibrahim, S.; Mohd, N.N.A.; Zhong, C.; Mao, X. Can green finance and environmental regulations promote carbon emission reduction? Evidence from China. Environ. Sci. Pollut. Res. 2024, 31, 2836–2850. [Google Scholar] [CrossRef]
- Yang, H.H.; Li, X.; Ma, L.W.; Li, Z. Using system dynamics to analyse key factors influencing China’s energy-related CO2 emissions and emission reduction scenarios. J. Clean. Prod. 2021, 320, 128811. [Google Scholar] [CrossRef]
- Li, G.; Chen, X.; You, X.-Y. System dynamics prediction and development path optimization of regional carbon emissions: A case study of Tianjin. Renew. Sustain. Energy Rev. 2023, 184, 113579. [Google Scholar] [CrossRef]
- Gao, Z.; Xia, E.; Lin, S.; Xu, J.; Tao, C.; Yu, C. Carbon emission efficiency and regional synergistic peaking strategies in Beijing-Tianjin-Hebei region. Carbon Neutrality 2024, 3, 19. [Google Scholar] [CrossRef]
- Li, Z.; Fu, J.; Lin, G.; Jiang, D.; Liu, K.; Wang, Y. Multi-Scenario Analysis of Energy Consumption and Carbon Emissions: The Case of Hebei Province in China. Energies 2019, 12, 624. [Google Scholar] [CrossRef]


| Type of Energy | Standard Coal Factor | Carbon Emission Factor |
|---|---|---|
| Raw Coal | 0.7143 | 0.7559 |
| Coke | 0.9714 | 0.8550 |
| Crude Oil | 1.4286 | 0.5857 |
| Nature Gas | 1.3300 | 0.4483 |
| Fuel Oil | 1.4286 | 0.6185 |
| Gasoline | 1.4714 | 0.5538 |
| Kerosene | 1.4714 | 0.5714 |
| Diesel Fuel | 1.4571 | 0.5921 |
| Key Variables | Main Parameter Setting of Beijing |
|---|---|
| Total GDP | INTEG (Change in GDP, 14,964)/CNY 100 million |
| Total population | INTEG (births—deaths, 1961.9)/10,000 persons |
| Birth rate | With Look Up ((2010, 0)–(2024, 0.01), (2010, 0.0073), (2011, 0.0083), (2012, 0.0090), (2013, 0.0089), (2014, 0.0097), (2015, 0.0079), (2016, 0.0092), (2017, 0.0089), (2018, 0.0081), (2019, 0.0079), (2020, 0.0069), (2021, 0.0064), (2022, 0.0057), (2023, 0.0047), (2025, 0.0045), (2030, 0.0043), (2040, 0.0040)) |
| Death rate | With Look Up ((2010, 0)–(2024, 0.01), (2010, 0.0043), (2011, 0.0043), (2012, 0.0045), (2013, 0.0049), (2014, 0.0049), (2015, 0.0052), (2016, 00052), (2017, 0.0052), (2018, 0.0055), (2019, 0.0054), (2020, 0.0046), (2021, 0.0054), (2022, 0.0057), (2023, 0.0070), (2025, 0.0072), (2030, 0.0074), (2040, 0.0075)) |
| Primary industry output | Share of primary sector × GDP/CNY 100 million |
| Secondary sector output | Share of secondary sector × GDP/CNY 100 million |
| Tertiary output | Share of tertiary sector × GDP/CNY 100 million |
| Primary energy consumption | EXP function based on primary industry output |
| Secondary energy consumption | EXP function based on secondary industry output |
| Tertiary energy consumption | EXP function based on tertiary sector output |
| Domestic energy consumption | EXP function based on GDP per capita |
| Total energy consumption | Sum of all energy consumption categories |
| Key Variables | Main Parameter Setting of Tianjin |
| Total GDP | INTEG (Change in GDP, 6830.76)/CNY 100 million |
| Total population | INTEG (births—deaths, 1299.29)/10,000 persons |
| Birth rate | With Look Up ((2010, 0)–(2024, 0.01), (2010, 0.0089), (2011, 0.0097), (2012, 0.0079), (2013, 0.0093), (2014, 0.0091), (2015, 0.0082), (2016, 0.0081), (2017, 0.0076), (2018, 0.0067), (2019, 0.0067), (2020, 0.0060), (2021, 0.0052), (2022, 0.0048), (2023, 0.0047), (2025, 0.0045), (2030, 0.0043), (2040, 0.0040)) |
| Death rate | With Look Up ((2010, 0)–(2024, 0.01), (2010, 0.0049), (2011, 0.0049), (2012, 0.0049), (2013, 0.0052), (2014, 0.0053), (2015, 0.0056), (2016, 0.0055), (2017, 0.0046), (2018, 0.0054), (2019, 0.0053), (2020, 0.0059), (2021, 0.0062), (2022, 0.0064), (2023, 0.0070), (2025, 0.0072), (2030, 0.0074), (2040, 0.0075)) |
| Primary industry output | Share of primary sector × GDP/CNY 100 million |
| Secondary sector output | Share of secondary sector × GDP/CNY 100 million |
| Tertiary output | Share of tertiary sector × GDP/CNY 100 million |
| Primary energy consumption | EXP function based on primary industry output |
| Secondary energy consumption | EXP function based on secondary industry output |
| Tertiary energy consumption | EXP function based on tertiary sector output |
| Domestic energy consumption | EXP function based on GDP per capita |
| Total energy consumption | Sum of all energy consumption categories |
| Key Variables | Main Parameter Setting of Hebei |
| Total GDP | INTEG (Change in GDP, 18,003.6)/ CNY 100 million |
| Total population | INTEG (births—deaths, 1961.9)/10,000 persons |
| Birth rate | With Look Up ((2010, −0.0005)–(2024, 0.02), (2010, 0.0132), (2011, 0.0130), (2012, 0.0128), (2013, 0.0130), (2014, 0.0132), (2015, 0.0114), (2016, 00114), (2017, 0.0124), (2018, 0.0112), (2019, 0.0108), (2020, 0.0104), (2021, 0.0102), (2022, 0.0098), (2023, 0.0091), (2025, 0.0080), (2030, 0.0075), (2040, 0.0070)) |
| Death rate | With Look Up ((2010, 0.005)–(2024, 0.01), (2010, 0.0064), (2011, 0.0062), (2012, 0.0064), (2013, 0.0069), (2014, 0.0062), (2015, 0.0058), (2016, 00064), (2017, 0.0066), (2018, 0.0064), (2019, 0.0061), (2020, 0.0072), (2021, 0.0076), (2022, 0.0078), (2023, 0.0079), (2025, 0.0080), (2030, 0.0084), (2040, 0.0093)) |
| Primary industry output | Share of primary sector × GDP/CNY 100 million |
| Secondary sector output | Share of secondary sector × GDP/CNY 100 million |
| Tertiary output | Share of tertiary sector × GDP/CNY 100 million |
| Primary energy consumption | EXP function based on primary industry output |
| Secondary energy consumption | EXP function based on secondary industry output |
| Tertiary energy consumption | EXP function based on tertiary sector output |
| Domestic energy consumption | EXP function based on GDP per capita |
| Total energy consumption | Sum of all energy consumption categories |
| Scenario | Description |
|---|---|
| Base | - |
| S1 | Environmental regulation + 10% |
| S2 | Proportion of tertiary industry + 10% |
| S3 | Proportion of energy structure + 10% |
| Year | GDP | Carbon Emissions from Energy Consumption | ||||
|---|---|---|---|---|---|---|
| True Value /CNY 1 Billion | Simulated Value /CNY 1 Billion | Relative Error/% | True Value/Mt | Simulated Value/Mt | Relative Error/% | |
| 2010 | 1496.4 | 1496.4 | 0 | 142.33 | 140.64 | −1.2 |
| 2011 | 1718.9 | 1701.4 | −1.0 | 132.46 | 131.89 | −0.4 |
| 2012 | 1902.5 | 1920.8 | 1.1 | 134.49 | 134.24 | −0.2 |
| 2013 | 2113.5 | 2105.2 | 0.3 | 122.07 | 123.75 | 1.4 |
| 2014 | 2292.6 | 2313.7 | 0.9 | 126.18 | 121.93 | −0.03 |
| 2015 | 2477.9 | 2494.1 | 0.6 | 122.12 | 122.95 | 0.6 |
| 2016 | 2704.1 | 2681.2 | −0.8 | 115.43 | 117.14 | 1.5 |
| 2017 | 2988.3 | 2905.6 | −2.8 | 113.17 | 117.19 | 3.4 |
| 2018 | 3310.6 | 3182.0 | −4.0 | 116.25 | 117.39 | 0.9 |
| 2019 | 3544.5 | 3490.6 | −1.5 | 115.36 | 111.02 | −3.9 |
| 2020 | 3594.3 | 3720.6 | 3.4 | 98.31 | 98.61 | 0.3 |
| Year | GDP | Carbon Emissions from Energy Consumption | ||||
|---|---|---|---|---|---|---|
| True Value /CNY 1 Billion | Simulated Value /CNY 1 Billion | Relative Error/% | True Value/Mt | Simulated Value/Mt | Relative Error/% | |
| 2010 | 683.1 | 683.1 | 0 | 190.45 | 188.76 | −0.9 |
| 2011 | 811.2 | 795.1 | −2.0 | 208.94 | 191.53 | −9.09 |
| 2012 | 9.4.3 | 919.9 | 1.7 | 210.68 | 199.83 | −5.4 |
| 2013 | 994.5 | 1013.7 | 1.9 | 216.98 | 203.96 | −6.3 |
| 2014 | 1064.0 | 1106.0 | 3.7 | 209.44 | 198.56 | −5.4 |
| 2015 | 1087.9 | 1177.9 | 7.6 | 206.40 | 202.15 | −2.1 |
| 2016 | 1147.7 | 1203.8 | 4.7 | 195.00 | 200.01 | 2.5 |
| 2017 | 1245.0 | 1266.5 | 1.7 | 193.09 | 208.33 | 7.3 |
| 2018 | 1336.2 | 1365.5 | 2.1 | 200.19 | 203.17 | 1.5 |
| 2019 | 1405.5 | 1458.4 | 3.6 | 201.76 | 205.85 | 1.9 |
| 2020 | 1500.7 | 1529.9 | 1.9 | 193.92 | 207.63 | 6.6 |
| Year | GDP | Carbon Emissions from Energy Consumption | ||||
|---|---|---|---|---|---|---|
| True Value /CNY 1 Billion | Simulated Value /CNY 1 Billion | Relative Error/% | True Value/Mt | Simulated Value/Mt | Relative Error/% | |
| 2010 | 1800.4 | 1800.4 | 0 | 846.41 | 827.62 | −2.3 |
| 2011 | 2138.4 | 2068.1 | −3.4 | 957.21 | 936.42 | −2.2 |
| 2012 | 2307.7 | 2395.0 | 3.6 | 970.58 | 956.01 | −1.5 |
| 2013 | 2425.9 | 2570.8 | 5.6 | 971.64 | 965.71 | −0.6 |
| 2014 | 2520.8 | 2696.0 | 6.5 | 924.02 | 933.72 | 1.0 |
| 2015 | 2639.8 | 2797.4 | 5.6 | 964.78 | 969.09 | 0.4 |
| 2016 | 2847.4 | 2923.6 | 2.6 | 966.38 | 965.38 | −0.1 |
| 2017 | 3064.0 | 3136.7 | 2.3 | 960.71 | 972.48 | 1.2 |
| 2018 | 3249.4 | 3358.4 | 3.2 | 985.13 | 977.85 | −0.7 |
| 2019 | 3497.8 | 3549.9 | 1.5 | 986.36 | 994.92 | 0.8 |
| 2020 | 3601.3 | 3801.9 | 5.3 | 973.98 | 996.65 | 2.3 |
| Scenario | Tertiary Sector Share | Energy Structure | Environmental Regulation |
|---|---|---|---|
| Baseline (A1) | Center | Center | Center |
| Industrial Structure Optimization (A2) | High | Center | Center |
| Energy Mix Optimization (A3) | Center | Low | Center |
| Environmental Protection (A4) | Center | Center | High |
| Coordinated Development (A5) | High | Low | High |
| Scenario | Tertiary Sector Share Rate of Change | Energy Mix Rate of Change | Environmental Regulation |
|---|---|---|---|
| Baseline (A1) | 0/0.2/0.5 | −4.0/−4.5/1.5 | 0.040/0.075/0.150 |
| Industrial Structure Optimization (A2) | 1.2/1.2/1.5 | −4.0/−4.5/1.5 | 0.040/0.075/0.150 |
| Energy Mix Optimization (A3) | 0/0.2/0.5 | −6.0/5.0/4.3 | 0.040/0.075/0.150 |
| Environmental Protection (A4) | 1.2/1.2/1.5 | −4.0/−4.5/1.5 | 0.050/0.100/0.200 |
| Coordinated Development (A5) | 1.2/1.2/1.5 | −6.0/5.0/4.3 | 0.050/0.100/0.200 |
Disclaimer/Publisher’s Note: The statements, opinions and data contained in all publications are solely those of the individual author(s) and contributor(s) and not of MDPI and/or the editor(s). MDPI and/or the editor(s) disclaim responsibility for any injury to people or property resulting from any ideas, methods, instructions or products referred to in the content. |
© 2025 by the authors. Licensee MDPI, Basel, Switzerland. This article is an open access article distributed under the terms and conditions of the Creative Commons Attribution (CC BY) license (https://creativecommons.org/licenses/by/4.0/).
Share and Cite
Zhu, X.; Che, J.; Niu, X.; Cao, N.; Zhang, G. Optimization of Carbon Emission Reduction Path in the Beijing–Tianjin–Hebei Region Based on System Dynamics. Sustainability 2025, 17, 1364. https://doi.org/10.3390/su17041364
Zhu X, Che J, Niu X, Cao N, Zhang G. Optimization of Carbon Emission Reduction Path in the Beijing–Tianjin–Hebei Region Based on System Dynamics. Sustainability. 2025; 17(4):1364. https://doi.org/10.3390/su17041364
Chicago/Turabian StyleZhu, Xuelian, Jianan Che, Xiaogeng Niu, Nannan Cao, and Guofeng Zhang. 2025. "Optimization of Carbon Emission Reduction Path in the Beijing–Tianjin–Hebei Region Based on System Dynamics" Sustainability 17, no. 4: 1364. https://doi.org/10.3390/su17041364
APA StyleZhu, X., Che, J., Niu, X., Cao, N., & Zhang, G. (2025). Optimization of Carbon Emission Reduction Path in the Beijing–Tianjin–Hebei Region Based on System Dynamics. Sustainability, 17(4), 1364. https://doi.org/10.3390/su17041364