Article

Integrating Expert Assessments and Spectral Methods to Evaluate Visual Attractiveness and Ecosystem Services of Urban Informal Green Spaces in the Context of Climate Adaptation

1
Faculty of Science and Health, John Paul II Catholic University of Lublin, 20-950 Lublin, Poland
2
Faculty of Mining Surveying and Environmental Engineering, AGH University of Krakow, 30-059 Krakow, Poland
3
Department of Soil Science and Environmental Analyses, Institute of Soil Science and Plant Cultivation—State Research Institute (IUNG), 24-100 Puławy, Poland
*
Author to whom correspondence should be addressed.
Sustainability 2025, 17(4), 1349; https://doi.org/10.3390/su17041349
Submission received: 26 November 2024 / Revised: 24 January 2025 / Accepted: 5 February 2025 / Published: 7 February 2025

Abstract

:
This study aimed to develop criteria for the expert assessment of the visual attractiveness of informal urban green spaces and compare these results with indicators derived from spectral indices and geospatial data. The research was conducted in Lublin, Poland, a medium-sized European city. The expert assessment evaluated the overall attractiveness, naturalness, landscape contrast, and uniqueness. The results were juxtaposed with spectral indices, such as the Normalized Difference Vegetation Index (NDVI), Leaf Area Index (LAI), and land surface temperature, which were calculated for the target areas and a 300 m buffer surrounding them. The analyses revealed strong correlations between the expert ratings and spectral indices. For example, overall attractiveness was linked to lower temperatures, while landscape contrast exhibited a relationship with temperature differentials. Moreover, areas with greater landscape contrast showed larger index differences between the site and the buffer. Positive correlations were also observed between attractiveness and land slope. Importantly, the spectral indices highlighted the ecological value of some sites that received lower expert assessments, such as areas dominated by shrubs and bushes. This research introduces the concept of ‘enchanted natural places’ (ENPs) as a framework for identifying and formalizing the protection of visually and ecologically valuable, informal green spaces. The integration of expert evaluations with spectral data provides a novel, robust methodology for assessing urban green spaces, bridging subjective perceptions and objective environmental indicators. This approach underscores the importance of informal green spaces not only for aesthetic and ecological benefits but also for supporting biodiversity and mitigating urban heat islands, contributing to urban resilience in the face of climate change.

1. Introduction

Urban landscapes are facing increasing challenges, including climate change and intensive urbanization, necessitating innovative approaches to managing green spaces. Numerous researchers have explored the diverse functions and typologies of urban greenery. For example, green spaces are often defined as multifunctional areas that support ecological, social, and cultural services [1], while others propose a typology that categorizes them based on ecosystem services and spatial attributes [2]. Among these, informal, semi-natural, and wild areas have gained attention for their ecological and social significance.
Informal green spaces (IGSs), which include neglected, post-industrial, and spontaneously vegetated sites, provide unique ecological and social benefits. These areas have been described as “unintentional landscapes”—spaces that emerge without deliberate planning but exhibit aesthetic and ecological value [3]. Such landscapes challenge conventional perceptions of urban green spaces, offering opportunities to reimagine urban environments as dynamic and multifunctional. Moreover, the concept of a “wasteland aesthetic” highlights an increasing acceptance and appreciation for these areas [3].
The diversity and significance of IGSs have been explored in academic discourse, including discussions on their role in reshaping urban spaces [3]. Other studies examined the importance of ruins and abandoned sites [4] and highlighted different approaches to designing urban nature, ranging from engineering and artistic interpretations to ecological conservation [5]. These perspectives underscore the complexity of integrating wildness into urban environments, with some analyses focusing on the cultural and political implications of wildness metaphors [6].
The concept of IGSs has been formalized and defined as urban spaces with anthropogenic disturbances that support spontaneous vegetation [7,8]. These spaces are distinct from formal green spaces and areas with remnant vegetation. This aligns with the “four kinds of nature” theory, categorizing IGSs as novel urban ecosystems [9,10]. Others suggest extending the definition of IGSs to include remnant and protected areas, emphasizing their low degree of human interference [11].
Numerous studies have highlighted the ecological and climatic benefits of IGSs. For instance, IGSs have contributed to mitigating urban heat islands [12,13], analyses of the effect of riverside areas on temperature [14,15], and studies of small patches of vegetation that significantly reduce temperature [16]. IGSs also support ecosystem services and urban climate resilience [17]. The role of IGSs in providing nature-based solutions is emphasized in the research that integrates these areas into climate adaptation strategies [18,19]. Studies have also explored their contribution in reducing social inequalities, particularly for children and seniors [11]. These findings underscore the importance of incorporating IGSs into sustainable urban planning frameworks.
Beyond climate regulation, IGSs contribute to biodiversity enhancement [20], social equity [11], recreation [7], and education [10]. Their non-monetary values, including cultural and aesthetic significance, have also been emphasized [21,22]. Moreover, researchers have developed tools to measure the public perception of the visual quality of landscapes [23], further highlighting their multifunctionality. Integrating these spaces into urban landscapes offers nature-based solutions that address both ecological and social challenges.
Recent advancements in remote sensing technologies and the development of spectral indices have revolutionized the study of urban green spaces, offering objective tools to quantify vegetation health, spatial distribution, and their environmental impacts. The Normalized Difference Vegetation Index (NDVI) is widely recognized for its ability to monitor vegetation vigour and density, as demonstrated in studies such as [24], which revealed a significant correlation between NDVI values and urban cooling effects in Beijing. Studies like one in Adelaide [16] highlighted the localized cooling benefits provided by small vegetated patches, emphasizing their importance in urban planning. These indices provide critical insights into the multifunctionality of urban green spaces and their role in mitigating the urban heat island effect.
This study integrates two approaches to evaluate IGSs in Lublin: expert assessments of visual attractiveness and a spatial analysis using spectral and geospatial data. The research builds on established visual landscape frameworks [25,26,27] and incorporated beauty indicators developed in prior research [28]. The expert assessments were juxtaposed with spectral indices, such as the NDVI, LAI, and LST, derived from geospatial data. The delineation and assessment of IGSs were based on methods used in other studies that focused on the spatial and ecological quality of wild areas [29,30] and studies focused on the impact of IGSs on the thermal environment [13,14,15,31,32,33,34]. The study aimed to
  • Develop a framework for assessing and distinguishing the most visually attractive IGSs, termed enchanted natural places (ENPs, or uroczyska miejskie in Polish).
  • Explore the relationships between visual assessments and ecological attributes based on spectral and geospatial data.
These methods highlight the multifunctionality of IGSs, emphasizing their ecological, social, and cultural value. By integrating subjective expert evaluations with objective spectral data, this study presents a novel framework for assessing urban green spaces, contributing to sustainable urban planning and climate adaptation strategies.

2. Study Area and Data

2.1. Study Area

The study area was Lublin, a medium-sized Central European city, and the most populous in eastern Poland. The city occupies 147 km2, with a population of 321,324 inhabitants. The city is situated 163–238 m above sea level, within the Lublin Upland [35]. The Bystrzyca River and its three tributaries—the Czechówka, the Czerniejówka, and the Nędznica—and two periodic watercourses flow through the city. Two distinct parts of Lublin can be distinguished. The western part is characterized by a thick loess cover, intersected by numerous dry valleys and gorges, which creates a diverse landform. The majority of the residential areas, usually on hilltops, are located in this part. In the land depressions, there are green areas, as well as communication routes. The eastern part, on the other hand, is devoid of a loess cover and has less diversified, rolling terrain. In this part, industrial development and smaller clusters of residential development predominate. The highly diverse landform features and watercourses have an impact on remarkable flora and landscape diversity. Research on this topic was carried out beginning in 2016. A detailed field inventory was made between 2016 and 2018 in different seasons and weather conditions. Among all the urban green spaces (UGSs), the focus was placed on the ‘unmanaged informal green spaces’, as defined by [11]. These include IGSs [8], sites of remnant vegetation [36], and protected areas.

2.2. Geospatial and Remote Sensing Data

In this study, satellite imagery from the Operational Land Imager (OLI) sensor on the Landsat 8 satellite was used. The data were obtained from the Earth Explorer service of the USGS (U.S. Geological Survey) [37]. The image was recorded on 14 August 2018, 09:25 am, in 11 spectral channels from the visible and near-infrared (VNIR) and short-wave infrared (SWIR) (430–2290 nm) and thermal infrared (TIR) (1060–1251 nm) ranges. The spatial resolution of the image was 30 m and the radiometric resolution was 12 bits [38]. For the study, VNIR (channels 2, 3, 4, 5), SWIR (channels 6, 7), and channel 10 of the TIR range were used. A calibration procedure was carried out for the image: the Radiance values were transformed into Surface Reflectance values (VNIR and SWIR) and channel 10′s DN (Digital Number) row values were converted to the land surface temperature (LST) value on the day the image was taken (Figure 1 and Figure 2). For this purpose, the ATCOR module in Catalyst Professional (2022) software [39] was used. Cartographic data, orthophotos, and the Digital Elevation Model (DEM) were also utilized, which were acquired free of charge from the Polish Central Office of Geodesy and Cartography (www.geoportal.gov.pl). DEMs were acquired in the ARC/INFO ASCII GRID format, containing the height value of points in a regular 1-metre grid. The data were processed into an image and then the slope was calculated from it [40]. The slope was used for the assessment of the land surface topography. The Urban Atlas 2018 database (UA2018) and the Copernicus program were also used. The UA2018 database contains pan-European land cover and land use data for functional urban areas [41]. For the purpose of the analysis, the following categories were combined: construction sites; continuous urban fabric; discontinuous dense urban fabric; discontinuous low density urban fabric; discontinuous medium density urban fabric; discontinuous very low-density urban fabric; industrial, commercial, public, military, and private units; fast transit roads and associated land; other roads and associated land; isolated structures; and mineral extraction and dump sites. A table with the complete data for the detailed expert assessments and remote sensing data for each research site is provided in the Supplementary Materials.

3. Methodology

3.1. The Research Path

Based on cartographic analyses and available databases (geoportal.gov.pl), 91 unmanaged IGSs were identified that were expected to have visually attractive landscapes. The research was developed based on the methods used by different authors for geospatial analysis [27,30] and visual perceptions of landscapes [25,27,42]. The surrounding areas were also analysed. For this purpose, a buffer of 300 m was set for each area to serve as the zone with the strongest impact [11,13,16,33]. In addition, built-up areas within these buffers were distinguished based on the UA2018 database, including buildings, roads, and infrastructure. These areas are characterized by a poor presence of biologically active surfaces and are largely impermeable to rainwater. It was noted that each database provides slightly different results, as highlighted by [43]. To obtain results for the entire surroundings of each site, including those near or bordering Lublin, a 300-metre buffer around the administrative border of the city was added to the study area.

3.2. Expert Assessments

After a study of the literature and discussions amongst the authors, criteria for the expert assessments of the site’s landscapes were developed. No minimum size criterion was established for the surveyed area to ensure the inclusion of a diverse range of green areas and vegetation clusters within the urban context. The smallest area under investigation was 0.23 ha and the largest was 86.14 ha. The expert assessment was conducted in the field between 2016 and 2018 by three experts—a landscape architect, a geographer, and an ecologist—who were members of the authors’ team. The assessments were carried out across in different seasons and weather conditions. Some indicators were quantitative, using a 5–1 scale, similar to the methods used in [29,30]. The following categories were adopted for the expert assessments:
  • Landscape contrast, which is the visual contrast with the surrounding area [27,28,42]. This feature can increase the attractiveness of an enchanted natural place—for example, when spontaneous greenery in close proximity to buildings is encountered unexpectedly. The scores were given as follows: 5—very clear difference, contrast with anthropogenic elements (e.g., buildings, roads), and very clear differences in landforms; 4—clear difference with surrounding natural elements, (e.g., open area/wooded area) and clear contrast between landforms; 3—noticeable differences in land cover (for example, height of vegetation) and noticeable differences in landforms; 2—minor differences in nature of cover, such as different forest type, and no terrain differences; and 1—no apparent difference between the place and its surroundings;
  • Naturalness, which is the similarity of the growing vegetation to the potential vegetation [10,25,26,29,42] found in Lublin [44]. The scores were given as follows: 5—very similar vegetation to natural communities and are multi-layered forest communities; 4—tall vegetation, trees, and self-sown plants, many of which are species typical for the habitat; 3—mixed areas, shrubland, low trees, bushes, grassland vegetation, and meadows; 2—area covered mostly with grassland vegetation, extensively used, and rarely mown; and 1—intensively used area and has been mowed;
  • Uniqueness, which is the frequency of the occurrence of a given landscape type in the studied area [22,25,42]. This indicator was verified after the experts assessed all the sites. The scores were given as follows: 5—unique site (found once in the city); 4—very rare site (found 2–3 times); 3—rare site (found 4–6 times); 2—common site (7–10 times); and 1—very common site (occurring more than 10 times).
In addition, a quantitative indicator was added: usage ((5) none, (4) single path, (3) single road, (2) several paths, (1) dense path network). Descriptive indicators were also added: main type of landform (flat, slope, gorge, valley, valley bottom, escarpment, plateau, or hill), type of landscape composition (enclosure, massif, exposed, or unclear) and for enclosures, the degree of view obstruction was also added (expressed in % of the enclosure) [25,45,46]; and main type of landcover (trees, shrubs, grass-herbaceous, or mixed). Features not assigned a scale and which only used +/− values were also added, following the guidance of [28]—rather than discussing beauty in general, these features were not broken down into understandable elements. These features were few human artefacts in sight [47]; interesting landforms [29]; presence of water [42]; diversity of plant forms; diversity of plant height [28,42]; presence of old trees [28]; screened-off, hidden place [27]; ‘visual access’ to the area from the outside [10]; and distant view from the site, which were added after the authors’ team discussion. The site names were also added, indicating the type of area and defining its uniqueness—for example, shrubs, thickets, an oxbow lake, etc. Based on the completed table (Table 1), the experts also provided a subjective final general evaluation on a scale of 1–5. The experts awarded a score based on the average of the naturalness, landscape contrast, and uniqueness scores; however, it could be 2 points lower or higher than the final assessment. For the overall assessment, the experts took into account other indicators. If a site was assigned a general assessment of 5, 4, or 3, it was referred to as an ENP—an enchanted natural place. For the purposes of this study, the definition of an ENP was a place within an urban area where the landscape is characterized by particularly attractive forms approximating naturalness, with minimal human interference, allowing for a sense of naturalness to be experienced and clearly distinguishable from the urban surroundings.
The following rating scale for the general expert assessment of the study sites was adopted:
5—an outstanding site, very attractive for a number of reasons and characteristics, with a high degree of naturalness—an enchanted natural place (ENP);
4—a very attractive, very rare, highly natural area with several important features—an ENP;
3—a valuable area that rarely or often occurs in the city, with high or medium naturalness; a typical ENP for the city;
2—a spontaneous green area and IGS, with some features of an enchanted natural place but does not qualify as a full ENP;
1—a semi-natural green area and IGS but has no features of an ENP.
The contents of the evaluation sheet are shown in Table 1. Examples of research sites with a description of the expert assessment ratings are shown in Table 2.

3.3. Spectral Indices

The spectral indices were calculated based on the Landsat image channels to determine the status and biological activity of the studied areas. The following spectral indices were adopted: the LST (land surface temperature) to assess temperature differences [13,14,16]; the NDVI (Normalized Difference Vegetation Index) to assess the biomass quantity, and plant health and vigour [13,31,48,49,50]; the NDMI (Normalized Difference Moisture Index) to assess the level of water stress in plants [15,32,47,50]; the LAI (Leaf Area Index) to determine the extent to which plants make use of light [33,34,49,51,52].
For each index, specific equations were used to calculate their values. The equations were as follows:
N D V I = N I R R E D N I R + R E D
N D M I = N I R S W I R N I R + S W I R
L A I = 3.618 E V I 0.118
where EVI refers to the Enhanced Vegetation Index.
The coefficients 3.618 and −0.118 were empirically derived in [51] based on regression analysis of multi-spectral airborne data. These values represent the proportional relationship between the EVI and LAI and include a baseline adjustment for improved accuracy. This formula is context-specific and was validated under the environmental and vegetation conditions analysed in this study.
E V I = 2.5     ( N I R R E D ) ( 1 + N I R + 6 + R E D ( 7.5     B L U E )
Specific bands from Landsat 8 satellite imagery were used to calculate the spectral indices. The bands utilized for each index were as follows:
N D V I   ( L 8 ) = B a n d 5 B a n d 4 B a n d 5 + B a n d 4
N D M I   ( L 8 ) = B a n d 5 B a n d 6 B a n d 5 + B a n d 6
where
E V I   ( L 8 ) = 2.5     ( B a n d 5 B a n d 4 ) ( 1 + B a n d 5 + 6 + B a n d 4 ( 7.5     B a n d 2 )
In the next step, the mean values of each spectral index (NDVI, NDMI, LAI, and LST) and the slope were calculated within the polygons representing the boundaries of the ENPs and the polygons forming buffers, excluding the ENPs. The resulting indices were then compared with the general expert assessment and the scores for landscape contrast, naturalness, and uniqueness.
It is important to emphasize that the Landsat data recorded on 14 August 2018 were specifically used for the calculation of the land surface temperature (LST). This date was selected because summer is the period when green areas or vegetation clusters reach their maximum biomass. During this time, vegetation is at its densest, exerting a substantial influence on temperature regulation in urban areas. Thus, the analysis was focused on the land surface temperature during the summer season to gain insights into the cooling effects of green areas in urban environments, aligning with the objectives of urban green infrastructure planning.
However, limited access to satellite image archives and variability in atmospheric conditions (such as cloud cover) constrained the selection process, and a single suitable image (14 August 2018) that met the quality criteria was chosen. Despite this limitation, it was deemed necessary to proceed with the analysis to draw conclusions regarding land surface temperature in green areas and their surroundings. Furthermore, it is crucial to note that the primary focus was placed on examining the relationships between visual assessments of green areas and the land surface temperature, as these are highly relevant to urban green infrastructure planning. Although temperature is not directly associated with visual features, it significantly influences thermal comfort and quality of life in urban environments. Therefore, the inclusion of temperature as an additional measure in this study was found to provide valuable insights into the impact of green areas on the urban environment. The collected data—the mean values of the spectral indices (NDVI, NDMI, LAI, and LST), the slope, and the percentage of built-up land—were then matched with the expert assessments (general expert assessment, landscape contrast, naturalness, and uniqueness) and a correlation analysis for the non-parametric data was performed using STATISTICA ver.13.3 software.

4. Results

A total of 91 sites were surveyed using expert methods. These sites cover a total area of 634.9 ha, which represents 4.3% of the city area. Each site was given general and detailed expert assessments. The number of sites in each general assessment field was fairly even. A total of 61 sites were rated as 5, 4, or 3 and were identified as ENPs (enchanted natural places) (Figure 3). The remaining 30 sites were categorized as ‘not ENP’. Only three sites received the highest naturalness rating. These sites also received the lowest landscape contrast scores. These were the most natural forest fragments, surrounded by woodland, with an arable character. No site received the lowest score of 1 for naturalness. In terms of total area, the highest general assessment sites occupied the most land. These groups also included the largest area. The number of sites that received each assessment is shown in Table 3. The dependencies between the expert assessments, spectral indices, and features shown by the digital data were noted. The relationships are presented in Table 4 and Figure 4, Figure 5, Figure 6, Figure 7, Figure 8 and Figure 9.
In summary, the highest scores for visual attractiveness for green spaces in Lublin were strongly correlated with lower temperatures and higher scored for the vegetation indices, such as the NDVI and LAI. Green areas with higher attractiveness were also less built-up, confirming that the availability of natural, undisturbed landscapes is a key factor in visual attractiveness and ecosystem value. These spaces, often perceived as ’wastelands’, play a significant role in cooling urban areas and enhancing thermal comfort for residents.
The locations of the surveyed sites are presented on Figure 1. The part of the city map containing the surveyed areas with their 300-metre buffers and the built-up land in the buffer is presented in Figure 2. Examples of the most visually attractive sites identified as ENPs are presented in Figure 3. A table with the complete data is provided in the Supplementary Materials.
The distribution of the expert ratings was mostly balanced (Table 3). However, due to the nature of the city, in the expert assessments of naturalness, the sites were rarely given the highest or lowest rating, and the lowest contrast rating was rarely given. These ratings were given to the same areas.

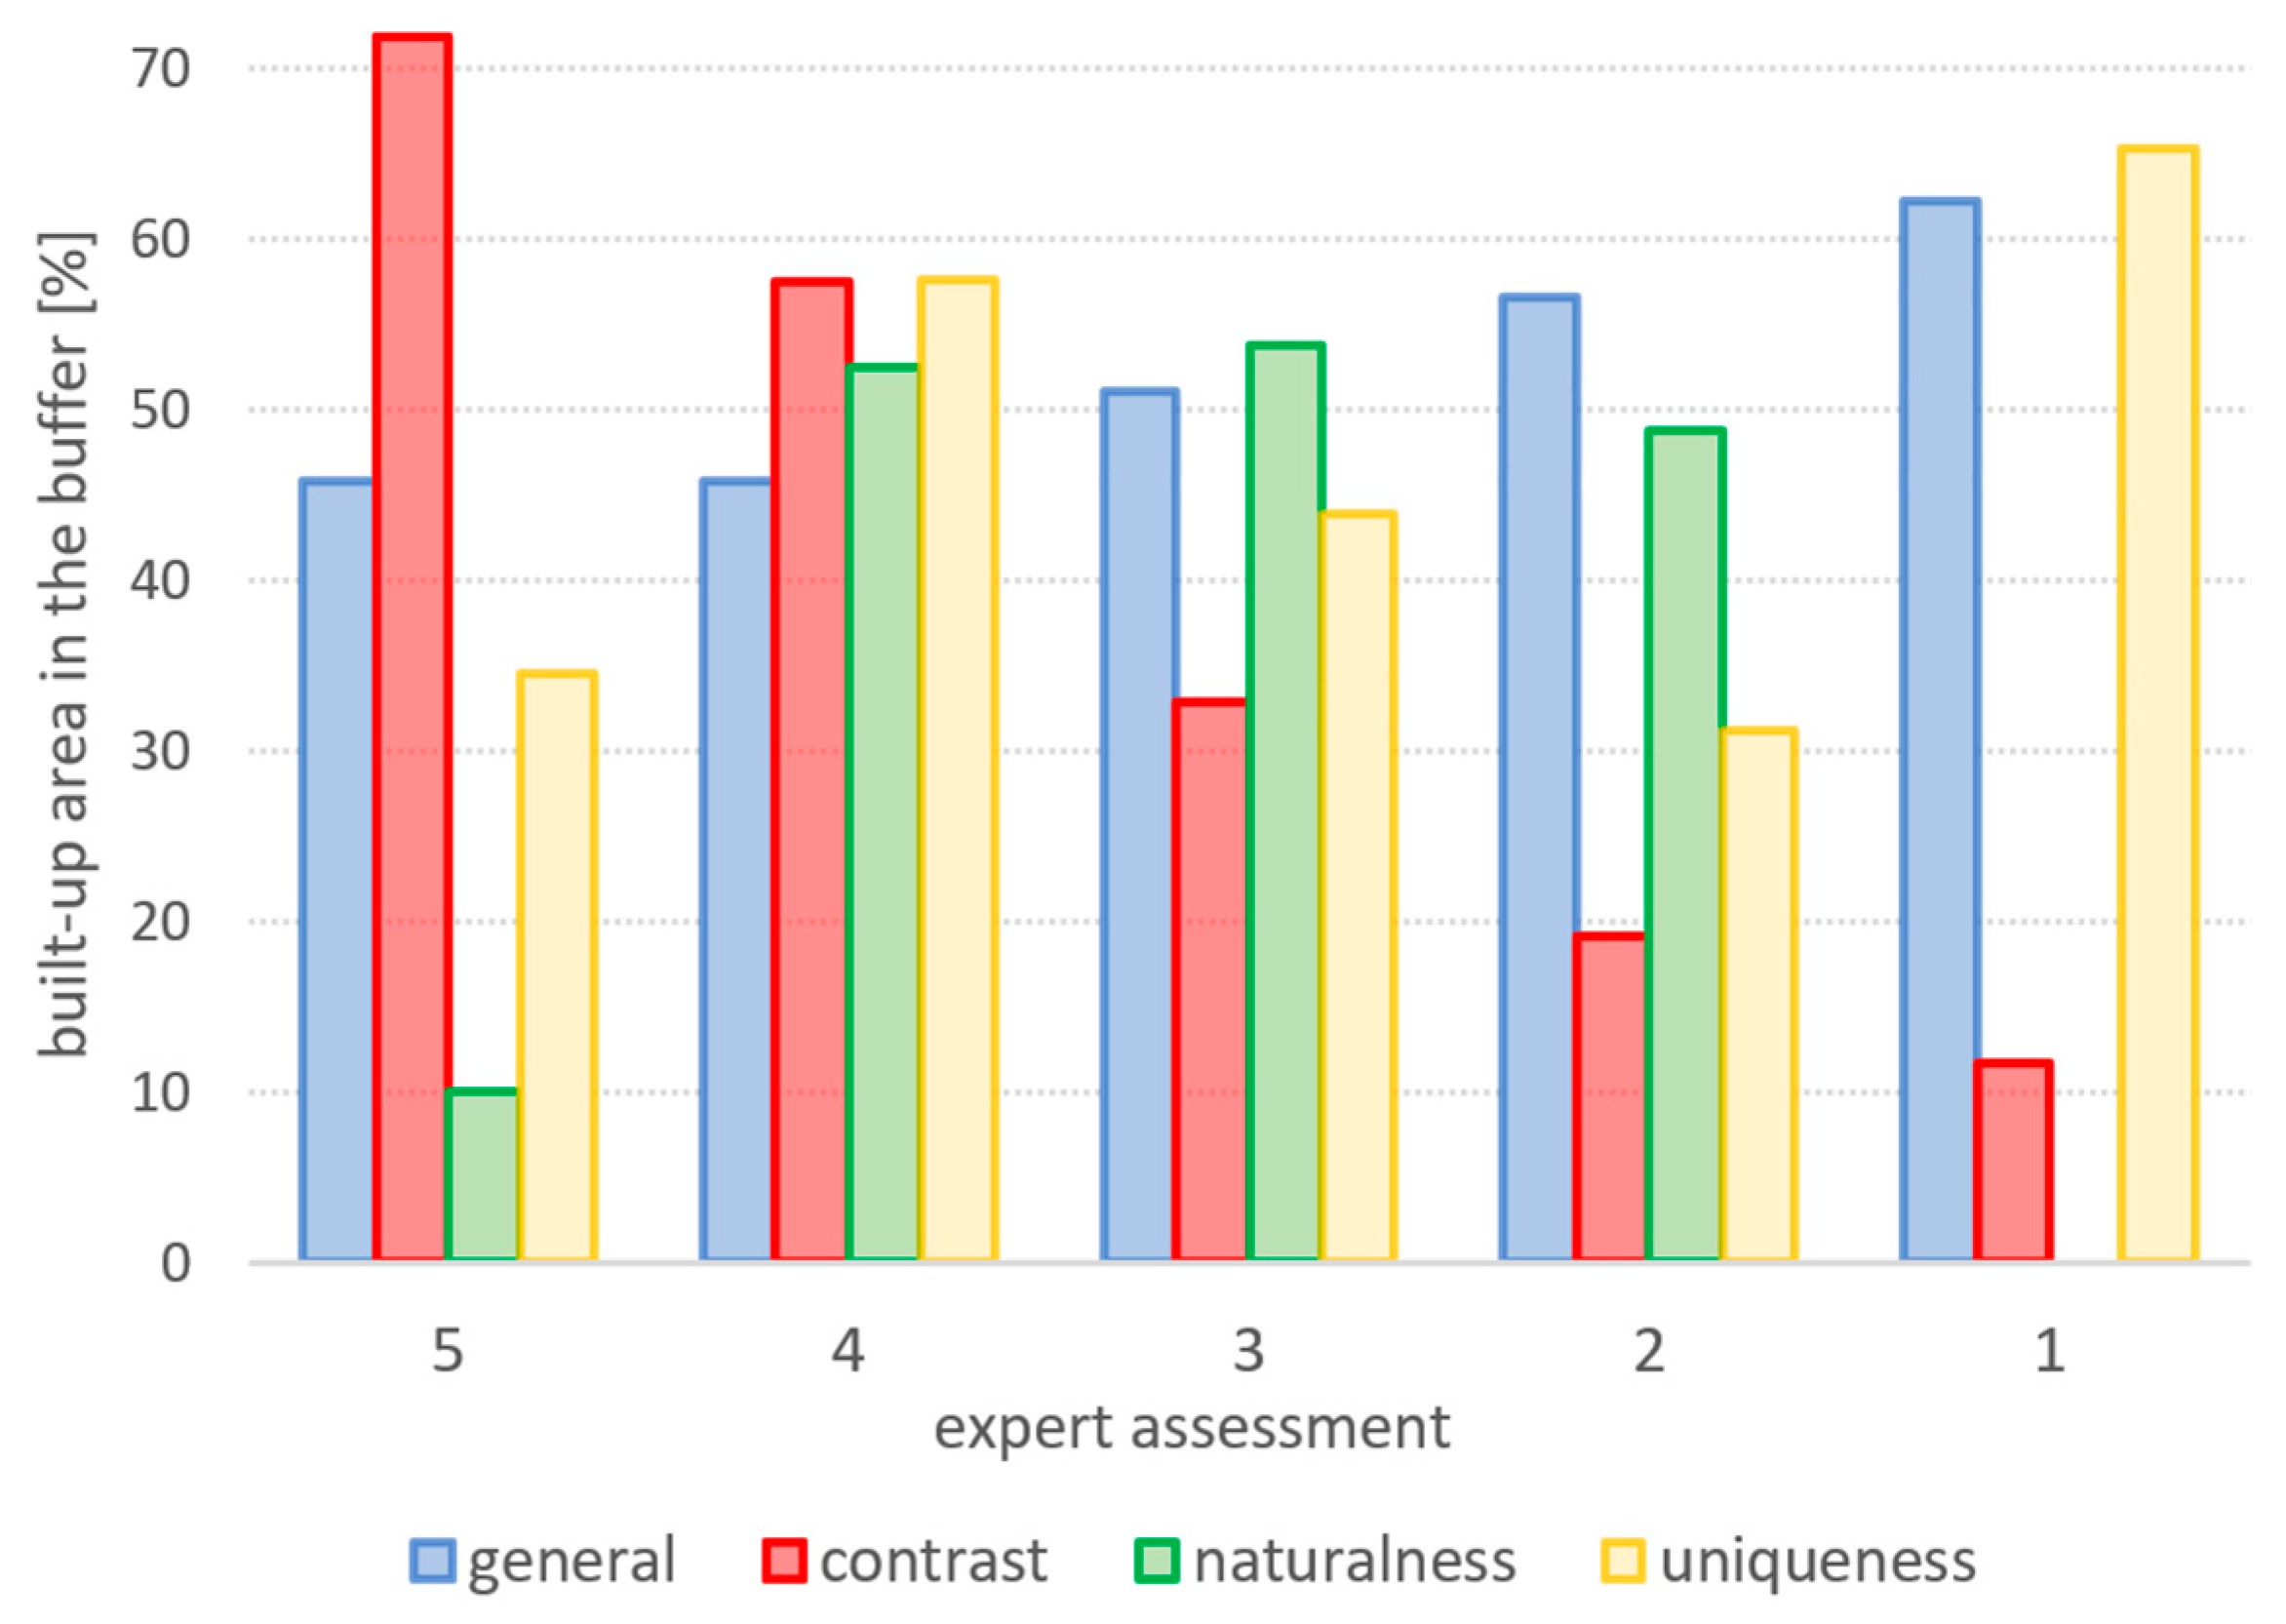
4.1. Percentage of Built-Up Area in the Buffer

It was found that the sites with a higher general assessment score had less built-up land in the buffer (correlation coefficient r equal to −0.97), and the areas with the highest scores for naturalness had a very small share of developed land in the buffer. For the other sites, the average share of development was found to be similar. Moreover, a clear positive correspondence existed between landscape contrast and the percentage of development in the buffer (Table 5). In terms of uniqueness, ENPs were classified as very rare (4) and the most common (1) had more development, while unique (5) and common (2) sites were the least common.
Figure 4. Graphs of the relationship between the percentage of built-up area in the buffer and expert assessment scores.
Sustainability 17 01349 g004

4.2. Relationships Between the Expert Assessments and Spectral Indices

A collation and analysis of the relationships between the expert assessments of these sites (general assessment, naturalness, landscape contrast, and uniqueness) and the spectral indices and geospatial data for these sites and their buffers (LST, NDVI, LAI, slope, and share of built-up land) are presented in Table 4 and Table 5, and Figure 4, Figure 5, Figure 6, Figure 7, Figure 8 and Figure 9. The Supplementary Materials include additional visual representations of the spectral index distributions.
Table 4. Relationships between expert assessments, spectral indices, and geospatial data.
General Expert AssessmentNaturalnessLandscape ContrastUniqueness
% share
of built-up land in the buffer zone
The higher the rating, the less development they hadOnly the highest-rated sites stood out—they had the least developmentThe higher the landscape contrast, the more built-up land in the bufferThe most prominent areas had relatively little development; no clear dependencies
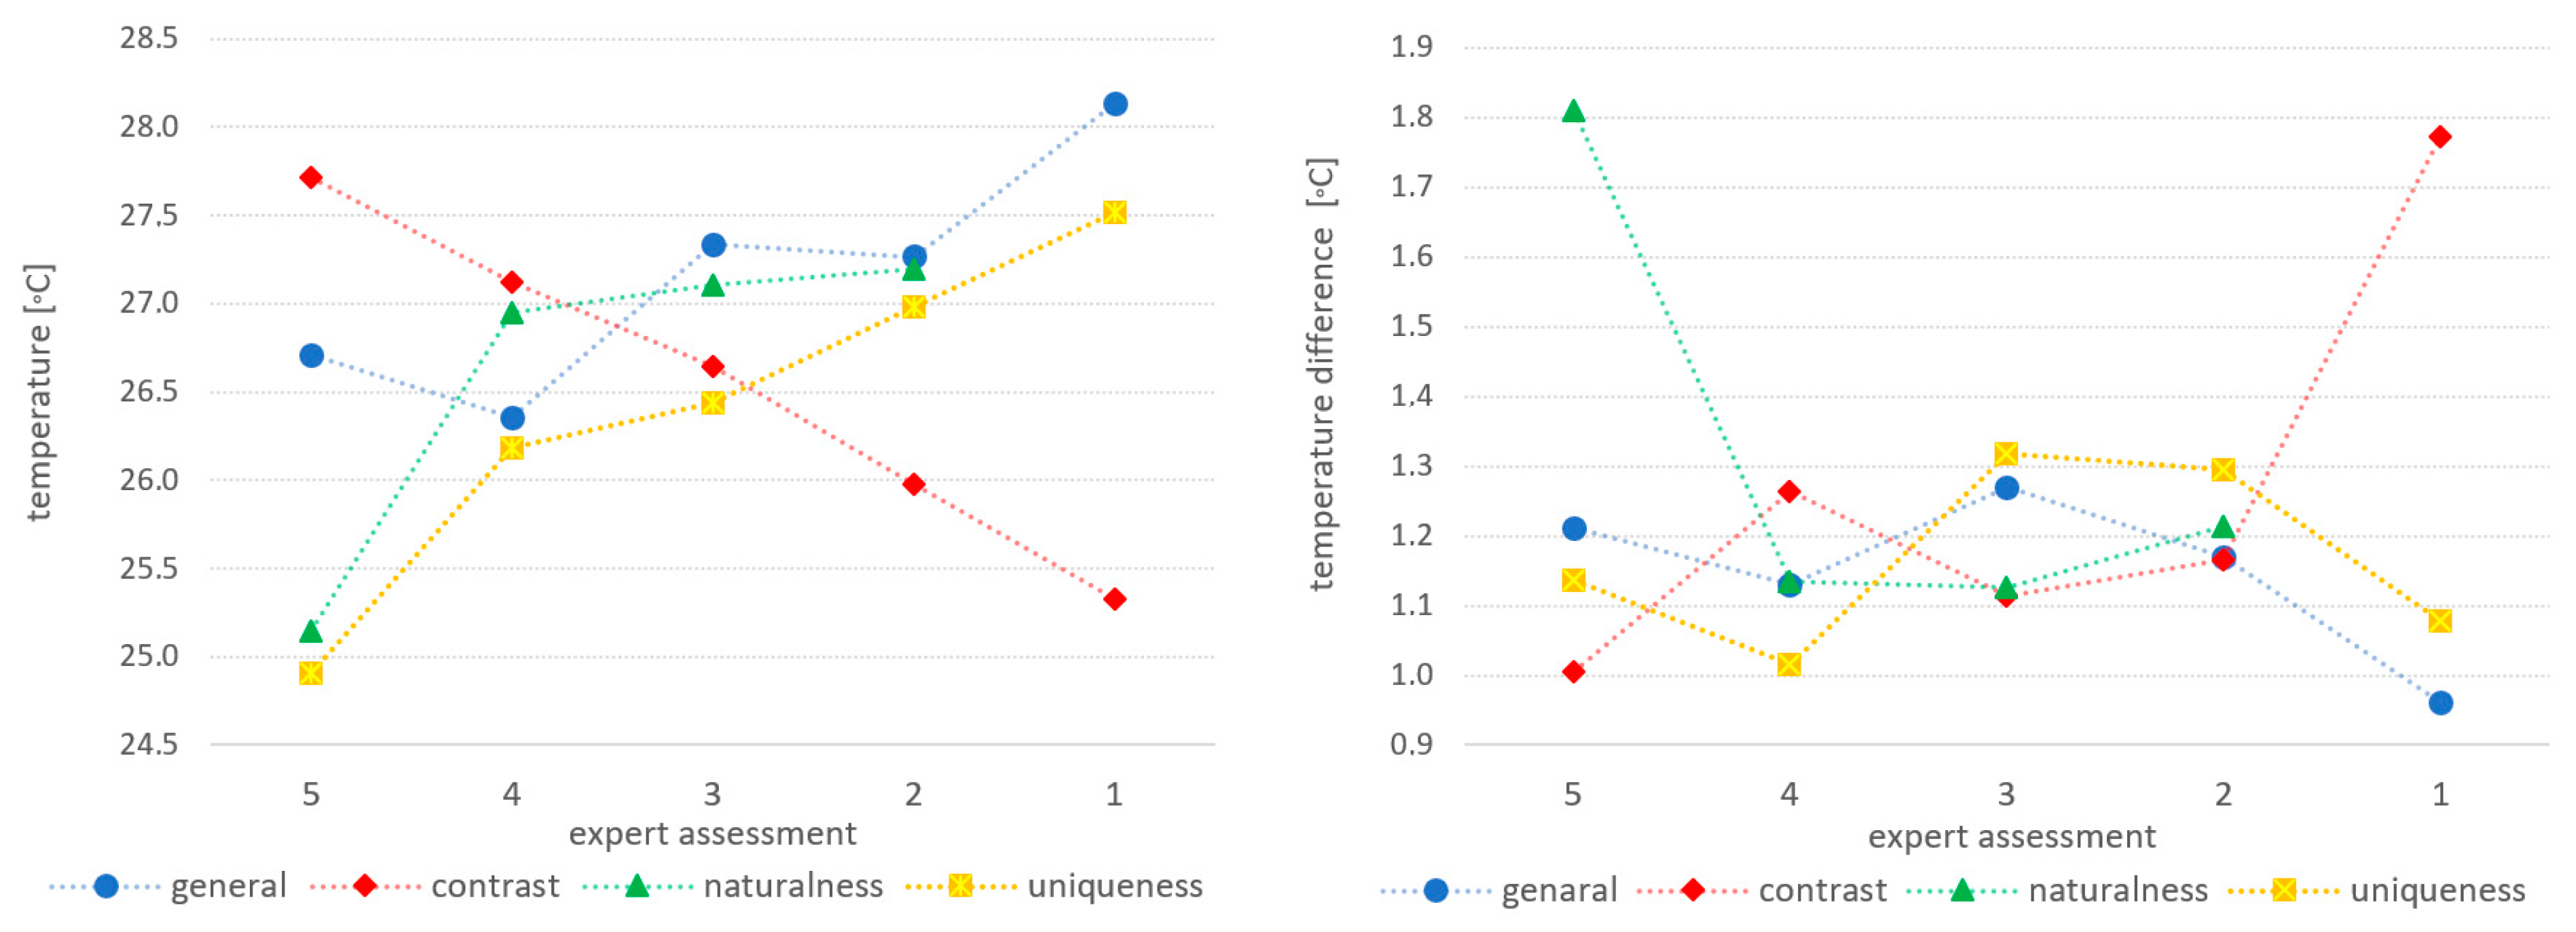
LSTCooler sites were rated higher but the coolest were rated 4; the higher-rated sites were also had a slightly higher temperature contrasted with the bufferThere was a slight tendency for sites with higher scores to be cooler;
sites with a score of 5 clearly had a greater temperature difference with the buffer, while others showed a tendency for the reverse trend: the lower the naturalness, the greater the LST difference with the buffer
Reverse tendency—the higher the landscape contrast, the significantly warmer the site and the smaller its difference with that of the buffer The higher rated area was noted for its uniqueness
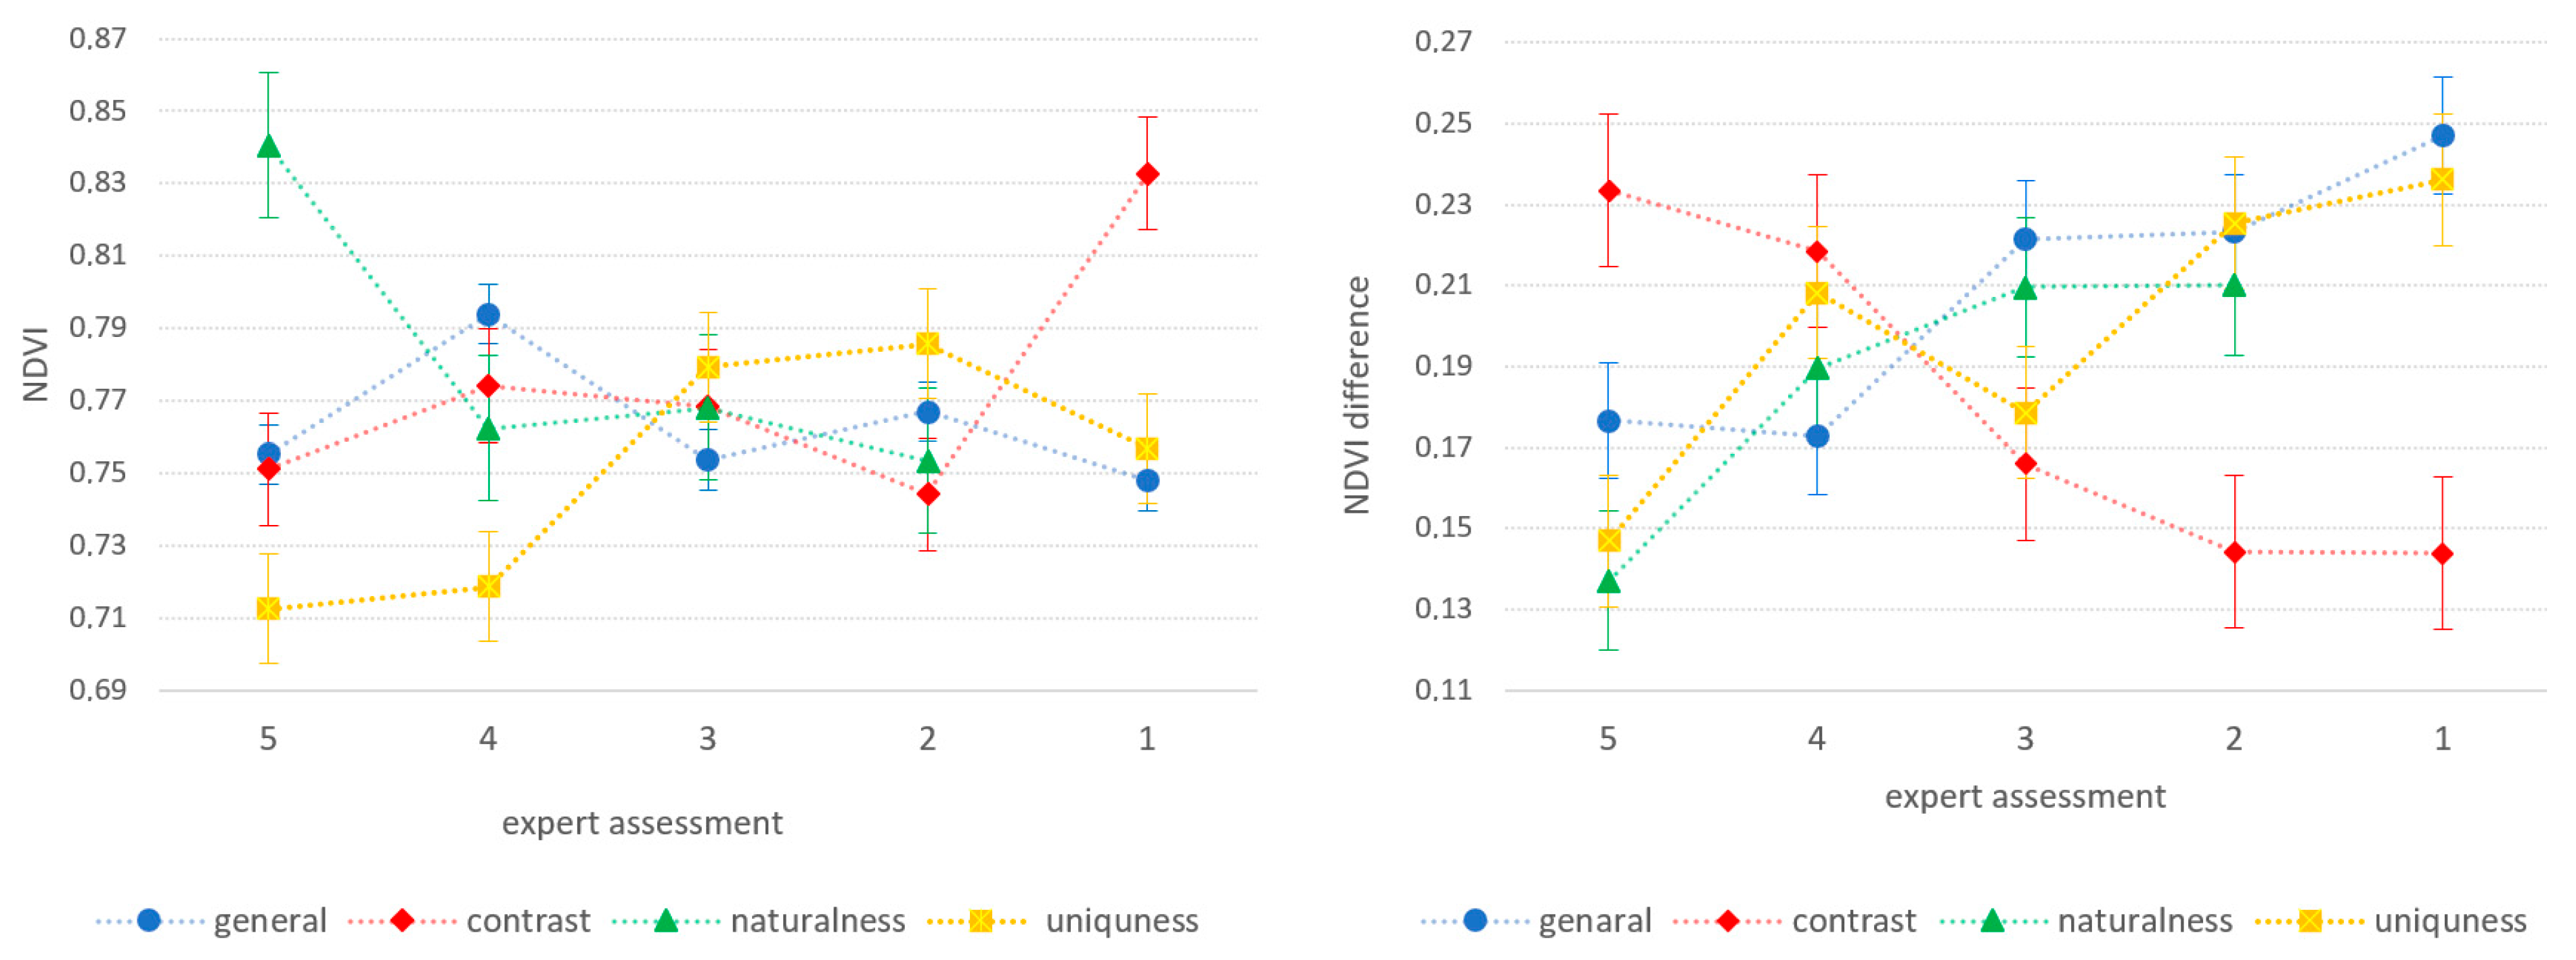
NDVISites which scored 4 were less spectacular and had the highest NDVI scores;
higher-rated ones contrast less with the buffer, providing a sense of space
Sites with the highest scores for naturalness (5) had the highest NDVI score and those with significantly lower NDVI scores contrasted with the buffer;
other sites had similar naturalness ratings and the NDVI differences increased slightly with decreasing naturalness
The lowest-rated sites had the highest NDVI scores;
the smaller the landscape contrast, the smaller the difference in the index scores compared with the buffer (the environments were more similar)
The sites with the highest NDVI scores had average uniqueness (3 and 2); NDVI differences between the site and the buffer increased with decreasing uniqueness; there was also a significant difference for sites that scored a 4
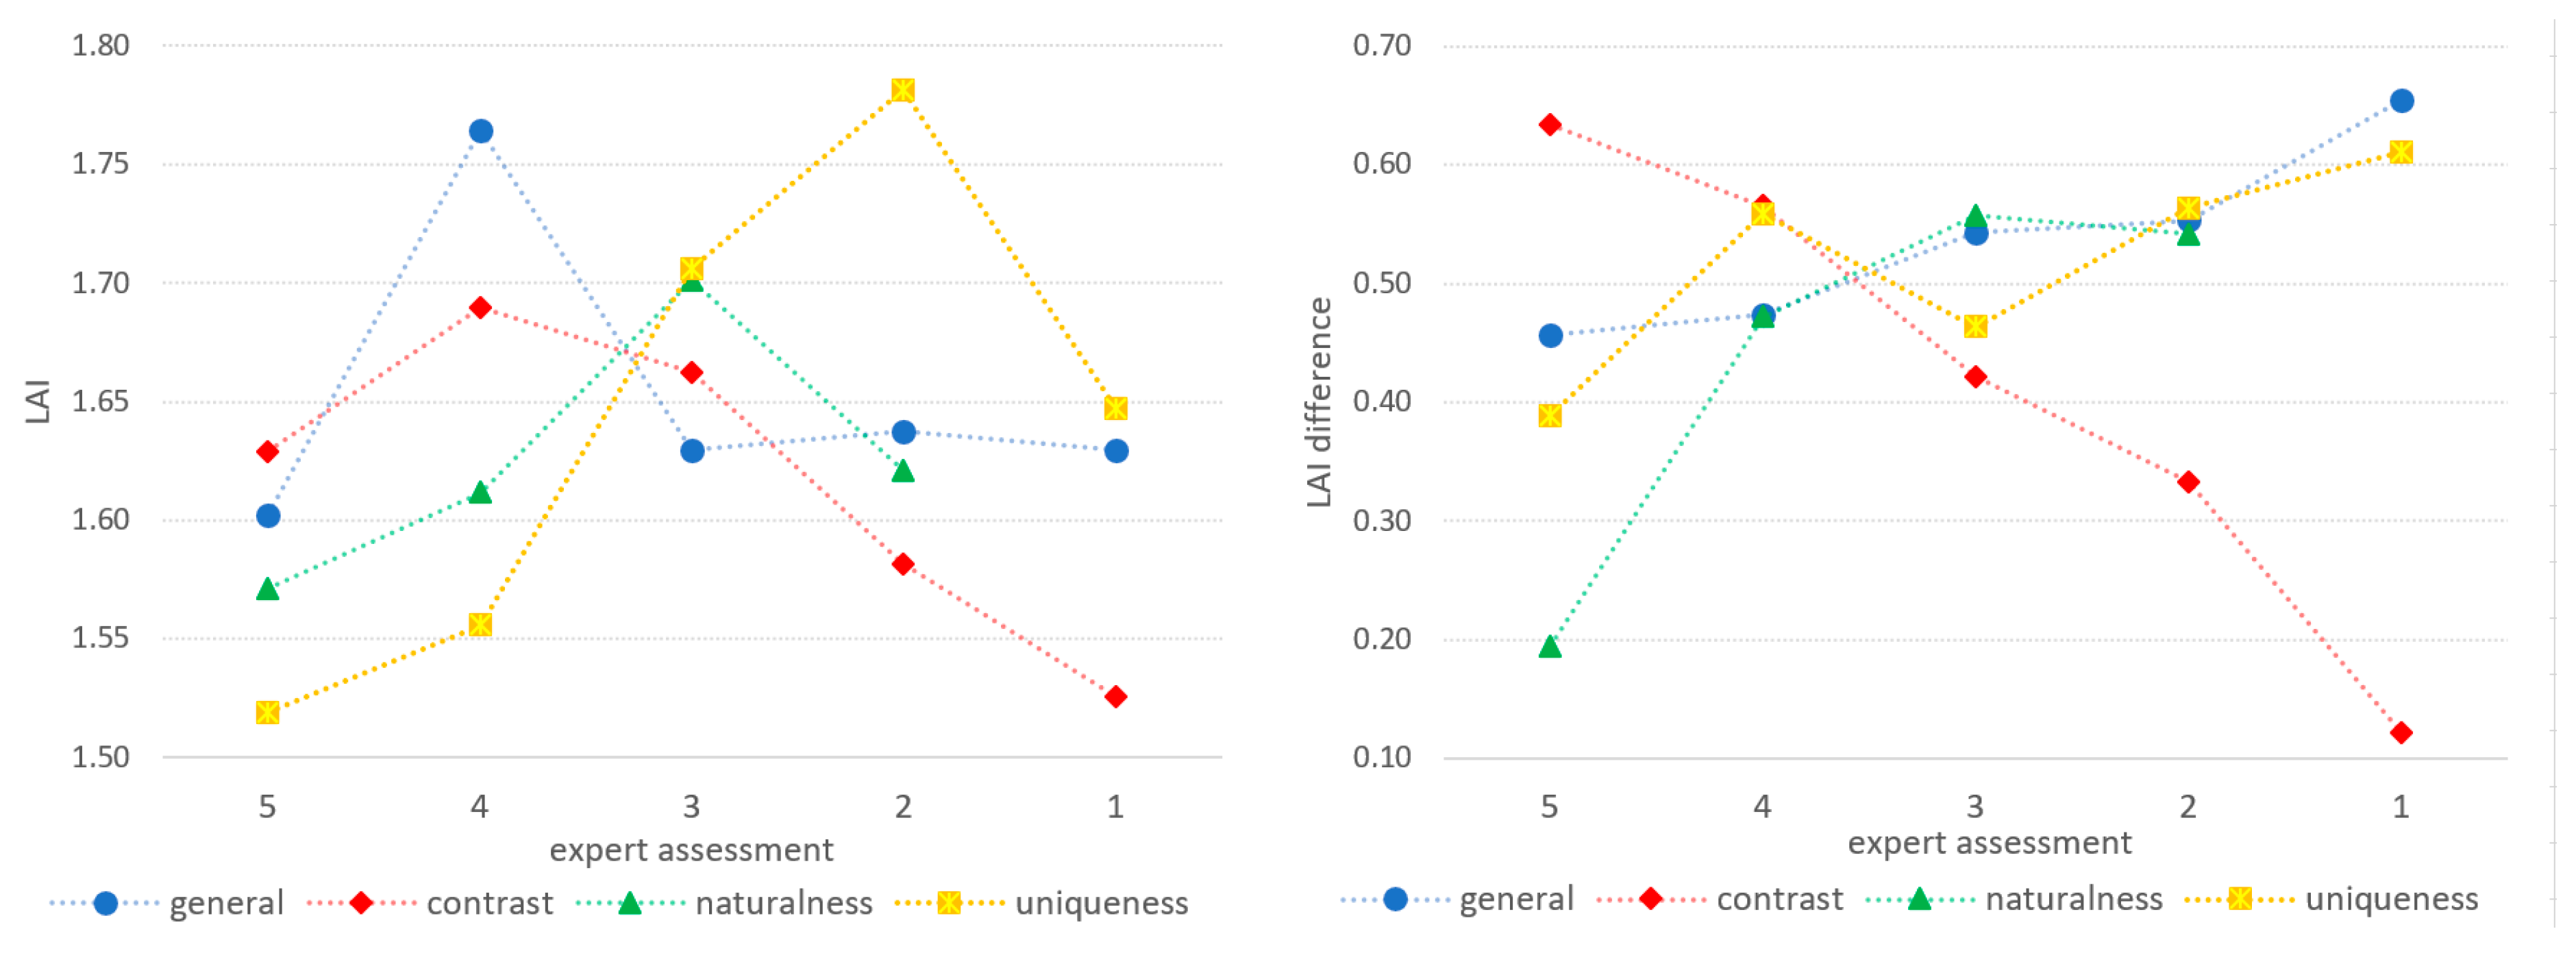
LAISites which scored 4 were less spectacular and had the highest LAI scores;
higher-rated ones contrasted less with the buffer, providing a sense of space
The sites with a naturalness score of 3 had the highest LAI scores; those with a naturalness score of 5 had the lowest LAI scores (but only slightly lower); sites with a significantly lower LAI score contrasted with the buffer; the greatest difference was observed for the areas that scored 2 for naturalness Areas with the lowest value for contrast had the lowest LAI scores;
the areas rated 4 or 3 stood out (average contrast); the smaller the landscape contrast, the smaller the LAI difference with the buffer
Average sites (uniqueness score of 3 and 2) had the highest LAI scores;
lower scores for uniqueness correlated with increasing LAI differences between the site and buffer; a significant difference was also observed for the sites that scored a 4
NDMI
(moisture)
The most humid are areas were rated a 2;
the higher-rated ones contrast less with the buffer
Sites rated higher for naturalness had slightly higher NDMI scores; sites with the highest scores for
naturalness (5) had significantly smaller NDMI score differences; for the others, the humidity difference decreased as naturalness decreased
Sites with the lowest landscape contrast had the highest NDMI scores (5 and 4);
the smaller the landscape contrast, the smaller the NDMI difference with the buffer
Sites rated 1 for uniqueness were the most humid;
a decrease in uniqueness correlated with an increase in the difference between the site and the buffer; a significant difference was also observed for the sites that scored a 4
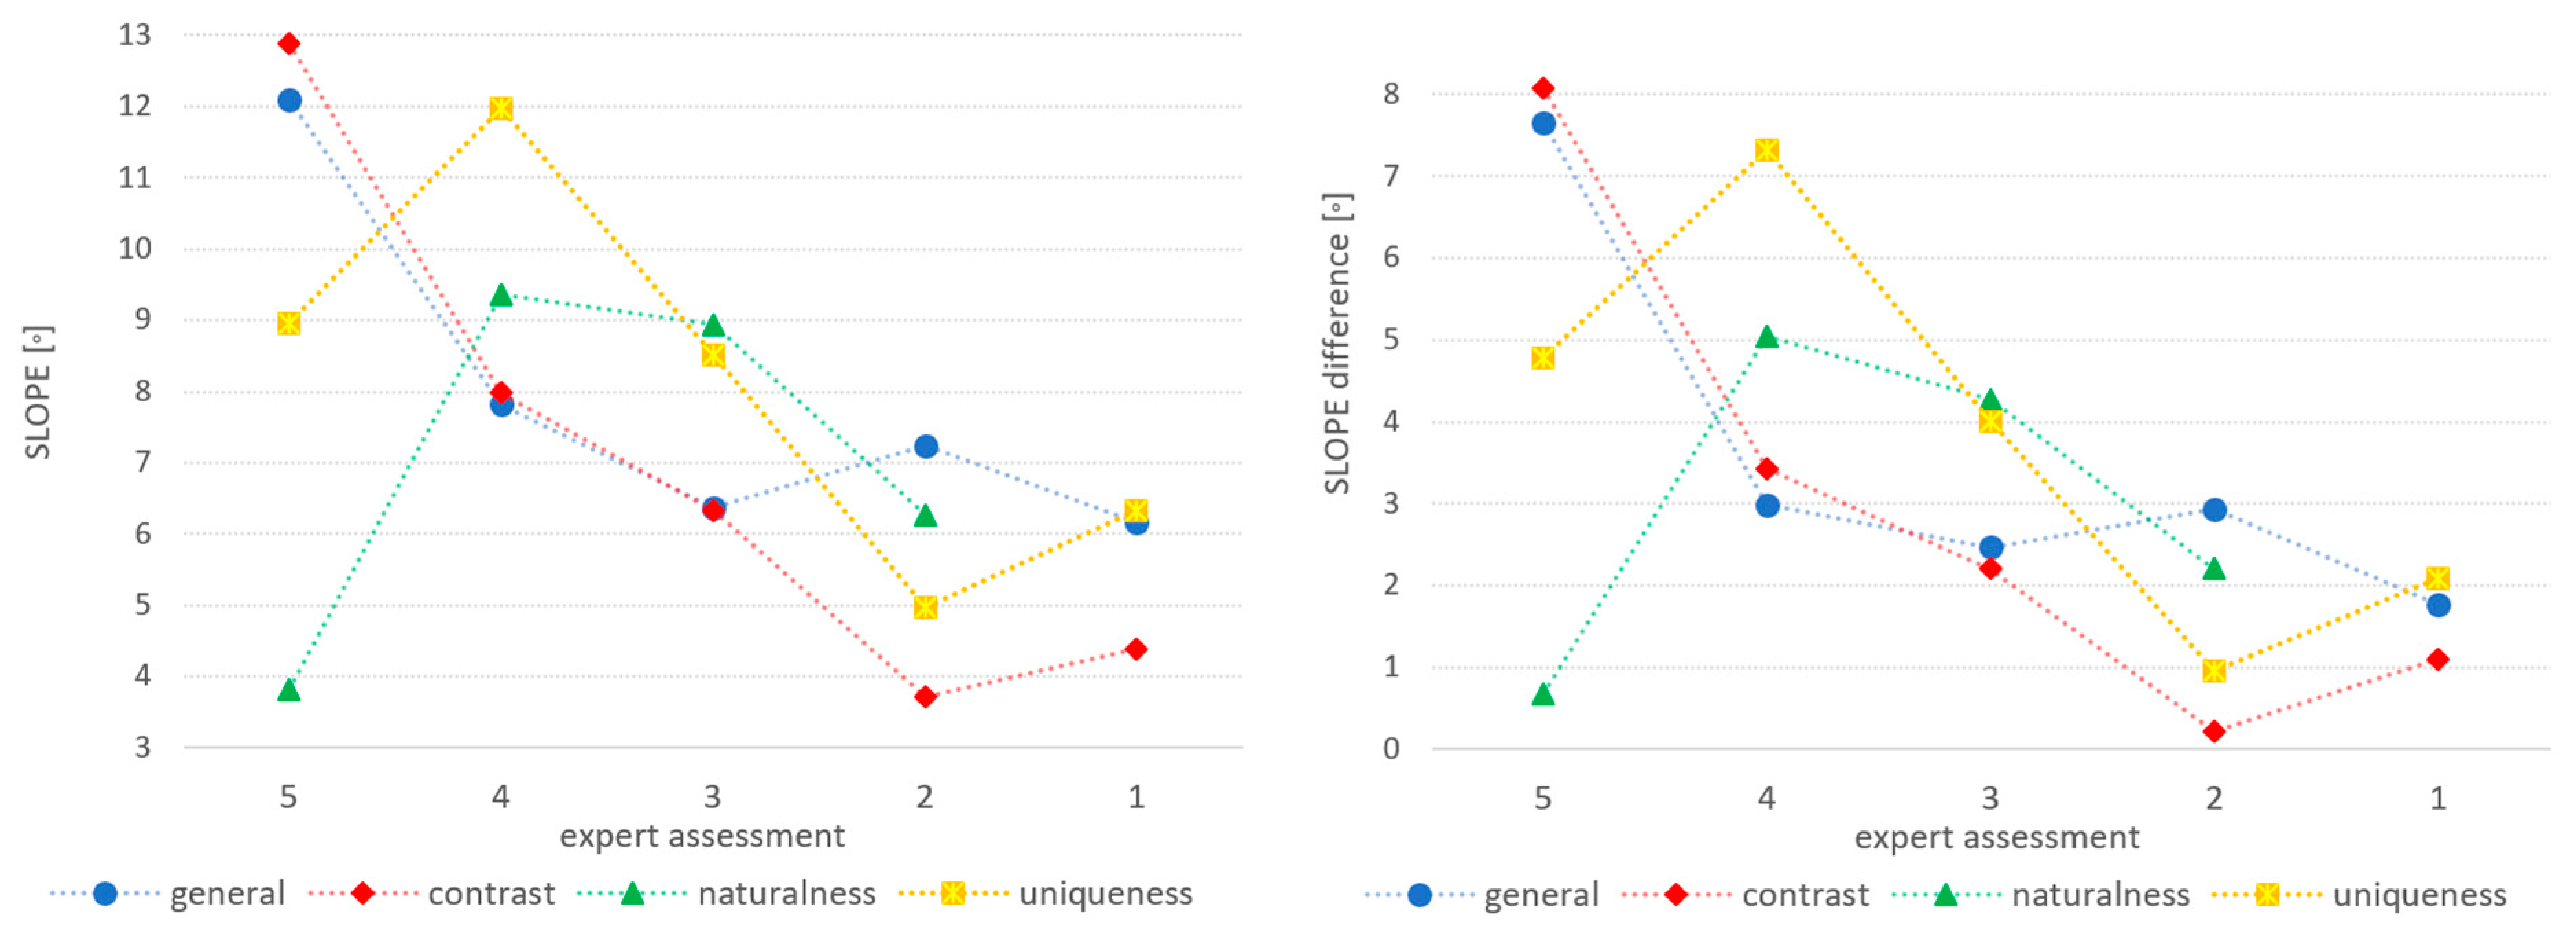
SlopeHigher-rated sites had a greater slope and index difference between the terrain and the buffer; a rating of 2 stood outThe sites with the highest naturalness rating (5) had the lowest slope and the smallest difference with the buffer;
the others showed the inverse—the lower the naturalness, the lower the slope and the smaller the difference; the highest value and slope difference were observed for the sites rated 4
A higher landscape contrast means a higher slope and greater difference between the site and the buffer; the lowest slope and the smallest index difference were observed for the sites rated 2Sites with a uniqueness rating of 5, 4, or 3 had the highest slope and the greatest difference with the buffer, which were clearly distinguishable from the sites rated 2 or 1
Table 5. Correlation values between expert assessments and spectral indices.
General Expert AssessmentLandscape ContrastNaturalnessUniqueness
LST−0.8760.998−0.836−0.409
LST difference0.623−0.7600.7080.037
NDVI0.360−0.6030.824−0.294
NDVI difference−0.9370.950−0.897−0.714
LAI0.1770.761−0.566−0.517
LAI difference−0.9580.983−0.862−0.573
NDMI0.027−0.2700.981−0.360
NDMI difference−0.7380.956−0.633−0.564
Slope0.8130.918−0.3470.740
Slope difference0.7990.881−0.2460.757
Built-up land−0.9680.984−0.726−0.284
The statistical analysis showed that the land surface temperature had a strong or very strong relationship with the expert ratings. In the case of the general assessment and naturalness, there was a negative correlation (r equal to −0.876 and −0.836, respectively), i.e., the higher the rating, the lower the temperature. On the other hand, the general assessment and naturalness correlated positively with the temperature difference between the site and its buffer (r equal to 0.623 and 0.708, respectively). In the case of landscape contrast, there was a clear relationship (with an r of almost 1): the higher the score, the higher the temperature. At the same time, as the rating increased, the temperature difference with the buffer decreased (r equal to −0.760). The relationship between the NDVI scores and expert assessments was more varied. The strongest relationship was with naturalness (r equal to 0.824): the higher the naturalness rating, the higher the NDVI value, while in the case of landscape contrast, the higher the rating, the lower the NDVI score. For the general assessment and uniqueness, the relationship was weak. When it came to the difference in NDVI scores between the site and its buffer, the correlations with the expert assessments were very strong. The LAI showed a strong relationship with landscape contrast and a moderate relationship with naturalness and uniqueness. In contrast, the LAI difference between sites and their buffers had a very strong relationship with the expert assessments (r greater than 0.862). The higher the general assessment and naturalness scores, the smaller the LAI difference. On the other hand, for landscape contrast, the relationship was positive: the higher the rating, the greater the LAI difference.
There was a very strong relationship between NDMI scores and naturalness: the higher the naturalness score, the higher the NDMI value (r equal to 0.981). For the other expert assessments, the relationship was weak. In the case of NDMI differences between sites and their buffers, landscape contrast had the strongest relationship (r equal to 0.956): the higher the contrast, the greater the NDMI difference. For the other expert assessment parameters, there was a strong negative relationship.
There was a strong or very strong relationship between the general assessment, landscape contrast, and uniqueness assessment and slope (r equal to 0.813, 0.918, and 0.740, respectively) and slope difference between sites and their buffers (r equal to 0.799, 0.881, and 0.757, respectively) (Table 5).
(a)
LST—Land Surface Temperature
Figure 5. Graphs of relationship between average LST of areas and expert ratings and relationship between differences in average LST of areas and their buffers and expert ratings. Dashed lines were used to illustrate trends.
Sustainability 17 01349 g005
The results showed that sites that were rated higher in the general assessment were significantly cooler: the lowest average temperature was observed in areas rated 4, indicating their value in site cooling (Figure 5 and Table 4). The difference in mean temperature between sites rated 4 and 1 was about 1.79 °C. Furthermore, in terms of differences between sites and their buffers, it can be seen that the highest-rated sites in the general assessment had slightly greater temperature differences with their buffers; these differences ranged from 1.2 to 1.0 °C. There was a noticeable but not very strong correlation between naturalness and temperature—areas rated higher for naturalness were cooler and sites with the highest scores for naturalness (5) had a significantly larger temperature difference with their buffers. For the other sites, there was a slight trend in the reverse direction—the lower the score for naturalness, the slightly larger the temperature difference compared with their buffers. Moreover, for landscape contrast, there was a clear trend—the larger the contrast, the warmer the site, and the slightly less distinct it was from its surroundings. The contrast was visually attractive but contributed to the warming of the ENP and increased the impact of the surroundings. Sites with higher contrast ratings had a smaller temperature difference compared with the surrounding buffer. Thus, the visual contrast—which is intriguing for visitors—may contribute to the heating of the ENPs. At the same time, the large temperature difference for the least visually contrasting areas was noteworthy. An analysis of these cases indicated that they had a low temperature and their surroundings included, among others, warming farmland. The relationship between temperature and uniqueness was apparent—the most unique (such as shaded gullies, river meanders, etc.) ENPs were, on average, 2.62 °C cooler than the most common ENPs (usually overgrown with shrubs). In terms of the differences in temperature compared to their buffers, the biggest differences were observed for sites rated 5 (they were also the coolest), 3, and 2 (because their surroundings were very warm).
(b)
NDVI—Normalized Difference Vegetation Index
Figure 6. Graphs of the relationship between NDVI values and expert assessments with the standard error of the mean for ENP areas and difference in the mean NDVI values between the ENPs and their buffers. Dashed lines were used to illustrate trends.
Sustainability 17 01349 g006
It was found that the sites rated 4 in the general assessment section had the highest NDVI scores (Figure 6 and Table 4)—they were less prominent, with no exposed slopes, water, etc., and more shrubs which obscured the view and reduced the view of the site, but they were valuable. Moreover, those rated higher in the general assessment section contrasted less with the buffer. The sites with the highest score for naturalness (5) had a slightly higher NDVI score and significantly smaller NDVI differences with their buffers, while NDVI scores for the other groups in the naturalness section were similar and the NDVI differences were slightly larger. The lowest score for landscape contrast almost always corresponded to the highest score for naturalness; these areas also had the highest NDVI scores, while among the other groups, the sites rated as 4 and 3 stood out—they visually contrasted with their surroundings. The smaller the score for landscape contrast, the smaller the difference in NDVI scores between the site and the buffer—i.e., the surroundings and the area were more similar. The highest NDVI values were observed for areas rated 3 or 2 for uniqueness and the difference in NDVI scores between the sites and their buffers increased as the uniqueness decreased; a significant difference was also found for the sites rated 4, which comprised very rare but not outstanding ENPs.
(c)
LAI—Leaf Area Index
Figure 7. Graphs of relationship between average LAI scores of sites and expert assessments and relationship between difference in average LAI scores of sites and their buffers and expert assessments.
Sustainability 17 01349 g007
The results showed that the highest LAI scores were observed for sites rated 4 in the general assessment section, thus indicating their value. Those rated higher in the general assessment section contrasted less with their buffers (Figure 7 and Table 4). Furthermore, the highest LAI scores were recorded for areas rated 3 for their naturalness (an intermediate score; these areas were mostly covered with a mixture of trees, shrubs, open areas). This index measures foliage and indicates that these areas have value in terms of vegetation density and amount of biomass. The lowest (though only slightly) LAI score was observed for the sites with the highest naturalness ratings. The sites rated the highest for naturalness (5) had smaller LAI differences compared with their buffers; this difference was markedly larger for the remaining areas, and was highest for those rated a 3. The areas with the lowest landscape contrast had the highest naturalness ratings and the lowest LAI scores. Among the other groups, the areas rated as 4 and 3 (average visual contrast with their surroundings) stood out. Moreover, there was a clear relationship between the difference in LAI scores compared to the buffer in terms of landscape contrast—the lower the contrast, the smaller the difference in the LAI scores and the more similar the environments are. The highest LAI values were observed for the areas with an average uniqueness rating of 3 and 2 and the differences between the sites and their buffers in terms of LAI scores increased as uniqueness decreased. The sites rated 4, consisting of very rare but not outstanding ENPs, also stood out.
(d)
NDMI—Normalized Difference Moisture Index
Figure 8. Graphs of relationship between the average LAI score of the sites and expert assessments and relationship between differences in the average LAI score of the sites and their buffers and expert assessments.
Sustainability 17 01349 g008
In terms of NDMI scores, the sites with a general assessment of 2 stood out clearly, thus indicating their value for water storage (Figure 8 and Table 4). Those rated higher in the general assessment contrasted less with the buffer. Moreover, the sites rated higher in naturalness had slightly higher NDMI scores. The sites rated highest for naturalness (5) had significantly smaller NDMI differences with their buffers. For the other groups, the humidity difference was smaller. The sites with the lowest landscape contrast had the highest humidity ratings. The areas rated 5 and 4 also stood out. Furthermore, there was a clear relationship between the difference in NDMI scores with the buffer and landscape contrast—the lower the contrast, the smaller the difference in the NDMI scores and the environments were more similar. The most common sites in terms of uniqueness (1) were also the most humid, indicating that they represent the average in the city and are valuable in terms of humidity, even if they do not stand out in terms of temperature. Furthermore, differences between the terrain and the buffer in terms of humidity increased as uniqueness decreased. The sites rated 4 also stood out here.
(e)
Slope
Figure 9. Graphs of relationship between the average slope of the sites and expert ratings and relationship between differences in the average slope of areas and their buffers and expert ratings.
Sustainability 17 01349 g009
There was a clear trend between the general assessment and slope scores—the higher the assessment scores, the greater the slope and the difference between the sites and their buffers (Figure 9 and Table 4). Only the sites rated 2 slightly stood out—the analysis of these cases showed that the condition of the landforms at these sites was not sufficient to be deemed attractive and to have the impression of naturalness. However, the areas with the highest naturalness rating (5) were the least varied in terms of slope; they were flat or slightly undulating. The trend was clear for the other groups—the higher the naturalness value, the more varied the terrain. Attractive escarpments, ravines, and valley slopes dominated in this group (sites rated 4). The distribution of the slope differences between the sites and their buffers showed that those rated as most natural contrasted the least, while those rated 4 again stood out clearly. Moreover, the relationship between slope and landscape contrast was also evident—the areas with the highest contrast were also the most sculpted. There was a similar relationship between landscape contrast and the slope difference between the sites and their buffers—the areas that were the least sculpted and the least differentiated from the surroundings were the areas rated 2 in terms of landscape contrast. The areas rated 5, 4, and 3 in uniqueness had the most varied topography, clearly distinguishing them from the flatter and more common sites. In particular, areas rated 4 had the highest index and the greatest difference in this index compared with their buffers. This is due to the fact that this group includes areas with landscape types that are rare but nevertheless occur at two or three places in the city—for example, inaccessible slopes or ravines.

5. Discussion

The limitations of this study and its methods should be acknowledged. The connotations and limitations of using the term ‘attractiveness’, which can be understood as the evaluation of a space in isolation from its value and only in relation to other places being evaluated, are recognized. In this study, the term ‘visual attractiveness’ was used to focus on the visual aspect of the study areas and to assess the values of the individual places. The research primarily relied on the work of Rink (2005), which emphasizes the visual aspect of wild spaces. The criteria for assessing visual attractiveness were selected based on the research in [25,26,42], as well as the beauty indicators developed in [28]. The limitations of using the expert method for visual landscape assessment are also acknowledged. This method was applied due to the low level of use of the areas under study, which precluded research involving a wider group of residents. However, expert assessments also have advantages, as they can be more easily related to residents’ everyday perception of the cityscape.
The choice of the visual assessment criteria can influence the results. In this study, positive factors were the focus, and aspects of disturbances, as used in [28], were not introduced. The results could have also been affected by the way the spectral data were collected and processed. A single, fixed buffer of 300 m was used in the research. Similar methods have been applied in [13,16,33] and other studies. However, situations where buffers overlapped with neighbouring study sites or where buffers were not investigated, as noted in [33], may have resulted in an unrecognized effect of the mutual proximity of the sites on the study results.
The findings were also contrasted with similar results in the literature. Similar relationships between low temperature and high NDVI scores have been observed in China in Changchun [31], the Minjang River Estuary [15], Wuhan [12], and in Bengaluru, India [4,13].
When the results were compared with those of studies conducted in other European cities, it became evident that the role of informal green spaces is equally significant in cities like Berlin, where wild urban spaces are recognized as key elements of the urban ecosystem [5]. In studies conducted in London [7], informal green spaces demonstrated a similar impact on reducing temperatures and enhancing biodiversity, highlighting the universal benefits of such spaces regardless of the local context. This comparison shows that implementing the concept of ENPs (enchanted natural places) can be effective not only in medium-sized cities like Lublin, but also in larger metropolises.
Similar findings have been observed in various parts of the world. In Beijing, China, urban green spaces significantly contributed to lowering ambient temperatures, leading to energy savings and reduced emissions [24]. In Phoenix, USA, green spaces not only cooled urban areas but also reduced social inequalities by providing equitable access to cooler, more comfortable environments [53]. In Chongqing, China, the synergistic cooling effects of combining green and blue spaces further enhanced their impact on temperature regulation [54]. In South American cities, open spaces played a crucial role in urban planning in the context of climate change adaptation [55].
In term of landscape contrast, a comparison with the research conducted in [42] was performed. Their study did not clearly indicate which type of land boundary was considered more natural. In this research, contrast was found to be an attractive feature, and thus visual contrast, which is intriguing to users, may contribute to the heating of ENPs. These observations are complemented by the results of researchers in Australia [16], India [13], and China [24,33,54], who highlighted the role of even small areas in neighbourhood cooling. The clear relationship between temperature and uniqueness as a whole confirm the role of land in reducing temperature, which is referred to as UCIs (‘urban cooling islands’) [14].
Informal green spaces, such as ENPs (enchanted natural places), provide not only aesthetic benefits but they also play a key role in delivering ecosystem services. In addition to regulating the microclimate by reducing temperature, these areas act as natural air filters, improve soil quality, and support biodiversity. In particular, in cities with limited access to formal green spaces, ENPs offer alternative recreational spaces that can contribute to the improvement of residents’ mental and physical health while simultaneously reducing social inequalities in terms of access to nature. These functions of such areas support the concept of nature-based solutions, which enhance the resilience of cities to climate change. According to recent findings, integrating ecosystem services into urban planning frameworks significantly contributes to climate resilience, enhancing the multifunctionality of urban green spaces and their ability to mitigate the urban heat island effect [17].
As observed in a study [50] on European forests, a dissimilarity between two indices, LAI and NDVI, was found in some cases. For example, the sites with the highest LAI values and contrast with the buffer were defined as having average naturalness (3). This result indicates that the sites have value in terms of vegetation density and amount of biomass. In contrast, the sites with the highest naturalness (5) had the lowest LAI scores (though only slightly lower). This result stands in contrast to the conclusions in [34] where generally higher LAI values were found for forests compared to shrubland. Similar findings were also presented in [33] where, by examining the Leaf Area (LA) parameter derived from the LAI, it was shown that the highest values of this index (and also the lowest temperatures) were obtained for forested areas. These researchers also derived LAI scores from in situ studies, and additionally, another study [49] indicated significant seasonal variability in LAI scores. This presents a challenge for further research.
As mentioned in the literature, a generally varied landform supports visual attractiveness [29,30,47]. It should be added that a simple indicator—such as the average slope—was used in this study, while other researchers adopted different, more specific indicators.
In terms of the NDMI (which measures moisture), the sites rated 2 in the general assessment stood out. This indicates their role in water storage; however, this result is puzzling as the NDMI scores did not correlate with the temperature of the land, which was considerably warmer. According to studies such as [15,32], a higher LST should correlate with a lower NDMI score.
Also, the intensity of use did not clearly result in a lower rating. This is consistent with the observations in [7] where it was found that ‘residents also prefer a certain level of maintenance (a “tended” look, cleanliness)’.
This expanded international perspective confirms that research on urban green spaces, both formal and informal, has a universal nature. Implementing concepts such as ENPs in different regions of the world can not only improve local climate conditions, but also enhance cities’ resilience to climate change and increase access to nature for residents, regardless of their socio-economic status. Therefore, the developed methodology can be successfully adapted in other cities, contributing to better urban planning and greater sustainability.
Another issue is also the extension and development of research. The experience in research on citizens perception by the authors, documented in [8,11,19,23], may be helpful for further research. Further research directions could include the following: expanding research to include nature inventories—for example, a bioscore [47]; determining the impact of site size on expert and spectral indices; expanding research to other sites; and studying the impact of noise [30], the impact of distance from the centre, relationships with residential areas and accessibility, ecosystem services [28], planning considerations, and possible conservation directions.

6. Conclusions

An expert assessment method was developed to identify the most visually attractive areas in Lublin, distinguishing them from other unmanaged IGSs, and the name ‘enchanted natural places’ (ENPs) was proposed for these sites. The results of the expert assessments were juxtaposed with spectral indices and geospatial data, revealing a number of relationships between them. Based on the results, it was determined that the areas studied possess both visual values and specific values derived from the spectral data. Furthermore, the highly rated areas had clearly favourable spectral index scores. At the same time, numerous areas with lower visual attractiveness also had specific spectral values, such as high humidity. However, the size of these areas, their location within the city structure, and the perception of them as ‘wastelands’ mean that they often remain outside legal protection. Hence, it is necessary to carry out further research into these areas and then identify directions for their protection, including legal solutions. Just identifying and naming them can be an important step towards achieving this goal. As pointed out by a number of authors, the role of semi-natural areas in cities as a place for recreation, contacting nature, and reducing disparities in access to nature is important. They also have a wide potential for educating people about sustainable development. Hence, an emerging challenge is to develop strategies for making these areas accessible without causing them to lose their value. The authors of [25] pointed out that appropriate and limited access contributes to land conservation. However, making the area inaccessible is hardly achievable in urban conditions. In the majority of cases, it is recommended to keep these areas partially open to people, by marking out routes and available areas. In justified cases, it is advisable to assemble special constructions that do not disturb the soil and plants.
A separate issue involves the conscious planning and creation of new areas covered with spontaneous vegetation, referred to as ‘planned wilderness’. It was demonstrated through this research that integrating expert assessments with spectral indices offers a novel framework for evaluating urban green spaces, bridging the gap between subjective human perceptions and objective environmental data. The originality of this work lies in the combination of subjective expert evaluations with objective spectral indices, enabling a more comprehensive understanding of the value of green spaces in cities. This approach bridges human intuition with modern remote sensing tools, making it unique in the study of urban ecosystems. This methodology could be successfully applied in other cities, supporting more sustainable urban planning and the protection of green urban areas worldwide.
The method could be used by local authorities, NGOs, or educational institutions in other cities, as advocated in [18], although it requires considerable fieldwork. Visual values can be more easily perceived by residents; therefore, the protection of these areas can begin with the most spectacular examples of unmanaged informal green spaces, which are likely to have greater public acceptance. This approach can then be extended to include other, more common but equally valuable areas, such as average areas with ‘bushes and shrubs’.

Supplementary Materials

The following supporting information can be downloaded at: https://www.mdpi.com/article/10.3390/su17041349/s1, Figure S1: Figures—spectral indices maps; Table S1: Expert & spectral assessment table.

Author Contributions

Conceptualization, J.K., E.G., D.S., E.T., T.S. and G.S.; Methodology, J.K., E.G., D.S., E.T., T.S., G.S. and L.P.; Software, E.G.; Validation, J.K., E.G. and L.P.; Formal analysis, J.K., E.G., E.T., T.S. and G.S.; Investigation, J.K., E.G., D.S., E.T., T.S. and G.S.; Writing—original draft, J.K., E.G., D.S., E.T., T.S., G.S. and L.P.; Writing—review & editing, J.K. and E.G.; Visualization, J.K. and E.G.; Supervision, E.T., T.S. and G.S. All authors have read and agreed to the published version of the manuscript.

Funding

Research project supported/partly supported by program, “Excellence initiative – research university” for the AGH University.

Institutional Review Board Statement

Not applicable.

Informed Consent Statement

Not applicable.

Data Availability Statement

Data are contained within the article and Supplementary Materials.

Conflicts of Interest

The authors declare no conflict of interest.

References

  1. Taylor, L.; Hochuli, D.F. Defining Greenspace: Multiple Uses across Multiple Disciplines. Landsc. Urban Plan. 2017, 158, 25–38. [Google Scholar] [CrossRef]
  2. Cvejić, R.; Eler, K.; Pintar, M.; Železnikar, Š.; Haase, D.; Kabisch, N.; Strohbach, M.W.; A Typology of Urban Green Spaces, Ecosystem Services Provisioning and Demands. KU Leuven. Available online: https://assets.centralparknyc.org/pdfs/institute/p2p-upelp/1.004_Greensurge_A+Typology+of+Urban+Green+Spaces.pdf (accessed on 4 February 2025).
  3. Gandy, M. Natura Urbana: Ecological Constellations in Urban Space; MIT Press: Cambridge, MA, USA, 2022; 416p. [Google Scholar]
  4. Edensor, T. Waste Matter—The Debris of Industrial Ruins and the Disordering of the Material World. J. Mater. Cult. 2005, 10, 311–332. [Google Scholar] [CrossRef]
  5. Braae, E.; Riesto, S. Designing Urban Natures: Ambiguities in Urban Space Design on the Threshold of Climate Disaster. Krit. Berichte Z. Kunst Kult. 2023, 45, 92–101. [Google Scholar] [CrossRef]
  6. Vicenzotti, V. Mapping Multivalent Metaphors: Analyzing the Wildnis Metaphor in the Zwischenstadt Discourse in Terms of Political Worldviews. Nat. Cult. 2013, 8, 162–184. [Google Scholar] [CrossRef]
  7. Rupprecht, C.D.D.; Byrne, J.A. Informal Urban Greenspace: A Typology and Trilingual Systematic Review of Its Role for Urban Residents and Trends in the Literature. Urban For. Urban Green. 2014, 13, 597–611. [Google Scholar] [CrossRef]
  8. Rupprecht, C.D.D.; Byrne, J.A.; Ueda, H.; Lo, A.Y. ‘It’s Real, Not Fake like a Park’: Residents’ Perception and Use of Informal Urban Green-Space in Brisbane, Australia and Sapporo, Japan. Landsc. Urban Plan. 2015, 143, 205–218. [Google Scholar] [CrossRef]
  9. Kowarik, I. Wild urban woodlands: Towards a conceptual framework. In Wild Urban Woodlands: New Perspectives for Urban Forestry; Springer: Berlin/Heidelberg, Germany, 2005; pp. 1–32. [Google Scholar] [CrossRef]
  10. Kowarik, I. Urban Wilderness: Supply, Demand, and Access. Urban For. Urban Green. 2018, 29, 336–347. [Google Scholar] [CrossRef]
  11. Sikorska, D.; Łaszkiewicz, E.; Krauze, K.; Sikorski, P. The Role of Informal Green Spaces in Reducing Inequalities in Urban Green Space Availability to Children and Seniors. Environ. Sci. Policy 2020, 108, 144–154. [Google Scholar] [CrossRef]
  12. Chen, H.; Deng, Q.; Zhou, Z.; Ren, Z.; Shan, X. Influence of Land Cover Change on Spatio-Temporal Distribution of Urban Heat Island—A Case in Wuhan Main Urban Area. Sustain. Cities Soc. 2022, 79, 103715. [Google Scholar] [CrossRef]
  13. Shah, A.; Garg, A.; Mishra, V. Quantifying the Local Cooling Effects of Urban Green Spaces: Evidence from Bengaluru, India. Landsc. Urban Plan. 2021, 209, 104043. [Google Scholar] [CrossRef]
  14. Cheng, L.; Guan, D.; Zhou, L.; Zhao, Z.; Zhou, J. Urban Cooling Island Effect of Main River on a Landscape Scale in Chongqing, China. Sustain. Cities Soc. 2019, 47, 101501. [Google Scholar] [CrossRef]
  15. Zheng, H.; Chen, Y.; Pan, W.; Cai, Y.; Chen, Z. Impact of Land Use/Land Cover Changes on the Thermal Environment in Urbanization: A Case Study of the Natural Wetlands Distribution in Minjiang River Estuary, China. Pol. J. Environ. Stud. 2019, 28, 3025–3041. [Google Scholar] [CrossRef]
  16. Ossola, A.; Jenerette, G.D.; McGrath, A.; Chow, W.; Hughes, L.; Leishman, M.R. Small Vegetated Patches Greatly Reduce Urban Surface Temperature during a Summer Heatwave in Adelaide, Australia. Landsc. Urban Plan. 2021, 209, 104046. [Google Scholar] [CrossRef]
  17. Preweda, E.; Jasińska, E. Organization of the Building Space of Developments and Its Impact on Residential Housing Prices. Sustainability 2020, 12, 7622. [Google Scholar] [CrossRef]
  18. Kremer, P.; Hamstead, Z.; Haase, D.; McPhearson, T.; Frantzeskaki, N.; Andersson, E.; Kabisch, N.; Larondelle, N.; Rall, E.L.; Voigt, A.; et al. Key Insights for the Future of Urban Ecosystem Services Research. Ecol. Soc. 2016, 21, 29. [Google Scholar] [CrossRef]
  19. Włodarczyk-Marciniak, R.; Sikorska, D.; Krauze, K. Residents’ Awareness of the Role of Informal Green Spaces in a Post-Industrial City, with a Focus on Regulating Services and Urban Adaptation Potential. Sustain. Cities Soc. 2020, 59, 102236. [Google Scholar] [CrossRef]
  20. Miao, X.; Pan, Y.; Chen, H.; Zhang, M.J.; Hu, W.; Li, Y.; Wu, R.; Wang, P.; Fang, S.; Niu, K.; et al. Understanding Spontaneous Biodiversity in Informal Urban Green Spaces: A Local-Landscape Filtering Framework with a Test on Wall Plants. Urban For. Urban Green. 2023, 86, 127996. [Google Scholar] [CrossRef]
  21. Henne, S.K. “New Wilderness” as an Element of the Peri-Urban Landscape. In Wild Urban Woodlands: New Perspectives for Urban Forestry; Springer: Berlin/Heidelberg, Germany, 2005; pp. 247–262. [Google Scholar] [CrossRef]
  22. Pietrzyk-Kaszyńska, A.; Czepkiewicz, M.; Kronenberg, J. Eliciting Non-Monetary Values of Formal and Informal Urban Green Spaces Using Public Participation GIS. Landsc. Urban Plan. 2017, 160, 85–95. [Google Scholar] [CrossRef]
  23. Kendal, D.; Ford, R.M.; Anderson, N.M.; Farrar, A. The VALS: A New Tool to Measure People’s General Valued Attributes of Landscapes. J. Environ. Manag. 2015, 163, 224–233. [Google Scholar] [CrossRef]
  24. Zhang, B.; Xie, G.; Gao, J.; Yang, Y. The Cooling Effect of Urban Green Spaces as a Contribution to Energy-Saving and Emission-Reduction: A Case Study in Beijing, China. Build. Environ. 2014, 76, 37–43. [Google Scholar] [CrossRef]
  25. Tveit, M.; Ode, Å.; Fry, G. Key Concepts in a Framework for Analysing Visual Landscape Character. Landsc. Res. 2006, 31, 229–255. [Google Scholar] [CrossRef]
  26. Ode, Å.; Fry, G.; Tveit, M.S.; Messager, P.; Miller, D. Indicators of Perceived Naturalness as Drivers of Landscape Preference. J. Environ. Manag. 2009, 90, 375–383. [Google Scholar] [CrossRef] [PubMed]
  27. Rink, D.; Emmrich, R. Surrogate Nature or Wilderness? Social Perceptions and Notions of Nature in an Urban Context. In Wild Urban Woodlands: New Perspectives for Urban Forestry; Springer: Berlin/Heidelberg, Germany, 2005; pp. 67–80. [Google Scholar] [CrossRef]
  28. Kerebel, A.; Gélinas, N.; Déry, S.; Voigt, B.; Munson, A. Landscape Aesthetic Modelling Using Bayesian Networks: Conceptual Framework and Participatory Indicator Weighting. Landsc. Urban Plan. 2019, 185, 258–271. [Google Scholar] [CrossRef]
  29. Carver, S.; Comber, A.; McMorran, R.; Nutter, S. A GIS Model for Mapping Spatial Patterns and Distribution of Wild Land in Scotland. Landsc. Urban Plan. 2012, 104, 395–409. [Google Scholar] [CrossRef]
  30. Müller, A.; Bøcher, P.K.; Svenning, J.C. Where Are the Wilder Parts of Anthropogenic Landscapes? A Mapping Case Study for Denmark. Landsc. Urban Plan. 2015, 144, 90–102. [Google Scholar] [CrossRef]
  31. Yang, C.; He, X.; Wang, R.; Yan, F.; Yu, L.; Bu, K.; Yang, J.; Chang, L.; Zhang, S. The Effect of Urban Green Spaces on the Urban Thermal Environment and Its Seasonal Variations. Forests 2017, 8, 153. [Google Scholar] [CrossRef]
  32. Zhu, X.; Wang, X.; Yan, D.; Liu, Z.; Zhou, Y. Analysis of Remotely-Sensed Ecological Indexes’ Influence on Urban Thermal Environment Dynamic Using an Integrated Ecological Index: A Case Study of Xi’an, China. Int. J. Remote Sens. 2019, 40, 3421–3447. [Google Scholar] [CrossRef]
  33. Sun, X.; Tan, X.; Chen, K.; Song, S.; Zhu, X.; Hou, D. Quantifying Landscape-Metrics Impacts on Urban Green-Spaces and Water-Bodies Cooling Effect: The Study of Nanjing, China. Urban For. Urban Green. 2020, 55, 126838. [Google Scholar] [CrossRef]
  34. Hauser, L.T.; Féret, J.B.; Binh, N.A.; van der Windt, N.; Sil, Â.F.; Timmermans, J.; Soudzilovskaia, N.A.; van Bodegom, P.M. Towards Scalable Estimation of Plant Functional Diversity from Sentinel-2: In-Situ Validation in a Heterogeneous (Semi-)Natural Landscape. Remote Sens. Environ. 2021, 262, 112505. [Google Scholar] [CrossRef]
  35. Statistics Poland—Local Data Bank. Statistics Poland, Warsaw. Available online: https://bdl.stat.gov.pl (accessed on 4 February 2025).
  36. Florgård, C. Preserved and Remnant Natural Vegetation in Cities: A Geographically Divided Field of Research. Landsc. Res. 2007, 32, 79–94. [Google Scholar] [CrossRef]
  37. EarthExplorer Data Platform. U.S. Geological Survey. Available online: https://earthexplorer.usgs.gov (accessed on 4 February 2025).
  38. Landsat 8|U.S. Geological Survey. Available online: https://www.usgs.gov/core-science-systems/nli/landsat/landsat-8 (accessed on 4 February 2025).
  39. Catalyst.Earth Catalyst Professional: ATCOR Module. Catalyst Geospatial Software. Available online: https://catalyst.earth/products/catalyst-pro/ (accessed on 4 February 2025).
  40. Zevenbergen, L.W.; Thorne, C.R. Quantitative Analysis of Land Surface Topography. Earth Surf. Process. Landf. 1987, 12, 47–56. [Google Scholar] [CrossRef]
  41. Copernicus. Urban Atlas 2018. Copernicus Land Monitoring Service. Available online: https://land.copernicus.eu/local/urban-atlas (accessed on 4 February 2025).
  42. Ode, Å.; Tveit, M.; Fry, G. Capturing Landscape Visual Character Using Indicators: Touching Base with Landscape Aesthetic Theory. Landsc. Res. 2008, 33, 89–117. [Google Scholar] [CrossRef]
  43. Feltynowski, M.; Kronenberg, J.; Bergier, T.; Kabisch, N.; Łaszkiewicz, E.; Strohbach, M.W. Challenges of Urban Green Space Management in the Face of Using Inadequate Data. Urban For. Urban Green. 2018, 31, 56–66. [Google Scholar] [CrossRef]
  44. Matuszkiewicz, J.M. Potencjalna Roślinność Naturalna Polski (Potential Natural Vegetation of Poland); IGiPZ PAN: Warszawa, Poland, 2008. [Google Scholar]
  45. Ashihara, Y. Exterior Design in Architecture; Van Nostrand Reinhold Company: New York, NY, USA, 1970. [Google Scholar]
  46. Bogdanowski, J.; Łuczyńska-Bruzda, M.; Novák, Z. Architektura Krajobrazu (Landscape Architecture); PWN: Warszawa/Kraków, Poland, 1979. [Google Scholar]
  47. Müller, A.; Bøcher, P.K.; Fischer, C.; Svenning, J.C. ‘Wild’ in the City Context: Do Relative Wild Areas Offer Opportunities for Urban Biodiversity? Landsc. Urban Plan. 2018, 170, 256–265. [Google Scholar] [CrossRef]
  48. Rouse, J.W., Jr.; Haas, R.H.; Deering, D.W.; Schell, J.A.; Harlan, J.C. Monitoring the Vernal Advancement and Retrogradation (Green Wave Effect) of Natural Vegetation; Remote Sensing Center, Texas A&M University: College Station, TX, USA, 1974. [Google Scholar]
  49. Kimm, H.; Ryu, Y. Seasonal Variations in Photosynthetic Parameters and Leaf Area Index in an Urban Park. Urban For. Urban Green. 2015, 14, 1059–1067. [Google Scholar] [CrossRef]
  50. Wang, Q.; Adiku, S.; Tenhunen, J.; Granier, A. On the Relationship of NDVI with Leaf Area Index in a Deciduous Forest Site. Remote Sens. Environ. 2005, 94, 244–255. [Google Scholar] [CrossRef]
  51. Boegh, E.; Soegaard, H.; Broge, N.; Schelde, K.; Thomsen, A.; Hasager, C.B.; Jensen, N.O. Airborne Multispectral Data for Quantifying Leaf Area Index, Nitrogen Concentration, and Photosynthetic Efficiency in Agriculture. Remote Sens. Environ. 2002, 81, 179–193. [Google Scholar] [CrossRef]
  52. Öpik, H.; Rolfe, S.A.; Willis, A.J. The Physiology of Flowering Plants. In The Physiology of Flowering Plants, 4th ed.; Cambridge University Press: Cambridge, UK, 2005; pp. 1–392. [Google Scholar] [CrossRef]
  53. Jenerette, G.D.; Harlan, S.L.; Stefanov, W.L.; Martin, C.A. Ecosystem Services and Urban Heat Riskscape Moderation: Water, Green Spaces, and Social Inequality in Phoenix, USA. Ecol. Appl. 2011, 21, 2637–2651. [Google Scholar] [CrossRef] [PubMed]
  54. Shi, D.; Song, J.; Huang, J.; Zhuang, C.; Guo, R.; Gao, Y. Synergistic Cooling Effects (SCEs) of Urban Green-Blue Spaces on Local Thermal Environment: A Case Study in Chongqing, China. Sustain. Cities Soc. 2020, 55, 102065. [Google Scholar] [CrossRef]
  55. Inostroza, L. Open Spaces and Urban Ecosystem Services. Cooling Effect towards Urban Planning in South American Cities. TeMA—J. Land Use Mobil. Environ. 2014. Available online: https://www.researchgate.net/publication/307782613_Open_Spaces_and_Urban_Ecosystem_Services_Cooling_Effect_towards_Urban_Planning_in_South_American_Cities (accessed on 4 February 2025).
Figure 1. A map of the study area with surveyed sites and the borders of Lublin, and a map of the landforms and temperature differences.
Sustainability 17 01349 g001
Figure 2. Part of the city map showing surveyed areas with their 300-metre buffers, built-up land in the buffer, and a map of the landforms and temperature differences.
Sustainability 17 01349 g002
Figure 3. Examples of ENPs: (a) No. 11, natural meanders of the Bystrzyca river; (b) No. 39, an active gorge with burrows of foxes; (c) No. 31, ‘Lipnik’, a semi-natural valley amid farmland; (d) No. 6, an inaccessible escarpment of the ‘Czwartek’ Hill; (e) No. 47, a steep embankment of the Bystrzyca river in Łysaków; (f) No. 54, a cove of the Zemborzycki Lake; (g) No. 26, a holweg in Trześniów; and (h) No. 22, a pond at ‘Zemborzyckie Meadows at Wrotków’ (photo by the authors and R. Junko).
Sustainability 17 01349 g003
Table 1. Contents of the evaluation sheet.
Parameter
ENP surfacem2
Surface of the bufferm2
Built-up land in the buffer%
Naturalness5–1
Landscape contrast5–1
Uniqueness5–1
Main landform typeF—flat; S—slope; G—gorge; V—valley; B—valley bottom; E—escarpment;
P—plateau; H—hill
Main type of landcoverT—trees; S—shrubs; H—grass/herbaceous; M—mixed
Landscape compositionE—enclosure; M—massif; X—exposed;
U—unclear
% of enclosure%
Number of human artefacts in sight+/−
Interesting landform+/−
Presence of water+/−
Distant view+/−
Diversity of plant forms+/−
Diversity of plans height+/−
Presence of old trees+/−
Screened-off, hidden place+/−
“Visual access” from the outside+/−
Usage5—none; 4—single path; 3—single road;
2—several paths; 1—dense path network
Name
General expert assessment1–5
Table 2. Examples of research sites with description of expert assessment ratings.
Image of Research SiteNo. and Description
Sustainability 17 01349 i001
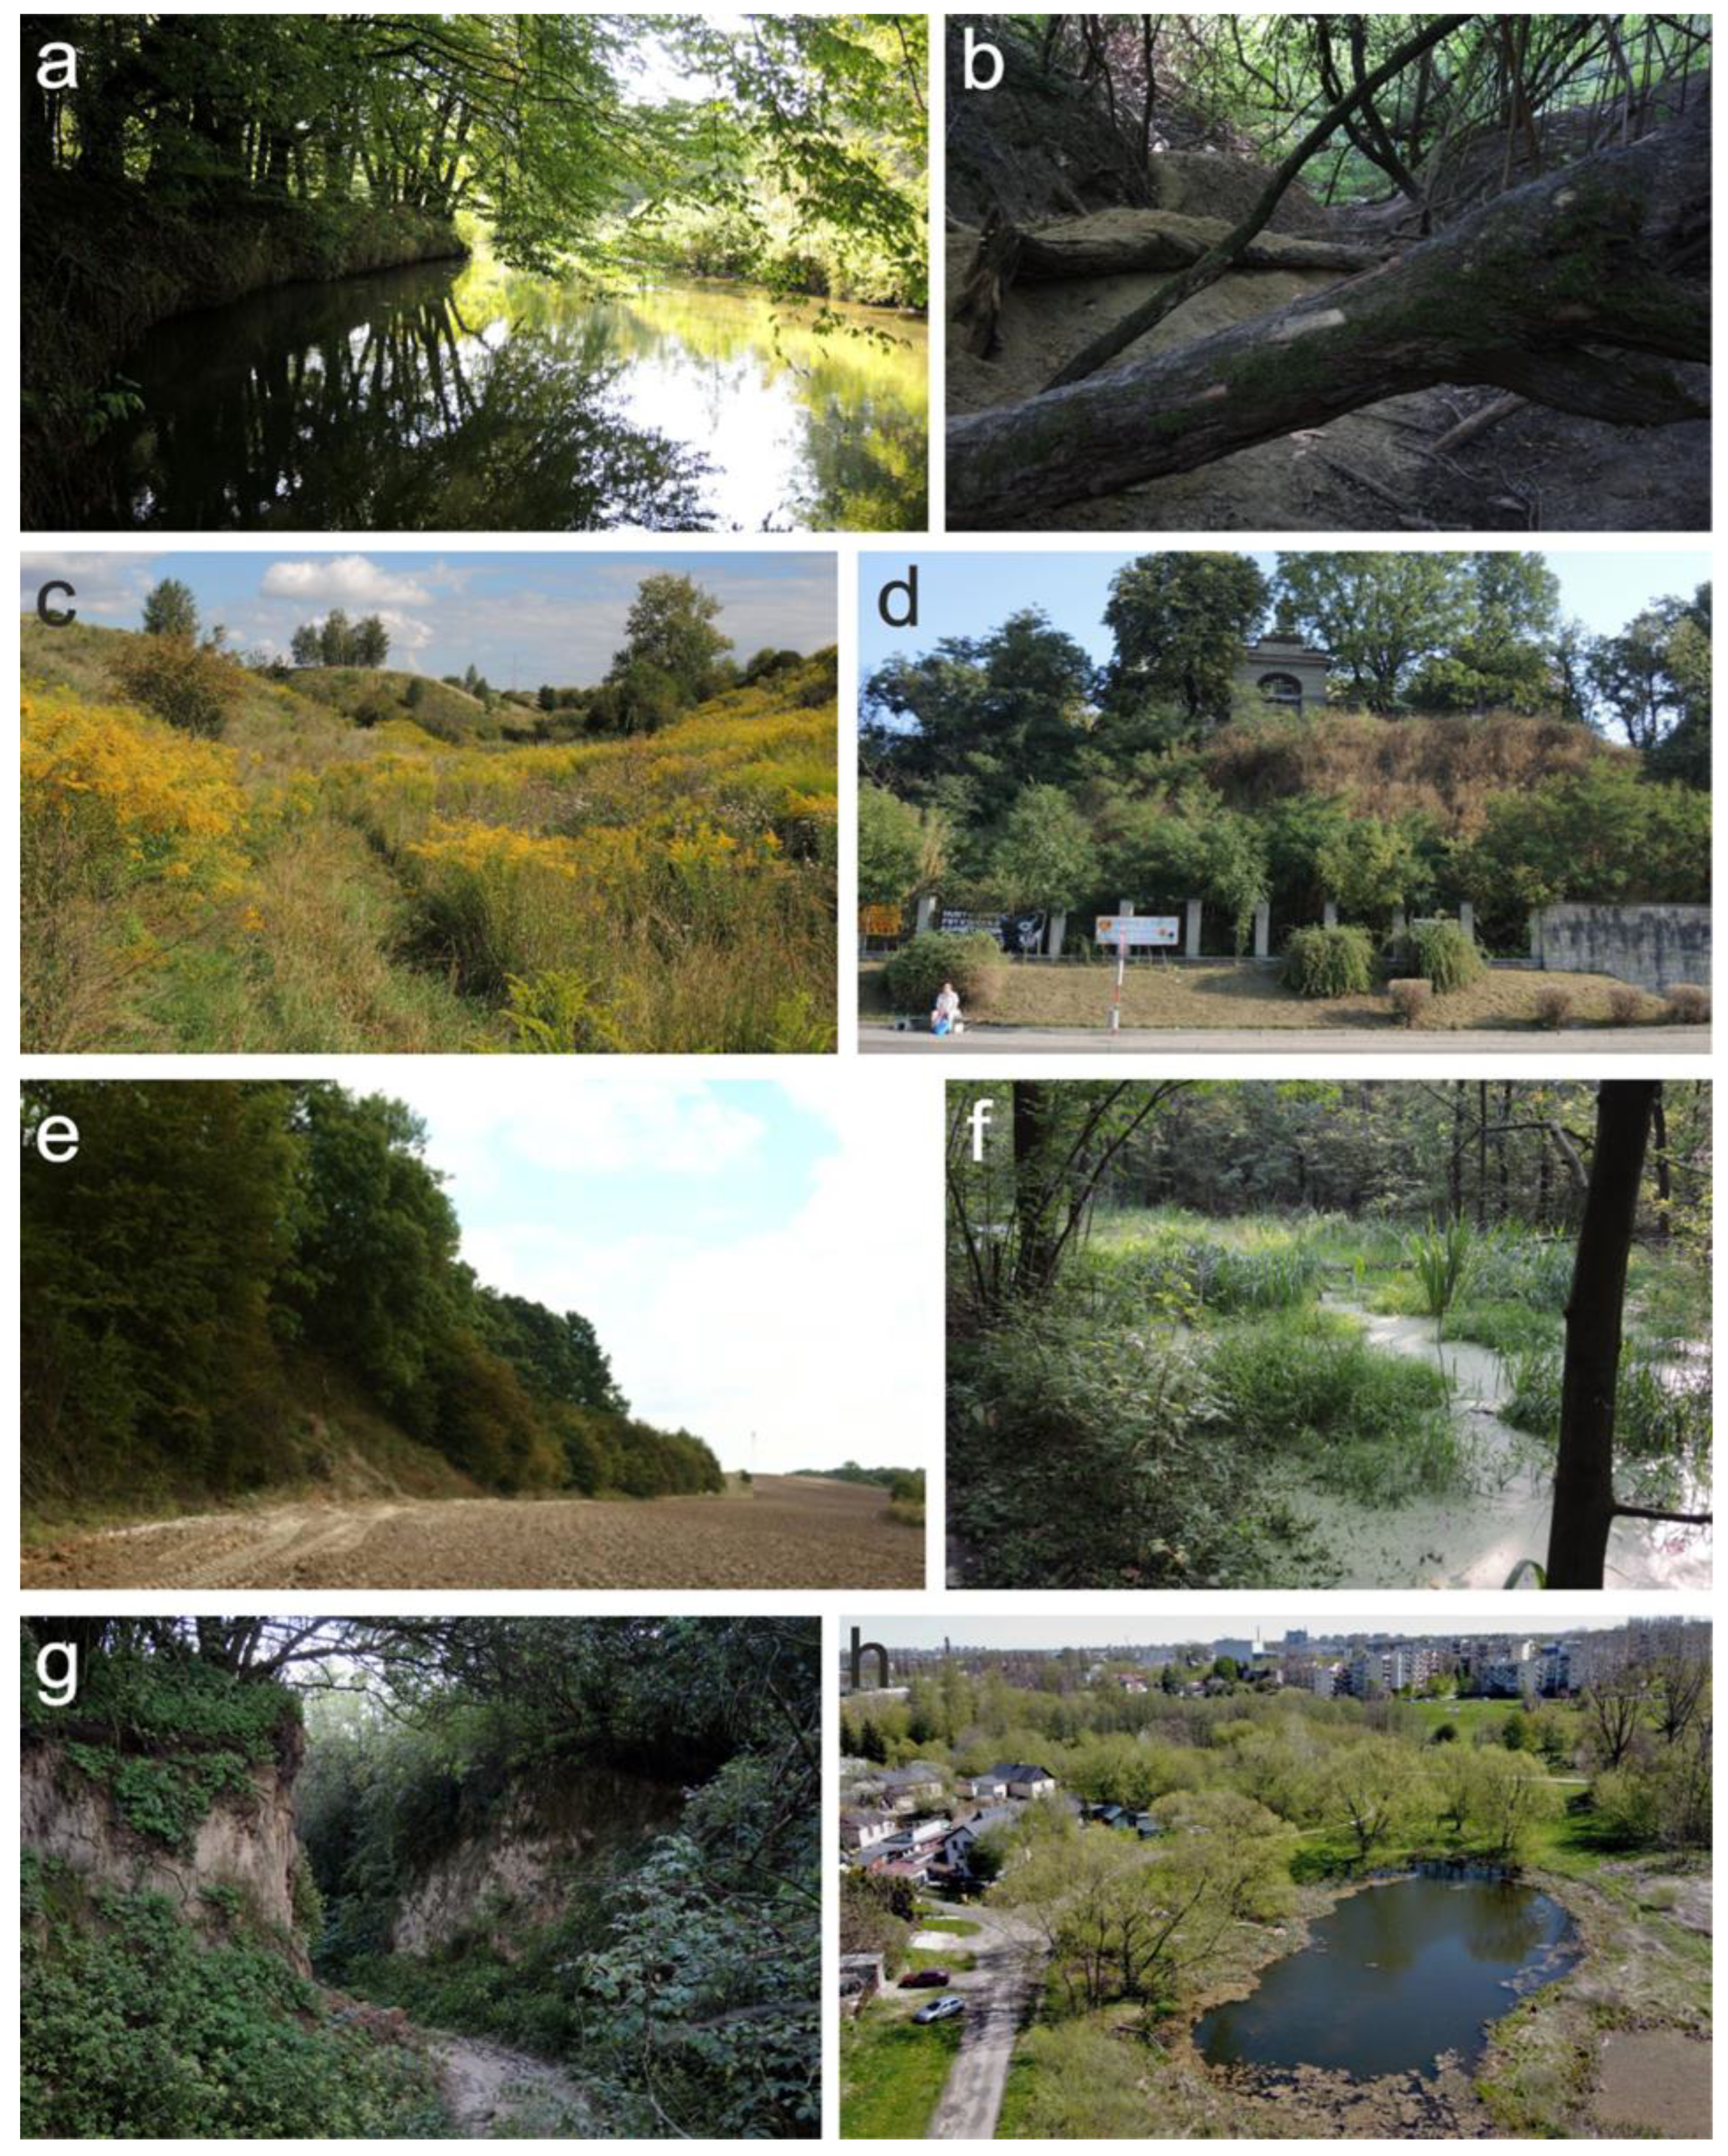
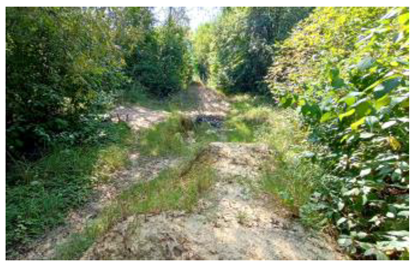
19. Gorge beside Szczytowa Str.
Unique small loess gorge; with water erosion; closely surrounded by dense housing estate.
Expert assessment: general—5; naturalness—4; uniqueness—5; landscape contrast—5; buildings in buffer—73.8%; enclosure—100%; low number of human artefacts in sight; interesting landform; diversity of plant forms; diversity of plants height; screened-off/hidden place; usage—5 (none); example of ENP.
Sustainability 17 01349 i00214. Gorge beside Uśmiechu Str.
Gorge; partly changed by earthworks; occasionally mowed; surrounded by housing estate.
Expert assessment: general—4; naturalness—3; uniqueness—4; landscape contrast—4; buildings in buffer—53.4%; enclosure—75%; low number of human artefacts in sight; interesting landform; diversity of plant forms; diversity of plants height; visual access from outside; usage—4 (single path); example of ENP.
Sustainability 17 01349 i00332. Planned park beside Gnieźnieńska Str.
Area spontaneously covered by dense trees and shrubs, with informal pathways and constructions for trail bikes.
Expert assessment: general—3; naturalness—3; uniqueness—1; landscape contrast—5; buildings in buffer—80.1%; massif; diversity of plant forms; diversity of plants height; screened-off/hidden place; usage—2 (several paths); example of ENP.
Sustainability 17 01349 i004
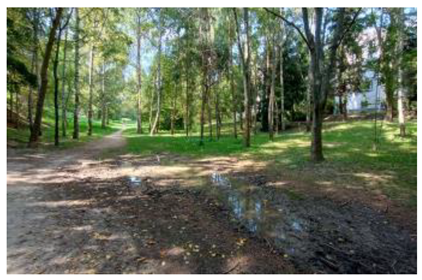
78. Valley “Globus”
Dry valley, covered by trees, with small number of shrubs; regularly mowed; closely surrounded by housing estate; buildings are well visible from the site; occasionally wet.
Expert assessment: general—2; naturalness—2; uniqueness—4; landscape contrast—5; buildings in buffer—81.7%; enclosure—75%; interesting landform; diversity of plants height; usage—3 (single road); some features of ENPs.
Sustainability 17 01349 i005
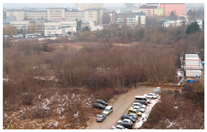
64. Shrubs close to Hospital No. 4
Flat area, covered by shrubs and small trees; surrounded by hospital buildings; buildings are very visible from the site.
Expert assessment: general—1; naturalness—3; uniqueness—1; landscape contrast—5; buildings in buffer—77.7%; massif; diversity of plants height; visual access from outside; usage—2 (several paths); some features of ENPs.
Table 3. Quantitative summary of the sites that received expert assessments.
Number of Sites
GradeGeneral Assessment
(Surface)
NaturalnessLandscape ContrastUniqueness
ENP523 (278.3 ha)32217
ENP421 (236 ha)253818
ENP317 (58.4 ha)442120
Not ENP221 (43.8 ha)1986
Not ENP19 (18.4 ha)0230
All 91 (634.9 ha)
Disclaimer/Publisher’s Note: The statements, opinions and data contained in all publications are solely those of the individual author(s) and contributor(s) and not of MDPI and/or the editor(s). MDPI and/or the editor(s) disclaim responsibility for any injury to people or property resulting from any ideas, methods, instructions or products referred to in the content.

