1. Introduction
Tank vehicles are widely used for liquid cargo road transport. Due to their large load capacity, high center of mass, and the presence of lateral liquid slosh, these vehicles have poor roll stability. Statistics show that rollover accidents accounted for approximately 45% of all road transport accidents involving hazardous chemicals in recent years [
1]. Mountain highways are more prone to traffic accidents because of their complex geometric alignment. Annual traffic accident statistics reveal that the accident rate on mountain highways is significantly higher than that in flat areas, with major traffic accidents accounting for more than 60% of the total. This is especially true on challenging road sections such as sharp curves and steep slopes, where the traffic environment is more complex, and accidents occur frequently. Given the uneven distribution of hazardous chemical production and consumption areas in China, coupled with the high volume and long-distance transportation, it is crucial to assess the risks associated with transportation routes and improve the safety of hazardous chemical transport. Since tank vehicles face the highest risk of overturning in curved–slope combination sections, evaluating the rollover risk of tank vehicles in these sections is vital for ensuring the sustainability of the transportation system, protecting the environment, and ensuring public safety.
Transportation risk assessment based on historical accident data is one of the most widely used methods. Some researchers developed accident models that estimate the expected accident probability on road segments using parameters such as Average Annual Daily Traffic (AADT), curvature, tangent length, cross-section, and the Road Side Hazard rating derived from long-term accident statistics [
2,
3,
4]. Other studies incorporated weather conditions into their models, considering the combined effects of highway geometry, traffic characteristics, and weather conditions, as well as the interactions between these factors on accident occurrence [
5,
6,
7]. Additionally, some researchers took human factors into account. For example, Fornalchyk et al. investigated the probability of safe operation by drivers under different road conditions, examining how road geometric characteristics and traffic flow influence the driver’s operational reliability and, based on this, examined the risk of dangerous cargo transportation under various traffic conditions [
8]. Janno and Koppel developed a framework for assessing the risk of dangerous goods transportation based on surveys and interviews with parties in the dangerous goods transport chain. Other researchers have used a combination of expert ratings and survey data to model transportation risk assessment [
9]. Branko Milovanović determined the variables and their weights affecting the probability and consequences of accidents through expert scoring and long-term accident investigation data, allowing for the quantification of transportation risk and the definition of risk levels [
10]. However, transportation risk assessment based on historical accident data requires a substantial amount of accident data, making it unsuitable for road sections with incomplete statistical data and introducing a degree of subjectivity into the results.
In addition, some scholars conducted rollover risk assessments of tank vehicles based on vehicle dynamics models. For example, Sun et al. employed Carsim to construct a closed-loop simulation model of the driver–vehicle–road system, studying the impact of factors such as pavement roughness and settlement difference on the pavement on vehicle rollover risk [
11]. Other studies explored the influence of various roadway factors on vehicle rollover risk. Dabbour et al., for instance, utilized simulation software to assess the driving stability of trucks on different routes [
12]. Their research aimed to determine the minimum curve radius required for horizontal reverse curves on highways to prevent vehicle rollovers. In addition to considering the lateral stability of vehicles on horizontal curves, other researchers also incorporated factors like the road’s longitudinal gradient and superelevation into their analyses [
13,
14,
15]. You and Sun used Matlab/Simulink to develop a closed-loop dynamic simulation model for driver–vehicle–road interactions, taking into account a three-dimensional (3D) alignment to analyze vehicle stability on combined horizontal and vertical curves [
16]. The performance functions based on vehicle dynamics simulation considering skidding and rollover failures were established, integrating the effects of road curvature, gradient, superelevation, and vehicle operating speed. DU et al. established a safety model based on the vehicle–road coordination with the critical state of an accident as a boundary condition by analyzing the vehicle stability on horizontal–vertical combination curves [
17]. The model also comprehensively considered the effects of road curvature, gradient, slope length, superelevation, and vehicle operating speed on vehicle stability. Torbic et al. used actual collected data, such as vehicle operating speed and traffic frequency, to simulate vehicle dynamics on road alignments that met design requirements and studied the rollover safety factor of the vehicle on curved–slope combination road sections [
18]. Many scholars explored the combined effects of various roadway factors and vehicle operating speed on rollover risk [
19,
20,
21]. Additionally, some researchers focused on the impact of vehicle configuration on the likelihood of rollover [
22,
23]. The study by Alrejjal and Ksaibati considered the effects of vehicle and roadway factors on truck rollover risk. The study used Trucksim to simulate vehicle dynamics to study the rollover tendency of trucks under different configurations (total truck weight, center of gravity height, vehicle operating speed) on various geometric roads [
24]. The studies on vehicle rollover risk assessment through the establishment of risk evaluation models primarily focus on vehicles and trucks. In research concerning the rollover risk assessment of tank vehicles, most scholars considered the effects of vehicle configuration, speed, and steering angle. For example, Rakheja and Ranganathan simulated rollover thresholds for vehicles loaded with liquid cargo by modeling tank vehicles in simulation software, considering the impact of the weight of the loaded cargo on the risk of vehicle rollover [
25]. Simulation research based on vehicle dynamics models is more objective in assessing rollover risk; however, current studies on the rollover risk of tank vehicles using dynamic simulation rarely comprehensively consider the influence of roadway geometry and loading conditions. The combination of various factors and levels is not fully explored. The existing research primarily focuses on the theoretical analysis of the rollover risk associated with tank vehicles, with limited applicability in practical scenarios.
The verification of the tank vehicle’s driving simulation, based on lateral liquid sloshing equivalently described by the trammel pendulum and the coupling relationship between liquid sloshing and vehicle driving, is discussed in references [
26,
27]. Since the purpose of this paper is to evaluate the rollover risk of tank vehicles on curved–slope combination sections and to comprehensively consider and quantify the influence of roadway geometry and vehicle loading conditions on this risk, the verification of previously conducted driving simulations was not included in this text. Additionally, due to the significant dangers of on-road experiments, the difficulty of precisely controlling variables, and the challenge of accounting for extreme cases, this study employed simulation experiments as the research method. To achieve the objectives of this study, high-intensity orthogonal experiments were designed, and Trucksim and Simulink software were used to establish a driver–vehicle–road closed-loop dynamic model. The rollover risk index of the tank vehicle under different road and loading conditions was obtained through simulation experiments. The influence of various factors on rollover risk was analyzed, and to address the issue of poor applicability in previous studies on the rollover risk of tank vehicles, a multiple linear regression model for tank vehicles’ rollover risk was developed. Transport organizations can apply the findings of this study to calculate the rollover risk of tank vehicles traveling on different routes before transportation. By selecting routes with lower risk indices, the probability of tank vehicle rollover accidents can be effectively reduced. Additionally, the results of this study can assist in determining more appropriate speed limits for curved–slope combination sections based on the configuration of the tank vehicle. This is of significant importance for improving the safety of tank vehicle transportation.
3. Simulation Environment and Condition Configuration
3.1. Simulation Environment
With the help of Trucksim and Simulink, the tank vehicle model, driver model, and road model were built to obtain the driver–vehicle–road closed-loop dynamics system, allowing the tank vehicle to drive on various curved–slope combination sections with different loading conditions and vehicle operating speeds.
3.1.1. Tank Vehicle’s Dynamic Model
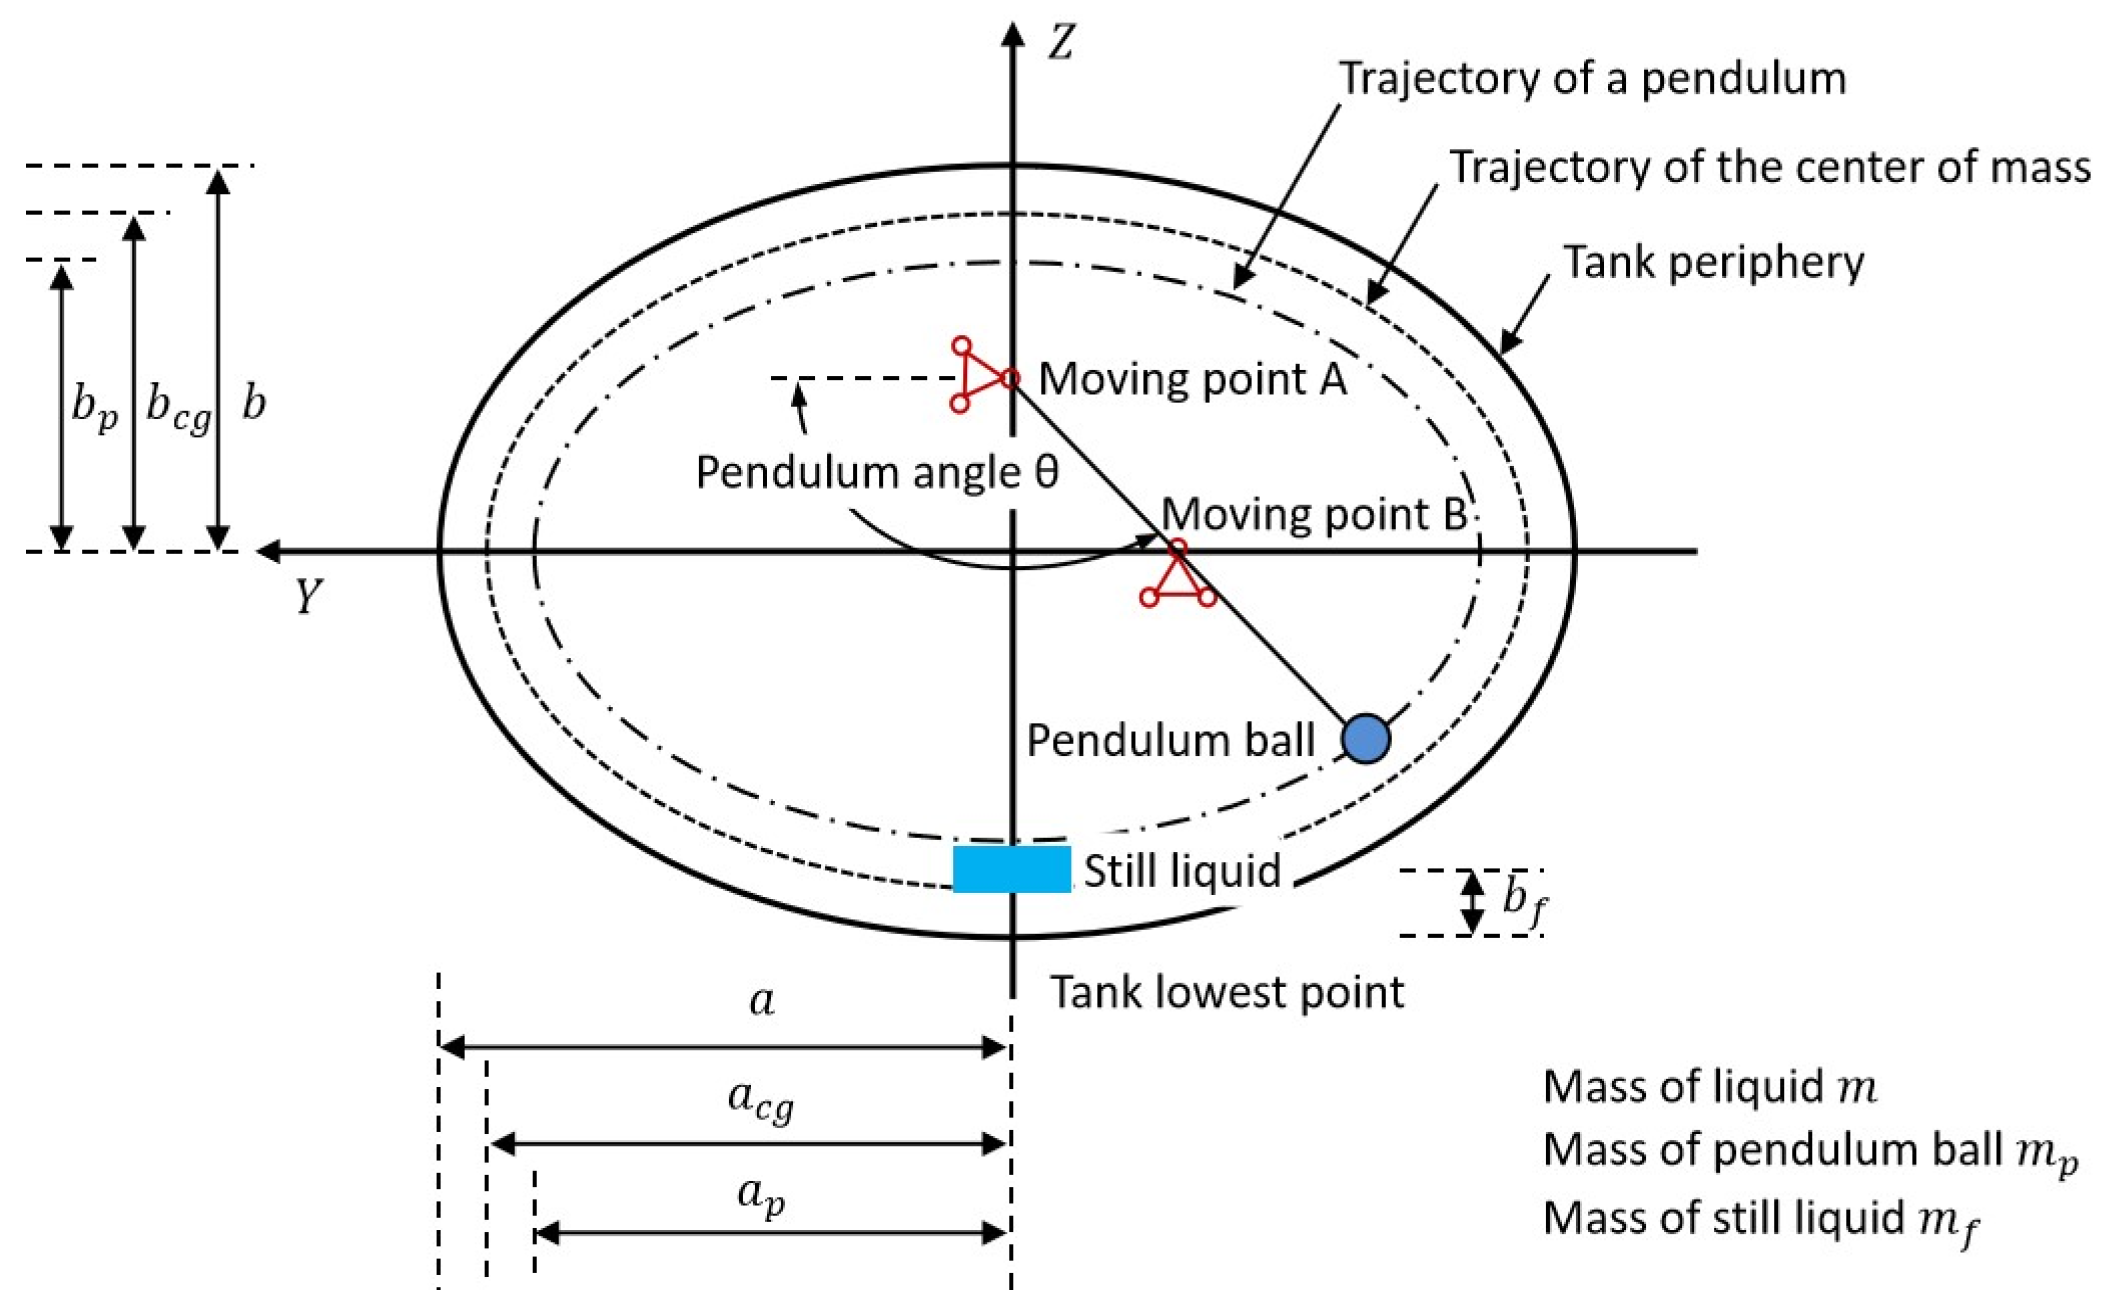
Lateral liquid sloshing in partially filled tanks has a significant impact on vehicle roll stability. Li X. et al. found that the liquid mass in the tank can be divided into the static liquid mass and the sloshing part [
26,
27,
29]. The static liquid mass can be treated as solid cargo; it does not move relative to the vehicle. The sloshing part moves periodically relative to the tank; its motion can be simulated well by a trammel pendulum. In this paper, the trammel pendulum model developed in [
26,
29] was used to equivalently describe the lateral liquid sloshing in tanks, as shown in
Figure 2.
The vehicle’s rigid body and the liquid cargo were modeled separately when establishing the dynamic model of a tank vehicle, and the two parts were connected by tank movement and liquid sloshing.
The dynamic model of the vehicle’s rigid body was established in TruckSim. The vehicle has DOFs of longitudinal motion, lateral motion, yaw motion, and roll motion, and the rigid vehicle body is not loaded with liquid cargo.
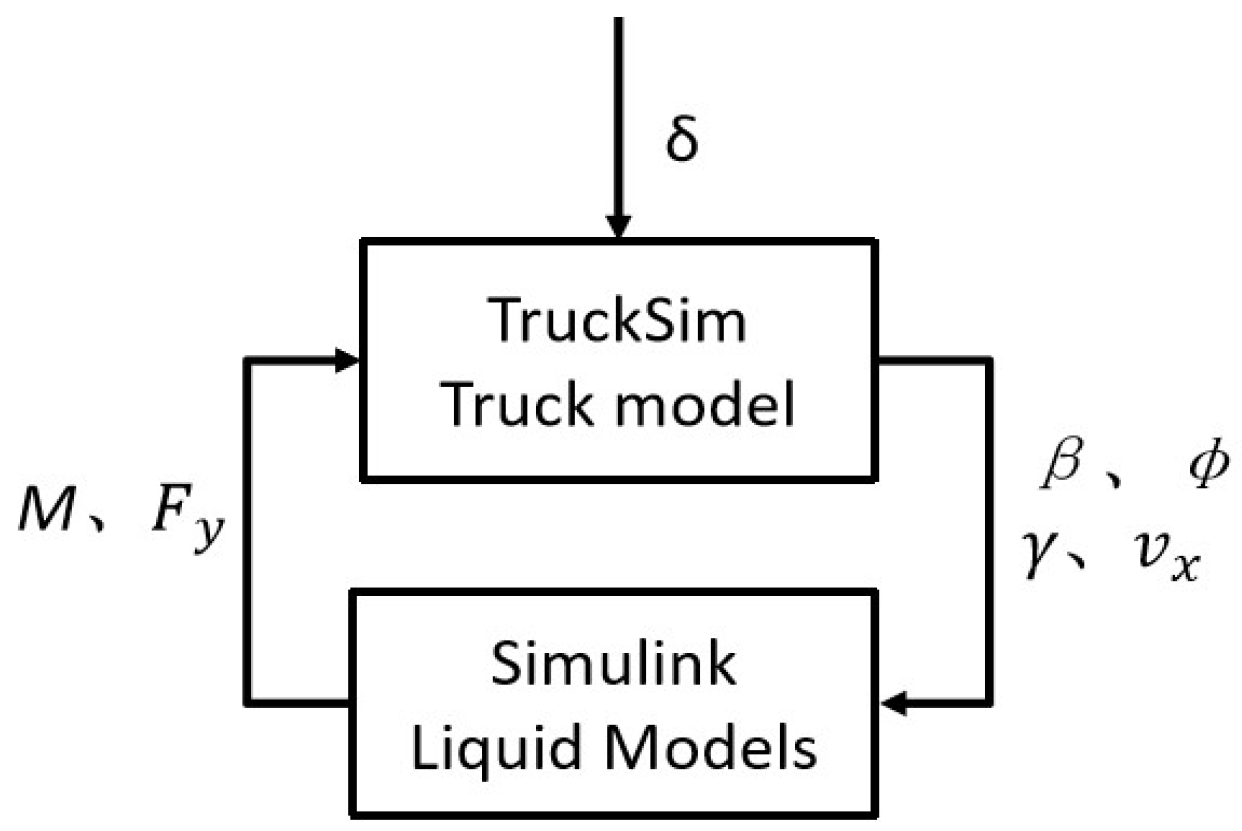
The lateral sloshing of liquid cargo was described using the equivalent trammel pendulum model created in Simulink. The model has inputs that include vehicle sideslip angle β, yaw velocity r, and body roll angle Φ from the rigid body model, and it has liquid sloshing force and torque as outputs. The sloshing force and torque are applied to the cargo center and the bottom center of the tank at the vehicle’s rigid body, respectively.
The vehicle sideslip angle
β, yaw velocity
r, and body roll angle
Φ are obtained in TruckSim by the vehicle’s rigid body model, and liquid sloshing force and torque are obtained by the trammel pendulum in Simulink. The signal communication between the two subsystems is shown in
Figure 3.
3.1.2. Driver Model
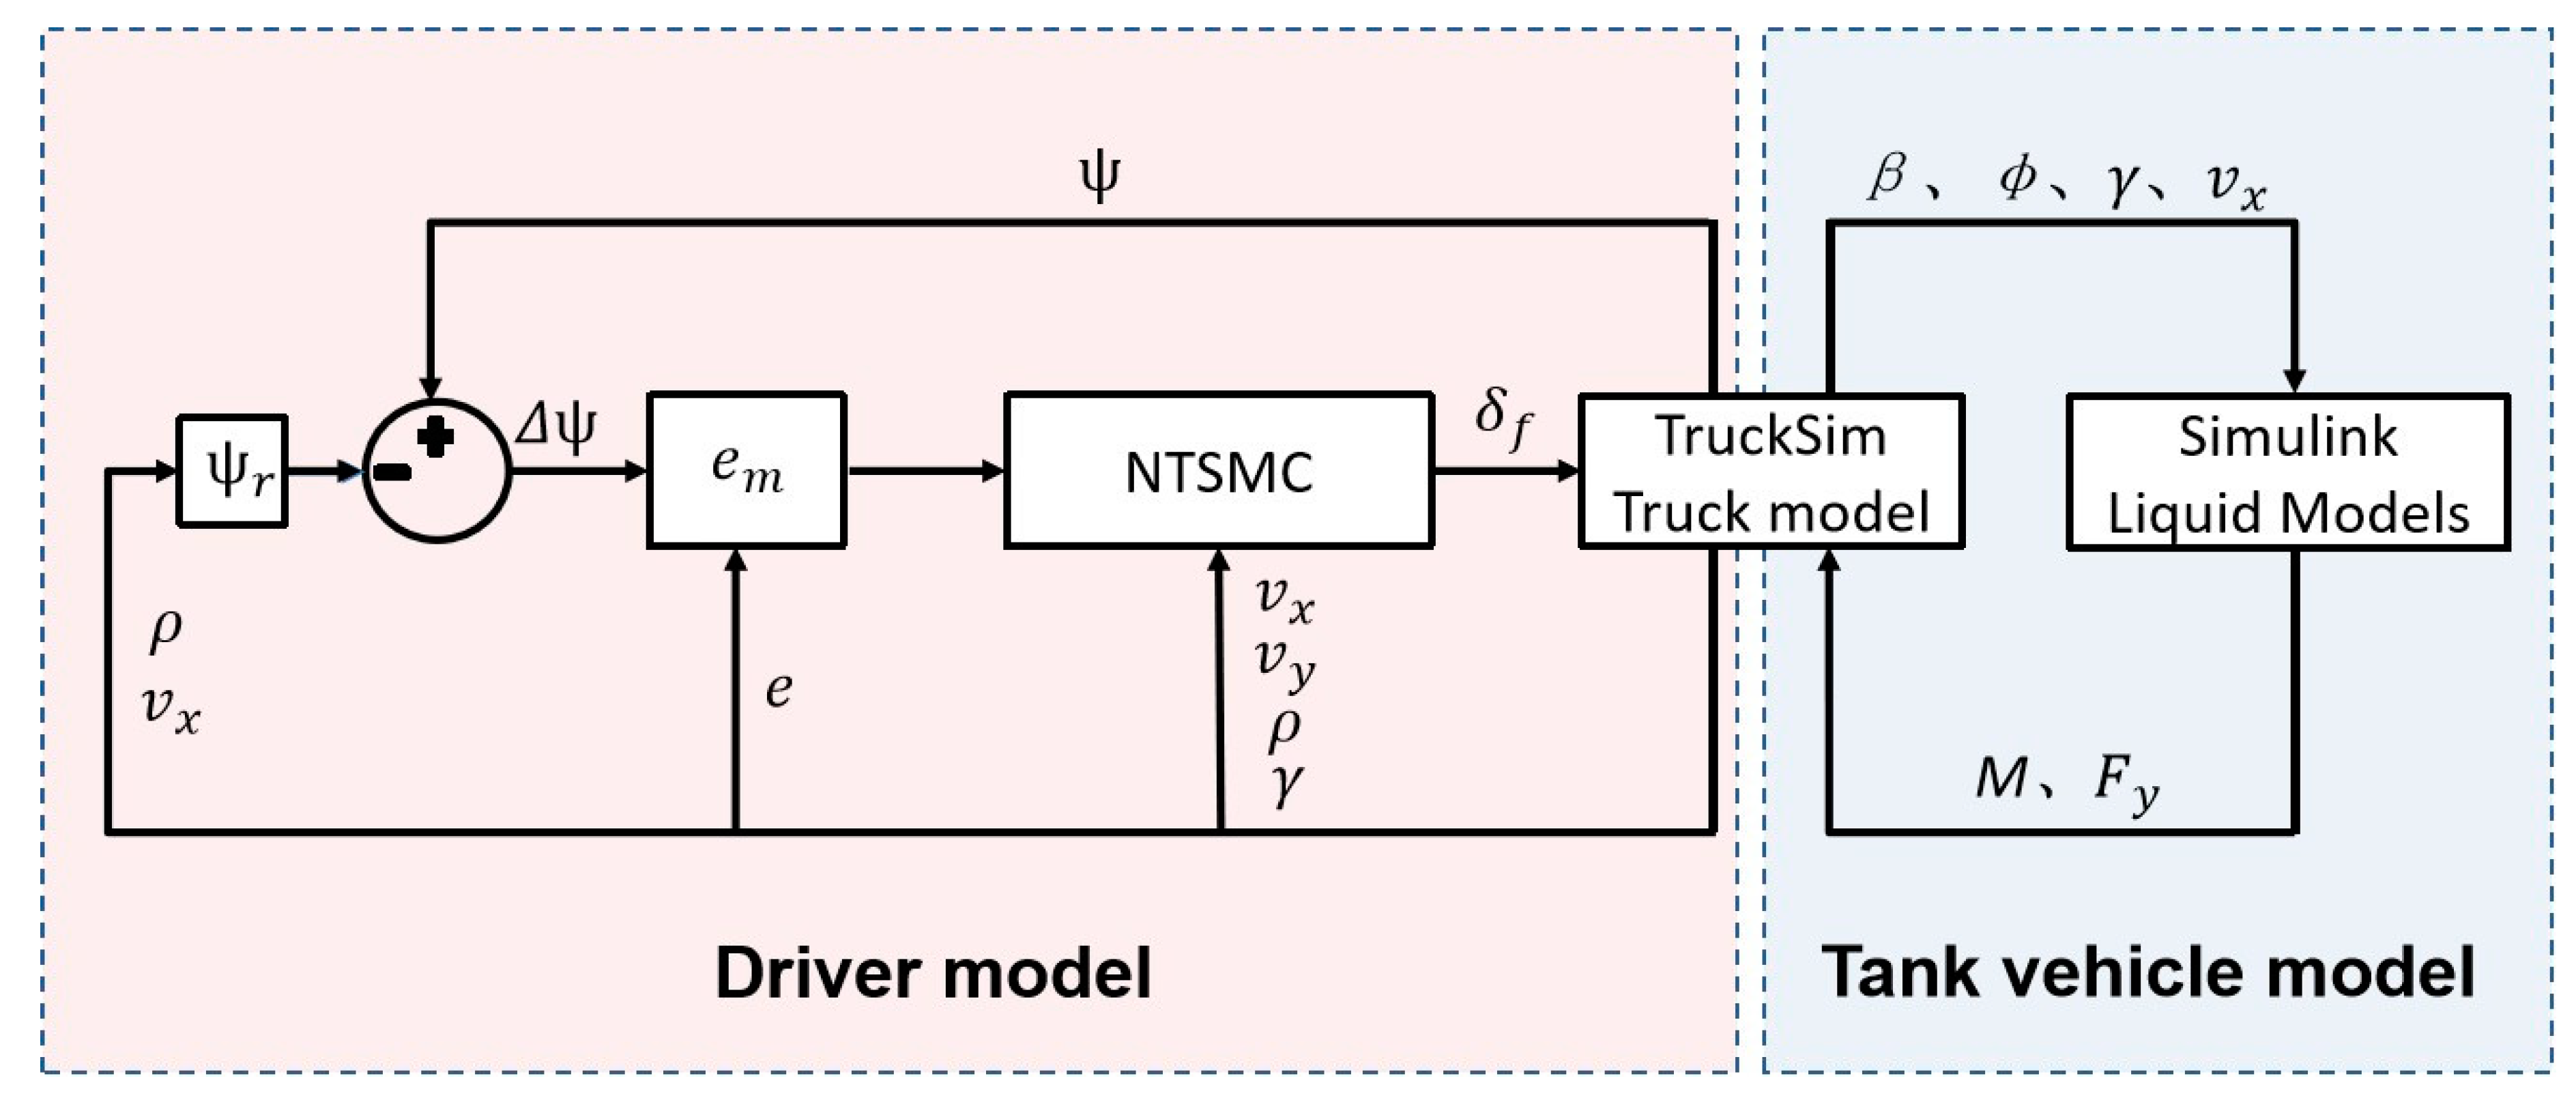
Designing a suitable driver model to control the vehicle’s drive along the expected trajectory is necessary. Due to the large lateral deviation obtained from the driver model planted in Trucksim while the vehicle is driving at high speeds, a sliding mode control method, which is more suitable for high-speed vehicle dynamics, was employed in this paper to establish the driver model. Sliding mode control is unaffected by system parameters, does not require online identification, offers fast response times, and exhibits strong robustness to disturbances and unmodeled dynamics. Feng et al. developed a nonsingular terminal sliding mode control (NTSMC) strategy to mitigate the buffeting effect present in traditional sliding mode control, reduce convergence time, and eliminate singularities, thereby enabling effective vehicle trajectory tracking [
30]. He et al. proposed a unified deviation approach that integrates both lateral deviation and heading angle deviation as control variables, enabling simultaneous control of both [
31]. To reduce buffeting phenomena in the sliding mode control, the hyperbolic tangent function, tanh(s), was used to replace the sign function, sign(s), in the exponential reaching law. The following nonsingular terminal sliding mode controller is obtained:
where
k1 and
k2 are the generalized tire cornering stiffness of the front and rear wheels, respectively;
a and
b are the distances between the mass-center location and front and rear axles, respectively;
xm is the driver’s preview distance;
Iz is the vehicle’s yaw moment of inertia;
is path curvature;
vx is vehicle operating speed;
is a positive number;
p and
q are positive odd numbers greater than 1; and
and
are positive numbers. While
increases,
decrease simultaneously, which helps to accelerate the speed and reduce the buffeting phenomena.
The driver model based on NTSMC was built in Simulink. The signal communication between the driver model and tank vehicle model is shown in
Figure 4.
3.1.3. Road Model
Road alignment was determined by curvature, longitudinal slope, and lateral superelevation. The settings of these three factors are described in Part 4.
3.2. Simulation Conditions
A twin-axle tank vehicle equipped with an elliptical tank was utilized in the driving simulation. The vehicle features a 4 × 2 drive configuration with a two-wheeled rear axle drive. The total length of the vehicle is 8.5 m, the tank length is 5.8 m, and the tank has a 2.5 m2 cross-section.
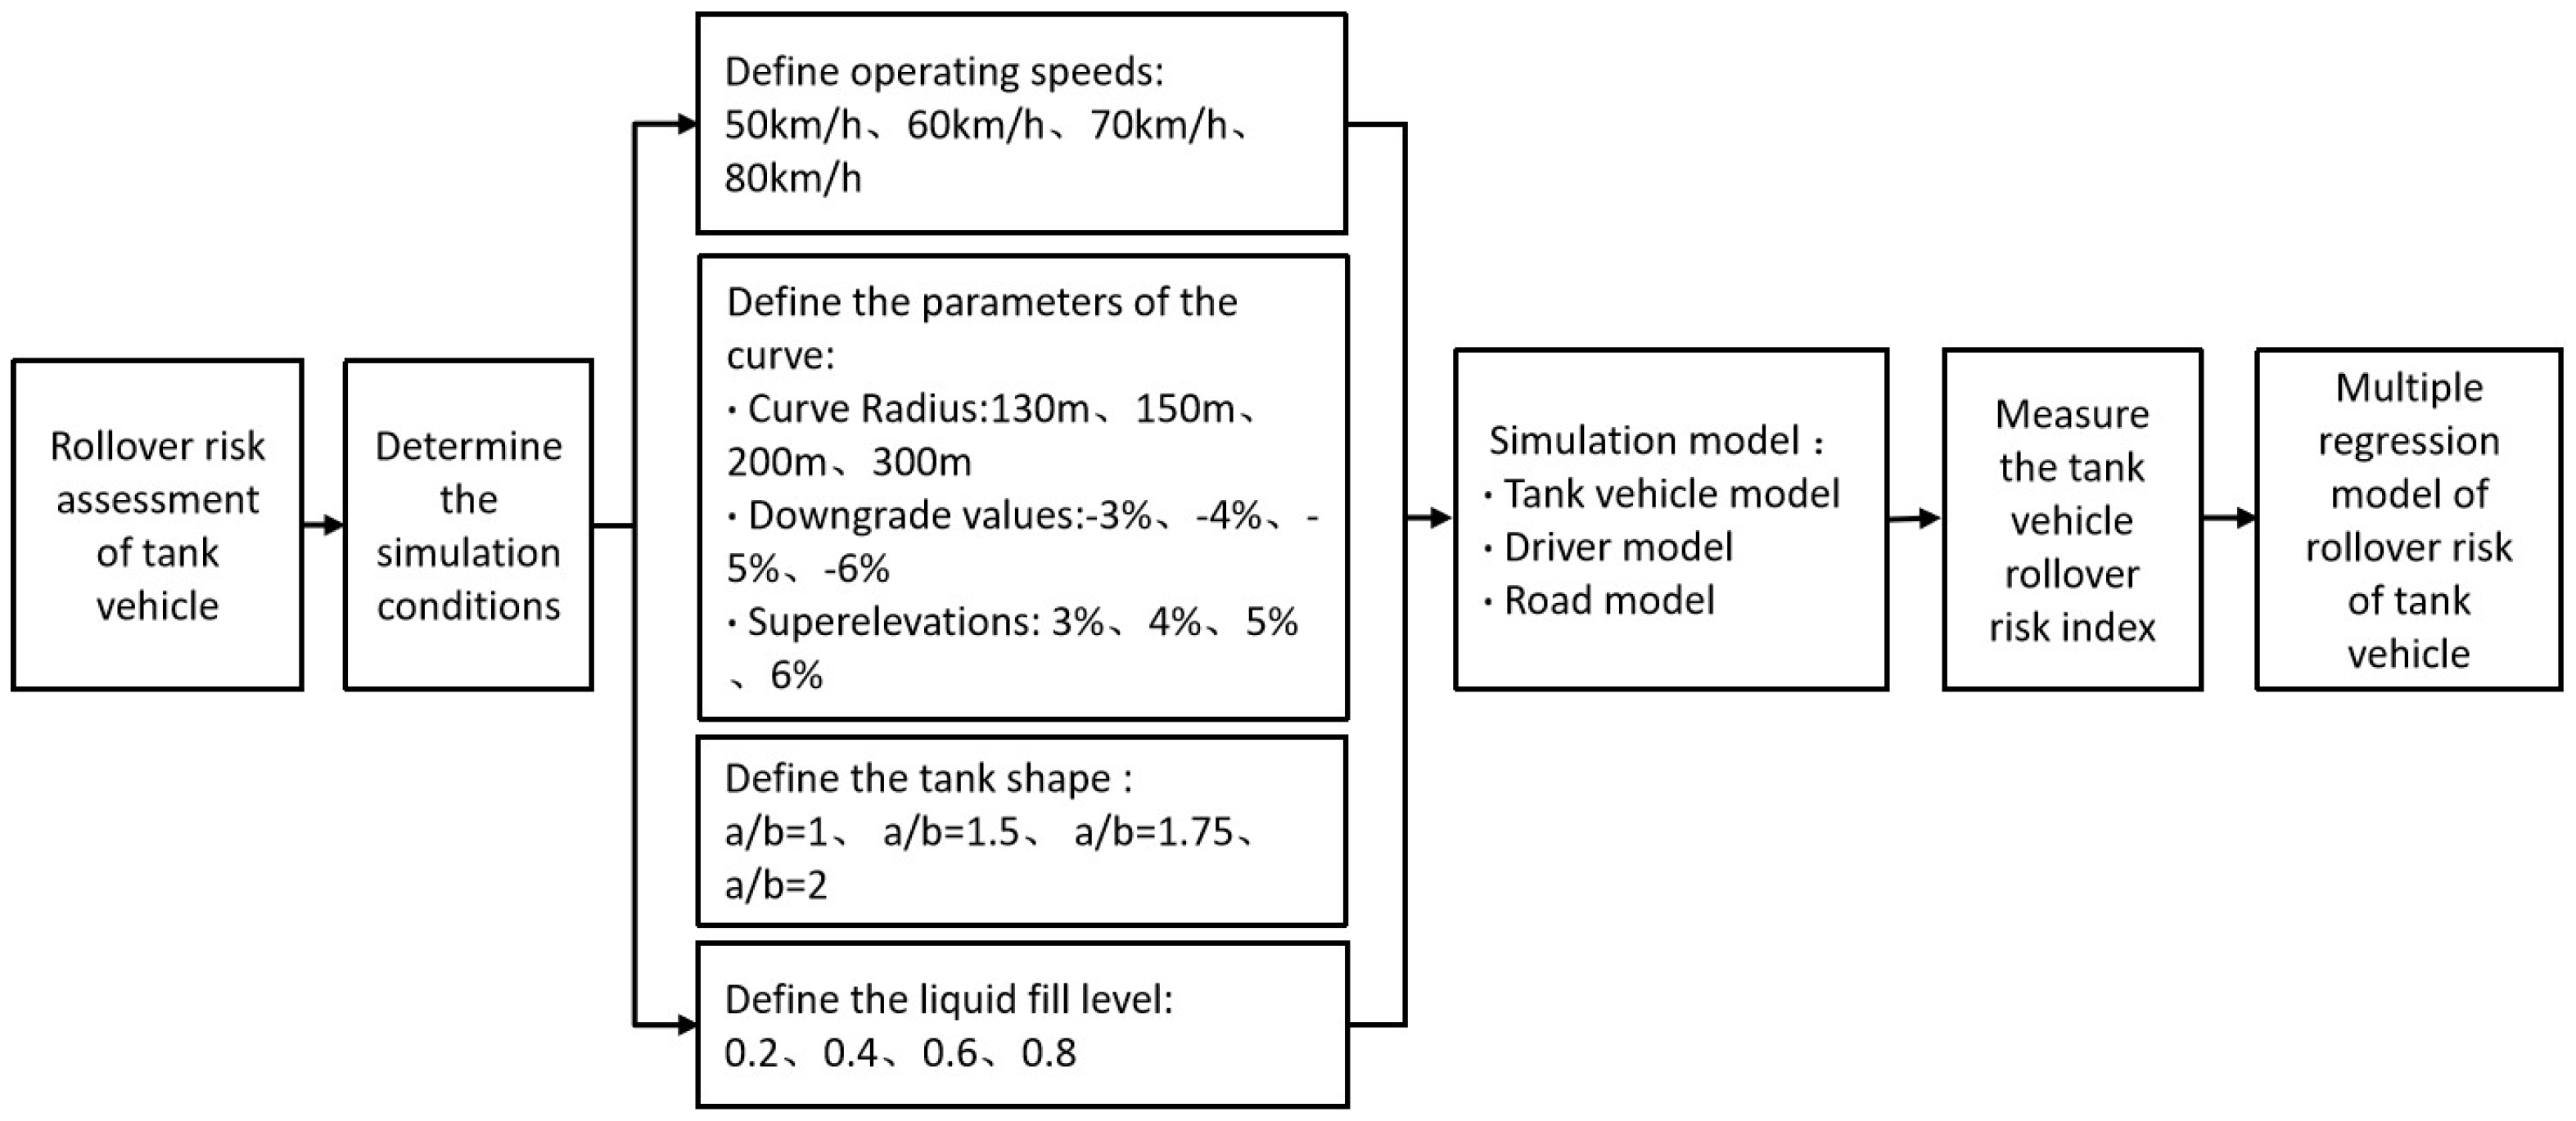
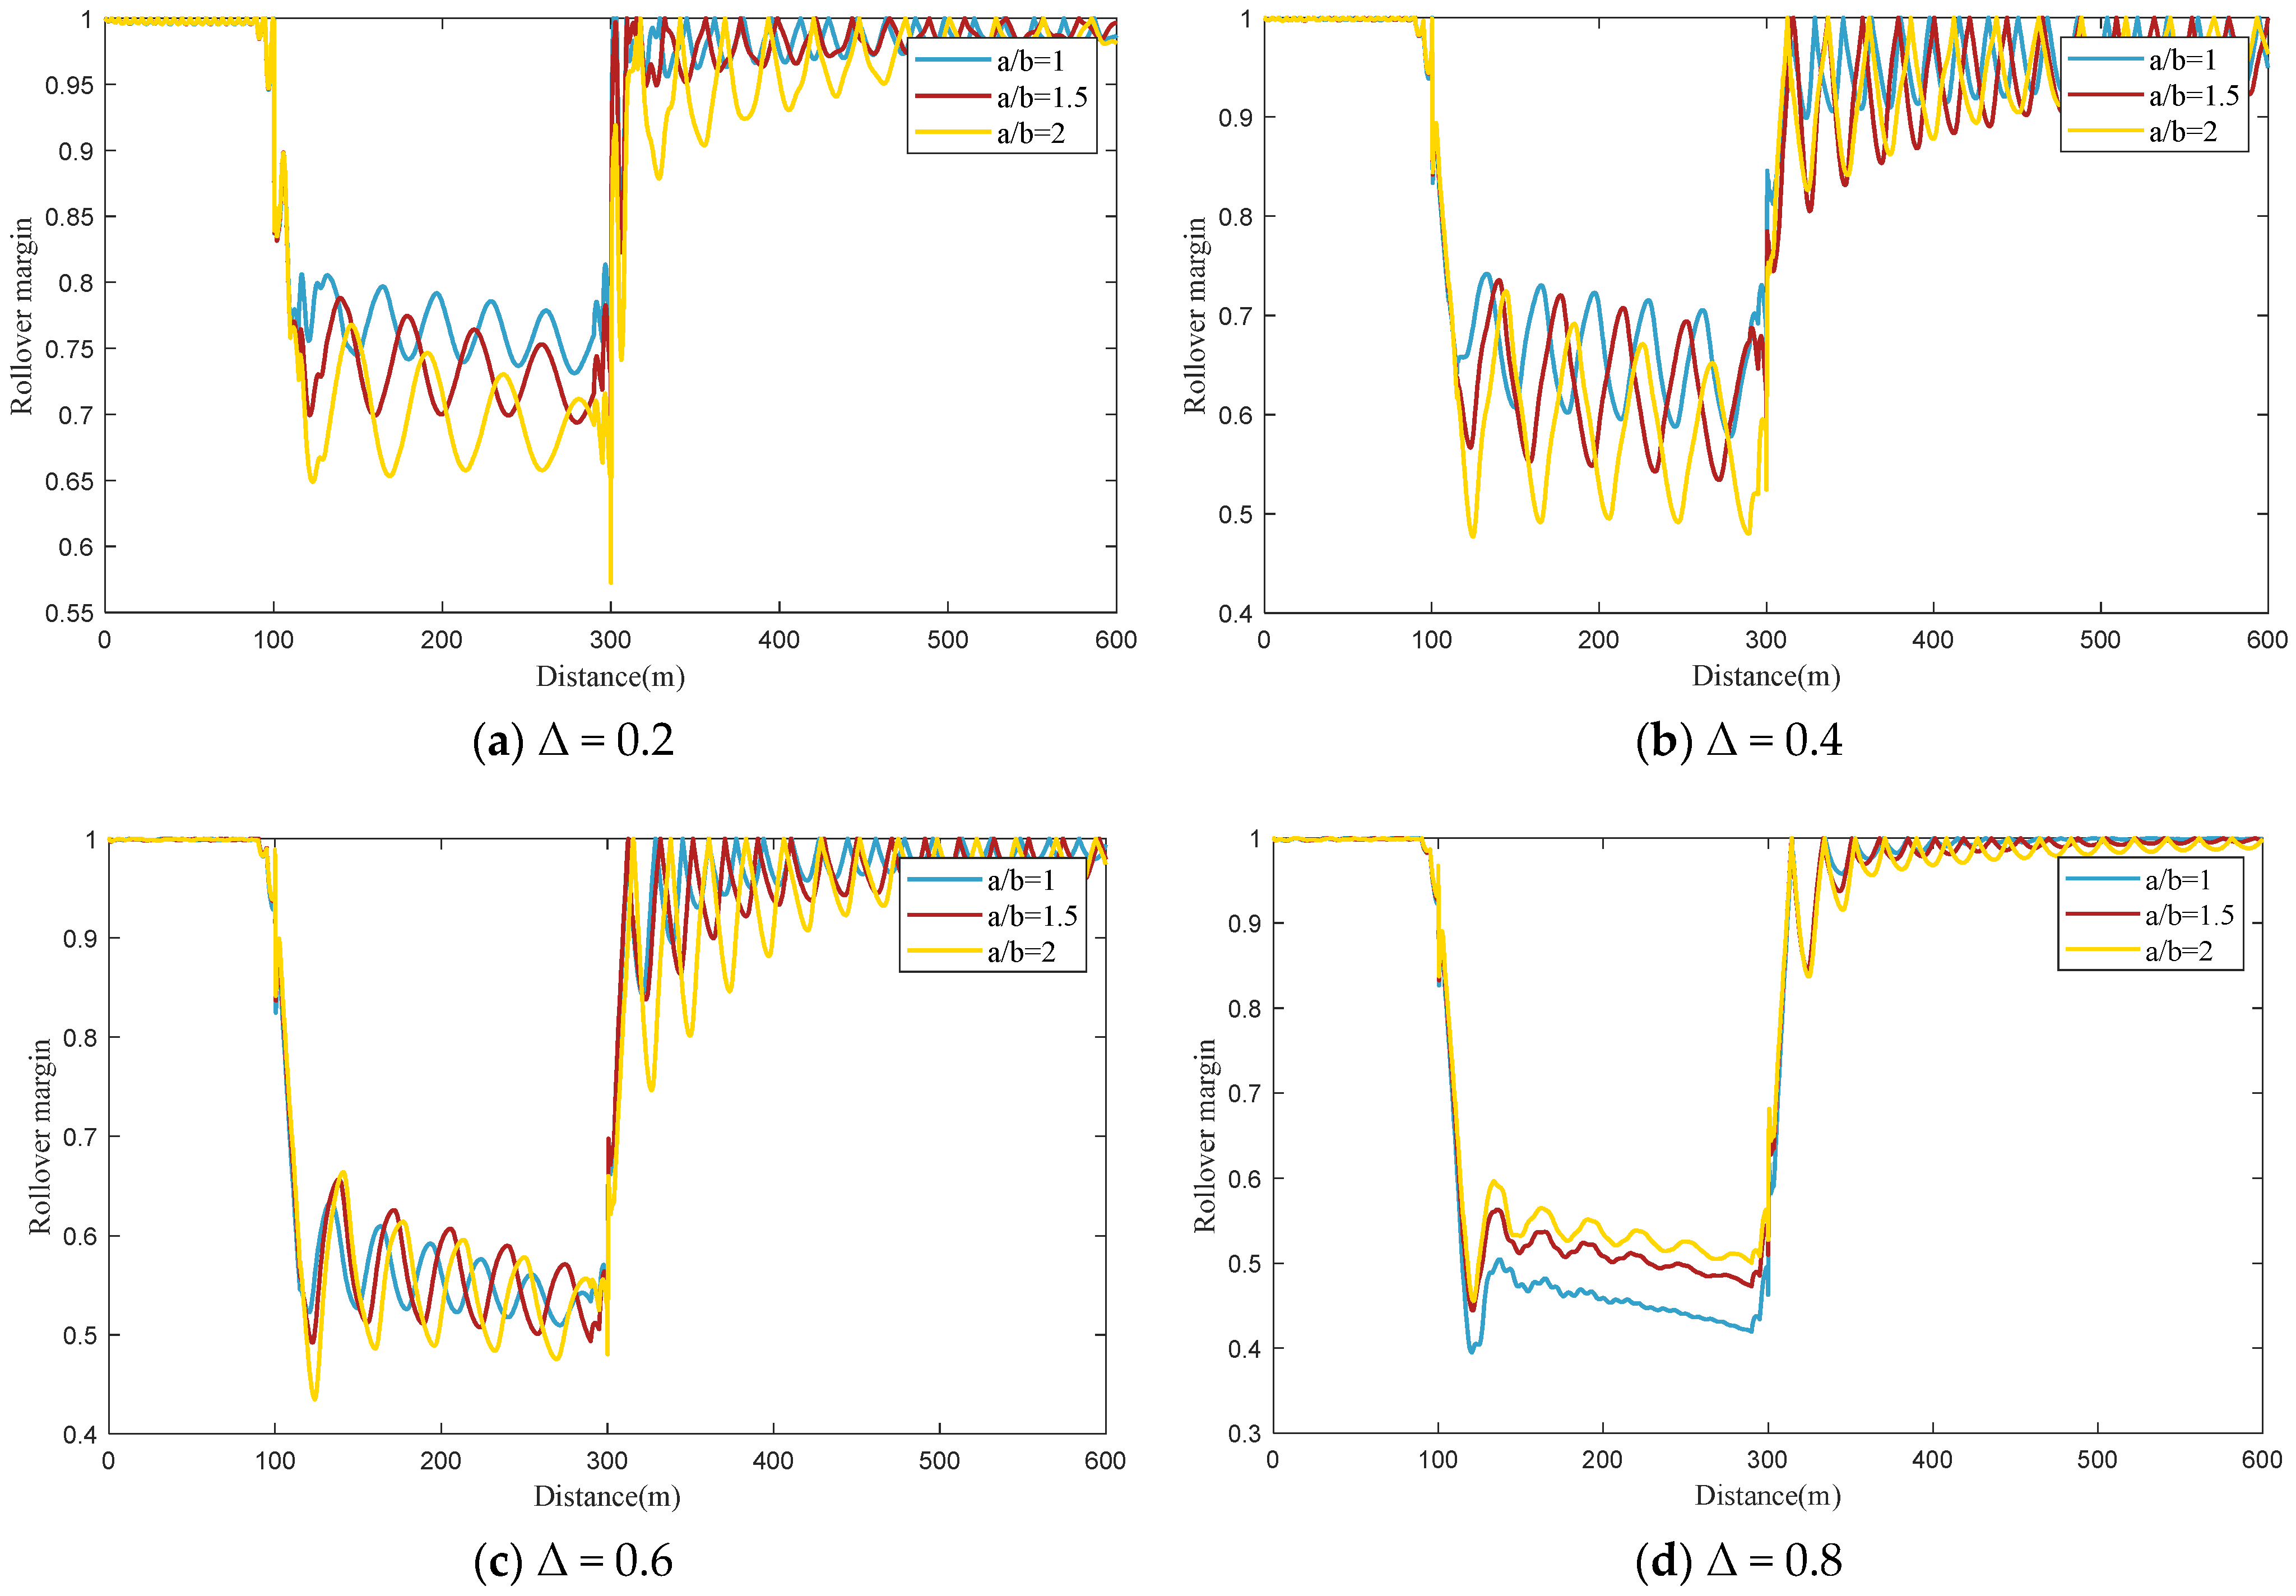
To assess how tank shape affects the rollover risk of tank vehicles, tank shapes with the ratio of the major axis to the minor axes of 1, 1.5, 1.75, and 2 were considered.
Table 1 shows the cross-sectional dimensions of the four tank shapes.
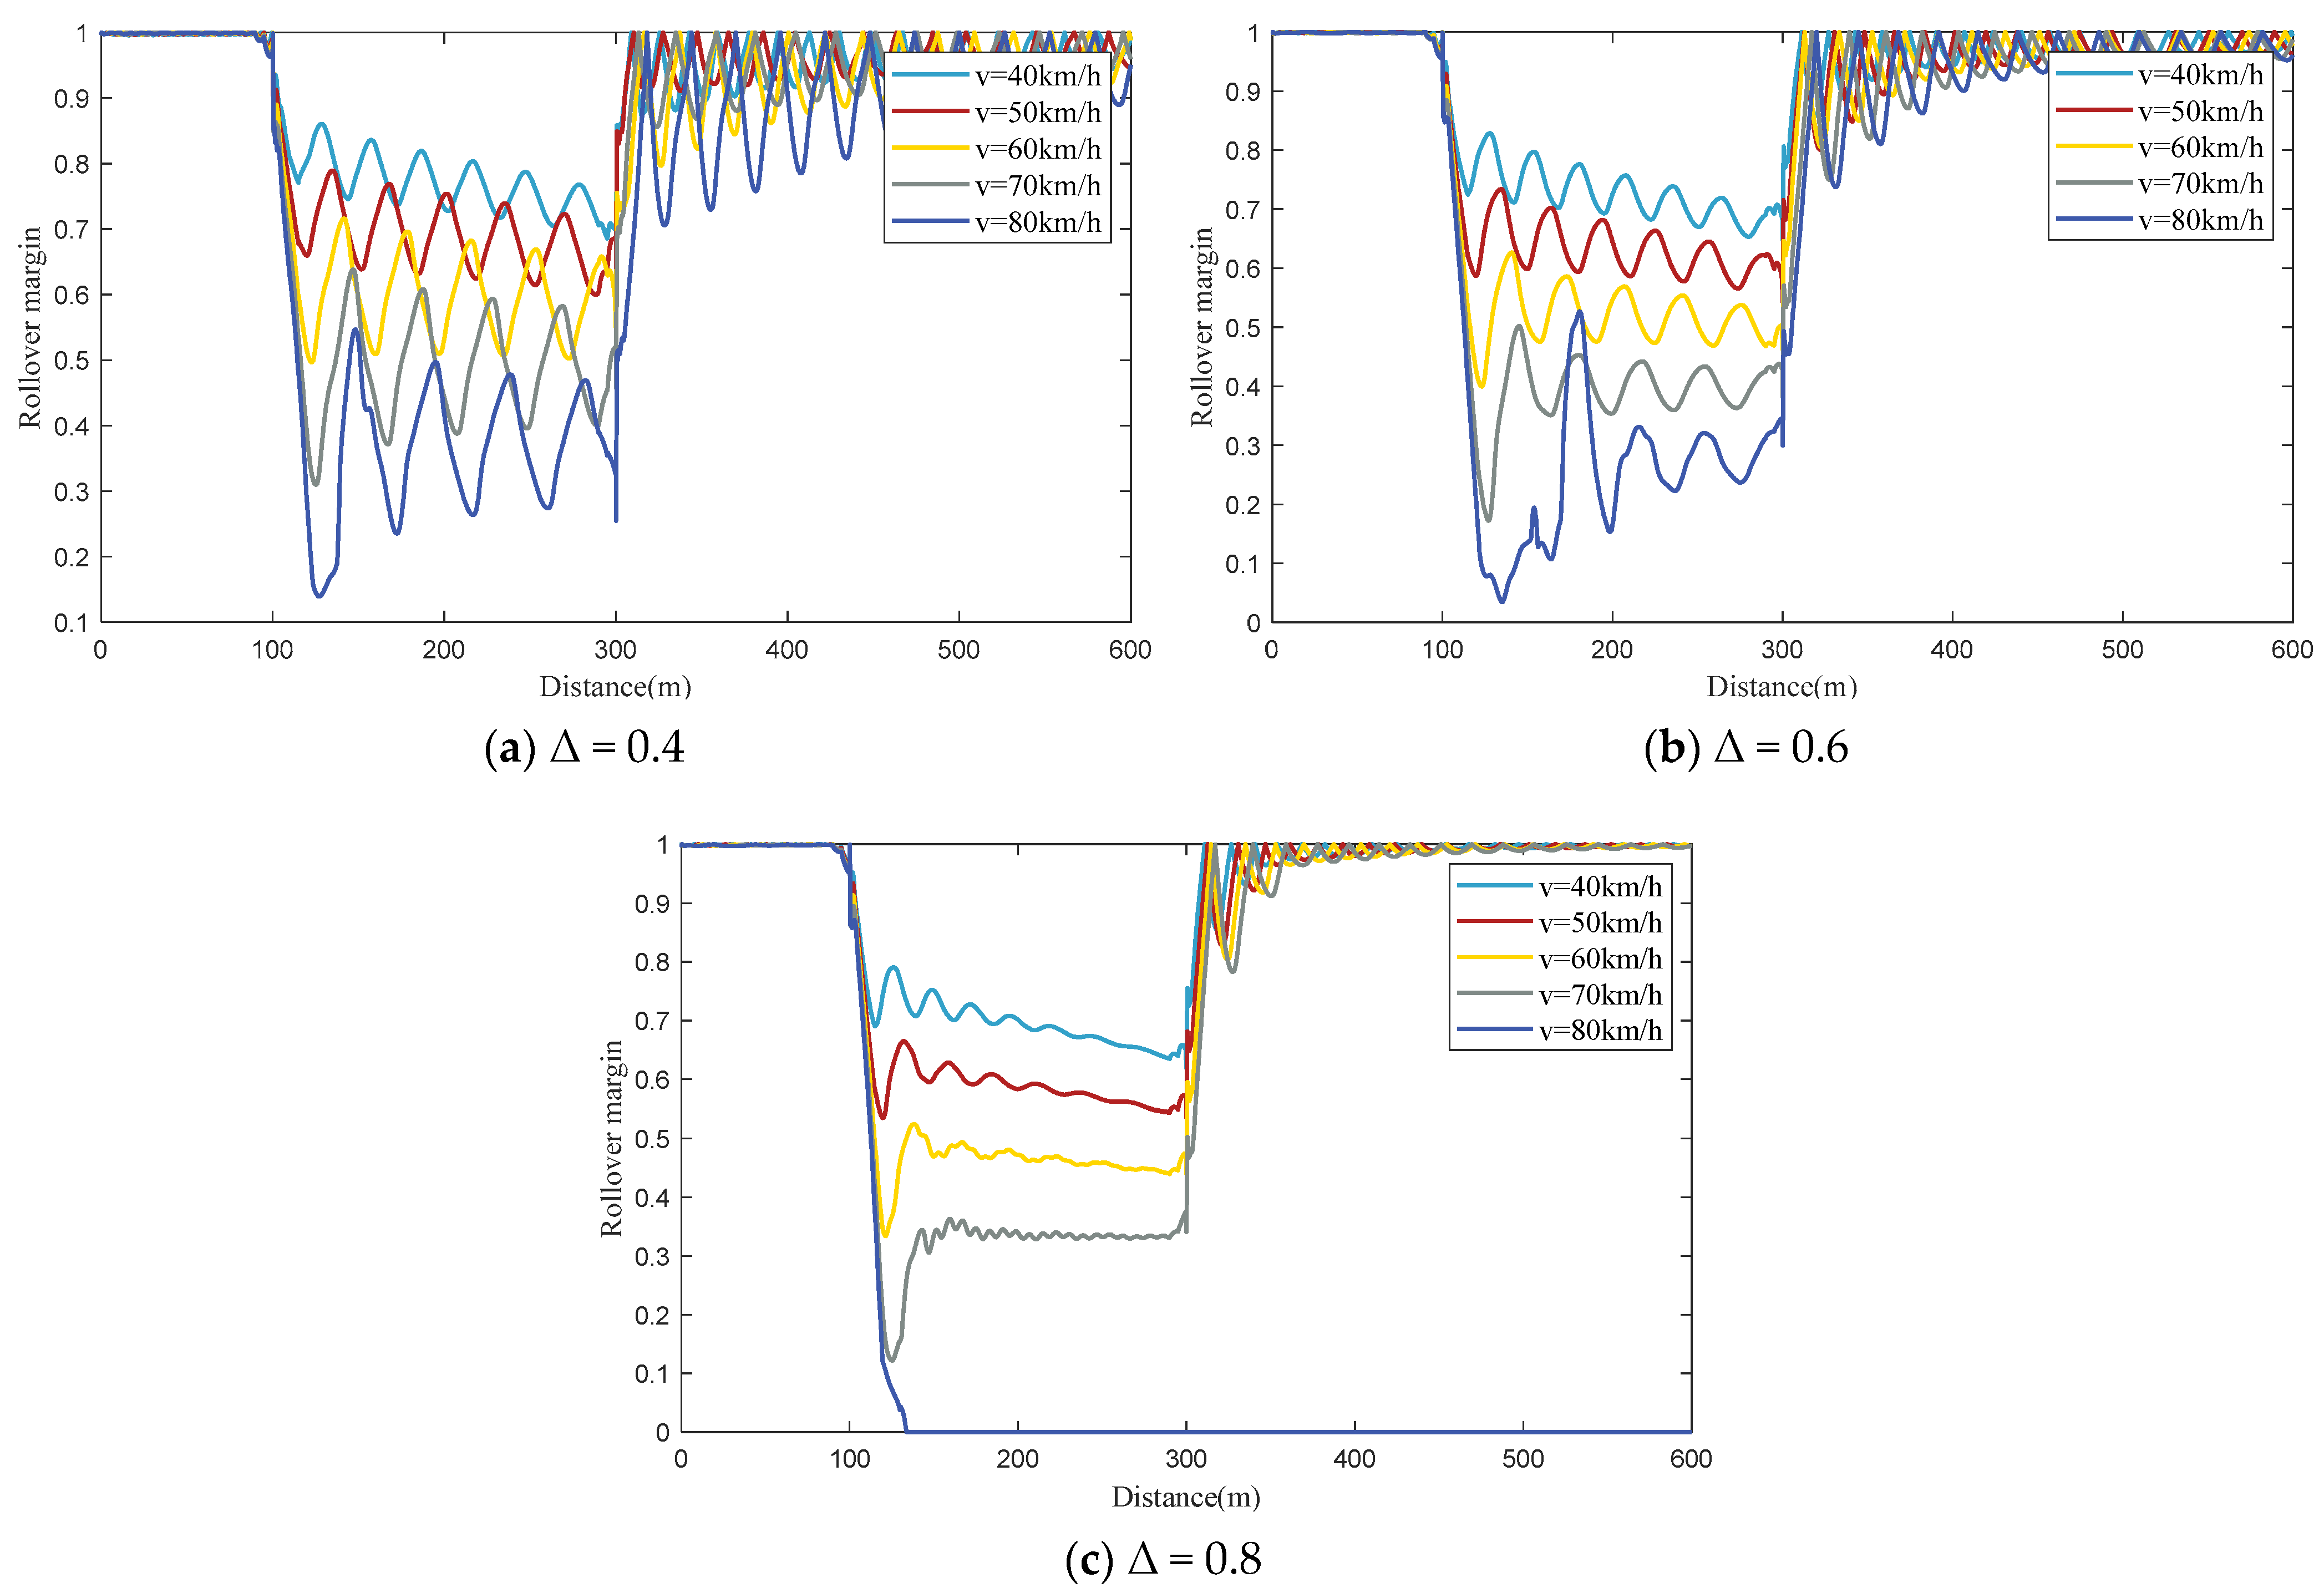
Liquid cargo fill levels of 0.2, 0.4, 0.6, and 0.8 were taken into account to consider the influence of cargo loading on the rollover risk of tank vehicles. The density of liquid cargo loaded in the tank is assumed to be 1000 kg/m3.
According to the definition of curved–slope combination road sections in the Highway Project Safety Evaluation Specification in China, a road section with a circular curve radius less than or equal to 1000 m and a slope greater than 3% is defined as a curved–slope combination. The Code for the Design of Highway Routes stipulates that the curve radius for road sections with a design speed of 60 km/h should be equal to or greater than 125 m. The Highway Design Guidelines stipulate that the maximum superelevation of curves should be controlled within 6%.
Given the above analysis, circular curves of 130 m, 150 m, 200 m, and 300 m; road lateral superelevations of 3%, 4%, 5%, and 6%; and road longitudinal downgrades of −3%, −4%, −5%, and −6% were selected to generate curved–slope road sections.
Vehicle driving speeds of 50 km/h, 60 km/h, 70 km/h, and 80 km/h, which are within the vicinity of the road design speed (60 km/h), were considered to explore the influence of vehicle operating speeds on tanker rollover risk.
Analysis of vehicle rollover accidents shows that many rollover accidents occur on dry roads [
32]. Consequently, this study focused on tanker rollover risk on dry roads, with the road adhesion coefficient set to 0.85.
3.3. Orthogonal Experiments Design
Six types of influencing factors were considered in this paper: vehicle operating speed, liquid cargo filling level, tank shape, road longitudinal downgrade, curve radius, and road lateral superelevation. As shown in
Table 2, each factor has four levels. Without orthogonal experiments design, 4
6 simulation experiments would be conducted, which would be quite time-consuming.
To maximize the experiment efficiency and accurately evaluate the influence of multiple factors on tanker rollover risk in a relatively small number of experiments, a high-intensity orthogonal experimental method was utilized to design an experimental scheme with different combinations of factor settings [
33,
34]. The combinations of the levels of various factors in the experiment are evenly distributed and independent of each other. With the help of orthogonal experiments design, a total of 1024 sets of experiments were designed.
5. Discussion
5.1. Impact of the Main Effect on Rollover Risk
The liquid cargo fill level of the tank vehicle significantly influences the rollover risk index. The positive regression coefficient for this factor indicates that higher liquid cargo fill levels increase the rollover risk, which is consistent with the simulation results shown in
Figure 5.
Table 3 presents the standardized regression coefficients, which demonstrate how much each factor affects the rollover risk index. Among all the main factors, the liquid cargo fill level ranks third in terms of its effect.
The shape of the tank on the vehicle also has a notable impact on the rollover risk index. The positive regression coefficient for this factor suggests a general positive correlation between the major-to-minor axis ratio of the tank and the rollover risk. However, the standardized regression coefficients in
Table 3 show that the tank shape exerts the least influence on the rollover risk compared to the other main factors.
Vehicle operating speed is another crucial factor affecting the rollover risk index for tank vehicles. A positive regression coefficient indicates that higher operating speeds lead to an increased rollover risk, which aligns with the simulation results shown in
Figure 5. According to the standardized regression coefficients in
Table 3, operating speed exerts a substantial influence on the rollover risk index, ranking just behind the curve radius in terms of impact.
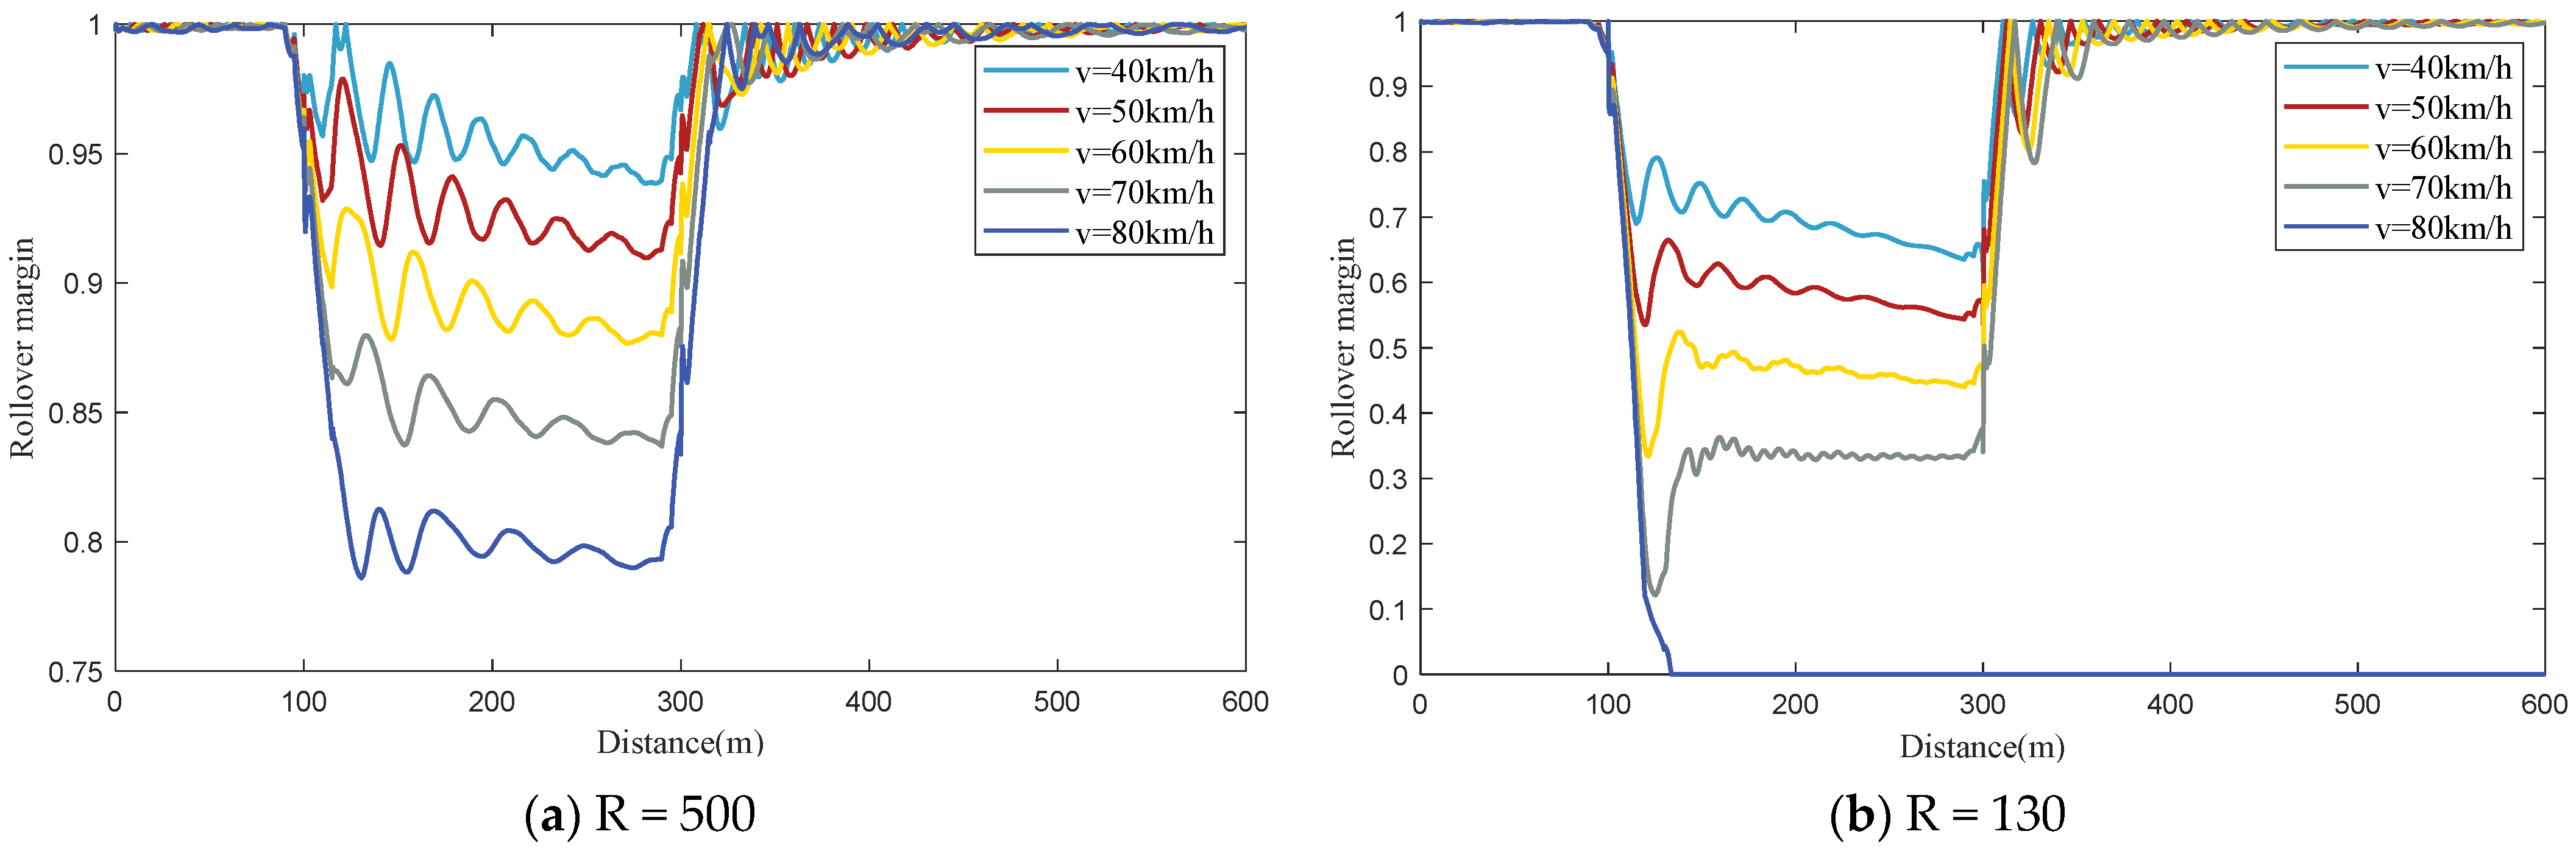
The curve radius, longitudinal downgrade (with a negative value), and superelevation all have a significant effect on the rollover risk index of the tank vehicle. The negative regression coefficient for the curve radius suggests that as the radius increases, the rollover risk decreases, as shown in
Figure 7. Similarly, the negative regression coefficient for longitudinal downgrade shows that a steeper downgrade reduces the rollover risk, which is demonstrated in
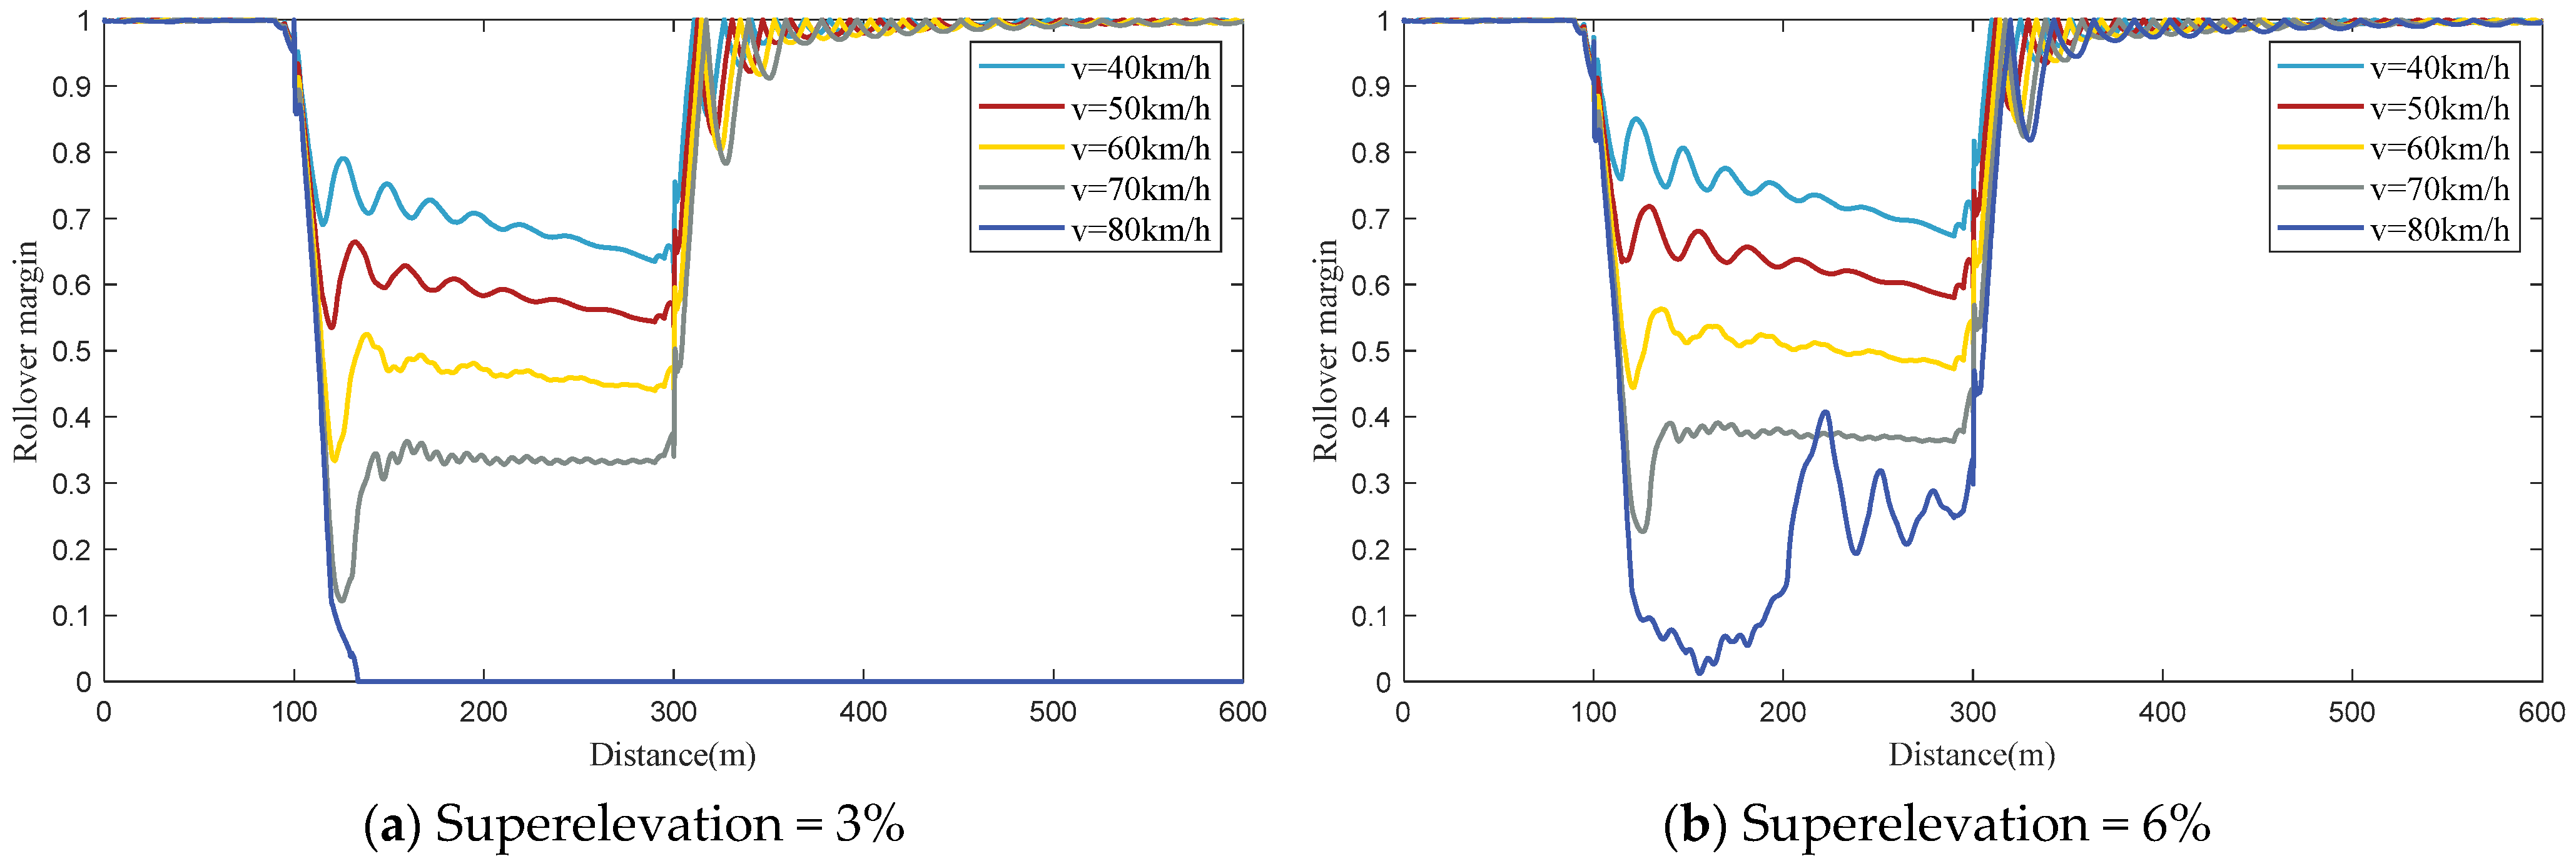
Figure 8. For superelevation, the negative coefficient reveals that higher superelevation values lead to lower rollover risk, in line with the findings in
Figure 9. According to the standardized regression coefficients in
Table 3, among the six factors analyzed, the curve radius has the greatest impact on the rollover risk index. Longitudinal downgrade and superelevation have less influence, with longitudinal downgrade ranking fourth and superelevation ranking fifth among the roadway geometry factors.
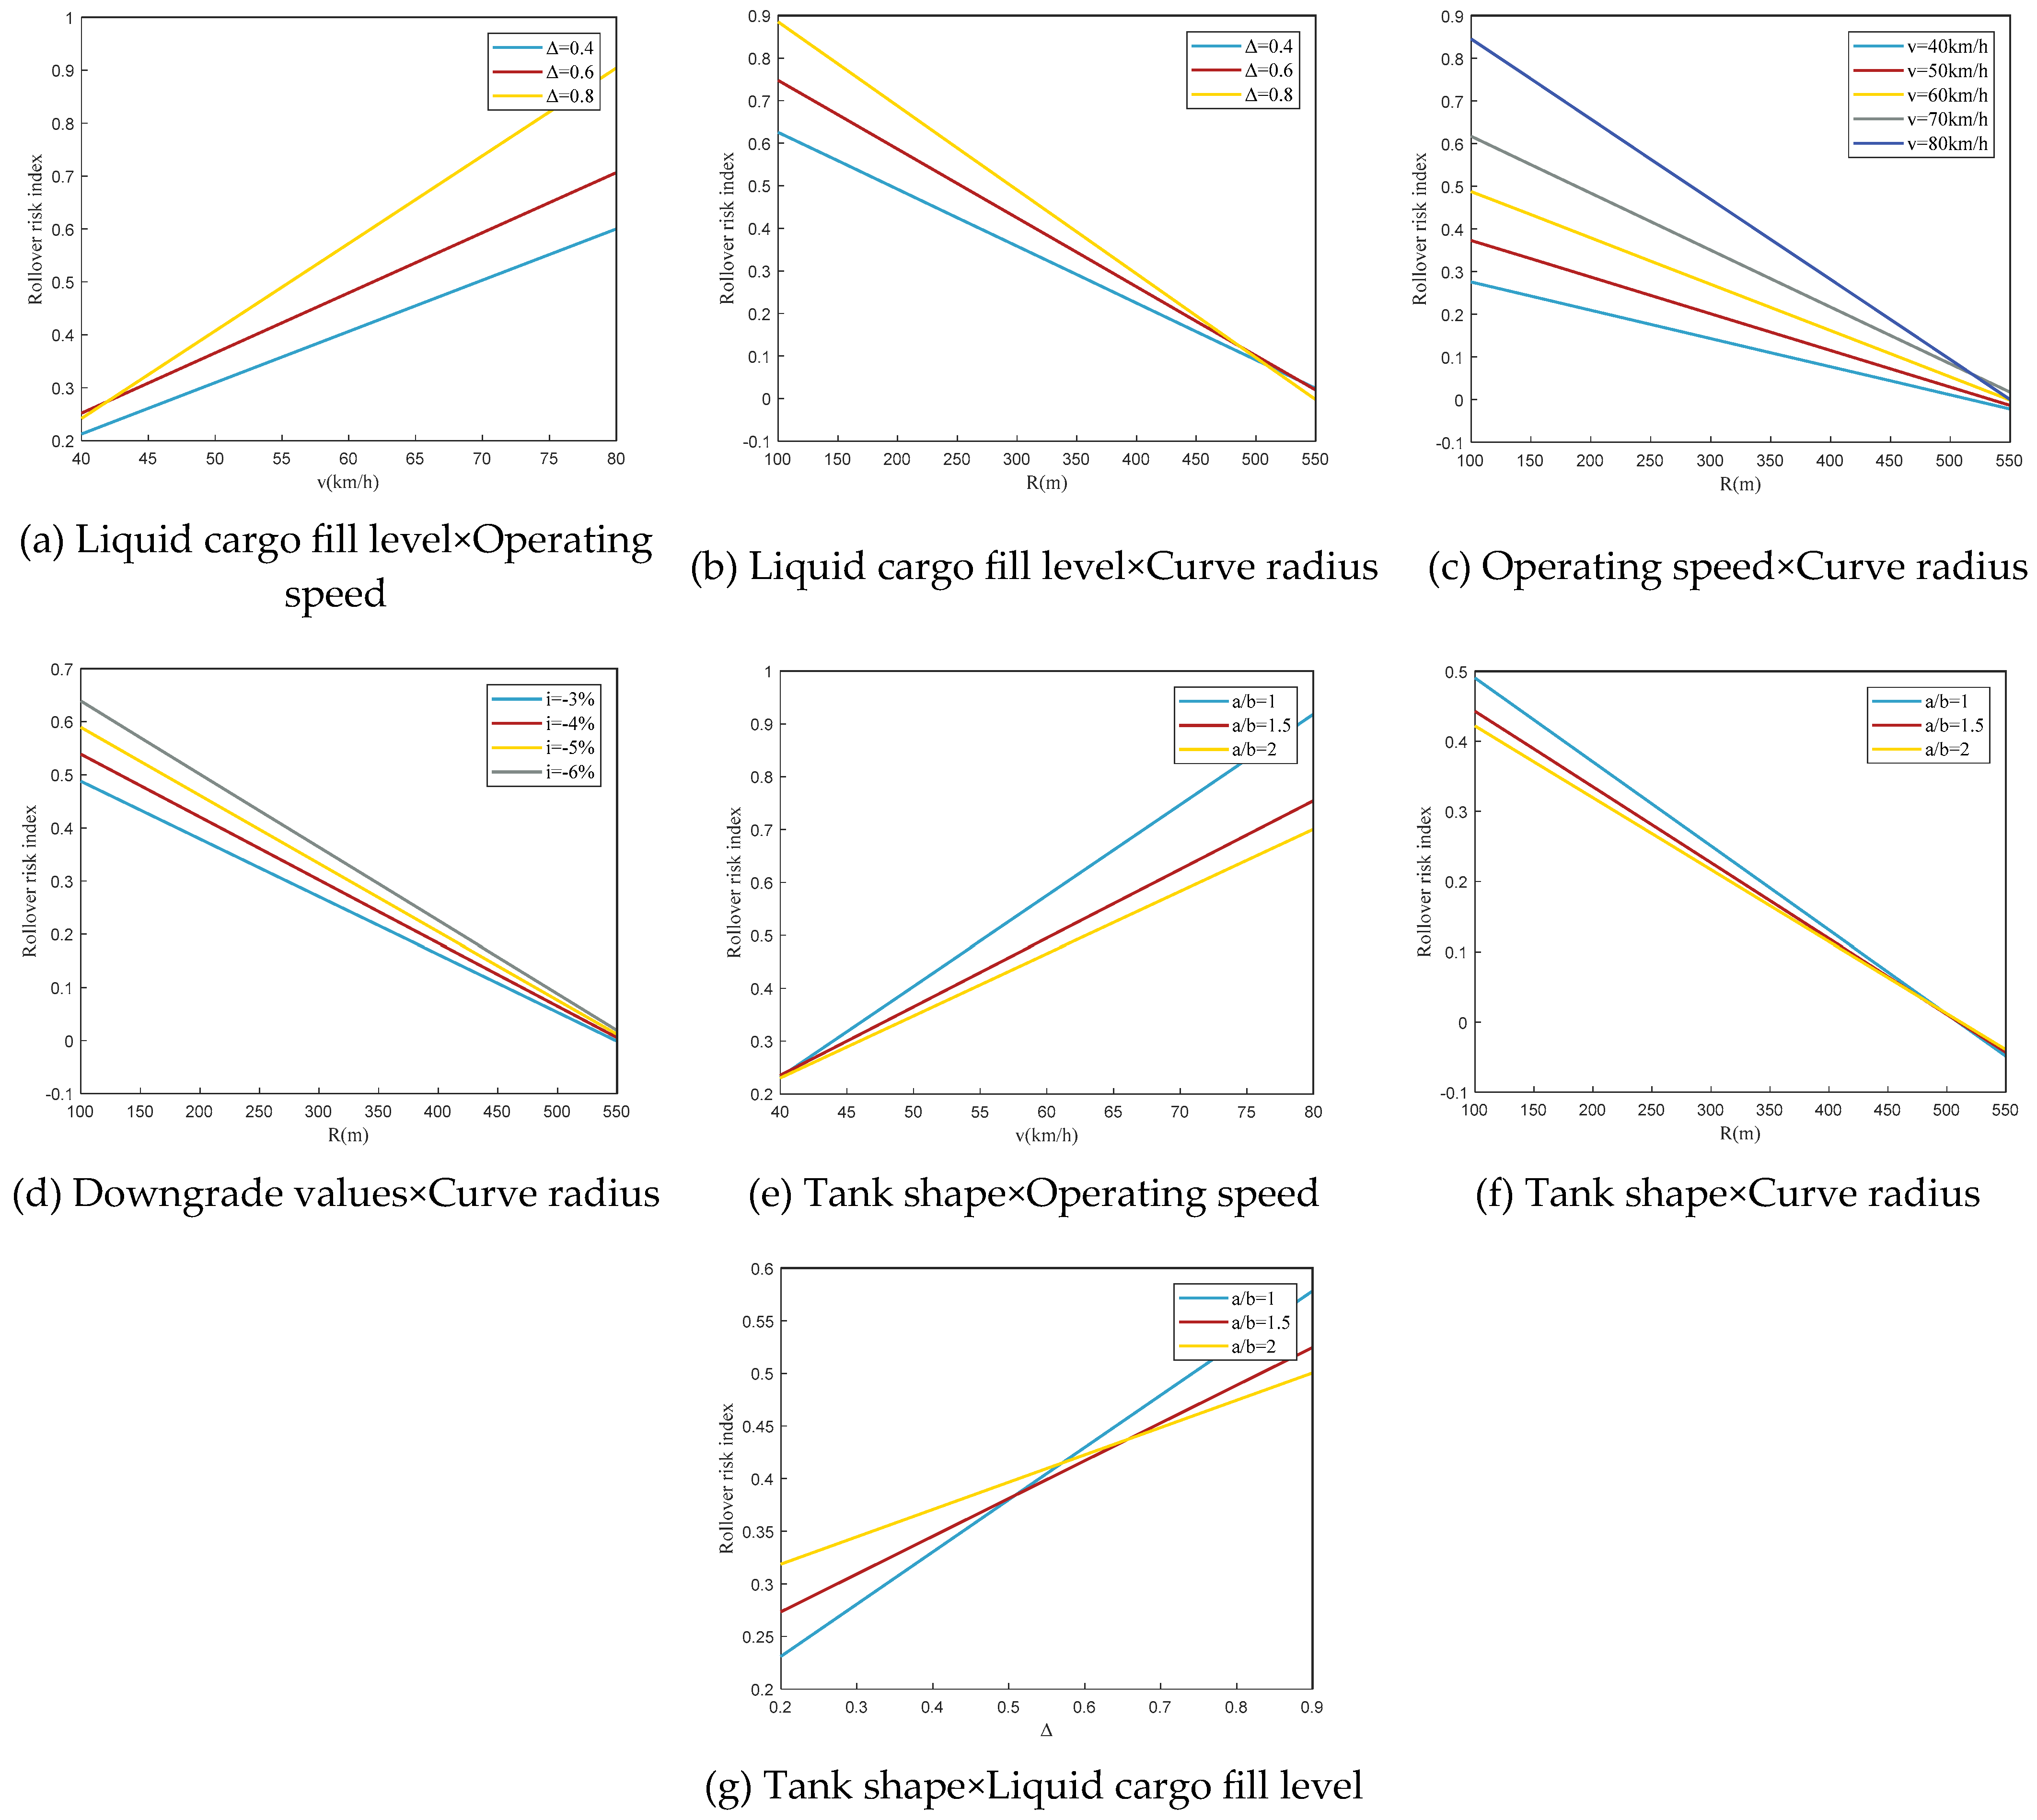
5.2. The Impact of Interactions Between Factors on Rollover Risk
The statistical results presented in
Table 3 clearly highlight that five interactive items have a significant impact on the rollover risk index. These interactions include the interaction between liquid cargo fill level and vehicle operating speed, liquid cargo fill level and curve radius, liquid cargo fill level and tank shape, vehicle operating speed and curve radius, and longitudinal downgrade and curve radius.
The positive coefficient for the interaction between liquid cargo fill level and vehicle operating speed indicates that a higher fill level amplifies the effect of vehicle speed on the rollover risk index. Tank vehicles with higher liquid cargo fill levels are more susceptible to rollover when traveling at higher speeds. According to the standardized regression coefficients in
Table 3, this interaction is the third most influential factor affecting the rollover risk index compared to other interactions. Therefore, tank vehicles with high liquid cargo fill levels should avoid driving at high speeds on curved–slope combination sections during transportation. Transport organizations can adjust the liquid cargo fill level according to the speed limits of different road segments to reduce the occurrence of tank vehicle rollover accidents.
Conversely, the negative coefficient for the interaction between liquid cargo fill level and curve radius suggests that as the liquid cargo fill level increases, the effect of curve radius on the rollover risk index becomes more pronounced. Specifically, a higher liquid cargo fill level leads to a greater reduction in rollover risk index as the curve radius increases. This interaction is the most influential among all the interaction terms, as indicated by the standardized regression coefficients in
Table 3.
Similarly, the negative coefficient for the interaction between vehicle operating speed and curve radius indicates that as the vehicle’s operating speed increases, the effect of curve radius on the rollover risk index intensifies. In particular, at higher speeds, the rollover risk index decreases more noticeably as the curve radius increases. According to the standardized regression coefficients, this interaction is the second most influential factor on the rollover risk index, following only the interaction between liquid cargo fill level and curve radius.
The coefficient for the interaction between longitudinal downgrade and curve radius is positive, indicating that as the downgrade value decreases, the impact of curve radius on the rollover risk index becomes greater. Specifically, in steeper downgrade sections, the rollover risk index decreases more sharply as the curve radius increases. However, this interaction has the least influence on the rollover risk index, as indicated by the standardized regression coefficients, ranking it lower than the other interactions.
Finally, the negative coefficient for the interaction between liquid cargo fill level and tank shape suggests that as the major-to-minor axis ratio of the tank increases, the impact of liquid cargo fill level on the rollover risk index gradually diminishes. This implies that when the major-to-minor axis ratio of the tank is smaller, the rollover risk index of the tank vehicle increases significantly with a higher liquid cargo fill level. In contrast, when the ratio is larger, the increase in the rollover risk index becomes less pronounced as the fill level increases. According to the standardized regression coefficients, this interaction ranks fourth among the interaction terms, making it the second least influential factor on the rollover risk index of tank vehicles. When transporting goods with a tank vehicle, it is recommended to avoid using vehicles with a small major-to-minor axis ratio to transport liquid cargo at higher fill levels.
6. Conclusions
This study aimed to assess the rollover risk of tank vehicles navigating curved–slope combination sections. To achieve this, the dynamic vehicle simulation approach was employed, offering distinct advantages over traditional methods. Unlike crash data or costly field tests, dynamic simulations provide insights into the impact of various factors and their interactions, which are essential for a more accurate understanding of tank vehicle behavior while navigating corners. By utilizing dynamic simulation tools, the study was able to capture the vehicle’s dynamic response in complex scenarios, leading to more precise results. As a result, Trucksim and Simulink co-simulation were used to evaluate the rollover risk index of tank vehicles on different curved–slope combination sections. Unlike the existing literature, this study is the first to comprehensively consider the impact of road geometry and vehicle configuration on the rollover risk of tank vehicles and offers new insights into the interplay between vehicle configuration of tank vehicles and road geometry. Six key variables and their interactions were analyzed to assess their impact on the rollover risk of tank vehicles. These variables include the liquid cargo fill level, vehicle operating speed, road lateral superelevation, road longitudinal downgrade, road curve radius, and tank shape. A high-intensity orthogonal experiment was designed to gather 1024 sets of data. Based on the data obtained from these simulations, a multiple linear regression model with interaction terms was developed to quantify the influence of these factors on the rollover risk of tank vehicles.
This study established, for the first time, a rollover risk assessment model specifically for tank vehicles navigating curved–slope combination sections and quantified the impact of various factors on the rollover risk. The results indicate that curve radius, vehicle operating speed, and liquid cargo fill level have the greatest influence on the rollover risk of tank vehicles, followed by longitudinal downgrade and superelevation, with tank shape having the least impact. Smaller curve radii, steeper downgrade slopes, lower superelevation, and higher vehicle speeds all increase the rollover risk of tank vehicles. Additionally, the rollover risk varies depending on tank shape and liquid cargo fill level. A larger liquid cargo fill level exacerbates the rollover risk when tank vehicles drive on curved–slope combination sections. As the major-to-minor axis ratio of the tank increases, the impact of cargo fill level on the rollover risk of the tank vehicle gradually decreases. When the major-to-minor axis ratio of the tank is large, the increase in rollover risk with the rise in the liquid cargo fill level becomes less significant. Simulation experiments suggest that, in certain cases, it is necessary to reduce vehicle operating speed or adjust the loading conditions to prevent rollover accidents. When a tank vehicle with a high cargo fill level passes through sharp curves and steep slopes, it is recommended to drive at a speed 10 km/h below the speed limit to prevent rollover accidents. Selecting the appropriate tank shape based on transportation requirements also contributes to enhancing the safety of tank vehicle operations. When the liquid cargo fill level is high, using a tank with a larger major-to-minor axis ratio results in a lower rollover risk for the tank vehicle. The findings of this study can not only effectively assess the risk of liquid tanker rollover and help reduce the occurrence of liquid tanker rollover accidents, thus reducing the potential harm to the environment and public safety risks. It also provides a scientific basis for formulating effective safety policies, optimizing transportation route planning, and improving the overall sustainability of the industry.
However, this study focused solely on the rollover risk of tank vehicles on a single curved–slope combination section and did not account for the effects of changes in road alignment on rollover risk. Future research could investigate how variations in the road geometry before and after this section influence the rollover risk for tank vehicles. This study only considered the case of a single-compartment tank, and future research could investigate the impact of uneven loading in different compartments of multi-compartment tank vehicles.


