Article

Sustainable Urbanization: Unpacking the Link Between Urban Clusters and Environmental Protection

1
School of International and Public Affairs, Shanghai Jiao Tong University, Shanghai 200030, China
2
School of Emergency Management, Shanghai Jiao Tong University, Shanghai 200030, China
*
Author to whom correspondence should be addressed.
Sustainability 2025, 17(3), 873; https://doi.org/10.3390/su17030873
Submission received: 7 December 2024 / Revised: 18 January 2025 / Accepted: 21 January 2025 / Published: 22 January 2025

Abstract

Urban clusters are the main trend of current and future urbanization worldwide, but their impact on environmental pollution has been controversial. This paper explores this issue in the context of urban development in China, and analyzes the underlying mechanisms, using panel data from 285 Chinese cities spanning 2006 to 2021. The findings show that a one unit increase in the degree of urban cluster is associated with a reduction in the comprehensive pollution index by approximately 7.5%, and the main mechanisms by which urban clusters facilitate environmental protection are congestion alleviation, industry structural optimization, and technological innovation. Firstly, urban clusters reduce environmental pollution by mitigating the crowding effects associated with urban expansion, although this alleviation is predominantly observed in larger cities. Secondly, urban clusters foster the upgrading of urban industrial structures, thereby decreasing environmental pollution. However, in less developed cities where industrialization is a major development goal, the impact of structural optimization is less pronounced. Finally, technological innovations, including advances in technologies of energy conservation and emission reduction, have assisted in the transformation of the economic growth model, which has reduced environmental pollution. Looking ahead, the urban cluster remains a pivotal strategic direction for social development, and planning and construction of urban clusters should actively incorporate environmental benefit considerations.

1. Introduction

Industrialization has been one of the major processes of global economic and social modernization over the past hundred years [1]. Unchecked economic development has often led to environmental degradation and resource depletion, with irreversible ecological consequences [2]. For example, recent IPCC reports clearly indicate that excessive greenhouse gas emissions from human production and consumption activities are the main cause of global climate change today [3], and that the threat of climate change to human well-being and ecological health cannot be ignored [4]. In response to the growing pressure of environmental pollution, there has also been a significant shift in urban planning strategies in many countries to incorporate the principles of sustainable development. More specifically, the framework of eco-neighborhoods or eco-cities has been given high priority, as it appears to be one of the most comprehensive and integrated approaches [5,6]. Today, however, urban development places greater emphasis on the synergistic development and comparative advantage of urban units within a certain region [7]. That is, as the level of urbanization increases, multiple cities form urban clusters through well-developed transportation networks, industrial divisions, and economic and technological links in order to promote the better development of the member cities. Portnov and Schwartz defined urban clusters as collections of high-density, closely connected urban units within a geographical area [8]. Urban clusters contain a large number of closely linked cities at different development stages and are strategically important in terms of socio-economic impact [9]. Therefore, urban clusters are fully given adequate attention by governments of various countries, and a series of policies supporting the development of urban clusters have been introduced in many countries [10]. In China, the main development has also been in the form of rapid urbanization over the past several decades. During this period, some large cities have experienced accelerated urban development, significant economic growth, and substantial population increases. However, as these cities approach their spatial limits, they are also increasingly experiencing “urban diseases” [11], with issues such as haze and water pollution becoming more severe [12,13]. As China’s urbanization enters a new phase, the effectiveness of individual city development is declining, e.g., the GDP growth rate of many developed cities in recent years has been less than 5%. Consequently, one of China’s most important national development strategies, the National Economic and Social Development Plan, advocated for urban clusters as the primary form of urbanization in the 11th Five-Year Plan. For the first time, the development of urban clusters has been integrated into the national strategy [14]. However, the environmental impacts accompanying urban clusters will be more complex in the future. Hence, from an environmental protection perspective, this paper aims to assess whether urban clusters can reduce environmental pollution and, if so, through which mechanisms this effect occurs.
The existing literature on urban environmental pollution primarily explores factors from a supply-side perspective, categorizing them into scale effects, composition effects, and technological effects [15]. Generally, scale effects are believed to exacerbate urban environmental degradation [16,17]. Urban expansion increases demand, leading to higher waste emissions that significantly threaten the urban environment [18,19]. Contrarily, some empirical studies suggested that expanding city size can reduce pollution, with larger cities potentially better positioned to achieve environmental protection goals [20,21]. Additionally, research indicated a non-linear relationship between city size and environmental pollution, such as the inverted U-shaped correlation between city size and haze [22]. Composition effects on the urban ecosystem remain ambiguous, influenced by the city’s economic development stage and the total environmental impacts of different industries [23]. Economic shifts from agriculture to industrialization accelerate resource exploitation and pollution. However, as economies advance, the structure often transitions from energy-intensive industries to service and technology-driven sectors, leading to a gradual reduction in pollution [24]. Regarding technological effects, the existing literature has focused on emission reduction. Levinson demonstrated that technological progress significantly improved environmental quality, reducing SO2 emissions in the U.S. by 39% between 1987 and 2001 [25]. Liu and Guo argued that foreign direct investment in China reduces haze pollution, and the total effect can be decomposed into scale effect, technology effect, and structural effect. Foreign direct investment increases urban haze pollution through scale effects and structural effect, but decreases urban haze pollution through technology effects [26]. He et al. empirically analyzed the impact of technological innovation on haze pollution using panel data from 278 Chinese cities (2003–2016) and suggested that technological innovation significantly reduces haze pollution, with its effect on pollution intensifying over time [12].
The literature presents three main perspectives on the impact of urban clusters on the environment. One perspective argues that urban clusters exacerbate environmental pollution. This results from the “adjacency effect” between cities, whereby increasing interdependence and collaboration have caused internal problems in individual cities, such as environmental pollution, to spill over into public issues within urban clusters [27,28]. For instance, Fan et al. used spatial econometrics to assess the spatial spillover effects of population and economic clusters on haze pollution in 342 Chinese cities from 2001 to 2016, and found that both city size and urban clusters are positively correlated with haze pollution, with a more pronounced correlation observed in specific areas within China’s emerging urban clusters, such as the Yangtze River Delta [29]. An alternative perspective suggests that the development of urban clusters can reduce environmental pollution such as haze and acid rain. Due to close connections and good cooperation within urban clusters, it is easier to realize the supply of public goods and the integration of environmental policies, which is conducive to solving cross-city pollution governance challenges [30,31]. For instance, Fang et al. (2020) discovered that manufacturing agglomeration reduces haze pollution in both local and neighboring cities, with larger cities showing greater improvements [32]. In addition, some studies propose a non-linear relationship between urban clusters and environmental pollution [33,34]. Wang et al. verified that the impacts of China’s urban economic development and population size on haze pollution conformed to the environmental Kuznets curve, but that the impact of rapid land urbanization on haze pollution was mainly monotonic and increasing, and that the incompatibility of population and land in the process of urbanization exacerbated haze pollution [35]. Yu et al. also reported a complex relationship between urban clusters and pollution: during the initial development phase, economic agglomeration exhibits an inverted U-shaped relationship with carbon emission intensity, whereas, in later stages, a U-shaped relationship emerges, reflecting that excessive clustering leads to increased regional carbon emission intensity [36].
Based on the analysis mentioned above, it can be found that the impact of urban clusters on environmental pollution has been controversial. This paper empirically examines the impact of urban clusters on environmental outcomes and the mechanisms driving these effects, using data from 285 Chinese cities from 2006 to 2021. The analysis reveals that the increase in urban clusters contributes to a reduction in pollution. Furthermore, we identify congestion alleviation, industrial structural optimization, and technological innovation as key channels through which urban clusters influence environmental protection. A few innovations could be expected in this article. Firstly, previous studies exploring this issue usually used a single pollutant or a series of air pollutant indicators to measure pollution [36], making it difficult to reflect the overall environmental pollution in a region. A set of environmental indicators is used to construct a composite indicator in this paper. Secondly, previous studies have mostly used entire urban clusters as the object [37]. But when a single city is observed in an urban cluster, does the development of the urban cluster affect environmental pollution? We respond to the question by drawing on the methodology of Yuan Qian for measuring the degree of urban cluster [38]. Thirdly, the paper integrates congestion alleviation, industrial structural optimization, and technological innovation into a unified analytical framework, providing a comprehensive analysis of the impact mechanisms of urban clusters on environmental pollution. Finally, future urban development must integrate both urban clusters and ecological sustainability, and this paper offers valuable insights into the practical construction of green urban clusters.

2. Material and Methods
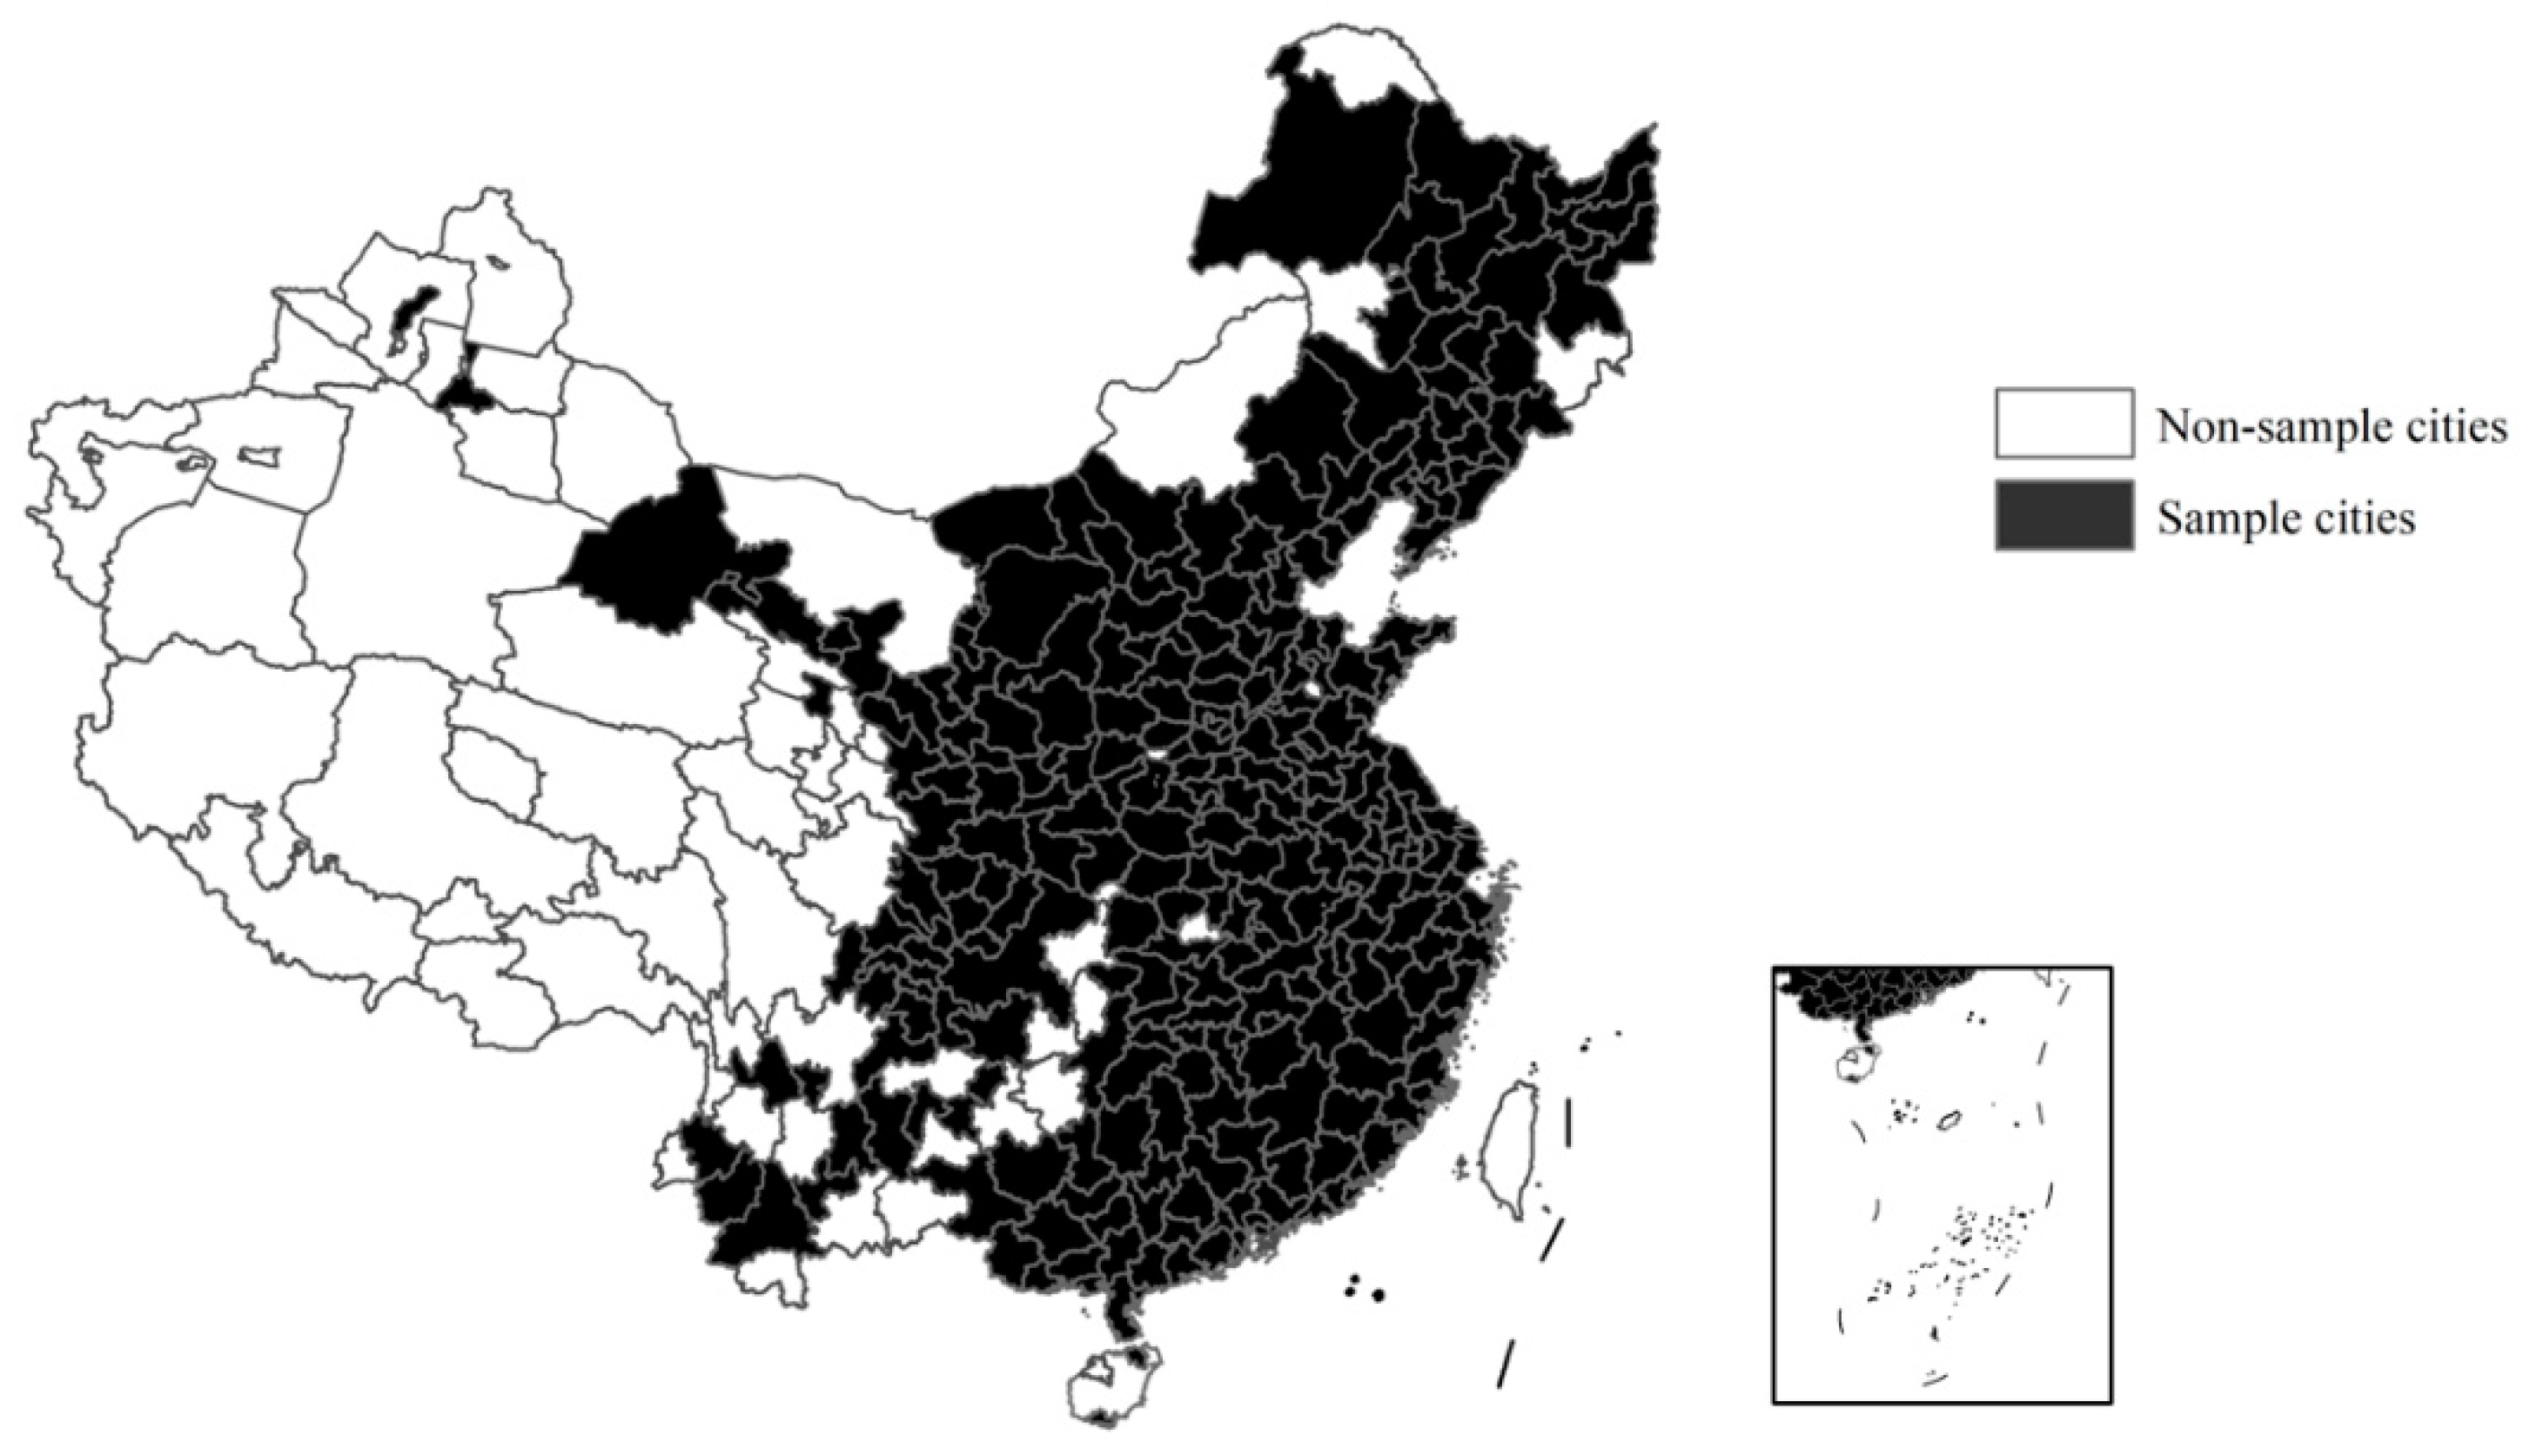
2.1. Data

This study employed city-level data from 2006 to 2021 for empirical analysis, encompassing a sample of 285 cities. Many cities in Inner Mongolia, Hainan, Sichuan, Guizhou, Yunnan, Tibet, Qinghai, and Xinjiang with significant missing data were excluded. Additionally, both canceled and newly established cities during the study period were excluded. A distribution of the sample cities used in this study was provided, as shown in Figure 1. Small amounts of missing data were addressed using linear interpolation, and validated against available data for accuracy. Data on population, GDP per capita, foreign investment, and government revenue/expenditure were sourced from the China Stock Market and Accounting Research Database and the CEIC Database. Patent data were obtained from the Chinese Research Data Services Platform. The distance between cities is measured using Euclidean distance. All analyses were performed with R version 4.2.0.

2.2. Variables

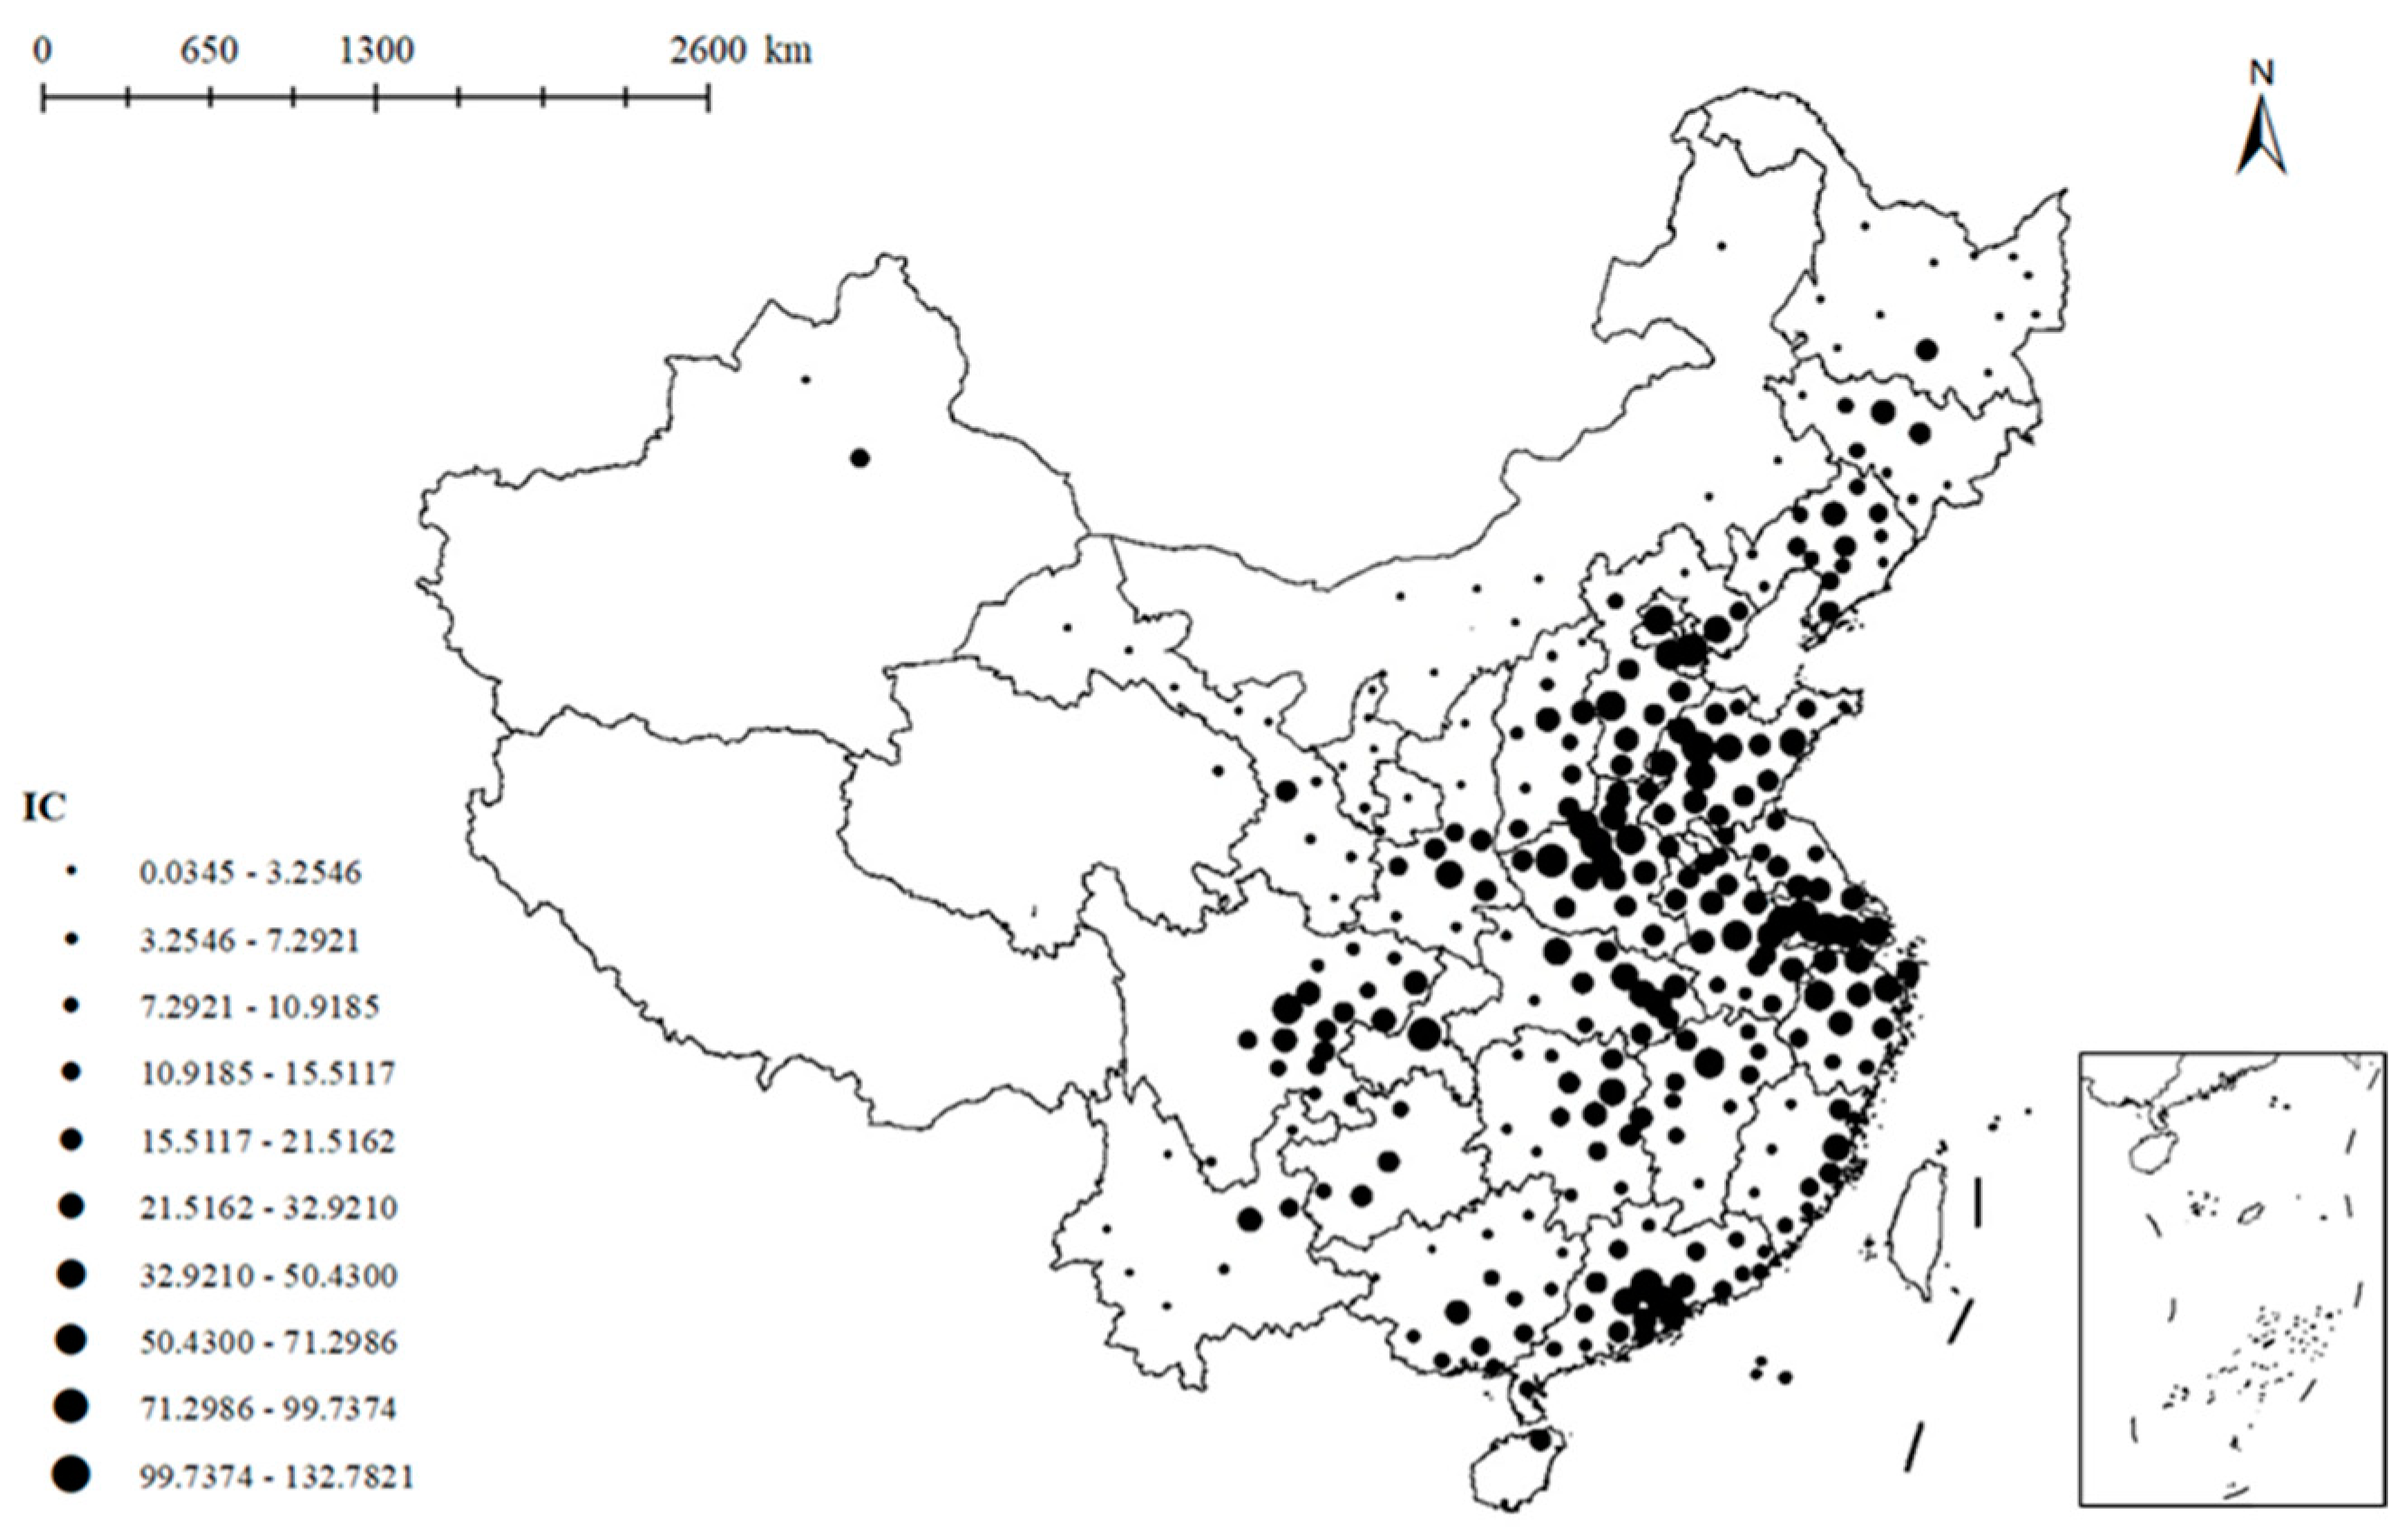
2.2.1. Dependent Variables: The Comprehensive Index of Urban Pollution

Urban environmental pollutants come in various forms, and previous research has predominantly utilized one pollutant for analysis [39]. Given that urban pollution results from the combined effects of multiple pollutants, relying on a single or a few independent pollutant indicators to represent the overall pollution status is insufficient. This paper, considering the availability of pollution data and drawing on the methodology of Xu and Lian [40], selects three pollution indicators—industrial SO2 emissions, industrial smoke and dust emissions, and industrial wastewater emissions—using the entropy weighting method to derive a comprehensive urban pollution index. The entropy weighting method was used due to its ability to objectively weight variables based on variability and significance, with a high theoretical basis and credibility.
The specific steps are as follows:
(1)
Normalize the pollution indicator j for city i: x i j = x i j min { x 1 j , , x n j } max { x 1 j , , x n j } min { x 1 j , , x n j }
(2)
Calculate the proportion of pollutant j of the city i to the total: p i j = x i j / i = 1 n x i j
(3)
Calculate the entropy of the pollution indicator j: e j = k i = 1 n p i j ln ( p i j )
(4)
Calculate the coefficient of variation of the pollution indicator j: d j = 1 e j
(5)
Calculate the weight of the pollution indicator j: w j = d j / j = 1 m d j
(6)
Calculate the comprehensive pollution index for city i: S i = j = 1 m w j p i j .

2.2.2. Key Independent Variable: The Index of Urban Clusters

A precise definition is essential for accurately measuring urban clusters. Urban clusters are defined as collections of high-density, closely connected urban units within a geographical area [8]. In this area, each urban unit interacts with the others to create a spatial structure characterized by an uneven network of economic linkages [8]. Urban clusters are closely related to concepts such as urban agglomerations and conurbations, all of which are characterized by densely populated and well-developed urban areas. Urban agglomerations are highly integrated groups of cities, usually organized around a central city with a core function and with clearer boundaries. Conurbations are densely connected urban areas that lack a clear central city compared to clusters. Urban clusters have flexible moving boundaries, and can include both large and small cities. Urban clusters are more inclusive concepts, with urban agglomerations and conurbations [41]. There are two main measures of the degree of urban clusters in individual city [8]. The first category is based on the total population of all cities within a specific communicable area, excluding the city itself. The second category uses the ratio of the total population of all cities within a communicable area, including the city, to the city’s remoteness (IR). Remoteness is determined by the distance of the city from the nearest central city. This paper adopts the second category because it incorporates the spatial characteristics of the city. The formula for this indicator is as follows:
i c i = j = 1 n p o p j / I R i k
where popj is the total population within a certain communicable area of city i; and n is the total number of cities within a certain communicable area of city i.
The selection of central cities and the determination of their communicable areas are crucial for accurately calculating the degree of urban clusters [42]. Portnov and Schwartz define central cities as those with populations of 500,000 or more and designate a communicable range of 75 km [8]. Considering specific context of study area, we refer to the China-based research of Yuan Qian [38], which extended the communicable area to 150 km. The criteria for selecting central cities are: (1) a population exceeding 1.5 million, and (2) a GDP ranking in the top 2 within the province. To reduce bias from anomalous years, this study averages the population and GDP across the study period. Consequently, 36 cities are identified as central cities (These cities include Beijing, Tianjin, Shijiazhuang, Tangshan, Taiyuan, Shenyang, Dalian, Changchun, Jilin, Harbin, Shanghai, Nanjing, Suzhou, Hangzhou, Ningbo, Hefei, Fuzhou, Nanchang, Jinan, Qingdao, Zhengzhou, Luoyang, Wuhan, Xiangyang, Changsha, Guangzhou, Shenzhen, Nanning, Haikou, Chongqing, Chengdu, Guiyang, Kunming, Xi’an, Lanzhou, and Urumqi). Figure 2 illustrates the overall spatial distribution of the degree of urban clusters in China for 2021.

2.2.3. Control Variables

A series of indicators mentioned in previous studies were used as control variables to reflect the socio-economic conditions of the city [43], specifically: population (in thousands), GDP per capita (CNY), market openness (foreign investment/GDP), fiscal decentralization (government revenue/government expenditure), infrastructure level (fixed-asset investment/GDP), industrialization level (industrial output/GDP), education level (students in higher education institutions/population), and environmental regulation level. The environmental regulation level, as defined by Zhu et al. [44], is measured by the weighted average of the relative emission intensity of various pollutants within the country. The specific formula is: r e g i t = 1 m j = 1 m e r j , i t = 1 m j = 1 m x j , i t / g d p i t ( 1 / n ) / i = 1 n ( x j , i t / g d p i t ) , where x j , i t refers to the emissions of the pollutant j of city i in year t; g d p i t is the gross domestic product of city i in year t; and m and n refer to the number of pollutant types and the number of cities, respectively.

2.3. Empirical Method

2.3.1. Baseline Specification

To assess the environmental protection effects of urban clusters, our empirical specification is as follows:
ln S i t = β 0 + β 1 i c i t + X i t β 2 + μ i + υ t + ε i t
lnSit is the logarithm of the comprehensive index of urban pollution and the dependent variable of this paper. icit indicates the degree of urban clusters and is the key independent variable. The subscript i denotes city and t denotes year. μ represents city fixed effects and υ represents year fixed effects. In addition, this paper incorporates a series of control variables, X′, in the basic regression mode to enhance the reliability of the regression results.
Given that there is a certain inertia in economic factors, that is, the past tends to have some influence on current factors [45]. This paper examines the environmental protection effect of urban clusters needs to take a dynamic perspective, and the historical inertia of urban environmental pollution should be controlled. Consequently, a dynamic panel regression model is employed. This model incorporates the dependent variable lnS with one-period lag, which is outlined as follows:
ln S i t = β 0 + β 1 ln S i , t 1 + β 2 i c i t + X i t β 3 + μ i + υ t + ε i t

2.3.2. Congestion Alleviation

Mitigating the crowding effects resulting from urban scale expansion is a crucial function of urban clusters [38]. Accordingly, this study introduces an interaction term between urban population size and urban clusters in Model (1) to examine how urban clusters alleviate congestion and contribute to pollution reduction. The model is specified as follows:
S i t = β + β i c i t + β p o p i t + β p o p i t × i c i t + X i t β 4 + μ i + υ t + ε i t
popit is the urban population. popit×icit is the primary variable under consideration. A related study by Reis et al. points out that population size is not a perfect variable for measuring the effects of urban clusters [46], but it is a reliable indicator of urban crowding effects and negative externalities. The coefficient β3 of popit×icit represents the impact of urban clusters on crowding effects. A negative coefficient suggests that urban clusters have the ability to alleviate the negative effects of urban congestion to environmental protection.

2.3.3. Industry Structural Optimization

The integration of urban development with environmental protection is primarily evident in the optimization and upgrading of industrial structures in developing countries [47], which signifies a departure from the outdated economic growth model characterized by high inputs, high consumption, high pollution, and low efficiency. Consequently, optimizing the industrial structure of urban clusters plays a crucial role in mitigating urban environmental pollution. This study employs a mediating model to examine this relationship:
i n d i t = α 0 + α 1 i c i t + X i t α 2 + μ 1 i + υ 2 t + ε 3 i t
ln S i t = β 0 + β 1 i c i t + X i t β 2 + μ 2 i + υ 2 t + ε 2 i t
ln S i t = γ 0 + γ 1 i c i t + δ i n d i t + X i t γ 2 + μ 3 i + υ 3 t + ε 3 i t
where indit is the ratio of the output value of the tertiary industry to that of the secondary industry, which is the mediating variable in the model and characterizes the level of industrial structure upgrading in the city. If urban cluster icit can indeed improve urban environmental quality through the industry structural optimization, the following three conditions must be met simultaneously: (i) urban cluster icit has a positive effect on the mediating variable indit, i.e., α1 > 0; (ii) in Equation (5), the mediating variable indit has a significant negative effect, i.e., δ < 0; and (iii) the coefficient of urban cluster icit decreases after the introduction of the mediating variable indit, i.e., |γ1| < |β1|.

2.3.4. Technological Innovation

The expansion of urban clusters not only enhances the collaborative innovation capacity among member cities but also fosters the specialization of technological innovation, which aids in the application of innovative outcomes and the dissemination of technological knowledge [40]. The influence of technological innovation on environmental quality can be observed through advancements in production technology. To determine whether technological innovation serves as a mediating channel for urban clusters to facilitate pollution reduction, the following mediating effect model is used:
p a t e n t i t = α 0 + α 1 i c i t + X i t α 2 + μ 1 i + υ i t + ε 1 i t
ln S i t = β 0 + β 1 i c i t + X i t β 2 + μ 2 i + υ 2 t + ε 2 i t
ln S i t = γ 0 + γ 1 i c i t + λ p a t e n t i t + X i t γ 2 + μ 3 i + υ 3 t + ε 3 i t
patentit represents the number of patent applications per 10,000 people in the city, which is the mediator of the model to measure the level of technological innovation including environmental technology innovation. If the environmental protection effect of urban clusters is indeed partly generated through the technological innovation, the following three conditions must be met simultaneously: (i) urban cluster has positive effect on the mediator variable patent, i.e., α1 > 0; (ii) in Equation (5), the mediator variable patent has a significant negative effect to environmental pollution, i.e., λ < 0; and (iii) after the introduction of the mediator variable patent, the coefficient of the urban cluster icit decreases, i.e., |γ1| < |β1|.

3. Results and Discussion

3.1. Baseline

Firstly, the baseline question is examined: does an increase in the degree of urban clusters in a city affect its environmental pollution? The column (1) of Table 1 only utilizes city fixed effects to investigate the impact of urban cluster on urban environmental pollution. The results indicate that the coefficient for urban clusters (ic) is significantly negative. To account for unobserved temporal heterogeneity, a two-way fixed effects model is subsequently employed. The results are reported in column (2): the coefficient for urban clusters remains significantly negative, indicating that higher urban cluster integration correlates with reduced environmental pollution by approximately 7.5%. This finding suggests that an increase in the degree of urban cluster significantly contributes to reducing urban environmental pollution. The environmental protection effect of urban clusters is thus considerable. Although two-way fixed effects models control for individual characteristics and time trends, as mentioned in the previous analysis, urban environmental pollution is not only influenced by current factors, but also by past pollution levels. Dynamic panel regressions can take into account the historical inertia of environmental pollution and improve causal inference. The system generalized method of moments (GMM) overcomes both the endogeneity problem and the dynamic analysis of the lagged terms of the explanatory variables. Consequently, the paper adopted a dynamic panel model that includes one-period lag terms of the dependent variables and performed regression using the system GMM. The regression results of this dynamic panel model, reported in column (3) of Table 1, show that the coefficient for urban clusters remains significantly negative. This indicates that the environmental protection effect of urban clusters persists even when accounting for the historical inertia of urban environmental pollution.

3.2. Potential Mechanisms

3.2.1. Mechanism Test of Congestion Alleviation

In order to test the congestion alleviation path of the urban clusters on environmental pollution, the interaction term between urban clusters and population is introduced, and the regression results are shown in Table 2. The coefficient of this interaction term represents ln S / p o p / i c , which quantifies the moderating effect of increased urban clusters on urban crowding effects. Column (1) of Table 2 presents the regression results for the full sample under the two-way fixed effects model. The coefficient of the interaction term is significantly negative. This finding confirms the mechanism through which urban clusters reduce environmental pollution by alleviating congestion resulting from urban expansion. According to the results in column (1) and Equation (3), the degree of urban clusters must reach at least 80.21 to counterbalance the crowding effects of city size. However, in 2017, the average degree of urban clusters among Chinese cities was approximately 27.69. Therefore, China’s urban clusters have not yet developed to the degree that they can completely relieve the crowding effects, and there is still a need to vigorously strengthen the planning and construction of urban clusters. Some studies based in China have also highlighted that the effectiveness of urban clusters in alleviating environmental pollution requires reaching a certain scale. For example, Chen et al. suggest that the inflection point of ecological efficiency improvement by agglomeration is 3.4 [48]. The alleviating congestion of urban clusters has also been reflected in China. Particularly in the development of the Beijing–Tianjin–Hebei urban cluster, its center city, Beijing, has been facing severe congestion in terms of traffic, population, and so on. In recent years, Beijing has utilized the advantages of urban clusters to transfer “non-capital functions”. That is, relocating some industries and public service functions (including non-core government offices, education, medical resources, etc.) to neighboring cities. There has also been the construction of intercity railroads, satellite cities, etc. With the implementation of these measures, Beijing’s growing congestion effect has been somewhat alleviated by the development of urban clusters.
There may also be differences in the impact of congestion effects generated by cities due to their different population sizes. The paper subsequently divided the sample of cities into large and small city groups based on whether the average population of a city ranks in the top half of the study period, and discussed how the effect of congestion alleviation by urban clusters varies across these samples. Columns (2) and (3) of Table 2 present the results for these two groups: the coefficient of the interaction term, β3, is significantly negative for large cities and insignificant for small cities.
The above regression results suggest that the increase in the degree of urban clusters significantly mitigates the crowding effects in large cities, but does not have the same impact in small cities. This discrepancy may be attributed to the fact that large cities, during the formation of urban clusters, expand outward to avoid internal diseconomies and reduce negative externalities. Consequently, the crowding effects in large cities diminish, and there is a certain degree of population mobility from large cities to smaller ones. As smaller cities grow due to population inflows, their external costs of expansion may eventually outweigh the benefits, leading to increased crowding effects rather than alleviation. Given these reasons, it is essential for urban planners to implement policies that not only promote intercity cooperation in population but also ensure that smaller cities are equipped to handle population growth sustainably. This could include investing in infrastructure, enhancing public transportation networks, and promoting green spaces to alleviate the negative externalities of urbanization [49].

3.2.2. Mechanism Test of Industry Structural Optimization

Understanding how urban clusters optimize and upgrade their industrial structures is crucial for assessing the environmental protection effects of urban clusters. In this study, ind represents the level of industrial structure upgrading and is used as a mediating factor to specifically examine whether urban clusters can improve environmental efficiency through industrial structure optimization. Column (1) of Table 3 evaluates the impact of an increase in the degree of urban clusters on industrial structure. The coefficient ic, representing urban clusters, is statistically significant suggesting that a one-unit increase in the degree of urban clusters corresponds to 5.2087 units of advancement in the industrial structure. In column (3), the effect of the industrial structure on the comprehensive index of urban pollution is negatively significant, verifying the positive role of industrial structure optimization in promoting urban pollution reduction. More specifically, industrial structure optimization refers to the adjustment and upgrading of the weight and layout of various industries within a city, usually involving the development of high-technology, green, and service sectors, and thus often resulting in benefits such as economic efficiency and sustainable development. Furthermore, when compared to the regression results presented in column (2), the coefficient for urban clusters decreased from −0.075 to −0.073, validating the mediating role of industrial structure optimization. This suggests that an increase in urban clusters enhances the upgrading of a city’s industrial structure, which in turn leads to a reduction in pollution through this optimization process.
The mediating effect of industrial structure optimization may differ among cities within the same urban cluster due to significant variations in labor division and technological levels. This paper categorizes the sample cities into developed and less developed groups based on whether the average GDP of a city ranks in the top half of the study period, and examines the differential impacts of urban clusters on these groups. Columns (4–6) and (7–9) of Table 3 report the results of the mediation analysis for these two sample groups, respectively. The coefficients of urban clusters for the developed cities meet the criteria for the mediation test, whereas those for the less developed cities do not.
These findings indicate that while urban clusters can optimize and upgrade the industrial structure of cities, this effect is more pronounced in developed cities and does not significantly impact less developed cities. The primary reason for this disparity may be that the development trajectory of developed cities tends to involve industrial diversification, technological advancement, and innovation, while less developed cities primarily focus on expanding urban industrialization. These differing objectives lead to varied environmental impacts: developed cities exhibit more environmentally friendly outcomes, whereas less developed cities tend to experience greater pollution. Thus, the structural optimization of urban clusters demonstrates clearer benefits for environmental protection in developed cities. This difference is also supported by other studies. For instance, Li et al. found that new urbanization efforts had no significant effect on haze pollution in resource-rich cities but were most effective in reducing pollution in highly urbanized, developed cities [33]. These findings, while reconfirming the positive impact of urban clusters on industrial progress and economic development, also show the diversity of environmental impacts of them on different groups of cities. Therefore, to enhance both technological development and environmental sustainability across urban clusters, it is essential to implement targeted policies that not only promote economic progress but also ensure that industrial growth is coupled with environmental protections, particularly in the early stages of urban development. Such targeted interventions could help bridge the environmental gap between developed and less developed urban areas within a cluster, ensuring more balanced and effective environmental protection outcomes.

3.2.3. Mechanism Test of Technological Innovation

One of the most effective ways to improve urban environmental quality is to promote technological innovation [50]. Technological innovation plays a crucial role in mitigating urban environmental degradation by fostering the development and application of clean technologies, energy-efficient systems, and pollution-control mechanisms [51]. Agglomeration plays a significant role in fostering innovation by facilitating knowledge spillovers, concentrating talent and capital, and promoting collaboration [52]. To investigate whether technological innovation mediates the relationship between urban clusters and environmental pollution, this paper performed a regression based on Equations (7)–(9), and the results are presented in Table 4. In column (1), urban clusters have a positive and statistically significant effect on the level of urban technological innovation. Specifically, for every one unit increase in the degree of urban cluster, the number of patent applications per 10,000 people in the city will increase by 853.1 units. This finding supports the traditional view that urban clusters, by concentrating human and financial capital, etc., foster an environment conducive to innovation and technological development. Column (3) shows that urban technological innovation has a significantly negative impact on the comprehensive index of urban pollution, which further validates the positive role of technological innovation in promoting urban pollution reduction and emission reduction. Furthermore, compared to the results in column (2), the coefficient for urban clusters decreases from −0.075 to −0.047 when technological innovation is included, suggesting that a significant portion of the environmental benefits attributed to urban clusters may be mediated through the development and adoption of innovative technologies [53].
This finding supports the hypothesis that technological innovation mediates the effect of urban clusters on urban environmental pollution. These results emphasize the role of urban clusters in driving sustainable development. As human societies continue to face the dual challenges of rapid urbanization and environmental degradation, it becomes increasingly evident that fostering technological innovation within urban clusters is essential for achieving a balance between economic growth and environmental sustainability [54].

3.3. Robustness Tests

The above studies have identified the environmental protection effects of urban clusters and their three mechanisms. To assess the robustness of the conclusions presented in this paper, the following steps were taken.
First, since urban populations are used to measure the degree of urban clusters, there is a possibility that the significance of urban clusters might simply reflect the effects of economic agglomeration. To address this, this paper introduces the logarithm of urban population density into a baseline model, to determine if the original conclusion remains valid. Column (1) of Table 5 presents the results, which indicate that incorporating “Ln population density” does not alter the role of urban clusters in reducing urban pollution. Therefore, the measurement of the urban clusters used in this study is considered more reliable. Second, to determine the communicable range of cities before measuring urban clusters, a distance of 150 km is used in this study. To assess the robustness of this criterion, this paper re-evaluates the degree of urban clusters and performs subsequent regressions using 200 km and 250 km as alternative criteria. Alternative thresholds of 200 km and 250 km were tested to assess the sensitivity of results to variations in urban cluster definitions, reflecting potential regional differences in connectivity. The results are reported in columns (2) and (3). Compared to the previous regression results, the coefficients for urban clusters with different communicable scales remain negatively significant, indicating that the regressions are robust across various communicable scales. Third, the evaluation of the environmental protection effect of urban clusters encounters an endogeneity problem. To address this issue, which may arise from mutual causation, this study mitigates it by introducing a one-period lag for the independent variables. Specifically, the independent variables of urban clusters and population, which are susceptible to endogeneity, were lagged by one period. The regression results are presented in column (4). The findings indicate that the coefficient for urban clusters remains significantly negative, suggesting that the results are robust. Of course, it should be pointed out that although lagging independent variables address simultaneity bias, residual endogeneity due to omitted variable bias or measurement errors may persist. Finally, this study used only three pollution indicators to derive a comprehensive urban pollution index, which may change the results of the study when more pollutant indicators are considered. Therefore, we newly included PM2.5, using four indicators to construct the dependent variable. The results are shown in column (5), and the significance and size of the regression results did not show obvious changes.

4. Conclusions

This paper empirically examines the impact of urban clusters on environmental pollution and its underlying mechanisms using Chinese urban panel data from 2006 to 2021. The primary conclusions are as follows: (1) Urban clusters significantly reduce environmental pollution through mechanisms such as congestion alleviation, and industrial optimization. Urban clusters contribute to enhanced environmental protection. Specifically, for every one unit increase in the degree of urban cluster, the comprehensive index of urban pollution decreases by approximately 7.5%. This finding highlights the potential for urban clusters to contribute to environmental protection. Although urban agglomeration can lead to a concentration of pollutants and thus potentially a worse ecological environment, the ability of cities to deal with pollution is enhanced because of better synergies, innovation, etc., brought about by agglomeration. (2) Regarding the intrinsic mechanisms, the effect of urban clusters operates through three main channels: congestion alleviation, industry structural optimization, and technological innovation. Each of these mechanisms operates differently depending on the size and stage of development of the cities involved. Firstly, urban clusters reduce environmental pollution primarily through alleviating congestion resulting from city expansion, though this effect is significant mainly in large cities. As urban areas expand, they often experience increased congestion, leading to higher levels of vehicle emissions, industrial discharge, and other forms of pollution. Urban clusters, however, can ease this congestion by promoting better spatial organization, optimizing transportation networks, and decentralizing economic activities across a region. A second important mechanism through which urban clusters influence pollution is industrial structure optimization. Urban clusters tend to foster the development of more efficient and cleaner industrial structures. The clustering of cities can facilitate the sharing of resources, such as energy and labor, which in turn allows for the reallocation of industries in a way that minimizes pollution. However, the effect of industrial structure optimization is less pronounced in less developed cities, where industries are often still in the early stages of development and may rely on more resource-intensive and polluting production methods. Lastly, technological innovation serves as a crucial channel through which urban clusters facilitate reductions in urban pollution. The proximity and agglomeration in urban clusters create opportunities for the exchange of knowledge, the diffusion of technological innovations, and the development of green technologies. This process enhances the ability of cities to adopt more sustainable practices, such as the use of renewable energy, waste management technologies, and energy-efficient construction, and new technologies can help transform traditional, polluting industries into more sustainable ones.
The development of urban clusters should remain the main trend of future urbanization in most developing countries. The first mention of urban clusters in the national strategy of China appeared in the 11th Five-Year Plan in 2005, but urban clusters in practice had been developing for many years by then. It is therefore reasonable to believe that previous development of urban clusters was inadequately planned, but proactive urban cluster planning is essential for sustainable urbanization growth [55]. There should be a higher level of coordinated action within city clusters, such as industrial planning and the provision of public goods [56]. The empirical findings of this study also reflect more the objective environmental benefits of urban clusters than the active environmental considerations in the design of urban clusters in the past. Therefore, in the future, urban clusters of varying sizes and characteristics should be strategically planned in each region based on local features, and environmental effects should be actively taken into account. Moreover, in the development of urban clusters, particular attention should be paid to the environmental protection of small and underdeveloped cities, and policies should be actively adopted to eliminate the “transfer of pollution” brought about by their unfavorable position in the industrial division [57]. Establishing a robust connection between scientific content and urban environmental pollution is essential to addressing future worldwide environmental governance challenges, as it fosters evidence-based decision-making and drives innovative solutions for mitigating pollution in increasingly complex urban contexts [58]. In conclusion, this study provides empirical evidence addressing the academic debate in the field of environmental policy, urban studies, and sustainability regarding whether urban clusters can mitigate environmental pollution, and highlights the potential of urban clusters as a governance tool for environmental protection and urban sustainability. Consequently, the study’s design and measurement of key variables offer references for scholars interested in these issues, while the findings provide policy insights for policymakers in rapidly urbanizing regions such as Southeast Asia. However, the policy implications for regions that have largely completed urbanization are limited. This study has several limitations. Firstly, it relies on data from China, which may limit the generalizability of the findings, especially for regions at different urbanization stages. Future research should include cross-regional comparisons, which could also capture the environmental impacts of urban clusters at various stages of urbanization. Additionally, while the environmental impacts of urban clusters could be interpreted as a combined effect of all industries, the environmental impacts of agglomeration may vary across different industries. Therefore, future studies could focus on specific industries or sectors. Finally, although a series of robustness tests were conducted, this study has limitations in addressing unobserved confounders, which is a common challenge when using observational data for causal inference. Future research could advance inference methods to facilitate more accurate causal analysis.

Author Contributions

Conceptualization, Z.X. and J.L.; Methodology, Z.X. and J.L.; Software, Z.X.; Validation, Z.X.; Formal analysis, Z.X.; Investigation, Z.X.; Resources, Z.X.; Data curation, Z.X.; Writing—original draft, Z.X.; Writing—review & editing, Z.X.; Visualization, Z.X.; Supervision, Z.X.; Funding acquisition, J.L. All authors have read and agreed to the published version of the manuscript.

Funding

This research was supported by the Youth Program of the National Social Science Fund of China (22CGL032).

Institutional Review Board Statement

Not applicable.

Informed Consent Statement

Not applicable.

Data Availability Statement

The data presented in this study are available on request from the corresponding author.

Conflicts of Interest

The authors declare that they have no competing interests.

References

  1. IPCC. IPCC Climate Change 2007: Synthesis Report; IPCC: Geneva, Switzerland, 2007. [Google Scholar]
  2. Chien, F.; Sadiq, M.; Nawaz, M.A.; Hussain, M.S.; Tran, T.D.; Le Thanh, T. A step toward reducing air pollution in top Asian economies: The role of green energy, eco-innovation, and environmental taxes. J. Environ. Manag. 2021, 297, 113420. [Google Scholar] [CrossRef] [PubMed]
  3. IPCC. IPCC Climate Change 2022: Impacts, Adaptation and Vulnerability; IPCC: Geneva, Switzerland, 2022. [Google Scholar]
  4. IPCC. IPCC Summary for Policymakers of the Sixth Assessment Report of Working Group II; IPCC: Geneva, Switzerland, 2021. [Google Scholar]
  5. Douglas, I. The political filter in the local implementation of initiatives relating to urban ecology. Landsc. Urban Plan. 2014, 125, 312–319. [Google Scholar] [CrossRef]
  6. Joss, S. Eco-cities and Sustainable Urbanism. In International Encyclopedia of the Social & Behavioral Sciences; Elsevier: Oxford, UK, 2015; pp. 829–837. [Google Scholar]
  7. Zhang, Q.; Tao, Y. Synergistic Agglomeration of Manufacturing and Logistics Industries and Urban Green Economy Efficiency: Influence and Upgrading. Math. Probl. Eng. 2023, 2023, 8118981. [Google Scholar] [CrossRef]
  8. Portnov, B.A.; Schwartz, M. Urban Clusters as Growth Foci. J. Reg. Sci. 2009, 49, 287–310. [Google Scholar] [CrossRef]
  9. Sun, X.; Li, M.; Hou, S.; Zhang, C. Research on the Spatial Network Characteristics, Synergistic Emission Reduction Effects and Mechanisms of Carbon Emission in Beijing-Tianjin-Hebei Urban Agglomeration. Sustainability 2023, 15, 8176. [Google Scholar] [CrossRef]
  10. Meijers, E.J.; Burger, M.J.; Hoogerbrugge, M.M. Borrowing size in networks of cities: City size, network connectivity and metropolitan functions in Europe. Pap. Reg. Sci. 2016, 95, 181–198. [Google Scholar] [CrossRef]
  11. Yan, H.; Liu, Z. A New Perspective on the Evaluation of Urbanization Sustainability: Urban Health Examination. Sustainability 2023, 15, 9338. [Google Scholar] [CrossRef]
  12. He, L.; Yuan, E.; Yang, K.; Tao, D. Does technology innovation reduce haze pollution? An empirical study based on urban innovation index in China. Environ. Sci. Pollut. Res. 2022, 29, 24063–24076. [Google Scholar] [CrossRef]
  13. Piracha, A.; Chaudhary, M.T. Urban Air Pollution, Urban Heat Island and Human Health: A Review of the Literature. Sustainability 2022, 14, 9234. [Google Scholar] [CrossRef]
  14. Zeng, G.; Hu, Y.; Zhong, Y. Industrial agglomeration, spatial structure and economic growth: Evidence from urban cluster in China. Heliyon 2023, 9, e19963. [Google Scholar] [CrossRef]
  15. Perz, S.G.; Aramburu, C.; Bremner, J. Population, land use and deforestation in the Pan Amazon Basin: A comparison of Brazil, Bolivia, Colombia, Ecuador, Peru and Venezuela. Environ. Dev. Sustain. 2005, 7, 23–49. [Google Scholar] [CrossRef]
  16. Pramanik, S.; Punia, M.; Yu, H.; Chakraborty, S. Is dense or sprawl growth more prone to heat-related health risks? Spatial regression-based study in Delhi, India. Sustain. Cities Soc. 2022, 81, 103808. [Google Scholar] [CrossRef]
  17. Hankey, S.; Marshall, J.D. Impacts of urban form on future US passenger-vehicle greenhouse gas emissions. Energy Policy 2010, 38, 4880–4887. [Google Scholar] [CrossRef]
  18. Lyons, T.J.; Kenworthy, J.R.; Moy, C.; dos Santos, F. An international urban air pollution model for the transportation sector. Transp. Res. Part D-Transp. Environ. 2003, 8, 159–167. [Google Scholar] [CrossRef]
  19. Oliveira, E.A.; Andrade, J.S., Jr.; Makse, H.A. Large cities are less green. Sci. Rep. 2015, 4, 4235. [Google Scholar] [CrossRef]
  20. Satterthwaite, D. Environmental transformations in cities as they get larger, wealthier and better managed. Geogr. J. 1997, 163, 216–224. [Google Scholar] [CrossRef]
  21. Sharma, G.K.; Ghuge, V.V. How urban growth dynamics impact the air quality? A case of eight Indian metropolitan cities. Sci. Total Environ. 2024, 930, 172399. [Google Scholar] [CrossRef]
  22. Yang, Y.; Yan, D. Does urban sprawl exacerbate urban haze pollution? Environ. Sci. Pollut. Res. 2021, 28, 56522–56534. [Google Scholar] [CrossRef]
  23. Feng, L.; Shang, S.; Feng, X.; Kong, Y.; Bai, J. Evolution and Trend Analysis of Research Hotspots in the Field of Pollution-Intensive Industry Transfer-Based on Literature Quantitative Empirical Study of China as World Factory. Front. Environ. Sci. 2022, 10, 732734. [Google Scholar] [CrossRef]
  24. Grossman, G.M.; Krueger, A.B. Economic-growth and the environment. Q. J. Econ. 1995, 110, 353–377. [Google Scholar] [CrossRef]
  25. Levinson, A. Technology, International Trade, and Pollution from US Manufacturing. Am. Econ. Rev. 2009, 99, 2177–2192. [Google Scholar] [CrossRef]
  26. Liu, Y.; Guo, M. The impact of FDI on haze pollution: “Pollution paradise” or “pollution halo?”--Spatial analysis of PM2.5 concentration raster data in 283 cities. Front. Environ. Sci. 2023, 11, 1133178. [Google Scholar] [CrossRef]
  27. Drut, M.; Mahieux, A. Correcting agglomeration economies: How air pollution matters. Pap. Reg. Sci. 2017, 96, 381–401. [Google Scholar] [CrossRef]
  28. Rahman, M.M.; Mahamud, S.; Thurston, G.D. Recent spatial gradients and time trends in Dhaka, Bangladesh, air pollution and their human health implications. J. Air Waste Manag. Assoc. 2019, 69, 478–501. [Google Scholar] [CrossRef]
  29. Fan, Q.; Yang, S.; Liu, S. Asymmetrically Spatial Effects of Urban Scale and Agglomeration on Haze Pollution in China. Int. J. Environ. Res. Public Health 2019, 16, 4936. [Google Scholar] [CrossRef] [PubMed]
  30. Tao, J.; Wang, Y.; Zameer, H. Can urban spatial structure adjustment mitigate air pollution effect of economic agglomeration? New evidence from the Yangtze River Delta region, China. Environ. Sci. Pollut. Res. 2023, 30, 57302–57315. [Google Scholar] [CrossRef] [PubMed]
  31. Zhang, W.; Cui, R.; Li, C.; Ge, H.; Zhang, Z.; Tang, X. Impact of urban agglomeration construction on urban air quality-empirical test based on PSM-DID model. Sci. Rep. 2023, 13, 15099. [Google Scholar] [CrossRef] [PubMed]
  32. Fang, J.; Tang, X.; Xie, R.; Han, F. The effect of manufacturing agglomerations on smog pollution. Struct. Change Econ. Dyn. 2020, 54, 92–101. [Google Scholar] [CrossRef]
  33. Li, J.; Li, F.; Li, J. Does new-type urbanization help reduce haze pollution damage? Evidence from China’s county-level panel data. Environ. Sci. Pollut. Res. 2022, 29, 47123–47136. [Google Scholar] [CrossRef]
  34. Wei, X.; Li, H.; Du, Y. Can urban cluster policies improve innovation? Evidence from China. Appl. Econ. Lett. 2023, 1–7. [Google Scholar] [CrossRef]
  35. Wang, Z.; Yang, J.; Jiang, J. Urban Sprawl and Haze Pollution: Based on Raster Data of Haze PM2.5 Concentrations in 283 Cities in Mainland China. Front. Environ. Sci. 2022, 10, 929558. [Google Scholar] [CrossRef]
  36. Yu, Q.; Li, M.; Li, Q.; Wang, Y.; Chen, W. Economic agglomeration and emissions reduction: Does high agglomeration in China’s urban clusters lead to higher carbon intensity? Urban Clim. 2022, 43, 101174. [Google Scholar] [CrossRef]
  37. Huang, Y.; Li, L.; Yu, Y. Does urban cluster promote the increase of urban eco-efficiency? Evidence from Chinese cities. J. Clean. Prod. 2018, 197, 957–971. [Google Scholar] [CrossRef]
  38. Yuan, Q. Do Urban Clusters Promote the Development of Cities? J. World Econ. 2016, 39, 99–123. [Google Scholar]
  39. Hashmi, S.H.; Fan, H.; Fareed, Z.; Shahzad, F. Asymmetric nexus between urban agglomerations and environmental pollution in top ten urban agglomerated countries using quantile methods. Environ. Sci. Pollut. Res. 2021, 28, 13404–13424. [Google Scholar] [CrossRef] [PubMed]
  40. Xu, D.; Yu, B.; Liang, L. High-Tech Industrial Agglomeration and Urban Innovation in China’s Yangtze River Delta Urban Agglomeration: From the Perspective of Industrial Structure Optimization and Industrial Attributes. Complexity 2022, 2022, 2555182. [Google Scholar] [CrossRef]
  41. Tiwari, A.K.; Antoniuk, V.S.; Lapo, A.S.; Vansovich, E.R. Managing urban agglomeration processes in Russia in the context of agglomerative and socio-economic development. Heliyon 2024, 10, e28654. [Google Scholar] [CrossRef]
  42. Zhang, Q.; Hu, Y.; Liu, J.; Liu, Y.; Ren, W.; Li, J. A quantitative assessment of the distribution and extent of urban clusters in China. J. Geogr. Sci. 2012, 22, 137–151. [Google Scholar] [CrossRef]
  43. Wei, J.; Ye, Y.; Yu, H. Manufacturing agglomeration, urban form, and haze pollution. Environ. Sci. Pollut. Res. 2023, 30, 18921–18936. [Google Scholar] [CrossRef] [PubMed]
  44. Zhu, P.; Zhang, Z.; Jiang, G. Empirical Study of the Relationship between FDI and Environmental Regulation: An Intergovernmental Competition Perspective. Econ. Res. 2011, 46, 133–145. [Google Scholar]
  45. Lecocq, F.; Hourcade, J.C.; Duong, M.H. Decision making under uncertainty and inertia constraints: Sectoral implications of the when flexibility. Energy Econ. 1998, 20, 539–555. [Google Scholar] [CrossRef]
  46. Reis, J.P.; Silva, E.A.; Pinho, P. Spatial metrics to study urban patterns in growing and shrinking cities. Urban Geogr. 2016, 37, 246–271. [Google Scholar] [CrossRef]
  47. Zhang, Q.; Wang, Y.; Zhang, W.; Xu, J. Energy and resource conservation and air pollution abatement in China’s iron and steel industry. Resour. Conserv. Recycl. 2019, 147, 67–84. [Google Scholar] [CrossRef]
  48. Chen, C.; Sun, Y.; Lan, Q.; Jiang, F. Impacts of industrial agglomeration on pollution and ecological efficiency-A spatial econometric analysis based on a big panel dataset of China’s 259 cities. J. Clean. Prod. 2020, 258, 120721. [Google Scholar] [CrossRef]
  49. Jia, C.; Feng, S.; Chu, H.; Huang, W. The Heterogeneous Effects of Urban Form on CO2 Emissions: An Empirical Analysis of 255 Cities in China. Land 2023, 12, 981. [Google Scholar] [CrossRef]
  50. Yin, Z.H.; Zeng, W.P. Path to sustainable development: Can industrial intelligence and technological innovation balance economic growth and environmental quality in China? Sustain. Dev. 2024, 32, 4486–4504. [Google Scholar] [CrossRef]
  51. Li, D.; Hu, S. How Does Technological Innovation Mediate the Relationship between Environmental Regulation and High-Quality Economic Development? Empirical Evidence from China. Sustainability 2021, 13, 2231. [Google Scholar] [CrossRef]
  52. Smit, M.J.; Abreu, M.A.; de Groot, H.L.F. Micro-evidence on the determinants of innovation in the Netherlands: The relative importance of absorptive capacity and agglomeration externalities. Pap. Reg. Sci. 2015, 94, 249–272. [Google Scholar] [CrossRef]
  53. Koengkan, M.; Kazemzadeh, E.; Fuinhas, J.A.; Tash, M.N.S. Heterogeneous impact of eco-innovation on premature deaths resulting from indoor and outdoor air pollution: Empirical evidence from EU29 countries. Environ. Sci. Pollut. Res. 2023, 30, 2298–2314. [Google Scholar] [CrossRef]
  54. Lyu, L.; Sun, F.; Huang, R. Innovation-based urbanization: Evidence from 270 cities at the prefecture level or above in China. J. Geogr. Sci. 2019, 29, 1283–1299. [Google Scholar] [CrossRef]
  55. Marosi, Z.; Adorean, E.-C.; Ilovan, O.-R.; Gligor, V.; Voicu, C.-G.; Nicula, A.-S.; Dulama, M.E. Living the urban cultural landscapes in the city centre of cluj-napoca/kolozsvar/klausenburg, romania. Mitt. Osterr. Geogr. Ges. 2019, 161, 117–160. [Google Scholar] [CrossRef]
  56. Yang, J.; Jin, M.; Chen, Y. Has the synergistic development of urban cluster improved carbon productivity?—Empirical evidence from China. J. Clean. Prod. 2023, 414, 137535. [Google Scholar] [CrossRef]
  57. Siqin, G.; Huijuan, W. Analysis of Industrial Carbon Transfer in Beijing-Tianjin-Hebei City Cluster and Surrounding Areas. Front. Environ. Sci. 2022, 10, 895142. [Google Scholar] [CrossRef]
  58. Vac, M.B.; Soporan, V.F.; Cocis, E.A.; Batrînescu, G.; Nemes, O. Gas analysis of municipal landfill emissions. Stud. Univ. Babes-Bolyai Chem. 2012, 57, 23–30. [Google Scholar]
Figure 1. Distribution of sample cities in this study.
Sustainability 17 00873 g001
Figure 2. The overall spatial distribution of the degree of urban clusters in China in 2021.
Sustainability 17 00873 g002
Table 1. Baseline results.
(1)(2)(3)
ic−0.165 ***
(0.027)
−0.075 ***
(0.021)
−0.030 ***
(0.002)
pop1.288 ***
(0.0906)
0.507 ***
(0.0730)
0.218 ***
(0.0553)
GDP per capita−0.087 ***
(0.004)
−0.023
(0.052)
0.060
(0.039)
Market openness−0.010 ***
(0.002)
−0.004 *
(0.002)
−0.002
(0.001)
Fiscal decentralization1.2558 ***
(0.0968)
−0.0946
(0.0829)
−0.0274
(0.0630)
Infrastructure level−0.002
(0.036)
−0.053 *
(0.032)
0.005
(0.023)
Industrialization level0.002 ***
(0.0002)
−0.11
(0.19)
−0.07
(0.14)
Education level−0.103
(0.0016)
−0.010
(0.0013)
0.011
(0.0010)
Environmental regulation level2.4897 ***
(0.0822)
2.2745 ***
(0.0668)
1.9047 ***
(0.0515)
L.LnS 0.6119 ***
(0.0100)
Constant−16.5547 ***
(0.5260)
−11.6360 ***
(0.4244)
−4.7883 ***
(0.3429)
City fixed effects
Year fixed effects
Observations482848284828
R20.22140.2943
Note: Robust standard errors clustered at city level are reported in parentheses. *** p < 0.01, * p < 0.1.
Table 2. Congestion alleviation path of the urban clusters on environmental pollution.
OverallBig Cities GroupSmall Cities Group
(1)(2)(3)
ic0.0643 ***
(0.0094)
0.0747 ***
(0.0126)
−0.0379
(0.0306)
pop0.8823 ***
(0.0869)
0.8953 ***
(0.1483)
0.6773 ***
(0.1342)
ic × pop−0.0110 ***
(0.0014)
−0.0119 ***
(0.0019)
0.0053
(0.0053)
City fixed effects
Year fixed effects
Observations482824142414
R20.28930.21370.2871
Note: Robust standard errors clustered at city level are reported in parentheses. *** p < 0.01.
Table 3. Mediation analysis of industrial structures.
Overall
(1)(2)(3)
ic5.2087 *
(2.9515)
−0.075 ***
(0.0021)
−0.073 ***
(0.0021)
ind −0.04 ***
(0.01)
City fixed effects
Year fixed effects
Observations482848284828
R20.36070.29430.3004
Developed Cities GroupLess Developed Cities Group
(4)(5)(6)(7)(8)(9)
ic6.6760 ***
(2.3771)
−0.055 ***
(0.0021)
−0.045 **
(0.0020)
−1.4093
(8.3682)
−0.0103 *
(0.0056)
−0.0103 *
(0.0056)
ind −0.012 ***
(0.00)
0.001
(0.00)
City fixed effects
Year fixed effects
Observations241424142414241424142414
R20.23190.32840.25310.32450.31640.3154
Note: Robust standard errors clustered at city level are reported in parentheses. *** p < 0.01, ** p < 0.05, * p < 0.1.
Table 4. Mediation analysis of technological innovation.
(1)(2)(3)
ic1312.22 ***
(61.40)
−0.075 ***
(0.021)
−0.047 **
(0.022)
patent −0.023 ***
(0.000)
City fixed effects
Year fixed effects
Observations482848284828
R20.31640.37340.3529
Note: Robust standard errors clustered at city level are reported in parentheses. *** p < 0.01, ** p < 0.05.
Table 5. Robustness tests.
(1)(2)(3)(4)(5)
ic−0.079 ***
(0.021)
−0.068 ***
(0.014)
−0.059 ***
(0.012)
−0.069 ***
(0.022)
−0.072 ***
(0.019)
Ln population density−0.3880 ***
(0.1071)
Controls
City fixed effects
Year fixed effects
Observations48284828482848284828
R20.17260.22040.17220.34210.2219
Note: Robust standard errors clustered at city level are reported in parentheses. *** p < 0.01.
Disclaimer/Publisher’s Note: The statements, opinions and data contained in all publications are solely those of the individual author(s) and contributor(s) and not of MDPI and/or the editor(s). MDPI and/or the editor(s) disclaim responsibility for any injury to people or property resulting from any ideas, methods, instructions or products referred to in the content.

