Article

Odorous Emissions During the Use of the Intermediate Fraction as an Additive to the Green Waste Composting Process

by
Mirosław Szyłak-Szydłowski
1,* and
Wojciech Kos
1,2
1
Warsaw University of Technology, Faculty of Building Services, Hydro and Environmental Engineering, Nowowiejska 20 St., 00-653 Warsaw, Poland
2
Miejskie Przedsiębiorstwo Oczyszczania w M.st. Warszawie Sp. z o.o., Obozowa 43 St., 01-161 Warsaw, Poland
*
Author to whom correspondence should be addressed.
Sustainability 2025, 17(3), 851; https://doi.org/10.3390/su17030851
Submission received: 30 November 2024 / Revised: 10 January 2025 / Accepted: 20 January 2025 / Published: 22 January 2025

Abstract

:
Composting is a key component of sustainable development strategies, as it supports ecological waste management, minimises the impact of human activities on the environment, and promotes the efficient use of natural resources. Reducing the generation of additional waste—as “recirculation” of composted waste—is also an important indicator of sustainability processes. The intermediate fraction (IF) is the material within the 10 mm to 60–90 mm range. It can be incorporated into composting materials to enhance the composting process. Maintaining an appropriate proportion of this fraction in the compost mixture is crucial for its practical use. This research examined the impact of adding the IF to composting on reducing the release of odorous substances. Additionally, it aimed to optimise the composting process by effectively managing the fraction. Optimisation sought to achieve high-quality compost, minimise odour emissions, and enhance the overall efficiency of the process. The study enabled the selection of the optimal variant—adding 9% of IF with inoculum—considering both ammonia emissions and odour impact. This variant yielded 13% less ammonia and 37% less odour than the variant without additives. This included identifying the intermediate fraction’s ideal proportion and adding pre-composted waste to compost piles.

1. Introduction

Composting has emerged as a viable alternative for stabilising organic waste, primarily due to its straightforward implementation at waste generation sites [1,2]. This process entails aerobic biodegradation of organic materials and stabilisation under controlled thermophilic and aerobic conditions, ultimately forming compost [3,4]. The processes involved in composting yield products with notable fertilising efficacy. Consequently, the objectives of these processes encompass the recovery and organic recycling of materials, reclassification of waste as a resource, and generation of compost. While the primary benefit of composting lies in its capacity to mitigate the environmental repercussions of biodegradable waste, it is essential to note that these processes can also emit gaseous pollutants into the atmosphere [5]. By mass, carbon dioxide is the primary compound released into the atmosphere during composting processes. Since the production of CO2 is a natural outcome of organic decomposition and the carbon in most compost feedstocks is biogenic—originating from the current carbon cycle rather than fossil sources—these emissions are considered climate-neutral [6,7]. According to the literature, the median of the total CH4 emitted during composting is 1.4 g CH4/kg, while the median of N2O is 0.7 1.4 g N2O/kg [7,8,9]. Considering the air quality concerns linked to the biological treatment of waste—recognised by Sarkar et al. [10] as a significant challenge in municipal waste management—it is essential to consider the release of diverse chemical compounds. These emissions originate from raw waste, occur throughout the composting process, and manifest themselves during the final stages of biodegradation. The odorous compounds typically associated with mechanical-biological waste treatment include volatile organic compounds (VOCs), such as terpenes [11]. Eitzer indicates that the concentration of VOCs emitted from composting facilities, primarily hydrocarbons, p-limonene, ketones, and chlorinated organic compounds, ranges between 10 mg/m3 and 15 mg/m3 [12]. Such compounds can be generated in both aerobic processes and anaerobic methane fermentation [13,14].
Various readily degradable compounds, amines, and ammonia are released during composting, with concentrations varying from 18 g/Mg to 1150 g/Mg of waste [14]. Additionally, hydrogen sulfide, a notable odourant in composting facilities, can form under anaerobic conditions, often due to inadequate ventilation of compost piles [15]. Organic sulfides, including mercaptans, are produced under aerobic and anaerobic conditions; in the presence of oxygen, they can be converted into dimethyl sulfide and dimethyl disulfide. Among the compounds generated during biological waste processing, terpenes, monocyclic aromatic hydrocarbons (C2, C3, and C4 benzenes), alkanes, halogenated compounds, and esters have particularly significant in terms of their environmental impact [16]. Insufficient or incomplete aeration can lead to the formation of sulfur compounds, while inadequate aerobic decomposition of organic materials results in the release of substances such as alcohols, ketones, esters, and organic acids. Delgado-Rodríguez et al. demonstrated that during the initial acidic phase of composting, a variety of compounds, including aldehydes, alcohols, carboxylic acids, esters, ketones, sulfides, and terpenes, are predominantly produced. In the thermophilic phase, ketones, organosulfur compounds, terpenes, and ammonia are prevalent, while the cooling phase is characterised by the predominance of sulfides, terpenes, and ammonia [17]. Consequently, waste generation has downstream implications for the emission of ammonia, polycyclic aromatic hydrocarbons, particulate matter, VOCs, and bioaerosols from composting facilities. These pollutants are subsequently released into the ambient atmosphere, potentially indirectly impacting human health [18,19,20,21,22,23,24,25].
Bulking agents, such as wood chips and yard waste, improved the compost quality and shortened the retention period [26,27,28]. Recent studies have shown that composting of various organic materials can accelerate the process and yield a nutrient-balanced final product [29,30]. Additionally, biochar application has garnered significant attention, as it influences both the process dynamics and the quality of the resulting compost [31,32,33,34].
In Poland, within the mechanical components of mechanical-biological treatment plants, an organic fraction is segregated using a sieve with an 80 mm mesh size (occasionally 100 mm) [35]. This organic fraction is predominantly stabilised under aerobic conditions. In addition to compost, there is a product known as the oversized fraction. This fraction is a byproduct of the screening process, in which sieves are used to separate impurities from the final compost. Its production varies significantly with weather conditions. Under adverse climatic conditions, the oversize fraction can make up as much as 40% of the total volume of the unscreened finished compost.
The intermediate fraction’s physical and chemical properties significantly impact the composting process, and their proper control and monitoring are crucial for obtaining high-quality products [36]. The content of organic matter, moisture, structure, and microbiological activity affect the rate of organic material decomposition, stability of the final product, and its fertilisation value [36,37]. Moreover, the properties of the IF can also affect the emission of undesirable odour compounds during composting, which is a significant factor influencing the quality of the process and its environmental acceptability [37].
Previous studies have not fully explored the impact of additives and have not provided a thorough analysis of how they influence the properties of compost, both during and after the process. This highlights the need for research to identify cost-effective, safe, environmentally friendly, and efficient additives for green waste composting [38].
The study consisted of a detailed analysis of the effects of individual additives on composting efficiency and odour compound emissions in each week of the process.
The primary goal was to select the optimal technical parameters of the composting process, which were the addition of a deodorising agent, the proportion of the IF, and the addition of composted green waste. The goal of the appropriate selection of these parameters was to obtain high-quality products while reducing malodourous emissions.

2. Materials and Methods

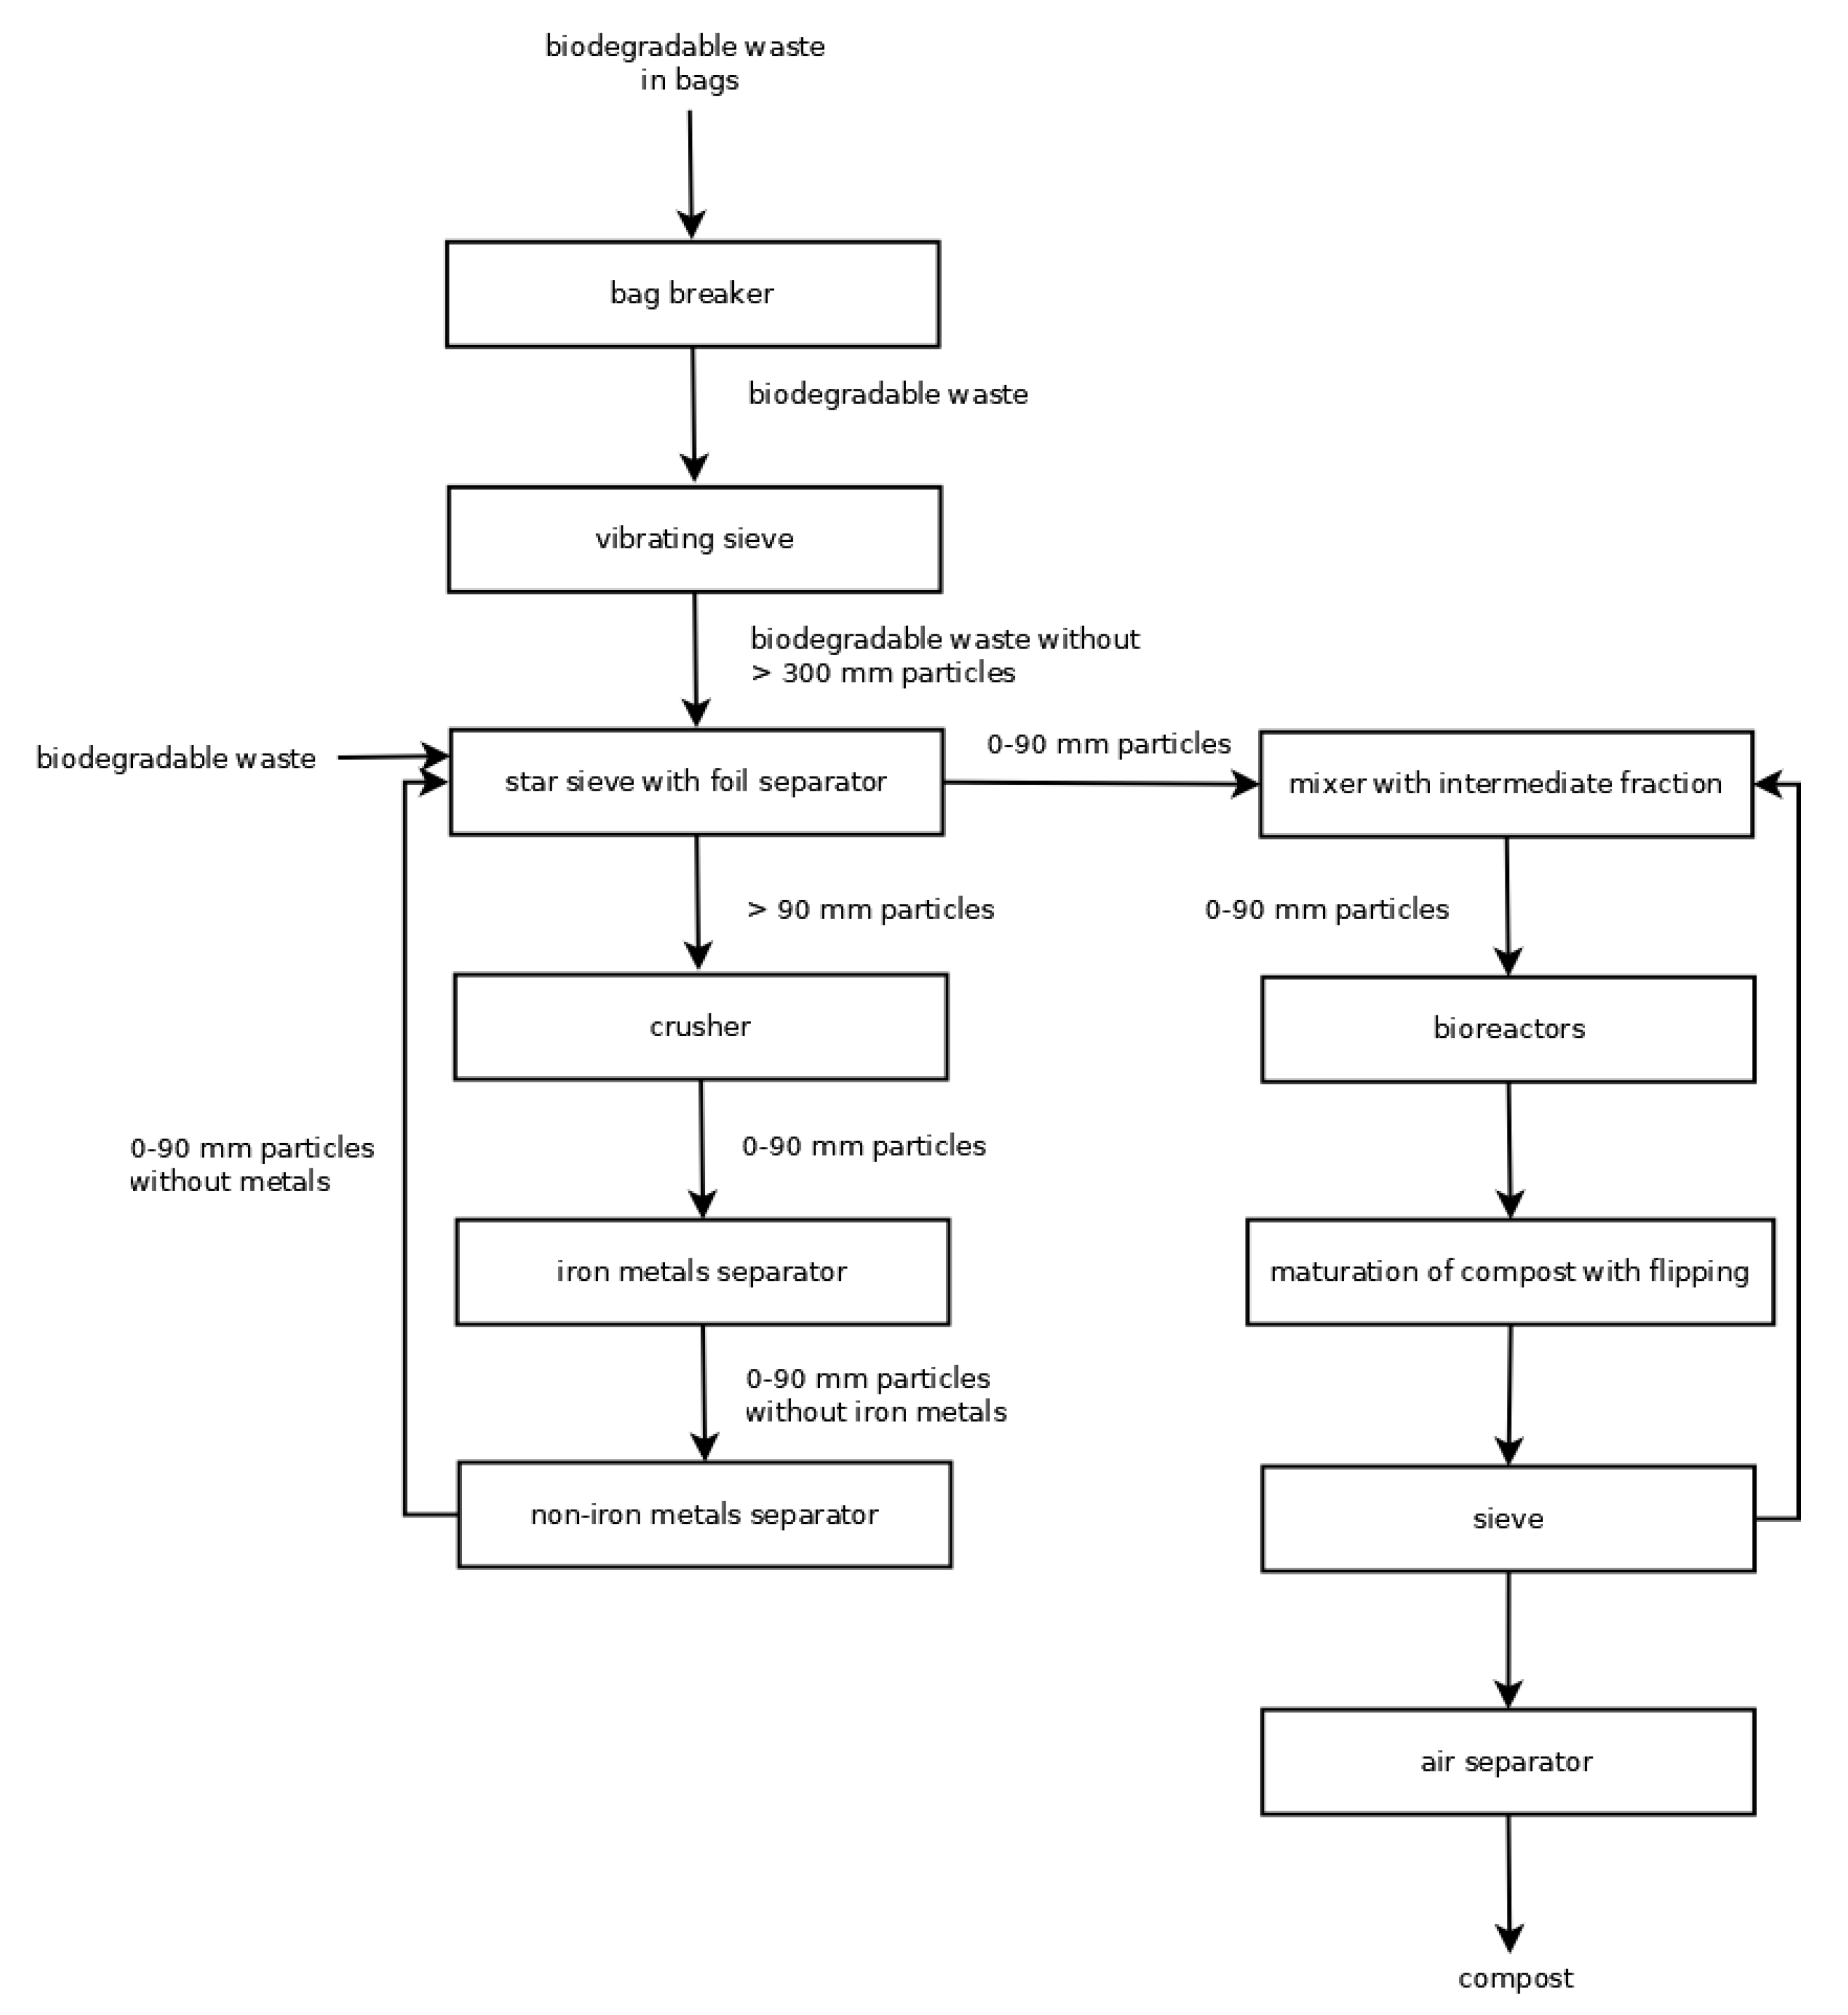
2.1. Description of the Research Object

The study was conducted at a composting facility that manages biodegradable waste, such as dried leaves, mowed grass, shredded trees and plant branches. The waste undergoes a multi-stage treatment process involving cutting machines, vibrating and star sieves, crushers, and metal separators. Additionally, the process incorporates material mixing, transfer, and the use of an air separator for screening and separation (Figure 1).
The waste was characteristic of cleanup work associated with the onset of autumn and the preparation of vegetation for the winter season. It included various plant residues resulting from the maintenance of gardens, parks, and green spaces. Fallen leaves from trees and shrubs are one of the main components of green waste. This waste includes small branches resulting from the pruning of trees and shrubs to prepare plants for winter. Lawns were still mowed, so grass was an important component of compost heaps.
The composting process was conducted in a composting field across various stages of the operation. Each windrow had a trapezoidal cross-section, measuring 4.5 m in width, 35 m in length, and 2 m in height. The waste mass within the windrows ranged from approximately 300 to 350 tonnes. Wheel loaders were employed to turn and ventilate the compost piles to ensure proper aeration and uniform air distribution throughout the windrow volume. The compost underwent a maturation phase lasting between 10 and 14 weeks [39].

2.2. Methodology

Tests were performed on nine piles. The interval between the series ranged from 3 to 7 days, and the complete cycle lasted for a maximum of 14 weeks, starting from the pile dump until the composting process was completed. Samples were taken from five places on the plateau of the piles (corners and geometric centre). Sampling of air emitted from the surface sources of odourants was carried out as follows:
  • from the height of 1.5 m above the plateau of the pile;
  • using a static chamber from the surface of the pile;
  • from a depth of 10 cm.
For each test, 10 min were required to equalise the pressure from when the static chamber was set. The total number of tested samples was 648.

2.3. Examined Variants

The examinations were conducted between August and November 2023, with a frequency of at least twice per week. The variants varied in terms of the proportion of the IF (with a particle size below 80 mm) and the inclusion of a specific additive. The IF refers to the material obtained when processed green waste is separated using a three-tier sieve. This sieve divides waste into three categories: particles smaller than 10 mm, particles between 10 mm and 60–90 mm, and particles exceeding 60–90 mm. The IF is material within the size range of 10 mm to 60–90 mm.
Three heap additives were used: an IF of 9% or 20% in the waste mixture (IF9, IF20), liquid preparation, and composted waste derived from 3-, 8-, and 13-week heaps (W3, W8, W13). The preparation was a mixture of bacterial cultures that broke down cellulose and limited the emission of ammonia and hydrogen sulfide compounds. It works under a wide range of pH and oxygenic and anaerobic conditions. Dosage for a single prism: three doses of 6 l of the preparation diluted in 600 L of water. One dose—after dosage, two doses—after transplanting the prism.
Table 1 lists the variants analysed, differing in the proportion of the IF and the degree of stabilisation (weeks) of the added waste.

2.4. Gas Sampling

The static chamber utilised for testing was made from an odour-neutral material and designed as a cylinder with a semi-spherical, truncated top featuring a radius of 20 cm. The chamber measured 30 cm in height and was equipped with a nozzle to facilitate the connection of the measuring tube. The active volume, representing the air column above the tested surface, was determined to be 0.040 m3. A critical limitation in assessing odour concentration is the presence of background odours during sampling. To address this, the study employed stainless steel equipment, known for being odourless and easy to decontaminate. Uncontaminated air sampling and transfer were conducted exclusively using virgin polytetrafluoroethylene (tubing). Additionally, a carbon filter was employed to purify the technical air, ensuring that it was entirely odour-free and preventing contamination from background smells. The term “background odour” refers to scents originating from the sampling location. The methods used in this research involve isolating a portion of the contaminated air and measuring the odour concentration at the outlet. It is important to note that the sampling process separates the background odours. However, the detection threshold of the method may be lower than the background odour levels already present in the environment [40].

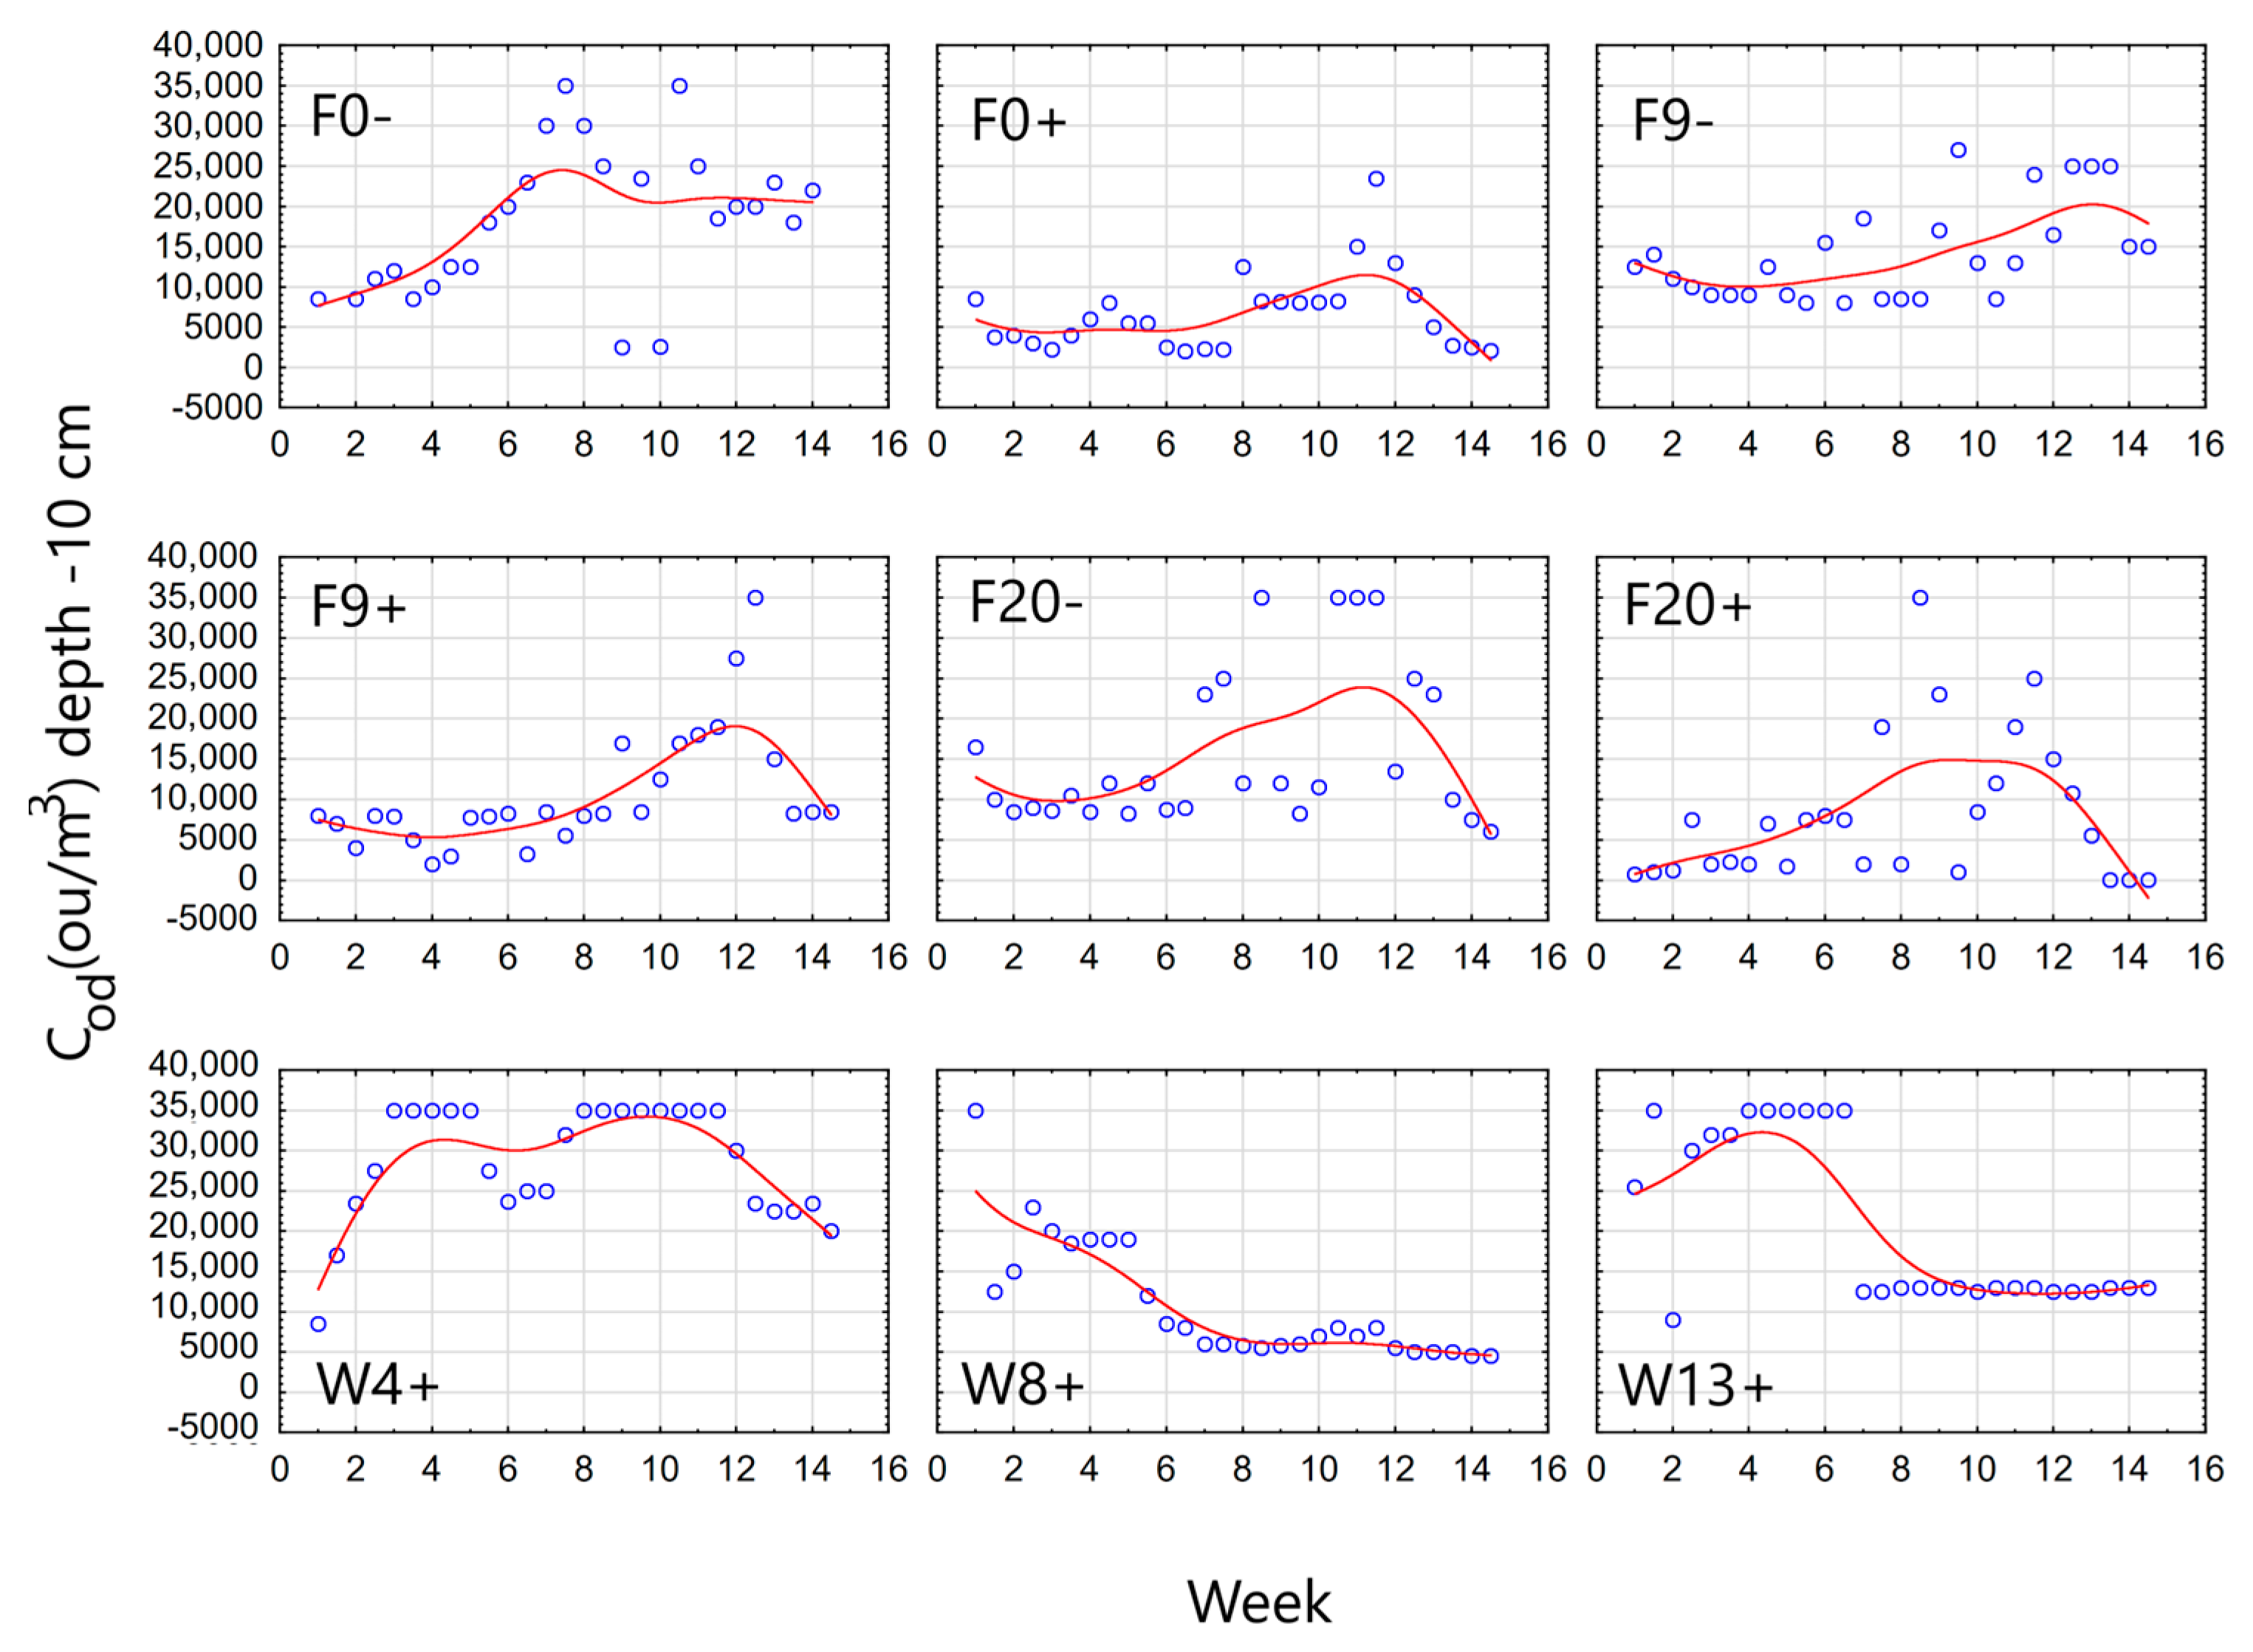
2.5. Odour Measurement

The effectiveness of the deodorisation process was assessed using a field olfactometry method. This study employed a Scentroid SM100 (IDES Canada Inc., Ontario, Canada) olfactometer and a static chamber for air sampling. Portable field olfactometers were used to calibrate dilutions by mixing odorous contaminated air with clean filtered air. Odour concentration was expressed in odour units per cubic metre (ou/m3) in compliance with the European standard PN-EN 13725:2022 [41]. The Scentroid SM100, a portable olfactometer, measures odour concentrations within a range of 2 to 30,000 ou/m3 [40]. Although the Nasal Ranger is commonly utilised for such measurements, it offers lower accuracy and a narrower range than the Scentroid SM100 [42]. Before each test, participants’ olfactory sensitivity was evaluated using the Sniffin’ Sticks Test (SST) following the ISO 13301:2002 guidelines [43]. At each sampling location, four olfactometric measurements were performed. As per PN-EN 13725:2022, the odour concentration is determined as the geometric mean of the individual measurement results [44].

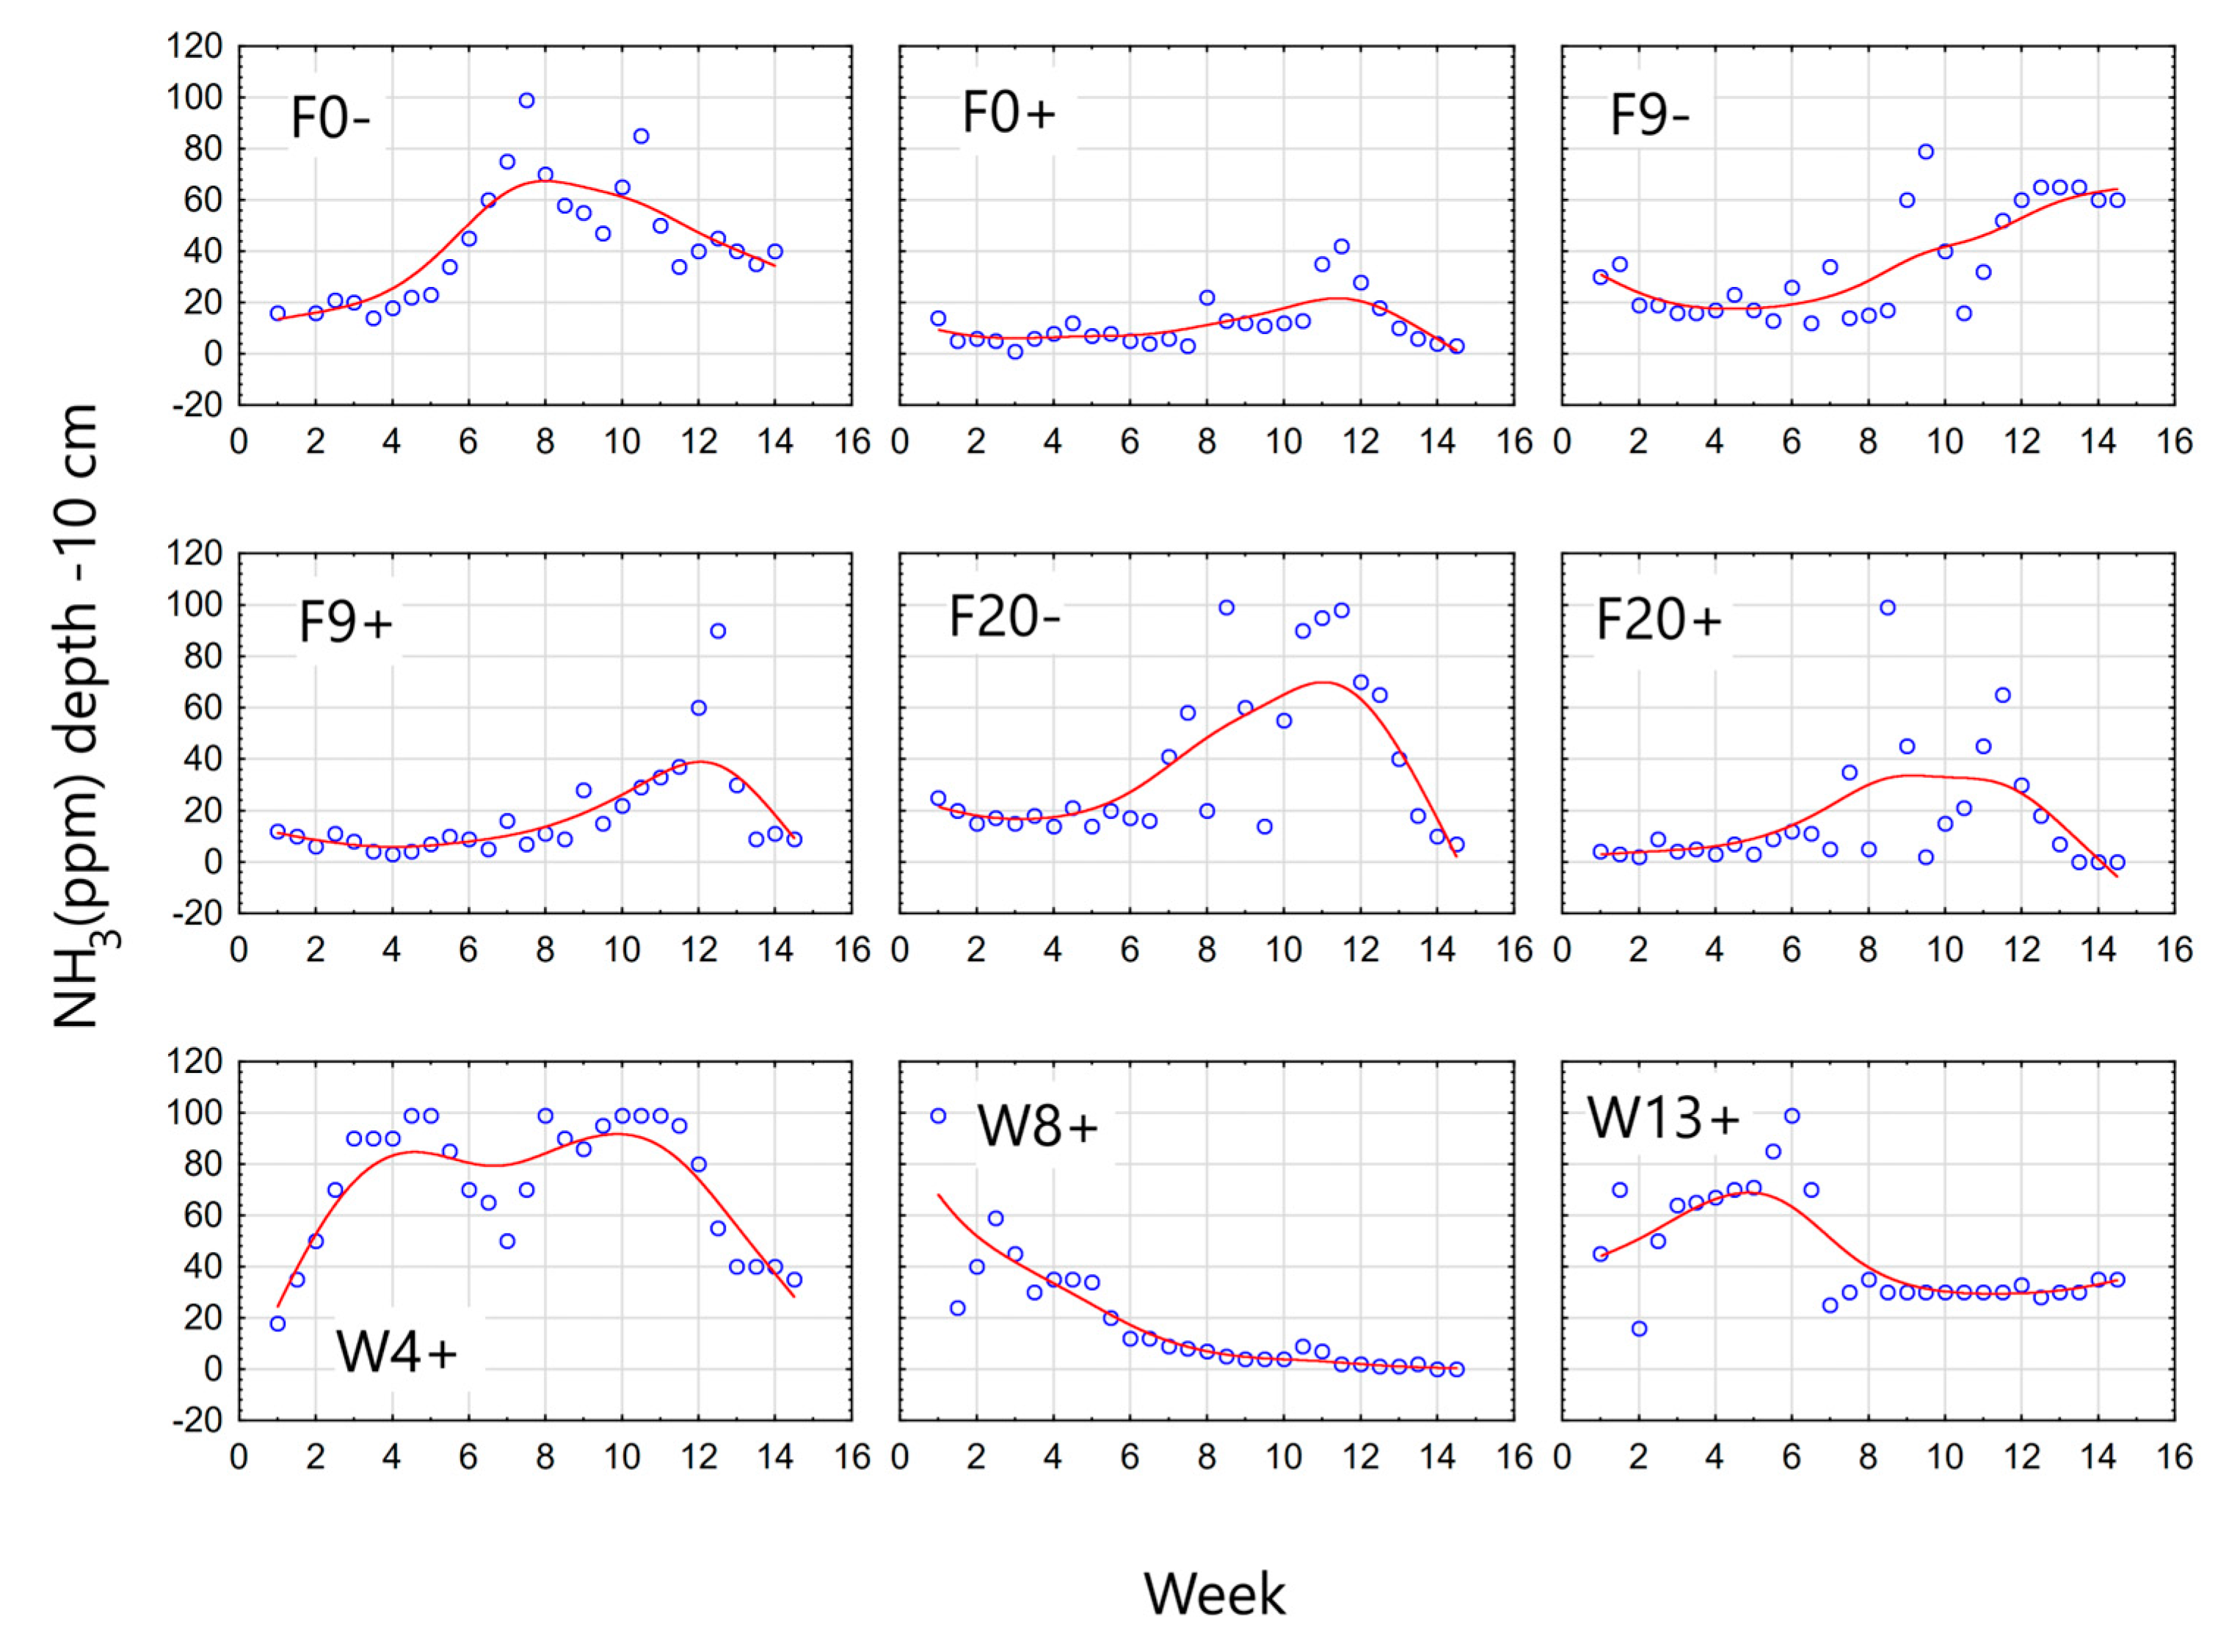
2.6. Measurement of Ammonia, Temperature and Humidity

Ammonia emissions from compost windrows were analysed using a specialised gas detector. The detectors were strategically positioned near the compost piles to ensure accurate monitoring of ammonia concentrations in the atmosphere. Systematic measurements were conducted over a defined period to collect reliable data on ammonia emissions associated with composting.
Ammonia concentrations were measured using a MultiRAE detector (RAE Systems, Honeywell, San Jose, CA, USA), equipped with an electrochemical sensor capable of detecting concentrations ranging from 0 to 100 ppm, with a resolution of 1 ppm. The device operates within a temperature range of −20 °C to 40 °C. Moisture levels within the compost windrows were assessed using a PMS 710 compost hygrometer (Tsingtao Toky Instruments Co., Ltd., Qingdao, China), which provides an accuracy of ±2% under non-saturation conditions. A hygrometer, with a central unit measuring 140 mm × 60 mm × 22 mm and a 280 mm needle, was distributed across various points in the compost windrows to monitor spatial variations in moisture and evaluate whether optimal conditions for organic matter decomposition were maintained.
Temperature measurements were performed using a TROL2 compost thermometer (Dramiński Technology Co., Sząbruk, Poland), with a measurement range of −55 °C to 125 °C, a resolution of 0.1 °C, and an accuracy of ±0.5 °C within the 0 °C to 85 °C range. The thermometer features a 300 mm-long metal probe inserted deep into the compost piles to measure internal temperatures. Accurate temperature monitoring is crucial for assessing microbial activity during decomposition and ensuring optimal conditions for the composting process.
Simultaneous measurements of ammonia concentration, moisture, and temperature comprehensively assessed the environmental parameters affecting the composting process. This approach thoroughly evaluated the conditions necessary for effective organic matter breakdown.

2.7. Statistical Methods

Analysis of variance was employed to compare the differences between variables. Assumptions were checked using Levene’s test and the Shapiro-Wilk test. In cases where assumptions were not met, the Kruskal-Wallis test was used with the Dunn post hoc test using the Bonferroni correction. The Kruskal-Wallis test is a non-parametric statistical test used to determine whether there are significant differences between the medians of three or more independent groups. It is an alternative to one-way analysis of variance when the assumptions of normality and homogeneity of variance are not met. It compares the ranks of the data rather than the raw values, making it robust against non-normality. Dunn’s test is a post hoc statistical test used to perform pairwise comparisons following a significant result in a non-parametric omnibus test, such as the Kruskal-Wallis test. It determines which specific groups differ significantly from one another. Dunn’s test is non-parametric; therefore, it does not require normal distribution or homogeneity of variance and is specifically designed to complement the Kruskal-Wallis test. Dunn’s test typically uses Bonferroni correction to control the family-wise error rate, which divides the significance level by the number of comparisons. The Bonferroni correction controls the family-wise error rate when performing multiple pairwise comparisons. Its purpose is to reduce the likelihood of false positives (Type I errors) arising from conducting numerous statistical tests simultaneously.
Spearman’s coefficient was calculated to determine the strength and direction of the relationship between the variables. This test has several advantages that make it a versatile and reliable measure of association, especially when working with non-parametric data or datasets that deviate from the assumptions of traditional parametric tests like Pearson’s correlation. It does not assume a normal distribution of data; therefore, it can be applied to skewed datasets, outliers, or failed normality tests, making it more broadly applicable than the Pearson’s correlation. Additionally, it captures the strength and direction of monotonic relationships, whether linear or non-linear, and reduces the influence of extreme values or outliers.
To examine the variability in each week, the coefficient of variation (CV) was calculated for the variants:
C V = S t a n d a r d   d e v i a t i o n m e a n 100 %
In addition, a mixed model interaction between variants and time was used to see how concentrations change over time for all variants. A mixed-effects model with interaction terms (e.g., between variants and time) provides a comprehensive framework for analysing how two factors interactively influence a dependent variable. A Linear mixed-effect model extends traditional linear regression by incorporating fixed effects (representing global influences, such as the main effects of factors like time and variant) and random effects (accounting for variability specific to groups or clusters in the data). Mixed-effects models are typically estimated using Maximum Likelihood or Restricted Maximum Likelihood methods.

3. Results

3.1. Comparison of Research Variants

Figure 2 shows a box-and-whisker plot of ammonia and odour concentration at a depth of 10 cm inside the compost pile. Table 2 shows the basic statistics of these parameters for the different variants.
Spearman’s rho coefficient between odour and ammonia concentration at a height −10 cm, 0 and 1.5 m is 0.951, 0.929 and 0.822, with a p-value < 0.001. The datasets analysed did not satisfy the assumptions required for analysing variance tests, as indicated by the results of Levene’s test for homogeneity of variances and the Shapiro-Wilk test for normality (p < 0.001). Consequently, the Kruskal-Wallis test was used, a non-parametric alternative that does not require the assumption of variance homogeneity. The grouping variable was the experimental variant, while the dependent variables were the ammonia and odour concentrations. The test showed a significant difference between variables (test statistic for ammonia = 117.31, for odour concentration = 110.14, p-value for both < 0.001). Dunn’s post hoc test with Bonferroni correction provides its p-value, indicating the most significant similarity between pairs of variants: IF0- and W13+, IF0+ and IF20+, IF20+ and W8+, IF20- and IF9-, as well as IF9+ and W8+, for both ammonia and odour concentrations.
The piles with the addition of inoculum differed by 25–73% in average ammonia concentration and odour values against their counterparts without the inoculum. The values determined for piles without inoculum were higher in each case. In the case of ammonia, the difference between the concentrations at −10 cm was 73% for the piles without IF, 48% with 9%fraction addition, and 56% with 20%fraction addition. For odour concentrations, the differences were 64%, 25% and 48%, respectively.
Considering the piles with the addition of the formulation and the addition of the IF, the average ammonia concentration values were comparable—they were 18.04 ppm for the variant IF9+ and 16.57 ppm for the IF20+. The average values of odour concentrations differed more significantly—at the −10 level of the pile with the addition of 9% IF, the average odour concentration was found to be 10,609 ou/m3, while in the case of the addition of 20% fraction, it was 8086 ou/m3.
In the case of the heaps with the addition of 4-, 8- and 13-week-old waste, the lowest average ammonia concentration was recorded for the 8-week-old waste. It amounted to 18.21 ppm. In the pile with the addition of 4-week-old waste, the average ammonia concentration was as high as 72.61 ppm, and in the pile with the addition of 13-week-old waste, it was 45.11 ppm. Similarly, the average odour concentration in the pile with the addition of 8-week-old waste was 10,857 ou/m3, while in the piles with the addition of 4- and 13-week-old waste, it was 28,810 ou/m3 and 20,661 ou/m3, respectively.

3.2. Changes in the Studied Parameters During Each Week of the Process

Table 3 contains the coefficient of variation and standard deviations of ammonia and odour concentration values for each variant.
The coefficient of variation values of ammonia concentration exceeding 100% (IF20+, IF9+, and W8+) signify very high variability, suggesting that the data are widely dispersed around the mean. In comparison, a coefficient of variation below 50% (W4+ and W13+) suggests relatively low variability, indicating more consistent data. Lowest Variability: Variant W4+ (33.2%) demonstrates the most consistent results, as it has the lowest CV. Highest Variability: Variant IF20+ (134.5%) exhibits the highest variation coefficient, reflecting significant data dispersion. Other variants fall between these two extremes with varying levels of variability. According to the standard deviation values, the variant F0+ has the smallest value of 9.82, which shows the least variability and is the most consistent. Variant F9- has the highest standard deviation = 29.98 ppm, indicating the greatest variability and potential inconsistency. Most standard deviation values fall within the approximately 20−25 ppm range, indicating moderate variability. Variants like F0+ and F9- represent the extremes in consistency and variability, respectively.
Variant W4+ has the lowest coefficient of variation value of odour concentration (24.1%), indicating that this is the most consistent variant with minimal relative variability. Variant F20+ has the highest coefficient of variation (107.2%), meaning the variability in this variant is greater than the mean. This suggests high instability or inconsistency in the data. Variants like F0- (50.5%), F9- (43.9%), and W13+ (50.1%) show moderate variability, indicating a balance between stability and fluctuation. Variants F0+ (71.9%), F9+ (70.7%), and W8+ (67.9%) also exhibit relatively high variability, though not as extreme as F20+. Variant F0+ has the smallest SD = 4889, suggesting that this variant has the least variability and is the most consistent. Variant W13+ has the largest SD = 10504, exhibiting the highest variability and is less consistent than the other variants. The standard deviation values range from 4889 (F0+) to 10,504 (W13+), showing a noticeable difference in variability across variants. Variants like F9- (6186) and W4+ (7021) exhibit moderate levels of variability, suggesting a balance between stability and fluctuation.
Figure 3 shows the distribution of the variable ammonia concentration, while Figure 4 shows the odour concentration in each week of the process, with the grouping variable variant.
Table 4 shows the summed values of ammonia concentration determined for 14 weeks of composting in variants with IF addition. The percentage of reduction was calculated in relation to the pile without IF addition and without preparation.
The most significant reduction in ammonia and odour concentration compared to the pile without any additives was obtained for the IF of 20% additive—the reductions were 58.8% and 52.3%, respectively. In this case, however, odour concentrations equal to or higher than 20,000 ou/m3 were observed as many as five times. The pile with a 9% IF was much more stable, although less ammonia and odour reduction was observed than in the case of the IF20+ variant. The reductions were 55.2% and 37.4%, respectively.
Ammonia and odour emissions by week from the F0+ pile (no IF) with inoculum addition were similar to those from the 9% IF pile with inoculum addition. The most significant difference occurred at weeks 11 and 11.5 (F0+) and at weeks 12 and 12.5 (F9+), when there were increased emissions of ammonia and odorous compounds. In the F0+ pile at that time, the ammonia concentration was 35–42 ppm, and the odour concentration was 15,000–23,500 ou/m3, while in the F9+ pile, respectively, 6–90 ppm and 27,500–35,000 ou/m3. The addition of an IF at 20% intensified the processes in the compost heaps, resulting in increased emissions of ammonia and other odour compounds. After 8.5 weeks of the process, the concentration of ammonia was 99 ppm, and the concentration of odours was 35,000 ou/m3.
In the case of a mixture of waste and maturing waste, intensive processes resulting in significant emissions of ammonia and other odorogenic compounds were observed as early as the first week of the composting process, with the addition of 8- and 13-week-old waste. Ammonia concentrations were then 99 ppm and 45 ppm, respectively. In the second week, however, the concentration of ammonia in the W8+ variant dropped to 24 ppm, while it increased to 70 ppm in the W13+ variant. The ammonia concentration gradually increased with the addition of 4-week-old waste, reaching 90 ppm in week 3. From week 3, the concentration of this compound in the pile with the addition of 8-week-old waste successively decreased from 45 ppm to 2 ppm. Elsewhere, high ammonia concentrations were recorded until the 7th and 12th weeks in the case of W13+ and W4+ variants, respectively.
When using a mixed model with interaction (Variant * Week) to see how ammonia concentrations change over time (by week) for all variants, the median (−0.1533) indicates that the distribution of residuals is symmetrical around zero, suggesting that the model predicts the data well. In the case of fixed effects, the average concentration for the reference variant (Variant IF0-) at the beginning of the study (week = 0) is about 23.55 units. The rate of change in concentration over time varies between variants. The slowest changes are observed in variants W13+, W4+, and W8+.
In the mixed model of odour concentration, most residuals fall within the range of −3 to 3, which is typical for a well-fitted model. Variants W13+, W4+, and W8+ exhibit significantly higher baseline concentrations than Variant IF0-. Other variants show no statistically significant difference from the baseline. Variants W13+ and W8+ show a significantly slower concentration increase rate over time than IF0.

4. Discussion

An important factor influencing the efficiency of the IF is its appropriate proportion in the compost mixture. Too small an amount or a complete lack of this fraction can lead to the compaction of the composted material. Consequently, this limits the flow of oxygen in the compost pile, promoting anaerobic zone formation. Such a state restricts the flow of oxygen, which supports the formation of anaerobic zones where undesirable fermentation processes develop, leading to the emission of methane and hydrogen sulfide [45].
Conversely, an excessive proportion of the IF can significantly prolong the composting time. This is due to the higher content of lignocellulosic materials, which decompose more slowly than the softer organic fractions. As a result, the composting process may be less efficient, and the final product may not achieve the appropriate stability and uniformity [37]. Moreover, returning the IF to the composting process allows for efficient use of materials otherwise classified as waste. Thanks to this procedure, the amount of waste destined for further processing is reduced [46].
A problematic issue of great relevance in current research is the effects of the IF of green waste—which consists of short branches and twigs—on odorous chemical emissions during the composting of municipal green garbage. The kinds and levels of ammonia, VOCs, and other odorous emissions produced throughout composting depend much on the makeup of organic waste. This discourse integrates information from different studies to clarify the correlation between green waste content and odorous emissions. Studies demonstrate that various organic components, such as green waste, substantially influence the emission rates of odorous compounds during the composting process. Preble et al. discovered that emissions from composting organic municipal solid waste were primarily composed of lighter alcohols and terpenes, contributing considerably to overall VOC emissions [47]. The research indicated that the mean emission rate was roughly 66 mg of total VOCs per kilogramme of composted material, emphasising the significance of material composition in influencing emission profiles. Odorous pollutants are significantly impacted by the type of organic waste and its microbial activity during composting. Zhu et al. underlined that the general odour profile in composting systems is substantially affected by organic sulfur compounds produced by anaerobic microbial activity [48]. They observed that although hydrogen sulfide is frequently linked to composting odours, its principal source is sulphate reduction rather than the breakdown of amino acids, which are more directly associated with releasing other low-threshold odour components. This distinction is essential for comprehending how varying proportions of green waste might influence microbial dynamics and, subsequently, the odorous chemicals emitted. The physical composition of the composting material, especially the inclusion of small branches and twigs, may influence aeration and moisture content inside the compost pile. Büyüksönmez et al. indicated that the physical properties of compost materials may enhance the adsorption and biodegradation of odorous compounds, thereby reducing emissions [49].
The processes within compost sites, especially anaerobic decomposition, can produce greenhouse gases and odorous substances, and continuous fermentation is linked to high methane levels [50]. Composting can be improved by increasing aeration and decreasing the concentration of odorous substances, such as an intermediary fraction of green waste. This suggests that the content of the compost—more significantly, the percentage of larger green waste pieces—may affect the anaerobic conditions that support fermentation and, hence, the release of odorous gases. The type of organic waste composted determines the particular VOCs released. Composting garden trash generally generates terpenes, alkylbenzenes, and other VOCs, according to Maulini-Duran et al., who examined garden garbage to compare emissions from various types of waste [51]. This suggests that an intermediary fraction of green garbage, mainly comprising branches and sticks, can emit various VOCs with possibly unique odour profiles. The aeration techniques used in composting confuse the link between green waste content and odorous emissions even more. The researchers highlighted the importance of inadequate aeration in exacerbating odours. This implies that minimising odorous emissions depends on carefully managing aeration in compost piles, including large volumes of green waste. Studies on the maturation of compost and related odour emissions in municipal solid waste composting frameworks reveal that the mix of kitchen and garden waste affects both [51]. Comparatively, to separate composting, Zhang et al. found that co-composting kitchen waste with garden waste resulted in improved maturation and reduced odour. This result highlights the possible advantages of adding IF of green garbage to enhance the general composting process and control odour problems [52]. Controlling odorous emissions also depends on managing nitrogen and sulfur compounds during composting. Increasing aeration rates could lower the synthesis of volatile sulfur compounds, but it could also cause an increase in ammonia leakage [53].
It also indicates that the composting systems with different green waste fractions must be managed to minimise odour emissions. The pH levels of compost piles may also strongly influence odour emissions. A study by Jönsson et al. found that high temperature and low pH can prolong the initial high-odour phase of composting and promote greater emissions [54]. Consequently, this suggests that the composition of green waste may affect the dynamics of pH and odour potential through the ratio of carbon to nitrogen. Odour emissions are significantly affected by the microbial composition in the compost pile. This microbial community includes lactobacilli and clostridia, which are sometimes associated with increased odorous emissions during food waste composting [55]. Certain organic materials, including green waste, help define microbial dynamics and alter the odour profile [55].
According to the study’s findings, adding an intermediate proportion of 9% is preferable, as this variant stabilises the composting process while reducing ammonia and odour emissions to moderate levels. Adding 20% IF, while effectively enhancing the biodegradation process, results in significantly higher odour emissions, requiring additional control measures. An intermediate proportion of 9% enables an appropriate compromise between processing efficiency and environmental effects, particularly in settings where odour nuisances must be minimised. The highest recorded odour concentration occurred during week 12, reaching 35,000 ou/m3. Comparable results were reported by Fischer et al., who found that diffuse gas emissions generated during compost turning in open windrows exhibited odour concentrations exceeding 3000 ou/m3 [56]. In the first week, the odour concentration peaked at 8000 ou/m3 but decreased to 4000 ou/m3 by the second week. Rincón et al. observed a similar trend during the composting of anaerobically digested sewage sludge. These researchers noticed that during the first eight days of the active composting phase—referred to as the “earlier active phase”—40% of the total mass of released volatile compounds was emitted [57]. In the present study, adding 9% of the IF with inoculum yielded 13% less ammonia and 37% less odour than the variant without additives, while adding 20% of that fraction yielded 58.9% and 52%, respectively. Odour and ammonia loss during corn stover addition during Chen et al. examinations were 22% and 33% [58]. Neugebauer and Sołowiej achieved the highest ammonium concentration—14 ppm in the 14th week of composting—adding 40% of garden waste decreased ammonia emissions to threshold values (6 ppm) [59]. According to Wang et al., the use of activated carbon decreases NH3 emissions by 34% during composting digestate from food waste [60] and 36% during swine manure composting [61]. Viaene added a woody fraction of green waste to the cattle slurry, achieving 12% ammonia reduction; Baral et al. used Miscanthus as a bulking agent (25% ammonia loss during the first 4 months) [62,63,64]. Chen et al. added 10% of cornstalk, bamboo and woody biochar to compost and achieved, respectively, 25%, 9% 20% ammonia reduction [38]. Yin et al. 15% sugarcane bagasse, 35% bean dregs, 45% silage, 5% flue gas desulfurisation gypsum, 4% maifanite and 20% furfufal residue added to the compost, achieving 29%, 27%, 17%, 25%, 5%, 13% and 5% ammonia reduction [38].
Another essential aspect influencing the efficiency of the IF is the age of the waste utilised. Using 8-week-old green waste resulted in the lowest ammonia emissions (18.21 ppm) and odours (10,857 ou/m3) while supporting biological activities in the compost. Younger waste (4 weeks old) resulted in higher emissions, but older waste (13 weeks old) had a limited capacity to boost process efficiency.

5. Conclusions

The intermediate fraction mainly comprises recycled organic waste, including plant leftovers, branches, leaves, and other broken and transplanted organic materials. It stands out due to its ample porosity, which enhances the aeration of compost prisms. Understanding the role of porosity in the decomposition process is crucial, as it improves oxygenation. This fraction enhances oxygen and moisture flow within compost prisms. This process guarantees the continuous activity of regions and speeds up the decomposition of organic materials. It also contains microorganisms, which are crucial in speeding up the degradation process. Introducing these bacteria into green waste not only speeds up the decomposition of organic materials but also improves the quality of the resultant compost.
Using the IF in the composting process reduces the amount of waste that must be transported and landfilled, reducing waste management fees. This fraction, which might otherwise be considered waste, gains use value as a component of compost heaps. More efficient use of available materials means savings, especially if purchasing additional carbon-rich materials (such as sawdust) would be costly. Adding it to the heaps increases the volume of compost without the need to source other materials, which lowers the unit cost of production. Reducing the amount of waste going to landfills reduces methane emissions produced during anaerobic organic decomposition in landfills. Using the IF in composting, an aerobic process, promotes a reduction in greenhouse gas emissions compared to landfilling. In addition, it reduces the need for other organic materials (e.g., sawdust and straw), contributing to the conservation of natural resources. Rich in carbon, can improve soil structure in the final compost, promoting its ability to retain water and nutrients. Finished compost, adding the IF with suitable properties, can be used as an organic fertilier, reducing the need for mineral fertiliser. The proposed variant allows the use of as much as 51 m3 of the fraction for 514 m3 of composted waste, while the alternative variant (20%) allows 113 m3 of the fraction for 452 m3 of waste. An important factor in reducing emissions of ammonia and odorogenic compounds is the inoculant preparation—18 L of preparation is needed per heap, with a unit cost of about 5 euros per litre (90 euros per heap).
The reuse of the IF fits the assumptions of a closed-loop economy, reducing the amount of waste and giving it use value. Furthermore, including inoculum greatly enhances composting efficiency, lowering ammonia and odour emissions in heaps by 25–73%. This was especially clear when the inoculum was added to the IF. This made the process more stable, reduced the variation in the results, and sped up biodegradation. Therefore, combining the inoculum with the IF, particularly at 9%, and using 8-week-old garbage appears to be the most economical and sustainable method. Both on an industrial scale and in smaller composting operations, this technique enables the development of a highly efficient and ecologically friendly solution.
However, the method used has some drawbacks and limitations. The first is the potential inhomogeneity of the material—the IF may contain materials that decompose more slowly than the rest of the compost mass (e.g., thicker branches and tough plant fragments). This can lead to uneven decomposition in the pile and the need for additional screening of the finished compost. Because larger organic fragments can retard the decomposition process and require more time for microbial decomposition, it may be necessary to turn the pile over more often to ensure adequate aeration and uniformity of decomposition. In addition, if the IF contains contaminants, such as small fragments of plastic, stones or glass, they may end up in the final product, reducing its quality. Care should be taken to screen and sort in advance to minimise this problem. Another important aspect may be that larger fragments can create spaces less likely to be exposed to high temperatures in a pile, making it more difficult to eliminate pathogens and weed seeds and causing problems with hyalinisation. The IF can alter the structure of the finished compost, making it rougher and less homogeneous, which can be problematic in some applications, such as horticulture or substrate production. If contains a lot of woody fragments, it can increase the carbon-to-nitrogen content. An improper C:N ratio can slow composting and requires correction, such as adding nitrogen-rich materials.
The influence of green waste IF on odour emissions during municipal green waste composting involves a complex interaction between material composition, microbial activity, aeration strategies, and environmental conditions. increase other green waste fractions, such as small branches and sticks, fosters good composting because they enhance aeration and provide a suitable habitat for desirable microorganisms to increase their activities in reducing odour emissions. Future research should analyse, with an eye toward enhanced composting strategies, the relationships among various waste fractions and their joint impact on odour emissions.

Author Contributions

Conceptualisation, M.S.-S. and W.K.; methodology, M.S.-S. and W.K.; software, M.S.-S.; validation, M.S.-S. and W.K.; formal analysis, M.S.-S. and W.K.; investigation, M.S.-S. and W.K.; data curation, M.S.-S. and W.K.; writing—original draft preparation, M.S.-S. and W.K.; writing—review and editing, M.S.-S. and W.K.; visualisation, M.S.-S. and W.K.; supervision, M.S.-S.; funding acquisition, W.K. All authors have read and agreed to the published version of the manuscript.

Funding

Funds raised under the 7th edition of the programme entitled ’Implementation Ph.D.’, established under Article 376(1) and paragraph 2 item 1 of the Act of 20 July 2018.—Law on Higher Education and Science (Journal of Laws of 2023, item 742, as amended) announced by the Minister of Education and Science on 26 April 2023.

Institutional Review Board Statement

Not applicable.

Informed Consent Statement

Not applicable.

Data Availability Statement

The original contributions presented in the study are included in the article, and further enquiries can be directed to the corresponding author.

Conflicts of Interest

The authors declare no conflicts of interest.

References

  1. Weligama Thuppahige, R.T.; Gheewala, S.H.; Babel, S. Environmental Impact of Organic Fraction of Municipal Solid Waste Treatment by Composting in Sri Lanka. J. Mater. Cycles Waste Manag. 2022, 24, 189–199. [Google Scholar] [CrossRef]
  2. Behrooznia, L.; Sharifi, M.; Hosseinzadeh-Bandbafha, H. Comparative Life Cycle Environmental Impacts of Two Scenarios for Managing an Organic Fraction of Municipal Solid Waste in Rasht-Iran. J. Clean. Prod. 2020, 268, 122217. [Google Scholar] [CrossRef]
  3. Martínez-Blanco, J.; Colón, J.; Gabarrell, X.; Font, X.; Sánchez, A.; Artola, A.; Rieradevall, J. The Use of Life Cycle Assessment for the Comparison of Biowaste Composting at Home and Full Scale. Waste Manag. 2010, 30, 983–994. [Google Scholar] [CrossRef] [PubMed]
  4. Vieira, V.H.; Matheus, D. Environmental Assessments of Biological Treatments of Biowaste in Life Cycle Perspective: A Critical Review. Waste Manag. Res. 2019, 37, 0734242X1987922. [Google Scholar] [CrossRef]
  5. Colón, J.; Alvarez, C.; Vinot, M.; Lafuente, F.J.; Ponsá, S.; Sánchez, A.; Gabriel, D. Characterization of Odorous Compounds and Odor Load in Indoor Air of Modern Complex MBT Facilities. Chem. Eng. J. 2017, 313, 1311–1319. [Google Scholar] [CrossRef]
  6. Vergara, S.E.; Silver, W.L. Greenhouse Gas Emissions from Windrow Composting of Organic Wastes: Patterns and Emissions Factors. Environ. Res. Lett. 2019, 14, 124027. [Google Scholar] [CrossRef]
  7. Nordahl, S.L.; Preble, C.V.; Kirchstetter, T.W.; Scown, C.D. Greenhouse Gas and Air Pollutant Emissions from Composting. Environ. Sci. Technol. 2023, 57, 2235–2247. [Google Scholar] [CrossRef]
  8. Zhu-Barker, X.; Bailey, S.K.; Paw U, K.T.; Burger, M.; Horwath, W.R. Greenhouse Gas Emissions from Green Waste Composting Windrow. Waste Manag. 2017, 59, 70–79. [Google Scholar] [CrossRef]
  9. Puyuelo, B.; Gea, T.; Sánchez, A. GHG Emissions during the High-Rate Production of Compost Using Standard and Advanced Aeration Strategies. Chemosphere 2014, 109, 64–70. [Google Scholar] [CrossRef]
  10. Sarkar, U.; Hobbs, S.E.; Longhurst, P. Dispersion of Odour: A Case Study with a Municipal Solid Waste Landfill Site in North London, United Kingdom. J. Environ. Manag. 2003, 68, 153–160. [Google Scholar] [CrossRef]
  11. Isidorov, V.; Jdanova, M. Volatile Organic Compounds from Leaves Litter. Chemosphere 2002, 48, 975–979. [Google Scholar] [CrossRef] [PubMed]
  12. Eitzer, B.D. Emissions of Volatile Organic Chemicals from Municipal Solid Waste Composting Facilities. Environ. Sci. Technol. 1995, 29, 896–902. [Google Scholar] [CrossRef] [PubMed]
  13. Smet, E.; Van Langenhove, H.; De Bo, I. The Emission of Volatile Compounds during the Aerobic and the Combined Anaerobic/Aerobic Composting of Biowaste. Atmos. Environ. 1999, 33, 1295–1303. [Google Scholar] [CrossRef]
  14. Clemens, J.; Cuhls, C. Greenhouse Gas Emissions from Mechanical and Biological Waste Treatment of Municipal Waste. Environ. Technol. 2003, 24, 745–754. [Google Scholar] [CrossRef]
  15. Defoer, N.; De Bo, I.; Van Langenhove, H.; Dewulf, J.; Van Elst, T. Gas Chromatography-Mass Spectrometry as a Tool for Estimating Odour Concentrations of Biofilter Effluents at Aerobic Composting and Rendering Plants. J. Chromatogr. A 2002, 970, 259–273. [Google Scholar] [CrossRef]
  16. Pierucci, P.; Porazzi, E.; Martinez, M.P.; Adani, F.; Carati, C.; Rubino, F.M.; Colombi, A.; Calcaterra, E.; Benfenati, E. Volatile Organic Compounds Produced during the Aerobic Biological Processing of Municipal Solid Waste in a Pilot Plant. Chemosphere 2005, 59, 423–430. [Google Scholar] [CrossRef]
  17. Delgado-Rodríguez, M.; Ruiz-Montoya, M.; Giraldez, I.; Cabeza, I.O.; López, R.; Díaz, M.J. Effect of Control Parameters on Emitted Volatile Compounds in Municipal Solid Waste and Pine Trimmings Composting. J. Environ. Sci. Health Part A 2010, 45, 855–862. [Google Scholar] [CrossRef]
  18. Abdel-Shafy, H.; Mansour, M. A Review on Polycyclic Aromatic Hydrocarbons: Source, Environmental Impact, Effect on Human Health and Remediation. Egypt. J. Pet. 2015, 25, 107–123. [Google Scholar] [CrossRef]
  19. Sanchez-Monedero, M.A.; Stentiford, E.I.; Mondini, C. Biofiltration at Composting Facilities: Effectiveness for Bioaerosol Control. Environ. Sci. Technol. 2003, 37, 4299–4303. [Google Scholar] [CrossRef]
  20. Dat, N.-D.; Chang, M.B. Review on Characteristics of PAHs in Atmosphere, Anthropogenic Sources and Control Technologies. Sci. Total Environ. 2017, 609, 682–693. [Google Scholar] [CrossRef]
  21. Norouzian Baghani, A.; Bahmani, Z.; Sorooshian, A.; Farzadkia, M.; Nabizadeh, R.; Delikhoon, M.; Barkhordari, A.; Rezaei Kalantary, R.; Golbaz, S.; Kermani, M.; et al. Characterization of Polycyclic Aromatic Hydrocarbons Associated with PM10 Emitted from the Largest Composting Facility in the Middle East. Toxin. Rev. 2021, 40, 1481–1495. [Google Scholar] [CrossRef]
  22. Cappelleti, C.P.; Silva, K.T.S.; Rodrigues-Conrad, K.; Grams, K.C.; da Silva, I.K.; Frielink, A.P.; Abdallah, S.d.R.; Colet, C.d.F.; Bortolotto, J.W.; Bonfanti-Azzolin, G.; et al. Cytotoxic and Oxidative Changes in Individuals Occupationally Exposed to Recyclable Municipal Solid Waste. J. Toxicol. Environ. Health Part A 2023. [Google Scholar] [CrossRef] [PubMed]
  23. Wei, J.; Xu, L.; Zhou, J. Role of Household Waste, Governance Quality, and Greener Energy for Public Health: Evidence from Developed Economies. Front. Public Health 2022, 10, 1005060. [Google Scholar] [CrossRef] [PubMed]
  24. Ibor, O.R.; Khan, E.A.; Arkuwe, A. A Bioanalytical Approach for Assessing the Effects of Soil Extracts from Solid Waste Dumpsite in Calabar (Nigeria) on Lipid and Estrogenic Signaling of Fish Poeciliopsis Lucida Hepatocellular Carcinoma-1 Cells in Vitro and in Vivo African Catfish (Clarias gariepinus). J. Toxicol. Environ. Health A 2023, 86, 774–789. [Google Scholar] [CrossRef]
  25. Abubakar, I.R.; Maniruzzaman, K.M.; Dano, U.L.; AlShihri, F.S.; AlShammari, M.S.; Ahmed, S.M.S.; Al-Gehlani, W.A.G.; Alrawaf, T.I. Environmental Sustainability Impacts of Solid Waste Management Practices in the Global South. Int. J. Environ. Res. Public Health 2022, 19, 12717. [Google Scholar] [CrossRef]
  26. Kim, J.-D.; Park, J.-S.; In, B.-H.; Kim, D.; Namkoong, W. Evaluation of Pilot-Scale in-Vessel Composting for Food Waste Treatment. J. Hazard. Mater. 2008, 154, 272–277. [Google Scholar] [CrossRef]
  27. Iyengar, S.R.; Bhave, P.P. In-Vessel Composting of Household Wastes. Waste Manag. 2006, 26, 1070–1080. [Google Scholar] [CrossRef]
  28. Bhave, P.P.; Joshi, Y.S. Accelerated In-Vessel Composting for Household Waste. J. Inst. Eng. Ser. A 2017, 98, 367–376. [Google Scholar] [CrossRef]
  29. Chaher, N.E.H.; Chakchouk, M.; Abdallah, N.; Nelles, M.; Hamdi, M. Potential of Windrow Food and Green Waste Composting in Tunisia. Environ. Sci. Pollut. Res. 2021, 28. [Google Scholar] [CrossRef]
  30. Feng, X.; Zhang, L. Vermiculite and Humic Acid Improve the Quality of Green Waste Compost as a Growth Medium for Centaurea cyanus L. Environ. Technol. Innov. 2021, 24, 101945. [Google Scholar] [CrossRef]
  31. Petric, I.; Helić, A.; Papraćanin, E. Evolution of Process Parameters and Determination of Kinetics for Co-Composting of Organic Fraction of Municipal Solid Waste with Poultry Manure. Bioresour. Technol. 2012, 117, 107–116. [Google Scholar] [CrossRef] [PubMed]
  32. Paredes, C.; Bernal, M.P.; Cegarra, J.; Roig, A. Bio-Degradation of Olive Mill Wastewater Sludge by Its Co-Composting with Agricultural Wastes. Bioresour. Technol. 2002, 85, 1–8. [Google Scholar] [CrossRef] [PubMed]
  33. Das, M.; Uppal, H.S.; Singh, R.; Beri, S.; Mohan, K.S.; Gupta, V.C.; Adholeya, A. Co-Composting of Physic Nut (Jatropha curcas) Deoiled Cake with Rice Straw and Different Animal Dung. Bioresour. Technol. 2011, 102, 6541–6546. [Google Scholar] [CrossRef] [PubMed]
  34. Malinowski, M.; Wolny-Koładka, K.; Vaverková, M.D. Effect of Biochar Addition on the OFMSW Composting Process under Real Conditions. Waste Manag. 2019, 84, 364–372. [Google Scholar] [CrossRef]
  35. Połomka, J.; Jędrczak, A. Potential of Mineral Fraction in Compost-Like-Output, Methods of Its Obtaining and the Possibility of Using It in the Context of Circular Economy. Materials 2020, 13, 3023. [Google Scholar] [CrossRef]
  36. SoSokač, T.; Valinger, D.; Benković, M.; Jurina, T.; Gajdoš Kljusurić, J.; Radojčić Redovniković, I.; Jurinjak Tušek, A. Application of Optimization and Modeling for the Composting Process Enhancement. Processes 2022, 10, 229. [Google Scholar] [CrossRef]
  37. Pezzolla, D.; Cucina, M.; Proietti, P.; Calisti, R.; Regni, L.; Gigliotti, G. The Use of New Parameters to Optimize the Composting Process of Different Organic Wastes. Agronomy 2021, 11, 2090. [Google Scholar] [CrossRef]
  38. Chen, W.; Liao, X.; Wu, Y.; Liang, J.B.; Mi, J.; Huang, J.; Zhang, H.; Wu, Y.; Qiao, Z.; Li, X.; et al. Effects of Different Types of Biochar on Methane and Ammonia Mitigation during Layer Manure Composting. Waste Manag. 2017, 61, 506–515. [Google Scholar] [CrossRef]
  39. Szyłak-Szydłowski, M.; Kos, W. Application of Sensory Methods to Evaluate the Effectiveness of Solutions to Reduce the Exposure to Odour Nuisance and Ammonia Emissions from the Compost Heaps. Sensors 2024, 24, 4200. [Google Scholar] [CrossRef]
  40. Szyłak-Szydłowski, M. Validation of Odor Concentration from Mechanical-Biological Treatment Piles Using Static Chamber and Wind Tunnel with Different Wind Speed Values. J. Air Waste Manag. Assoc. 2017, 67, 1046–1054. [Google Scholar] [CrossRef]
  41. EN 13725: 2022; Stationary Source Emissions. Determination of Odour Concentration by Dynamic Olfactometry and Odour Emission Rate. Available online: https://standards.iteh.ai/catalog/standards/cen/67f31e88-f81d-4e78-bbf6-ce1dcb766eeb/en-13725-2022 (accessed on 21 January 2025).
  42. Kulig, A.; Szyłak-Szydłowski, M. Assessment of the Effects of Wastewater Treatment Plant Modernization by Means of the Field Olfactometry Method. Water 2019, 11, 2367. [Google Scholar] [CrossRef]
  43. ISO 13301:2018; Sensory Analysis—Methodology—General Guidance for Measuring Odour, Flavour and Taste Detection Thresholds by a Three-Alternative Forced-Choice (3-AFC) Procedure. Available online: https://standards.iteh.ai/catalog/standards/iso/5310d849-514e-4783-8882-1943f2dcdfad/iso-13301-2018 (accessed on 21 January 2025).
  44. Szyłak-Szydłowski, M.; Kulig, A. Deodorisation of Ventilated Air from a Fat-Processing Plant Using Different Types of Biofilter Fillings and Membranes. Sustainability 2024, 16, 1939. [Google Scholar] [CrossRef]
  45. Meena, A.L.; Karwal, M.; Dutta, D.; Mishra, R.P. Composting: Phases and Factors Responsible for Efficient and Improved Composting. 2021. Available online: https://www.researchgate.net/publication/348098151_composting_phases_and_factors_responsible_for_efficient_and_improved_composting (accessed on 10 December 2024).
  46. North Carolina State University. Applying Compost to Landfills Could Have Environmental Benefits. Science Daily. 14 December 2020. Available online: https://www.sciencedaily.com/releases/2020/12/201214104648.htm (accessed on 10 December 2024).
  47. Preble, C.V.; Chen, S.S.; Hotchi, T.; Sohn, M.D.; Maddalena, R.L.; Russell, M.L.; Brown, N.J.; Scown, C.D.; Kirchstetter, T.W. Air Pollutant Emission Rates for Dry Anaerobic Digestion and Composting of Organic Municipal Solid Waste. Environ. Sci. Technol. 2020, 54, 16097–16107. [Google Scholar] [CrossRef] [PubMed]
  48. Zhu, Y.; Zheng, G.; Gao, D.; Chen, T.; Wu, F.; Niu, M.; Zou, K. Odor Composition Analysis and Odor Indicator Selection during Sewage Sludge Composting. J. Air Waste Manag. Assoc. 2016, 66, 930–940. [Google Scholar] [CrossRef]
  49. Büyüksönmez, F.; Rynk, R.; Yucel, A.; Cotton, M. Mitigation of Odor Causing Emissions—Bench-Scale Investigation. J. Air Waste Manag. Assoc. 2012, 62, 1423–1430. [Google Scholar] [CrossRef]
  50. Andersen, J.K.; Boldrin, A.; Samuelsson, J.; Christensen, T.H.; Scheutz, C. Quantification of Greenhouse Gas Emissions from Windrow Composting of Garden Waste. J. Environ. Qual. 2010, 39, 713–724. [Google Scholar] [CrossRef]
  51. Maulini-Duran, C.; Artola, A.; Font, X.; Sánchez, A. A Systematic Study of the Gaseous Emissions from Biosolids Composting: Raw Sludge versus Anaerobically Digested Sludge. Bioresour. Technol. 2013, 147, 43–51. [Google Scholar] [CrossRef]
  52. Zhang, B.; Fan, F.; Guo, C.; Yu, M.; Zhao, M.; Song, Y.; Li, Y. Evaluation of Maturity and Odor Emissions in the Process of Combined Composting of Kitchen Waste and Garden Waste. Appl. Sci. 2021, 11, 5500. [Google Scholar] [CrossRef]
  53. Zhao, S.; Yang, X.; Zhang, W.; Chang, J.; Wang, D. Volatile Sulfide Compounds (VSCs) and Ammonia Emission Characteristics and Odor Contribution in the Process of Municipal Sludge Composting. J. Air Waste Manag. Assoc. 2019, 69, 1368–1376. [Google Scholar] [CrossRef]
  54. Jönsson, H.; Ermolaev, E.; Sundberg, C.; Smårs, S.; Pell, M. Greenhouse Gases and Odour Emissions from Composting. Suom. Maatal. Seuran Tied. 2012, 1–6. [Google Scholar] [CrossRef]
  55. Sundberg, C.; Yu, D.; Franke-Whittle, I.; Kauppi, S.; Smårs, S.; Insam, H.; Romantschuk, M.; Jönsson, H. Effects of pH and Microbial Composition on Odour in Food Waste Composting. Waste Manag. 2013, 33, 204–211. [Google Scholar] [CrossRef] [PubMed]
  56. Fischer, G.; Albrecht, A.; Jäckel, U.; Kämpfer, P. Analysis of Airborne Microorganisms, MVOC and Odour in the Surrounding of Composting Facilities and Implications for Future Investigations. Int. J. Hyg. Environ. Health 2008, 211, 132–142. [Google Scholar] [CrossRef] [PubMed]
  57. Rincón, C.A.; De Guardia, A.; Couvert, A.; Soutrel, I.; Guezel, S.; Le Serrec, C. Odor Generation Patterns during Different Operational Composting Stages of Anaerobically Digested Sewage Sludge. Waste Manag. 2019, 95, 661–673. [Google Scholar] [CrossRef] [PubMed]
  58. Chen, B.; Koziel, J.A.; Banik, C.; Ma, H.; Lee, M.; O’Brien, S.C.; Li, P.; Andersen, D.S.; Białowiec, A.; Brown, R.C. Mitigation of Gaseous Emissions from Stored Swine Manure with Biochar: Effect of Dose and Reapplication on a Pilot-Scale. Atmosphere 2021, 12, 96. [Google Scholar] [CrossRef]
  59. Neugebauer, M.; Sołowiej, P. The Use of Green Waste to Overcome the Difficulty in Small-Scale Composting of Organic Household Waste. J. Clean. Prod. 2017, 156, 865–875. [Google Scholar] [CrossRef]
  60. Wang, N.; Huang, D.; Shao, M.; Sun, R.; Xu, Q. Use of Activated Carbon to Reduce Ammonia Emissions and Accelerate Humification in Composting Digestate from Food Waste. Bioresour. Technol. 2022, 347, 126701. [Google Scholar] [CrossRef]
  61. Wang, Q.; Awasthi, M.K.; Ren, X.; Zhao, J.; Li, R.; Wang, Z.; Wang, M.; Chen, H.; Zhang, Z. Combining Biochar, Zeolite and Wood Vinegar for Composting of Pig Manure: The Effect on Greenhouse Gas Emission and Nitrogen Conservation. Waste Manag. 2018, 74, 221–230. [Google Scholar] [CrossRef]
  62. Viaene, J.; Peiren, N.; Vandamme, D.; Lataf, A.; Cuypers, A.; Jozefczak, M.; Vandecasteele, B. Biochar Amendment to Cattle Slurry Reduces NH3 Emissions during Storage without Risk of Higher NH3 Emissions after Soil Application of the Solid Fraction. Waste Manag. 2023, 167, 39–45. [Google Scholar] [CrossRef]
  63. Baral, K.R.; McIlroy, J.; Lyons, G.; Johnston, C. The Effect of Biochar and Acid Activated Biochar on Ammonia Emissions during Manure Storage. Environ. Pollut. 2023, 317, 120815. [Google Scholar] [CrossRef]
  64. Chen, B.; Koziel, J.A.; Bialowiec, A.; O’Brien, S.C. The Potential Role of Biochar in Mitigating Gaseous Emissions from Livestock Waste—A Mini-Review. J. Environ. Manag. 2024, 370, 122692. [Google Scholar] [CrossRef]
Figure 1. Block scheme for the management of biodegradable waste. 0–90 mm—sieve mesh size.
Sustainability 17 00851 g001
Figure 2. Box-and-whisker plot of ammonia (a) and odour concentration (b) at a depth of 10 cm inside the compost pile. Variants: IF0-: without preparation and addition; IF0+: addition of preparation; IF9-: addition of 9% intermediate fraction; IF9+: addition of 9% intermediate fraction and preparation; IF20-: addition of 20% intermediate fraction; IF20+: addition of 20% intermediate fraction and preparation; W4+: addition of 4-week green waste and preparation; W8+: addition of 8-week green waste and preparation; W13+: addition of 13-week green waste and preparation.
Sustainability 17 00851 g002
Figure 3. The distribution of the variable is the ammonia concentration each week of the process, with the grouping variable: variant.
Sustainability 17 00851 g003
Figure 4. Distribution of the variable: odour concentration each week of the process, with the grouping variable: variant.
Sustainability 17 00851 g004
Table 1. List of analysed variants.
VariantPreparationShare of WastesShare of AdditionKind of Addition
IF0--100% (~565 m3)--
IF0++100% (~565 m3)--
IF9--91% (~514 m3)9% (~51 m3)IF
IF9++91% (~514 m3)9% (~51 m3)IF
IF20--80% (~452 m3)20% (~113 m3)IF
IF20++80% (~452 m3)20% (~113 m3)IF
W4++80% (~452 m3)20% (~113 m3)4-week green waste
W8++80% (~452 m3)20% (~113 m3)8-week green waste
W13++80% (~452 m3)20% (~113 m3)13-week green waste
Abbreviations: IF—intermediate fraction; Wx—addition of wastes from x’s week; +—with addition of inoculum; -—without addition of inoculum.
Table 2. The basic statistics of ammonia and odour concentrations at a depth of 10 cm inside the compost pile in individual variants.
VariantminMeanmaxSt. Deviation
Ammonia (ppm)
IF0-14.0043.3599.0022.71
IF0+1.0011.3942.009.78
IF9-12.0034.8979.0021.20
IF9+3.0018.0490.0019.09
IF20-7.0037.5799.0030.02
IF20+0.0016.5799.0022.91
W4+18.0072.6199.0025.23
W8+0.0018.2199.0022.61
W13+16.0045.1199.0021.57
Odour concentration (ou/m3)
IF0-250018,25135,0009011
IF0+2000662523,5004879
IF9-800014,12527,0006073
IF9+200010,60935,0007424
IF20-600015,65435,0009631
IF20+40808635,0008959
W4+850028,81035,0008500
W8+450010,85735,0007496
W13+900020,66135,00010,416
Table 3. Coefficient of variation (CV) and standard deviation (SD) of ammonia and odour concentration for each variant.
VariantF0-F0+F9-F9+F20-F20+W4+W8+W13+
Ammonia concentration (ppm)
CV (%)54.183.961.9105.477.4134.533.2120.448.1
SD (ppm)22.99.8221.019.429.923.124.622.721.9
Odour concentration (ou/m3)
CV (%)50.571.943.970.760.1107.224.167.950.1
SD (ppm)9033488961867553962389887021753010,504
Table 4. Summed values of ammonia concentration and odour concentration and percentage of reduction in those parameters in relation to the pile without IF addition and without preparation.
VariantSummed
Concentration (ppm)
Reduction (%)Summed
Concentration (ppm)
Reduction (%)
AmmoniaOdour
IF0-1127-474,550-
IF9-97713.3395,50016.7
IF9+50555.2294,05037.4
IF20-10526.7438,3207.6
IF20+46458.8226,41052.3
Disclaimer/Publisher’s Note: The statements, opinions and data contained in all publications are solely those of the individual author(s) and contributor(s) and not of MDPI and/or the editor(s). MDPI and/or the editor(s) disclaim responsibility for any injury to people or property resulting from any ideas, methods, instructions or products referred to in the content.

