1. Introduction
How can we address the challenge of effectively measuring circularity? As the concept of the circular economy gains momentum, businesses and organizations are recognized as being pivotal in driving the transition towards more sustainable and resource-efficient practices. Essential to this endeavor is the need to effectively measure circularity, enabling companies to assess and track their progress in implementing circular economy principles (Figge et al., 2018; Valls-Val et al., 2022; Vinante et al., 2021) [
1,
2,
3]. Metrics at the company level can illuminate, for example, areas where circular practices can be integrated, such as product design improvements for durability and the establishment of recycling and reuse chains for both consumed and produced goods. Understanding their circular economy performance allows companies to align their strategies with broader sustainability objectives, potentially enhancing competitiveness, mitigating environmental impacts, and ensuring compliance with current and future regulatory requirements (Kulakovskaya et al., 2023) [
4]. However, measuring circularity is a complex task requiring standardized methodologies and comprehensive data collection and analysis. Despite efforts by researchers, policymakers, and organizations to develop frameworks and tools, success has been limited due to the intricate nature of this challenge.
Through a comprehensive literature review, market tool analysis, and interviews with policymakers, we identified a critical research gap: existing metrics fail to adequately address procurement-to-waste system boundaries, particularly in scenarios where companies act as business-to-business (B2B) buyers rather than producers. This gap is significant where companies rely on external suppliers for production and waste management, limiting their influence along the value chain.
Relating to this gap in knowledge, this study examines the challenge of measuring circularity within the procurement-to-waste system boundaries, using the example of single-use in-flight drinking cups at SWISS International Air Lines Ltd. (SWISS), the national airline of Switzerland (Zürich, Switzerland). In 2019, 22.4 million plastic cups for cold beverages were served on flights, all going to waste (SWISS internal documentation). The company does not manufacture these cups or manage their waste treatment itself, procuring these services externally. This issue extends to many inflight products, such as cutlery, blankets, and hand towels, creating a broader challenge of measuring circularity across diverse product portfolios.
The objective of this study is to develop an index tailored to scenarios where the company operates as a B2B buyer rather than a producer. This index must be easily applicable to a range of products, leveraging the company’s proprietary economic data to ensure precision, validity, and security. Additionally, the index should be adaptable to evolving conditions, such as shifts in policies and regulations. By addressing this research gap, this study aims to advance the practical implementation of circularity metrics within industrial settings, offering a valuable contribution to both academia and industry.
Following this introduction, this paper proceeds with
Section 2, where the research design is outlined. This is followed by
Section 3 and
Section 4, which present a comprehensive literature review and an evaluation of existing market tools, respectively. In
Section 5, the core of our study, we introduce and thoroughly discuss our newly developed circularity metric. This innovative metric addresses the gaps identified in
Section 3 and
Section 4 and forms the basis for the study’s conclusions.
2. Research Method
This study adopted an exploratory research approach to address the challenge of measuring the circularity of economy practices. The methodology encompassed a comprehensive literature review, market analysis of existing tools, stakeholder interviews, and the development of a novel metric. This approach was necessitated by the initial assumption that a suitable metric could be identified through the existing literature or tools. However, neither the literature review nor the market analysis yielded a viable metric. Consequently, it became evident that a fully exploratory approach was required. This included incorporating qualitative data to capture the unpublished insights and perspectives of legislators, which were critical for developing a robust and contextually relevant measurement framework.
A systematic literature review was undertaken, utilizing both Google Scholar and the research team’s own extensive library, screening in total over 140 papers. The review aimed to identify and critically analyze key papers and publications related to circularity measurement, thereby establishing a robust theoretical foundation for the study. The search strategy employed a range of targeted keywords, including “measuring circular economy” but also “measuring recycling”, with an emphasis on capturing the various cycles inherent to circular economy practices. Further selection criteria involved screening papers for those that employed a mathematical and systematic approach to measuring circularity. Further screening was carried out to understand, in particular, the approaches relevant to the procurement-to-waste system boundaries set by the case study. The objective was to gain a comprehensive understanding of the existing methodologies, metrics, and frameworks utilized in the assessment of circular economy initiatives within the system boundaries given by the case study.
Following the literature review, a market analysis was performed to evaluate current tools available for measuring circularity. This process involved compiling a list of tools offered to industry and developing criteria to assess their effectiveness, applicability, and limitations, as described in
Section 4. Each tool was analyzed based on these criteria to determine its suitability for addressing the specific system boundaries of procurement-to-waste set by the case study. To gain deeper insights into the practical application and effectiveness of these existing tools, two additional explorative semi-structured online interviews were conducted with one company which seemed most promising. Additionally, email exchanges were utilized to gather further information and clarify specific aspects of these tools with all tool providers. Two further semi-structured interviews with representatives from the Swiss government and the canton of Zürich were carried out to understand their perspectives on measuring circularity and the context in which the case study takes place, as well as to ensure that whichever solution that we would come up with would comply with current and future policies.
Given the gap in knowledge identified through the literature review, market analysis, and interviews, the research team proceeded to develop a new metric. This novel formula, named CMU Extended, was created by adapting an existing circularity metric as described in
Section 5. The development process involved theoretical refinement and practical validation to ensure that the new metric effectively addresses the identified gaps.
3. State of the Art—The Literature Addressing Measuring CE Within Procurement-to-Waste System Boundaries
The literature review was undertaken within the specified procurement-to-waste system boundaries, focusing on approaches that adopt the buyer’s perspective in a B2B situation, reflecting the setting of the case study. The primary objective was to identify methods offering directly applicable and quantitative solutions, rather than engaging in conceptual discourse or qualitative assessments. Priority was accorded to studies presenting formulas that could be readily implemented. Additionally, emphasis was placed on recent publications with a high citation frequency, reflecting their relevance within the scholarly discourse.
The initial phase involved studying the comprehensive literature review carried out by Parchomenko (Parchomenko et al., 2019) [
5], who conducted a detailed assessment and clustering of 63 circular economy metrics. Their analysis revealed three primary clusters of metrics, namely (1) a resource-efficiency cluster, (2) a materials stocks and flows cluster, and (3) a product-centric cluster. For the purposes of this study, particular attention was given to the clusters containing metrics related to materials stocks and flows, as well as product-centric metrics. Using these clusters, we conducted a further analysis of the papers, categorizing them based on the phase they addressed within the product lifecycle relevant to our case: production, procurement, post-procurement, and waste management. This approach enabled us to systematically map how each study contributes to the understanding and advancement of circular economy practices across the various stages of interest. It also allowed us to pinpoint where the existing research is concentrated and to identify critical gaps in the current literature.
Within the materials stocks and flows cluster, a total of nine metrics were identified as interesting for our case.
Table 1 presents an overview of the stages covered by these nine metrics. As the table demonstrates, the majority address the post-procurement and waste phases, with six metrics also encompassing the production phase. Notably, none of the identified metrics address the procurement phase.
In the realm of product-based metrics, as highlighted by Parchomenko et al. (2019) [
5], one notable approach is the longevity–circularity indicator, employing two distinct indices. These indices evaluate both the circular attributes of materials and a metric to gauge the actual lifespan relative to the anticipated lifespan with various reuse options. However, akin to the findings in the previous cluster, the outcomes pertaining to procurement-focused metrics were consistent: none of the identified metrics within this category specifically target procurement or adopt a procurement-centric perspective, as summarized in
Table 2.
In search of the procurement variable, an additional screening of over 40 papers was undertaken, of which only 3 were found to address procurement directly. For instance, Bai et al. (2022) [
24] proposed a group decision-making method integrating various approaches for circular-economy- and circularity-based supplier evaluation as well as selection. Despite its intriguing premise, its complexity renders it impractical for application for our case. Atkin and Gergin (2016) [
25] emphasized the importance of incorporating environmental, economic, and social dimensions in supplier evaluation, presenting a questionnaire-based approach to assess potential suppliers. However, we found that the reliance on questionnaire responses poses validity concerns, particularly regarding the accuracy of self-reported data, since no standards for such data are in place yet. Sheu et al. (2005) [
26] introduced a multi-objective optimization model for a green supply chain, although its applicability is primarily suited to manufacturing companies rather than service providers like SWISS.
Regarding waste management, the academic discourse focuses on the question of how much detail needs to be considered, representing the trade-off between methodological detail and data feasibility. Several papers propose simplified approaches, such as calculating the ratio of collected or recycled material to total material, although this has been critiqued for overlooking other potentially relevant variables. Pires and Martinho (2019) [
27] introduced a waste hierarchy index (WHI) based on parameters like reuse and upcycling, excluding incineration as a circular operation. Park and Chertow (2014) [
8] developed a “reuse potential indicator” (RPI), which quantifies the reuse potential of waste materials, emphasizing their resource-like qualities. Anastasiades et al. (2023) progressed with a Circular Construction Indicator framework that incorporates the RPI to evaluate the circularity of construction projects. Other discussions revolve around the waste hierarchy principle, with the European Union establishing a framework comprising prevention, preparation for reuse, recycling, recovery, and disposal.
Also on EU level, we find the Circular Material Use rate (CMU) published by Eurostat (Eurostat, 2018) [
28], wherein two variables—the recycled material and total material used—are juxtaposed in a ratio. This approach quantifies the proportion of material recycled and reintegrated into the economy relative to the total material utilized. This indicator relies on mandatory reporting from all EU Member States, alongside aggregated member state data (Eurostat, 2018) [
28]. At the national level, the CMU rate is further subdivided by material category (Federal Statistik Office Switzerland, 2024) [
29].
Huysman et al. (2017) [
30] and Di Maio and Rem (2015) [
31] devised indicators with a more detailed waste classification, aiming to capture various recycling and collection scheme efficiencies. Additionally, Moraga et al. (2019) [
32] and Ardente and Mathieux (2014) [
33] proposed indicators such as the Recyclability Benefit Rate and the Recycled Content Benefit Rate, emphasizing the need for further research on material lifetime, quality, and economic considerations in circular economy assessments.
An interesting contribution comes from Nelen et al. (2014) [
18], who aimed to develop a comprehensive set of multidimensional indicators for assessing the benefits of recycling waste electrical and electronic equipment (WEEE) materials. Their approach encompasses four key dimensions: material cycle closure, critical material recovery, environmental impact avoidance, and economic performance. Notably, two indicators, applied in various contexts, assess the mass of recycled and repaired materials in relation to the total material mass. Additionally, an economic performance indicator measures the profitability of recycling and repairing against total material costs. While these indicators reflect a common trend of relating actions to overall quantities, Nelen et al. (2014) [
18] introduce an innovative environmental impact avoidance factor. This factor quantifies the environmental impact avoided through recycling and repairing relative to the total environmental impact of the material. Although promising, calculating this metric necessitates a prior life cycle assessment (LCA) to determine the environmental impact of each scenario.
On a different level, Figge, Thorpe, and Manzhynski (Figge, Thorpe and Manzhynski, 2021) [
34] advocate for a portfolio theory of the circular economy, emphasizing the importance of understanding the trade-offs and synergies among different circularity strategies. The authors posit that circularity should not be viewed as a binary concept but rather as a spectrum of possible configurations, each with varying environmental and economic implications. Drawing on insights from multi-level selection theory, as outlined in Society (2018) by Williams and Pigliucci (Pigliucci, 2009) [
35], the authors illustrate how the actions of individual companies can influence the behavior of the broader group, potentially shaping the overall circularity of the system. This group-level perspective offers valuable insights, aligning with the adopted research approach and signaling a promising direction for future research.
The literature review focused on methodologies from procurement to waste management, with an emphasis on buyer-centric approaches to identify practical, quantitative solutions. Recent, highly cited publications were prioritized, especially those presenting existing formulas.
Initially, this study analyzed the circular economy metric clusters presented by Parchomenko et al. (2019) [
5], with a focus on materials stocks and flows, and product-centric metrics. Despite addressing the post-procurement and waste phases, none specifically targeted procurement. Further exploration also revealed a lack of focus on procurement within the additionally reviewed metrics. Only three papers were found which directly addressed procurement, but their complexity or limited applicability posed challenges. Discussions on the other end of the system boundary, waste management, highlighted the need to balance methodological detail and data feasibility. Overall, none of the approaches we found addressed the system boundaries in a case-suitable way.
4. State of the Art—Tools on the Market
In a first step, market research was carried out to identify tools on the market through common search engines such as Google and MS Bing. Based on a detailed market analysis in spring 2023 of currently available tools with categories such as language, active users, andw availably on the market (see all criteria listed below), in combination with reflections in the literature presented by Sacco et al. (Sacco et al., 2021) [
36], Vinante et al. (Vinante et al., 2021) [
3], and Valls-Val et al. (Valls-Val, Ibáñez-Forés and Bovea, 2022) [
2], the following tools were selected for further evaluation:
Following the identification of current tools, an assessment was conducted based on the following criteria: active users, past users, location of origin (Europe/global), cost, language, type of assessments (quantitative/qualitative), materials considered (water, waste, energy, finance, etc.), time on the market, likelihood to stay on the market, potential political impact, product-level assessment, company-level assessment, and education of user. In search of a tool which would allow an industry wide comparison on product level now and in the future, priority was given to the categories:
Active/passive users: Indicator for market acceptance
Costs: Value for money
Time on the market: Indicator for market acceptance
Likelihood to stay on the market: Indicator for market acceptance
Political impact: Indicator to evaluate if the tool reflects current EU/Swiss regulations and will do so in the future
Product level assessment: Assessment on product level
4.1. Discussion Tool Assessment
The analysis of the market reveals the availability of various tools for assessing sustainability metrics. Initial impressions were positive; however, upon applying predetermined evaluation criteria, the pool of viable tools diminished by half. Five tools were eliminated from further consideration due to constraints such as restricted access, unavailability, or language barriers. Additionally, one tool offered by KPMG was excluded as it overlapped with the CTI tool, which was already earmarked for detailed examination.
Subsequently, detailed assessments were conducted on the remaining tools: Circulytics, MCI, CTI, and CircularityCalculator. Discussions were held with the respective providers, either through interviews or email correspondence. Based on the assessment criteria applied as described above, CTI and Circulytics were recognized as the most promising options. These tools had the most active/passive users, with high market acceptance and, important for the case at hand, what seems to be an ability to assess products on the product level.
Several interviews were conducted with key stakeholders, including the CEO and Strategic Director of the Circular Transition Indicators (CTI) initiative, as well as a representative from the World Business Council for Sustainable Development (WBCSD), which endorses CTI. The primary aim of these discussions was to gain a detailed understanding of the tools and their functionalities. Initially, the goal was to explore the feasibility of enhancing existing tools to address the identified problem, enabling Swiss and other companies to adopt a standardized solution that would facilitate comparability within industries, such as the airline sector, without the need to develop a new metric.
In the case of Circulytics, additional inquiries beyond the publicly available documentation were conducted via email (Spring 2023) with the Ellen MacArthur Foundation, the organization behind this tool. Similarly, direct communication was established with the CEO of the MCI tool to gain further insights. These efforts culminated in a comprehensive evaluation of four tools, integrating analysis of their online presence, available documentation, and qualitative insights gathered through stakeholder engagements.
4.2. Circulytics
Developed by the Ellen MacArthur Foundation (EMF, 2021) [
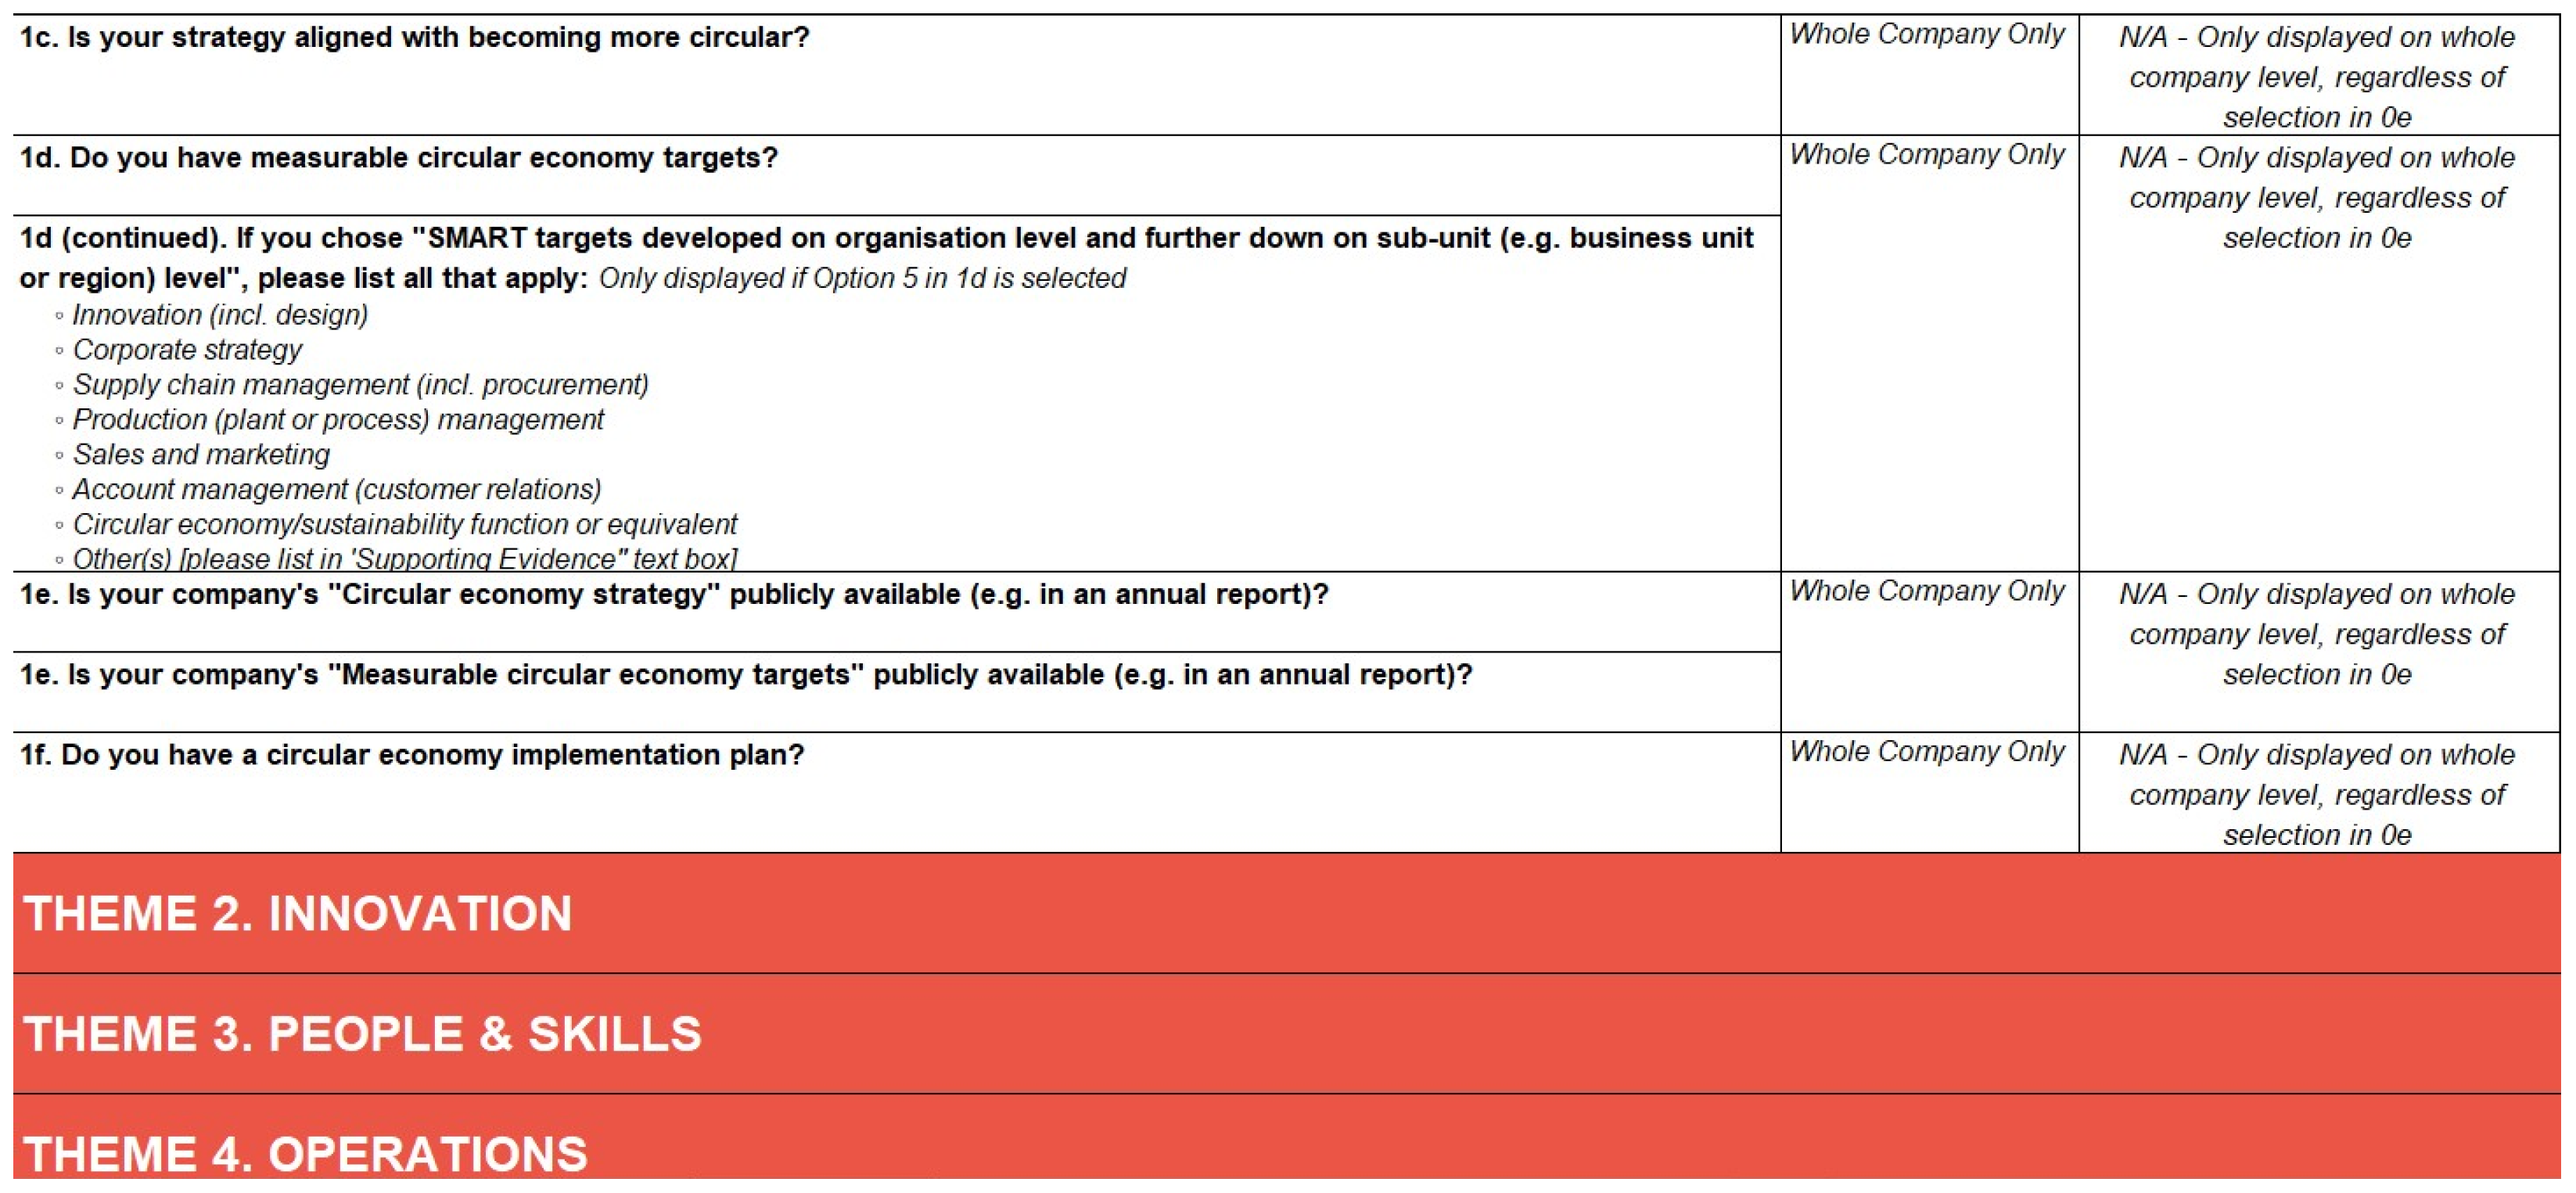
37], this tool benefits from the Foundation’s established reputation as a leading proponent of circular economy principles. Ellen MacArthur’s pioneering contributions to circular economy discourse, including her widely accepted definition of the concept, have cemented the Foundation’s influence in both scholarly and practical spheres. Notably, prominent industry players such as H&M, ABB, Coca-Cola, and HP were among the early adopters, underscoring the tool’s alignment with prevailing industry standards. Circulytics distinguishes itself by its evaluation framework, which integrates qualitative and quantitative assessments across various organizational dimensions, including innovation, strategy and planning, and personnel capabilities. The tool and the assessment can be used for free.
Despite its initial promise, this tool’s efficacy was compromised in one crucial aspect: its inability to facilitate product-based assessments, a priority criterion for the present study. Subsequent discussions with the tool’s developers revealed that the Foundation had discontinued efforts to provide standalone product-level assessments as rempart of its strategic realignment. Previous endeavors in this direction, halted in 2019, now manifest as the MCI tool marketed by Hopkins. Consequently, while Circulytics remains an interesting and powerful tool, its inadequacy for the specific demands of our case study led to an exclusion of this tool (
Figure 1).
4.3. MCI Tool
The MCI tool is offered by a company called Hoskins, with the backing of the founder, James Goddin (Hoskins, 2024) [
38]. The company’s webpage shows a team with three members, presenting Hoskins as a small consulting company. The tool has been further assessed, as it was originally based on an initiative from the EMA Foundation, as described above, and is one of the few tools which allows the product-level assessment of circularity. The tool is free to download from the website (
Figure 2).
The tool is provided in the form of an Excel sheet (with only one tab, as displayed above). The case displayed in the Excel sheet is an example of a biro, provided by Hopkins. Each part of the biro can be assessed individually, with a total score showing the MCI factor, ranging from 0 to 1, with 1 representing the highest level of circularity. The material types are basic, in that, for example, no differentiation is made on the material level “plastics”. The tool is easy to use; however, the Excel sheet itself cannot be modified and the calculations which happen in the background are not displayed in the Excel sheet (only absolute numbers). Regarding the latter argument, following up on an original documentation from EMA (2019) [
19], the calculations become clearer; however, the first argument remains, as the Excel sheet cannot be modified. For the example of cups with no longevity data, this tool fails. Any value under 1 year in the category “Longevity” leads to an error for all fields. Additionally, given the low impact that the current owner has on the market, this tool is unlikely to reach an industry standard level or reflect future regulations on an EU level. For these reasons, this tool was ruled out.
4.4. CTI Tool
The CTI tool [
39] is provided by a company called Circular IQ with the backing of the World Business Council for Sustainable Development (WBCSD)—a business financed through membership and consulting. In an interview carried out with the CEO in March 2023, the CEO claims to also be well connected to influential policymakers in the EU. The tool focuses on supplier data (inflow), as well as the moment of disposal (outflow). The following Excel screenshot shows an example of the required data (
Figure 3).
As partially displayed above, the inflow data distinguish between the following categories: flow type (TI10); critical material (TI7); mass (kg) (TI3); focus flow (TI16); non-virgin—renewable (circular) percentage (TI17); non-virgin—non-renewable (circular) percentage (TI2); virgin—renewable (circular) percentage (TI1); virgin—non-renewable (linear) percentage (TI9); GHG material (TI23); selected for step 5 (TIS5_1); target mass (TIS5_2); target inflow circularity (TIS5_3); selected for GHG analysis (TIS5_4); and GHG virgin content reduction (TIS5_5).
For the outflow section, which is on the next tab, called “Step3&5 Outflow”, as visible in the figure below (
Figure 4), the following categories must be filled in: flow name (M18); flow type (TI10); mass (kg) (TI6); recovery potential percentage (TI4); actual recovery percentage (TI5); selected for step 5 (TIS5_6); target mass (TIS5_7); target recovery potential (TIS5_8); and target actual recovery (TIS5_9).
Only considering the data requested for the outflow and inflow, it becomes clear that first, we need to collect a lot of data, and second, we can (hopefully) expect a detailed assessment once we have filled in the data. Additional data can be collected and filled in to also display water and energy usage.
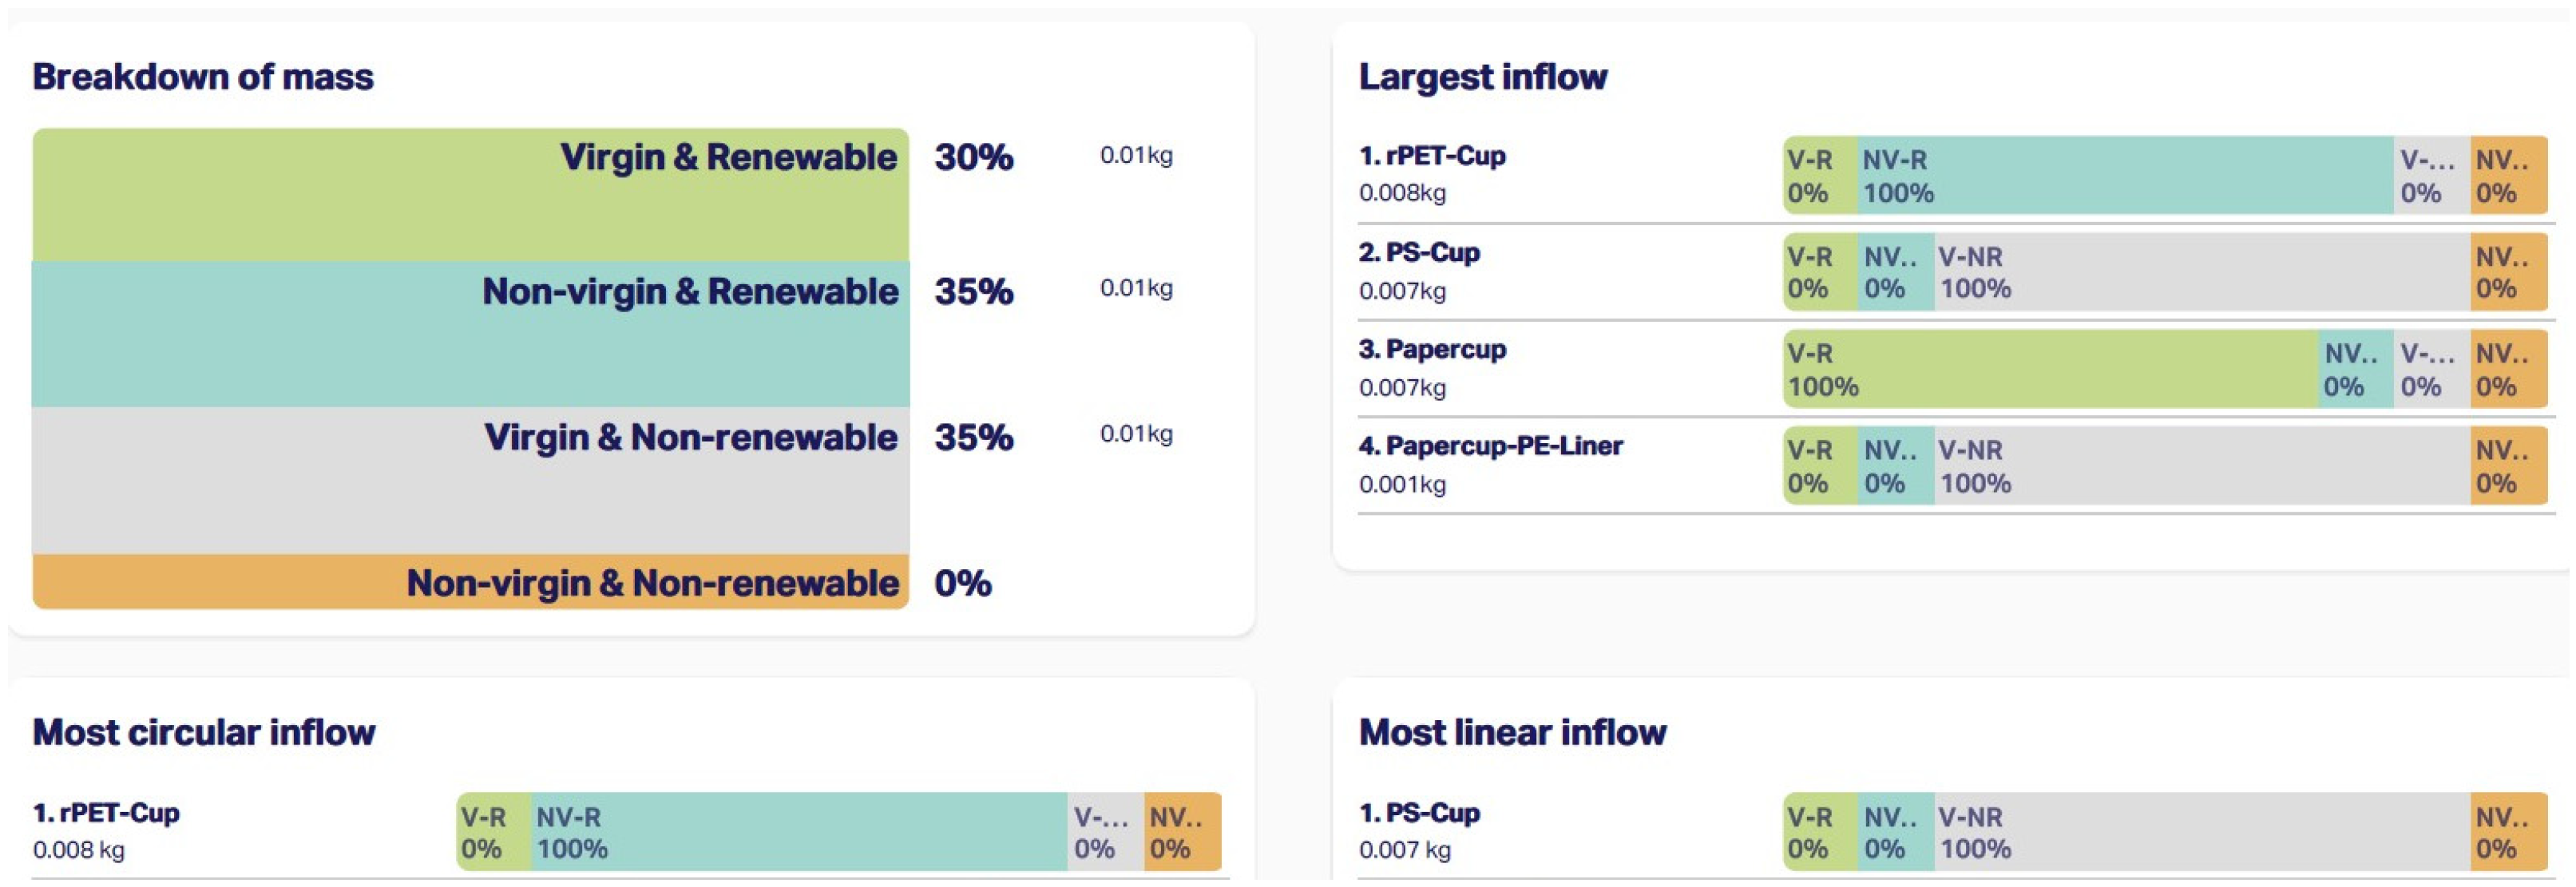
The report, which is created based on the input data, is available in HTML format on the website or as a PDF download (several pages). An example and excerpt is displayed below (
Figure 5).
4.5. Discussion of the CTI Tool
Since the CTI tool, despite its high costs of CHF 12,500 for 12 assessments, was considered as very promising at the beginning of the project, it deserves a separate discussion. Early on, our aim was to identify a standardized instrument for assessing circularity, with potential applications within the aviation sector. Subsequently, we engaged in extensive discussions with the tool’s provider to explore the feasibility of further developing their solution to suit industry-specific needs.
However, our experience with the tool revealed a significant challenge in data collection over time. This challenge is deeply rooted in our case context: SWISS operates as a user rather than a producer of the product (cups), thereby lacking direct control over the cup supply chain. Consequently, data acquisition from suppliers proves to be laborious and, in some instances, unachievable, as the companies supplying SWISS may not possess the necessary information. Moreover, the data provided by suppliers often pertain solely to their production processes, omitting crucial details regarding the cradle-to-gate aspects of material production.
Another critical issue arises from our reliance on externally sourced data, which hampers our ability to verify their accuracy effectively. While established ISO standards could potentially mitigate this issue by aligning supplier obligations with those of B2B consumers, no such standard currently exists for measuring circularity. Despite inquiries with the ISO Standardization body regarding the development of such a standard, specifics regarding ISO/CD 59020 remain undisclosed as of spring 2024. Unfortunately, requests for insights into the standard’s direction were met with refusal. With no standard available yet, and no company being certified (which again will take time even once ISO have published their ideas), there is a risk that a supplier who naturally wants to keep SWISS as a customer will report in their own favor with no neutral body to check up on the data.
4.6. Circularity Calculator
The Circularity Calculator has been developed in the context of an EU research project and is now offered for free by Ideal & Co [
40], a small Dutch design company with, according to its webpage, five members. This tool is interesting in that it reflects the different circles of circularity and offers indicators, establishing the relationship between the variables of materials, production effort, and money, and in this way shows the money saved by keeping things in the loop (
Figure 6).
The tool is designed to capture cradle-to-cradle or cradle-to-grave considerations and boasts a well-crafted interface. However, its application to our case study reveals significant limitations. SWISS lacks ownership of the requisite data concerning sourcing and production, and the company has no detailed information necessary for the meaningful application of the looping criteria displayed within the tool. Moreover, the tool does not adequately address the need to evaluate products within system boundaries extending from procurement decisions to waste management. Instead, it primarily supports design decisions in the early stages of product design, aligning with the target audience identified by the tool provider.
Ten tools were initially identified for evaluation, and five were excluded due to restricted access, unavailability, or language barriers, along with KPMG’s tool which builds on the CTI tool, leaving four tools under investigation. Our analysis indicates that none of the currently available tools are adequately suited to our case study. While Circulytics stands out as a potentially influential tool, its scope, assessing the entire company, exceeds the project’s objectives, while it falls short when it comes to product-based assessment. The MCI tool, while offering simplicity, lacks applicability for products lacking longevity data and is unlikely to make a significant market impact. Moreover, its Excel format prohibits modification. The CTI tool falters due to SWISS’s lack of ownership over necessary data. The Circularity Calculator boasts a well-designed interface and comprehensive documentation elucidating its mathematical underpinnings. However, its focus on early-stage product design guidance as well as its strength in differentiating between various types of loops limit its usability for our project.
Overall, the tool assessment demonstrates a lack of solutions tailored to companies operating in a procurement position without ownership of the product’s value chain. Common challenges across all tools include a lack of cost–revenue structures, data governance issues, reliance on product suppliers, and standalone functionality without integration with existing tools. These findings resonate with the existing literature, highlighting the absence of standardized approaches and the conundrum of balancing analysis depth with data collection requirements.
In evaluating these tools’ applicability, we also examined the relationship between the tool provider and political institutions, as described above, recognizing that political regulations heavily influence corporate actions. Do the current tools reflect the political environment that companies are acting in? Will they be updated by the providers if political regulations change? Given SWISS’s headquarters in Zurich and its affiliation with the Lufthansa Group, we focused on both regional (canton of Zurich) and broader regulatory environments (Switzerland and the EU). We conducted three interviews with representatives of relevant departments in the canton of Zurich and the Swiss government, aligning these discussions with the recent G7 summit’s push for plastic waste neutrality by 2040 (World Economic Forum, 2023) [
41]. Given the absence of legislation requiring circularity metrics at the company or product level in Switzerland, the canton of Zurich, or the EU, we inquired specifically about the potential impact of the G7 summit’s decision on companies headquartered in Switzerland that operate within the EU. Both the Swiss government and canton of Zurich representatives suggested that mandating such metrics at the EU level is improbable due to significant enforcement challenges.
The specific regulatory changes resulting, for example, from the G7 summit’s plastic waste neutrality initiative remain uncertain, as no official drafts or hints have been published by the involved governments yet. Initial drafts are expected by 2024, but the form and impact of these regulations are still speculative. The overall indication is that companies must adopt a metric-based approach that is adaptable to the evolving regulatory landscape to remain compliant and competitive in the future.
5. Development of a Circularity Factor
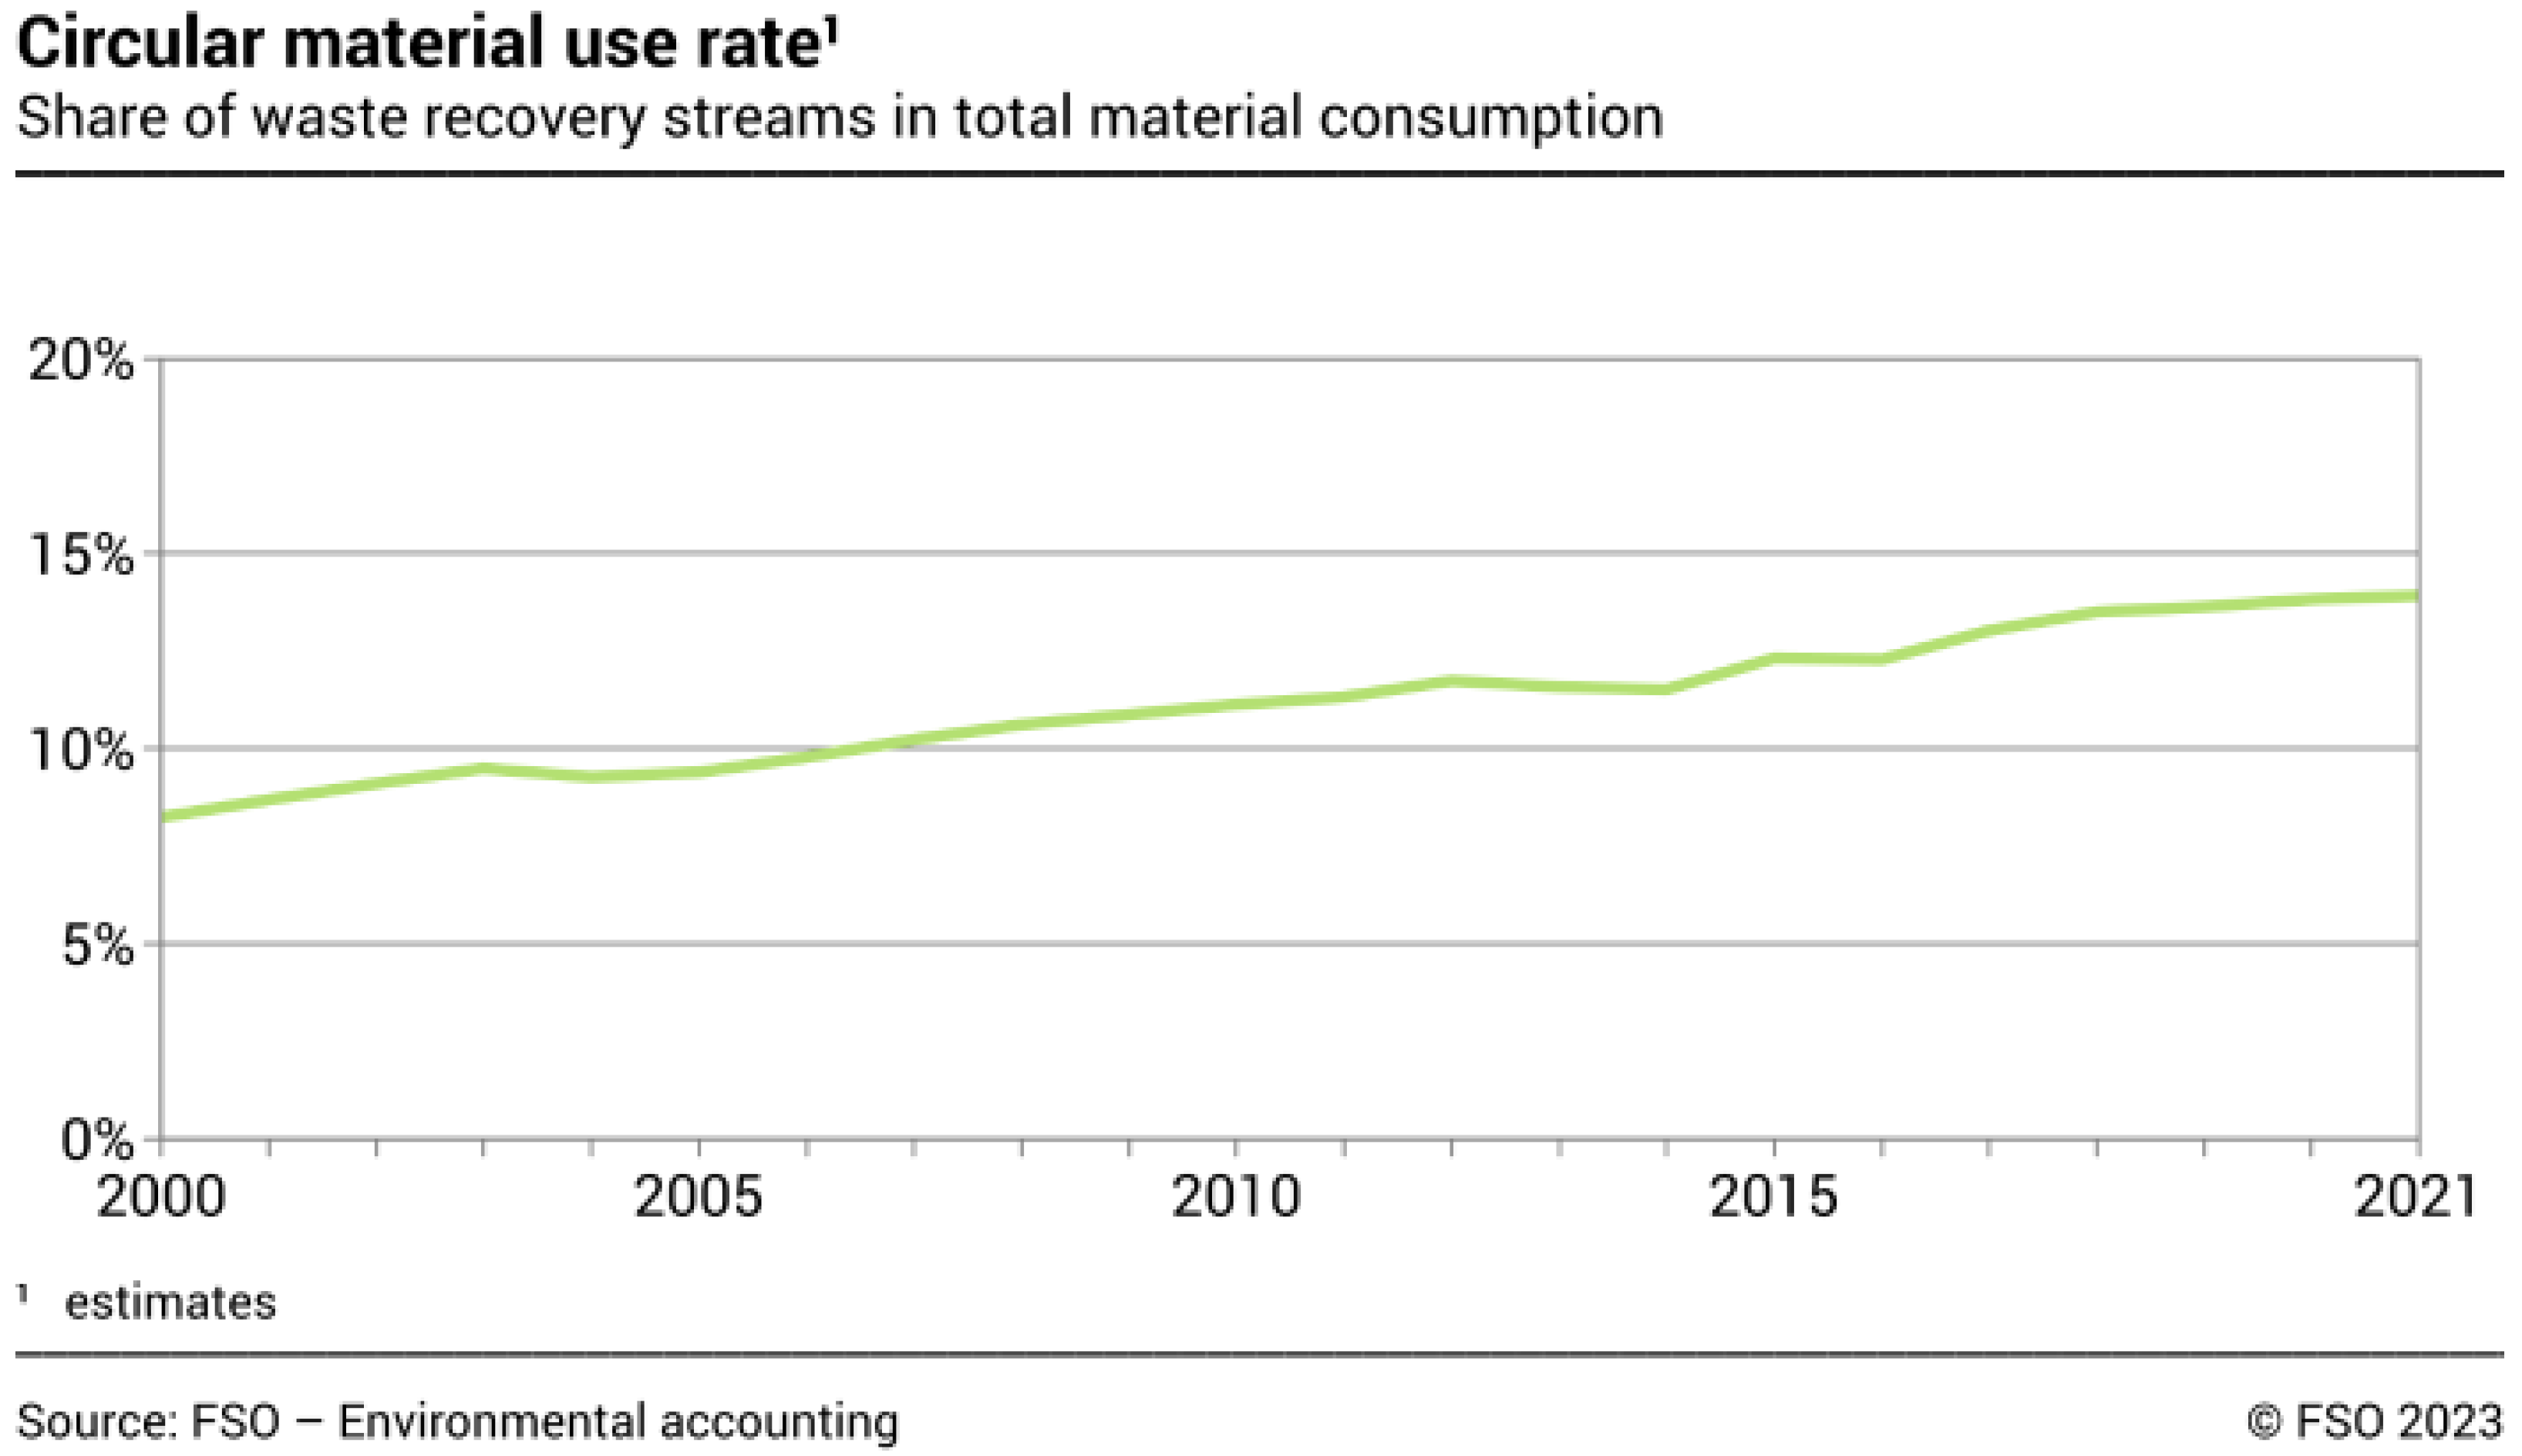
Given the absence of viable approaches in the existing literature, tools, or regulations to address the system boundaries from procurement to waste management within a B2B consumer context as set by the context of the case study, we undertook an iterative process to re-examine all available information. Through these iterations, which also encompassed an analysis of measures implemented by the Swiss government and the EU, we arrived at a familiar metric utilized at the country level, namely the Circular Material Use rate, CMU rate (Eurostat, 2018) [
28]. As described in the literature review section, this approach bears resemblance to the basic metric described in the waste management literature, wherein two variables—recycled material and total material used—are juxtaposed in a ratio leading to the following equation: Circular Material Use rate (CMU) = Circular Use of Material (U)/Overall Material Use (M). This metric is applied at both the national and EU levels and on material flow. An example published by the Swiss government on country level is shown in the figure below (
Figure 7).
Upon closer examination, this indicator offers interesting benefits across multiple dimensions. It is recognized both in Switzerland, where SWISS is headquartered, and in key target markets like the EU and EU-associated countries, making it familiar to both policymakers and the informed public. Moreover, its communication simplicity as a percentage enhances its accessibility. Furthermore, data availability poses no hindrance, as values for the requisite variables must be compulsorily reported by each EU and EU-associated government, including Switzerland.
However, the application of this metric within a country context is subject to several limitations. Firstly, the quality of data provided by member states dictates the reliability of the indicator; disparate data quality may compromise its accuracy, resulting in a rough approximation. Secondly, the indicator exclusively encompasses materials officially designated as waste, thereby excluding on-site loops such as internal recycling within companies. Thirdly, the focus solely on the disposal phase introduces challenges similar to those encountered in the literature and within the tool market, including issues of data availability, data quality, the complexity of data capture and analysis versus granularity in results, and the absence of reflection on the procurement phase.
Nevertheless, if applied at the company level, will these limitations persist? Additionally, could the inclusion of the procurement phase by introducing an additional variable enhance the comprehensiveness of this otherwise straightforward yet potent metric? These questions merit further exploration and will be addressed in subsequent discussions.
5.1. Transfer of an Existing Approach
We embarked on a mission to address two fundamental questions:
1. Can we adapt this approach to measure circularity at the company or even product level, focusing on the outflow of materials?
2. Is it feasible to modify the factor to incorporate both the procurement and waste decision phases, thereby encompassing the system boundaries pertinent to our case study?
In pursuit of the first question, we conducted two tests, the details of which are delineated below.
5.2. Testing of the Indicator Circular Material Use Rate
Example 1: We consider two products, namely a large plastic glass and the r-PET cup. We assume that the large plastic glass as well as the r-PET cup are not in any circular loop and that we have 100 units in total:
Example 2: We assume that 80 units of the large plastic glass as well as 80 units of the r-PET cup go into recycling and that we have 100 units in total (
Figure 8):
What we can see is that due to the simplicity of its calculation, we can translate this approach to the current case and at the company and even product level. The figure below illustrates the advantages and disadvantages if we were to follow this approach and use this equation for the case of SWISS (
Figure 9).
Having established the feasibility of translating the circularity metric to the moment of waste at the product level, our attention turned to assessing its viability for external communication and its potential utility as a marketing instrument. While this translation offers a simplified representation of circularity and lacks the granularity to capture all possible loops, its simplicity may render it more accessible for external stakeholders. In the literature, we primarily encountered critical perspectives on non-complex approaches; however, we questioned whether this perspective truly aligns with real-world applications.
Subsequently, we embarked on an explanatory analysis of approaches adopted by other organizations and came across the case of Weleda, a brand well known for its efforts in all categories of sustainability:
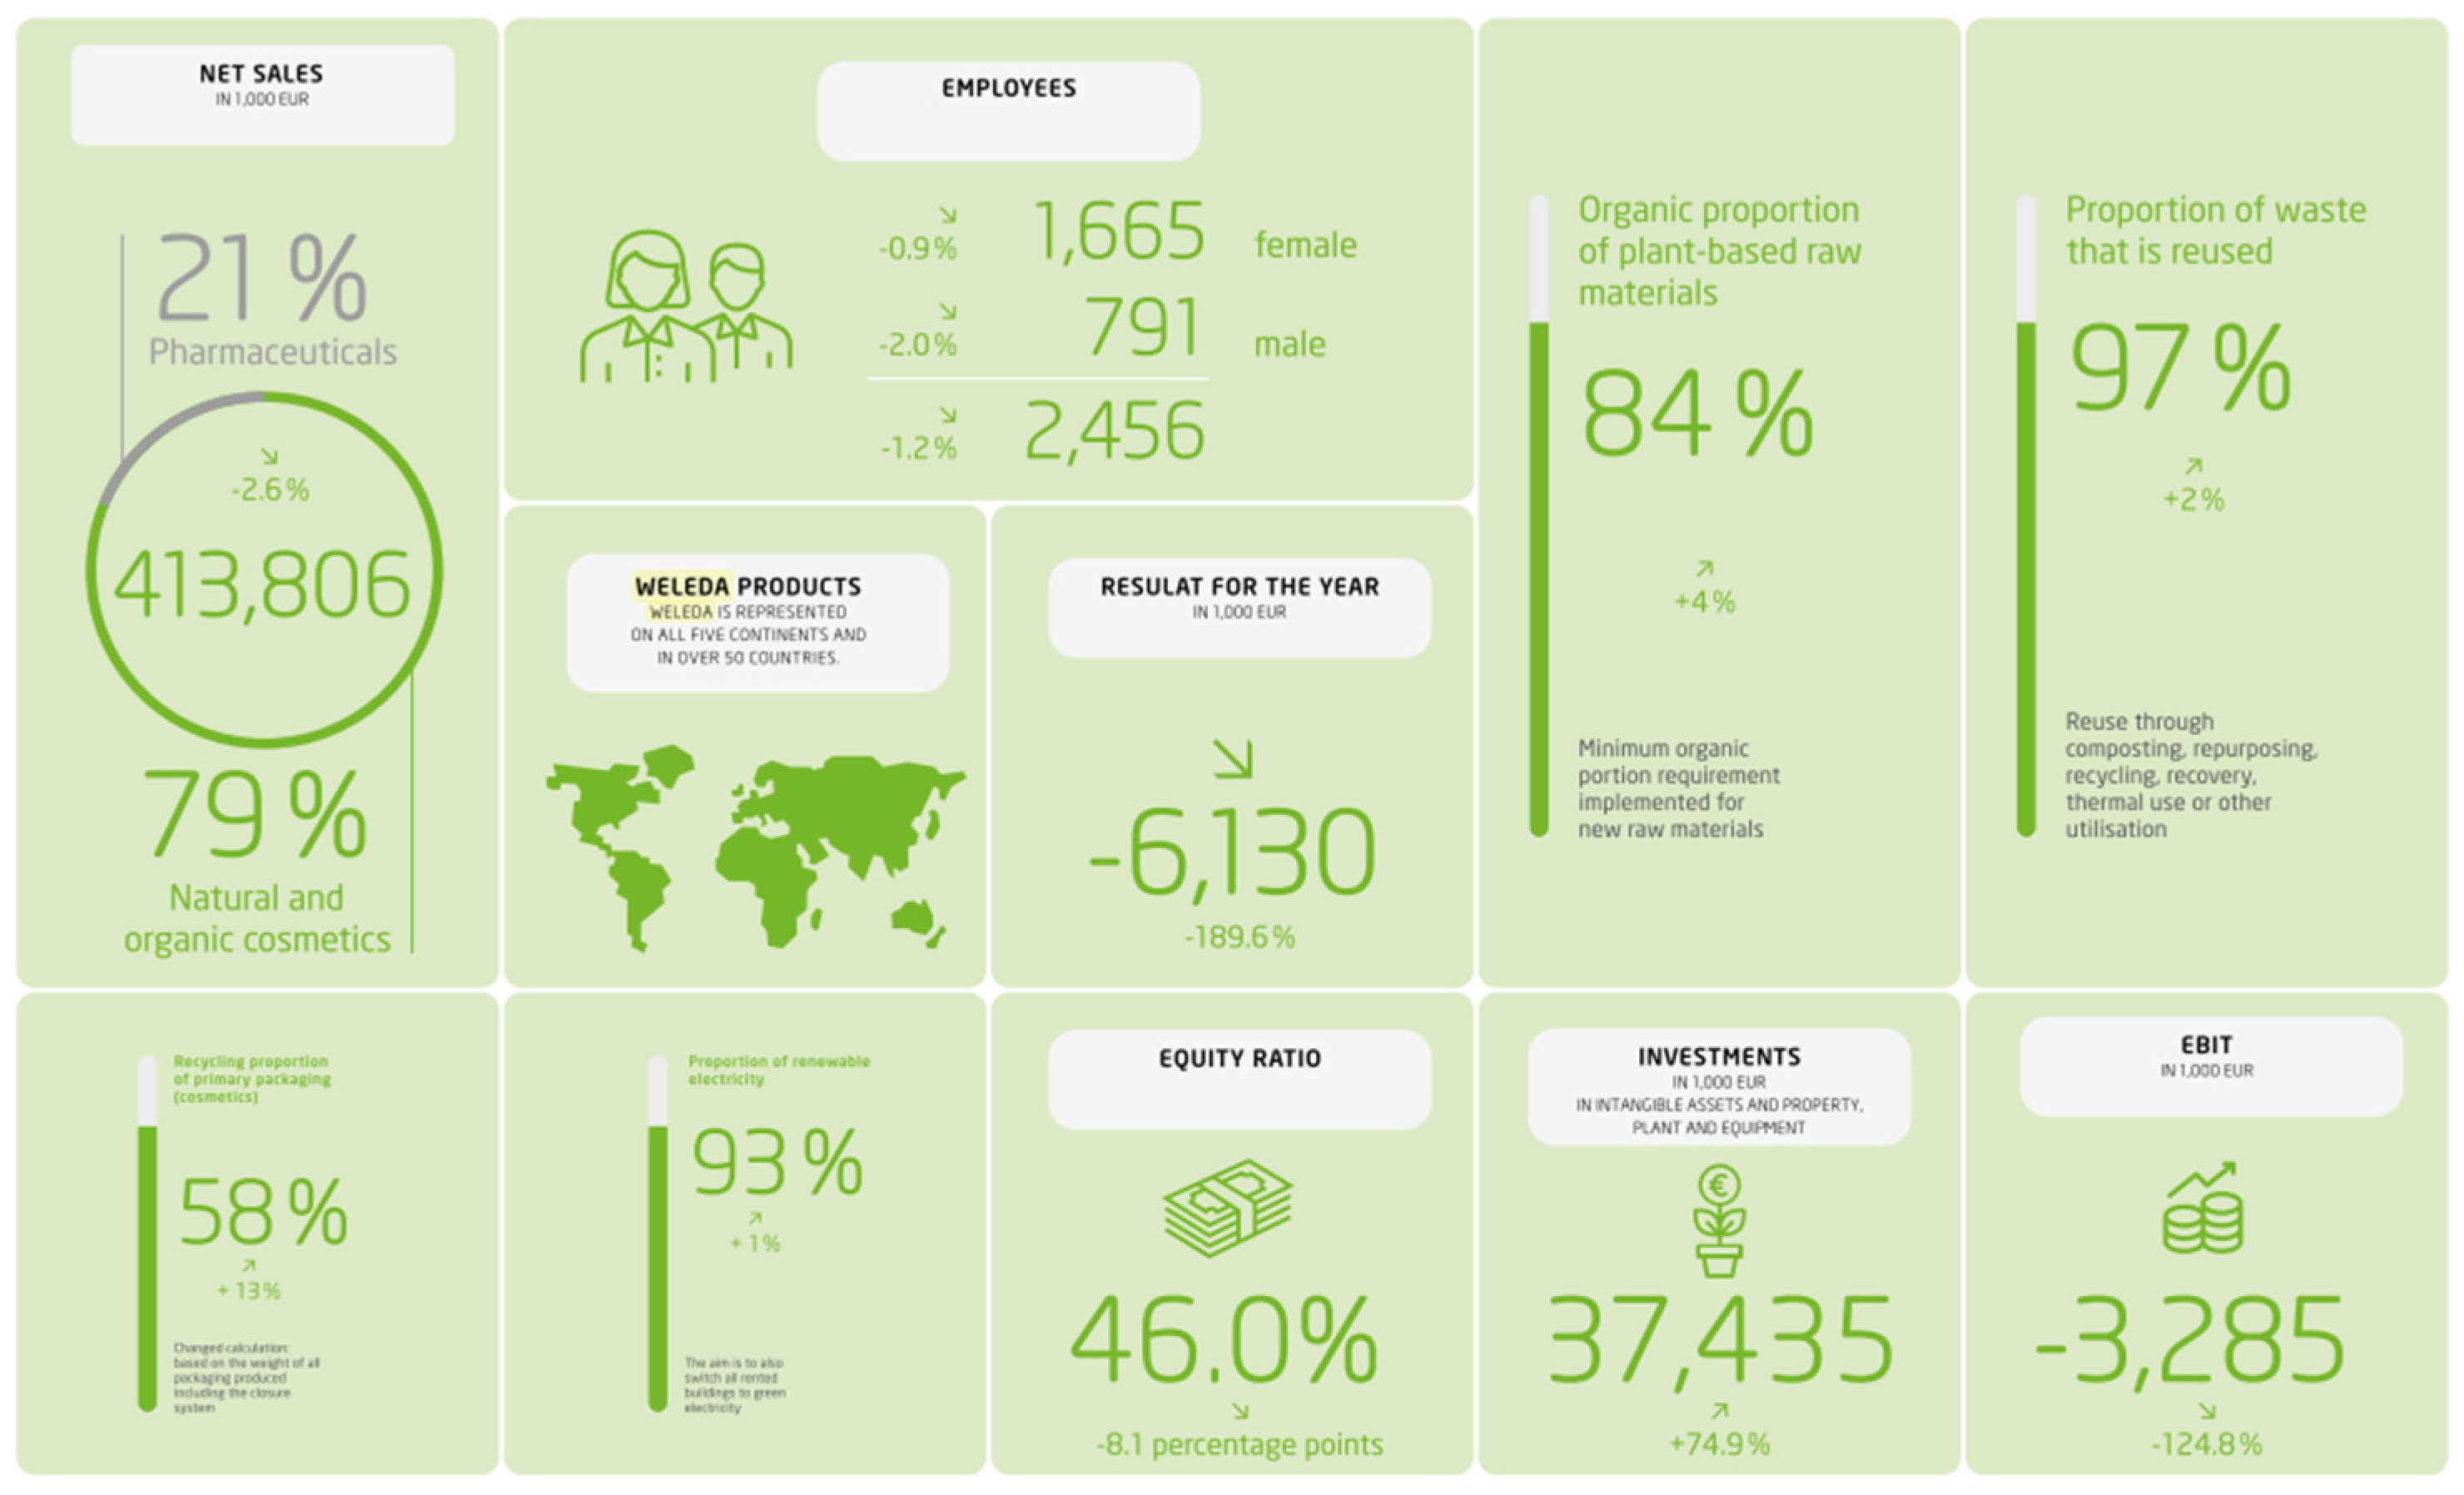
Weleda’s annual report features a succinct overview titled “Selected Numbers”, depicted in the figure below on the left (
Figure 10). Alongside metrics such as the number of employees, this section provides insights into the company’s sustainability endeavors. Given that Weleda manufactures its products internally, attention is also drawn to metrics such as the organic proportion of plant-based resources, the renewable energy proportion, and the proportion of recycled materials in packaging. Of relevance to our case, wherein SWISS does not control the entire value chain of the product and does not manufacture the cups, is the metric pertaining to waste management, in which the proportion of waste that is reused is 97%.
By indicating that 97% of all waste undergoes recycling of various forms, Weleda’s reporting highlights two key aspects: firstly, it underscores waste as a focal point of the metric, and secondly, it signifies that the metric serves as a comprehensive summary of all waste management activities, encompassing reuse, recovery, and energy retrieval through incineration. Notably, the inclusion of an additional category labeled “other utilization” adds further nuance to the reporting, albeit in a less specific manner. Thus, the example of Weleda demonstrates that even companies esteemed for their sustainability practices utilize metrics akin to the CMU in their public disclosures.
Based on this metric and the supporting evidence, the CMU could offer a compelling approach for our case if we can address the procurement challenge. Subsequently, we shifted our focus to addressing the second question:
Is it feasible to modify the factor to incorporate both the procurement and waste decision phases, thereby encompassing the system boundaries pertinent to our case study?
5.3. Further Development of the Circular Material Use Rate
To reflect the procurement decision, we modified the model such that it shows the in- and outflows of materials, as displayed in the equation below, the original variable of U (circular use of material) now reflected in the expression circular outflow:
5.3.1. Definition of Outflow
The current definition of outflow in the established CMU equation at the country level (U (circular use of material)) is everything which is declared as waste and goes into recycling thereafter. Recycling is defined by the European Union as follows:
“Recycling means any recovery operation by which waste materials are reprocessed into products, materials or substances whether for the original or other purposes. It includes the reprocessing of organic material but does not include energy recovery and the reprocessing into materials that are to be used as fuels or for backfilling operations.”
(Official Journal of the European Union, 2008) [
43].
Two points stand out: first, incineration with energy recovery, common in Switzerland, is not considered (contrary to the Weleda example), and secondly, as previously mentioned, the outflow is identified as such at the moment when waste is declared officially as waste. That means that any kind of recovery/looping on a company level is not considered in the current CMU.
5.3.2. Definition of Inflow
We suggest extending the current model for SWISS using this variable to allow for the presence of circular procurement decisions. The circular inflow is expressed by using the amount of recycled material in a purchased product (see example below).
5.3.3. Total Material Flow
The total material as a denominator is consistent with the original definition; however, due to the inclusion of the inflow variable, it is necessary to multiply the denominator by 2 to ensure the equal weight of both variables (normalization).
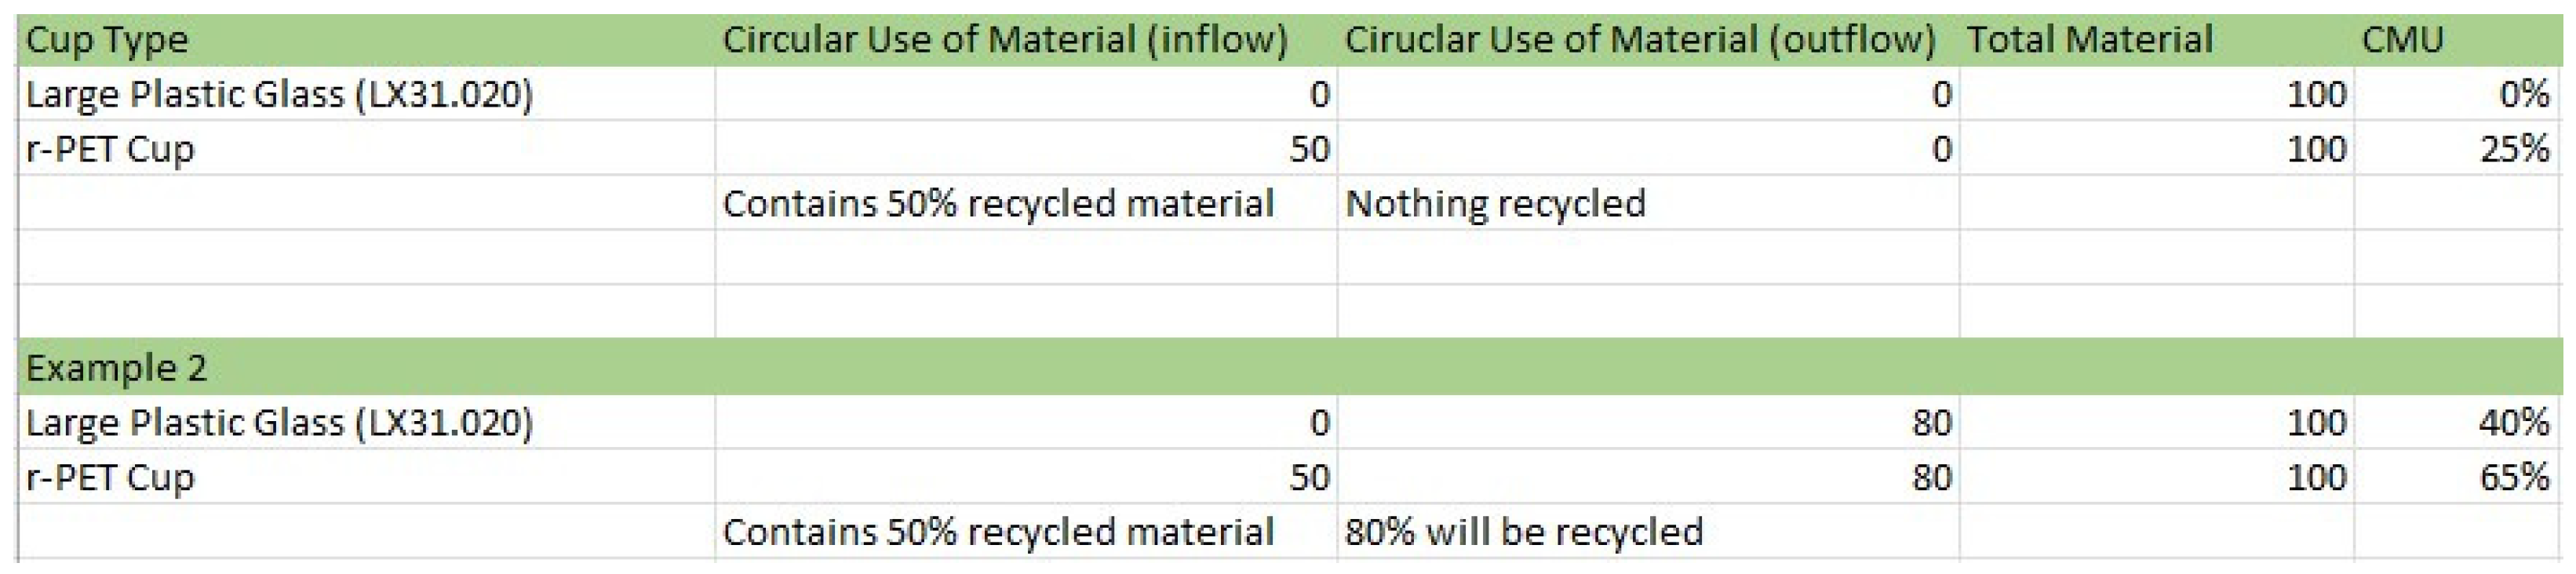
5.4. Testing
Having extended the equation to include the procurement decision, we tested it on the example of cups, as displayed below (
Figure 11).
Two examples are given in the table above:
Circular Inflow (procurement): 100 kg of cups contains 50 kg of recycling material;
Circular Outflow: 80 kg of this 100 kg is recycled after being declared as waste;
Total Material: 2 × 100 kg;
CMU Extended: (50 kg + 80 kg)/2 × 100 kg = 0.65.
This example illustrates that the devised CMU Extended formula effectively incorporates the procurement decision while retaining the benefits associated with the original CMU approach. Below, we present a table outlining the advantages and disadvantages, now supplemented with new insights stemming from a variation of the equation (
Figure 12).
Additional advantages gained through the extension of the model are highlighted in italics. On the disadvantages side, we can eliminate one main point, that the approach does not reflect procurement decisions and thus solve a major problem in the literature and industry: finding an indicator which addresses the system boundaries of procurement-to-waste with reasonable effort.
5.5. Research Limitations and Next Steps
We propose the utilization of the CMU Extended as an initial framework for measuring circularity within organizations aiming to address the procurement-to-waste boundaries. To address the aforementioned disadvantages, we recommend not further extending the equation, but rather integrating additional variables separately and correlating them with the CMU Extended indicator:
1. Introduce a metric demonstrating the economic costs associated with the decision-making process, such as varying procurement costs and disposal costs per material unit (and destination in the case of the airline industry).
2. Contextualize the CMU Extended within the framework of CO2 emissions, focusing on a product or material basis in accordance with current CO2 emissions reporting.
3. Relate the CMU Extended to CO2 emissions resulting from the weight per cup per kilometer flown (only for the case of the aviation industry and in-flight products).
Such comparative analyses, presented perhaps in the form of a matrix, could facilitate informed decision-making at the level of each flight. In the case of the aviation industry, such an approach might result in instances where SWISS selects cups made from less expensive non-recyclable materials for certain destinations where landfill disposal is the predominant outflow. Conversely, for other destinations exhibiting a high recycling rate in the waste stream, SWISS may opt for a more costly alternative. Through this strategy, overall circularity could be enhanced without incurring additional costs or CO2 emissions on the level of kilometers flown per cup, as SWISS optimizes the performance of all flights within the specified categories. Material flow and life cycle assessment (LCA) categories could be incorporated into this matrix where available, potentially integrating them into the existing IT infrastructure. The entire model or matrix may undergo testing with various products and product categories and subsequently be implemented across the company.
6. Conclusions
This study addresses a critical gap in circular economy measurement tools and the literature, particularly regarding procurement-to-waste system boundaries—a challenge faced by companies managing diverse product portfolios, such as SWISS International Air Lines Ltd., with over 200 inflight products, ranging from the cups investigated in this study to blankets, cotton towels, and single-use cutlery. Our analysis revealed that most existing tools require extensive supply chain data, which are typically unavailable or unverifiable due to the absence of standardized reporting akin to ISO standards. Additionally, life cycle assessment (LCA) methods, while valuable for environmental impact assessments, are not tailored to measuring circularity and are impractical for application across numerous products.
A systematic review of over 140 academic papers revealed that few studies have addressed procurement-specific challenges, and none have considered the specific system boundaries from procurement to waste. Parchomenko et al. (2019) [
5] conducted a comprehensive review of circularity metrics, but did not present any procurement-focused approaches. The metrics proposed by Bai et al. (2022) [
24], whilst addressing procurement, were found to be overly complex for practical applications, while Atkin and Gergin (2016) [
25] relied on questionnaire-based methods with credibility concerns. Approaches like that of Sheu et al. (2005) [
26] are tailored to different sectors, and waste-focused metrics, such as the Circular Material Use rate (CMU) (Eurostat, 2018) [
28], do not account for the entire procurement-to-waste cycle.
Our market analysis of ten circular economy tools mirrored these findings. Only four tools passed initial screening, including the Circular Transition Indicators (CTI), Circulytics, and the MCI tool, but these also proved unsuitable for practical applications due to their cost, complexity, and reliance on inaccessible data. Discussions with key stakeholders, including CTI representatives, the Ellen MacArthur Foundation, and the CEO of MCI, confirmed the lack of tools addressing the identified gaps, where the company simply has very limited control over the supply chain and thus no data on it.
Building on these findings, we revisited the Circular Material Use rate (CMU), which is widely recognized in Switzerland and the EU. We successfully adapted this macro-level metric for use at the company and product levels, resulting in the development of the CMU Extended formula:
This refined metric incorporates procurement (circular inflow) and waste treatment (circular outflow), leveraging data already available within companies in a similar situation to SWISS. Initial testing demonstrated the formula’s applicability and robustness, providing actionable insights for managing circularity across diverse product portfolios without reliance on external supply chain data.
6.1. Key Insights and Implications
This study highlights the absence of practical, procurement-to-waste circularity metrics in the existing literature and tools. The CMU Extended formula bridges this gap by offering a scalable, company-focused metric that relies on internal data, bypassing the challenges of external data collection and verification. Its application has the potential to harmonize circularity assessments across industries, enabling businesses to make informed, standardized decisions about circularity performance.
6.2. Future Research Directions
Future studies should test the CMU Extended formula across various sectors and enterprise sizes to evaluate its adaptability and scalability. Additionally, research should explore the integration of this metric with existing frameworks, such as life cycle assessment (LCA) and key performance indicators (KPIs), to assess its impact on strategic decision-making. These efforts could contribute to the development of standardized circularity metrics, comparable to ISO frameworks in quality management, thereby fostering broader adoption and advancing the circular economy agenda globally.


