
Evaluation of the Regional Livestock High Quality Development in China Based on Spatial–Temporal Heterogeneity

Abstract
1. Introduction
2. Material and Methods
2.1. Research Methods
2.1.1. Entropy Method
- (1)
- Set up the original data matrix. A = . The xij is the original data of the j index in the i year.
- (2)
- Dimensionless processing. It is necessary to standardize the original data due to the attribute difference in the indicators in LHIQUD. The extreme value method, which is widely used, is adopted in this study. Specific steps are shown below.
- (3)
- Set up the normalized matrix
- (4)
- Evaluate the entropy value of the j index
- (5)
- Evaluate the information entropy redundancy of j index
- (6)
- Evaluate the weight
- (7)
- Evaluate the overall score
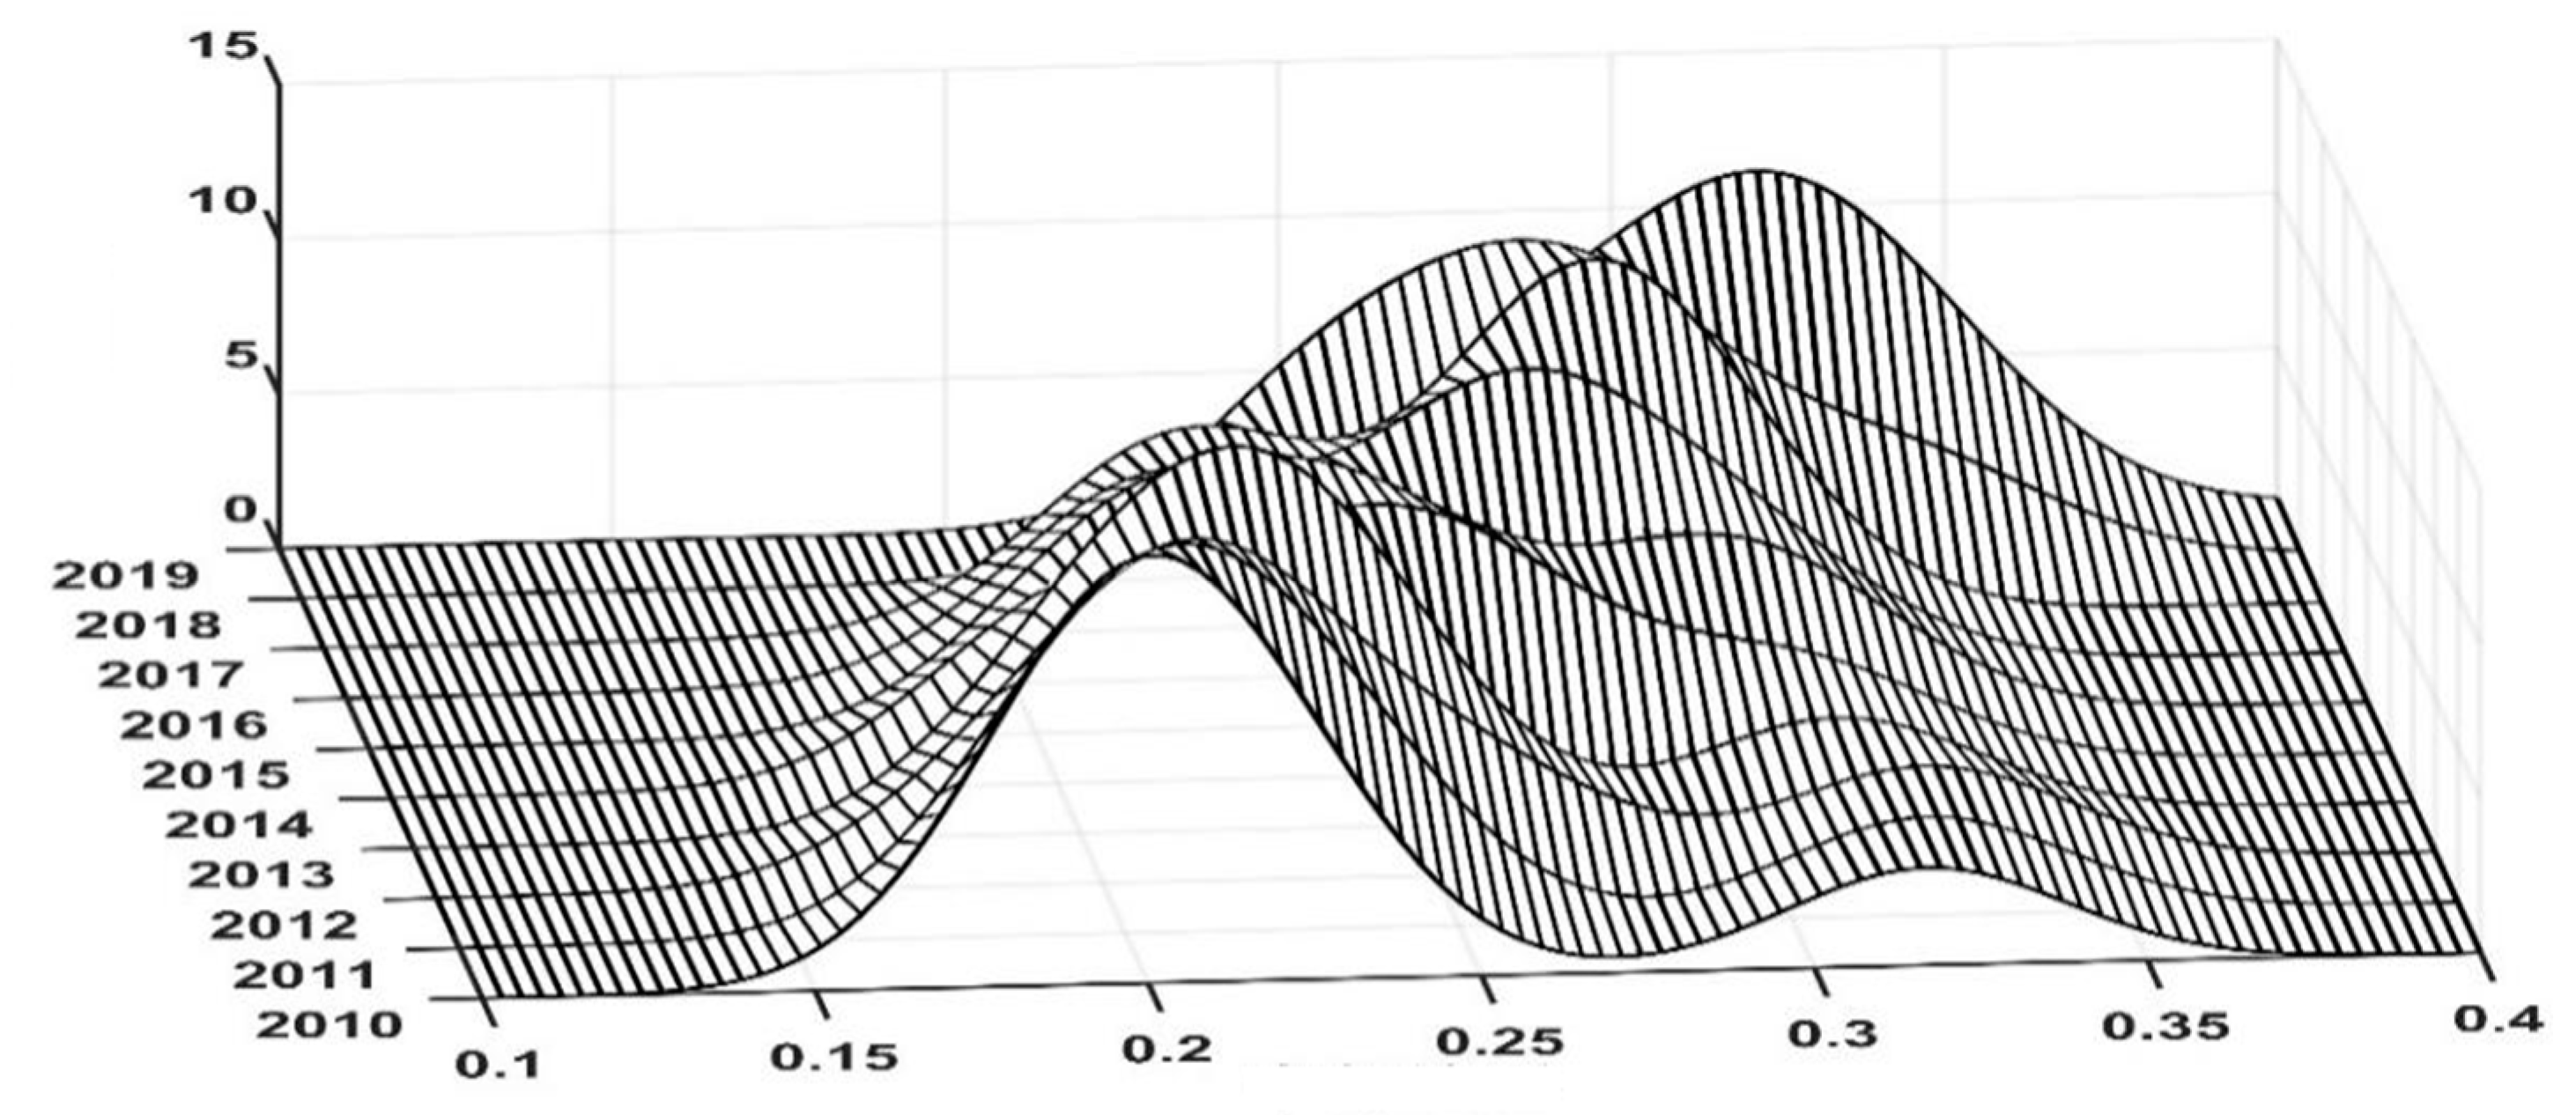
2.1.2. Kernel Density Estimation Method
2.1.3. Exploratory Spatial Data Analysis Method (ESDA)
2.2. Evaluation System
2.2.1. Connotation of LHIQUD
2.2.2. Evaluation System of LHIQUD
- (1)
- , refers to the coordination degree of grain and animal production. i represents the provincial or annual level, refers to the grain surplus and is the grain quantity used in the production of meat and eggs. Here , is the total grain output and represents the grain amount used. As shown in formula, , and are the annual grain amount used by the urban or rural residents per capita. and are the total urban or rural population. , in the formula, is the product of meat and eggs as a whole, is the grain discount coefficients (the grains consumed per kilogram of the meat and eggs). The Chinese Academy of Agricultural Science’s proposed ratio of meat to grain is employed as the grain conversion coefficient.
- (2)
- , E represents carbon emissions, represents the carbon emission coefficients of beef, milk, pork and egg, respectively. [29], [30], [31], [32], is the output of beef, milk, pork and egg, respectively. Carbon emissions of 10 thousand yuan added value of livestock equal to total carbon emissions/added value of livestock.
2.3. Data
3. Results
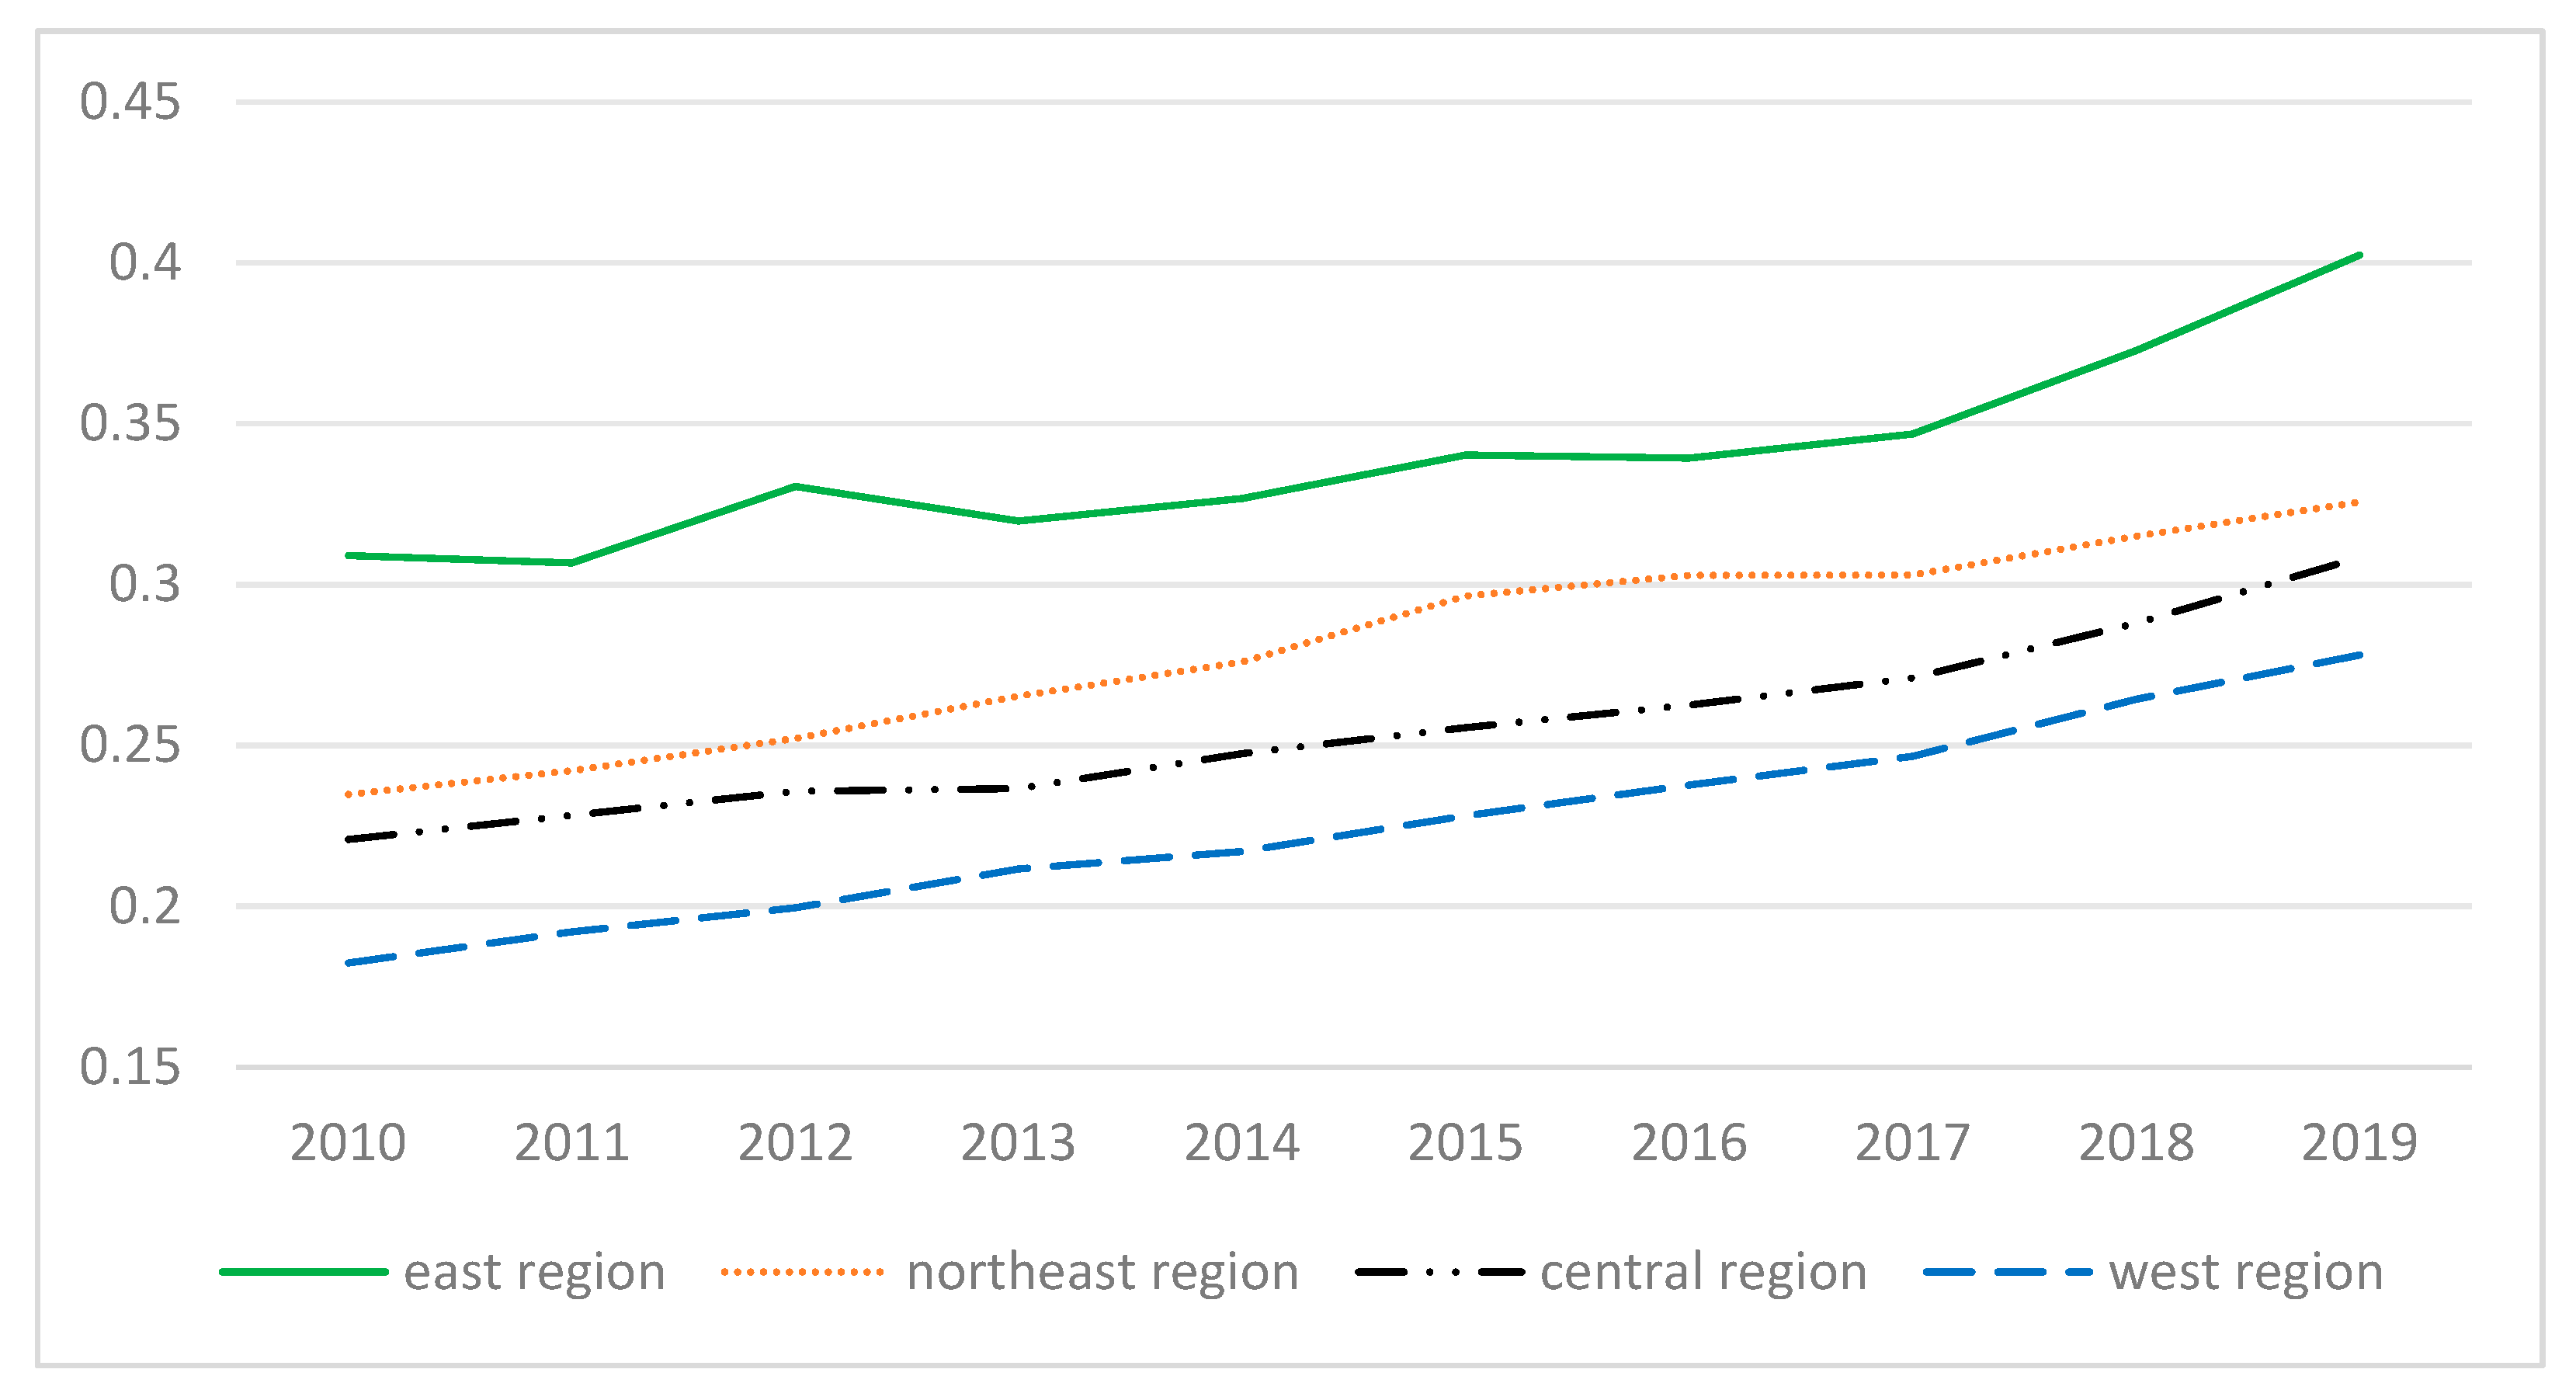
3.1. Time Dimension Analysis and Dynamic Evolution of LHIQUD
3.1.1. Time Dimension Analysis
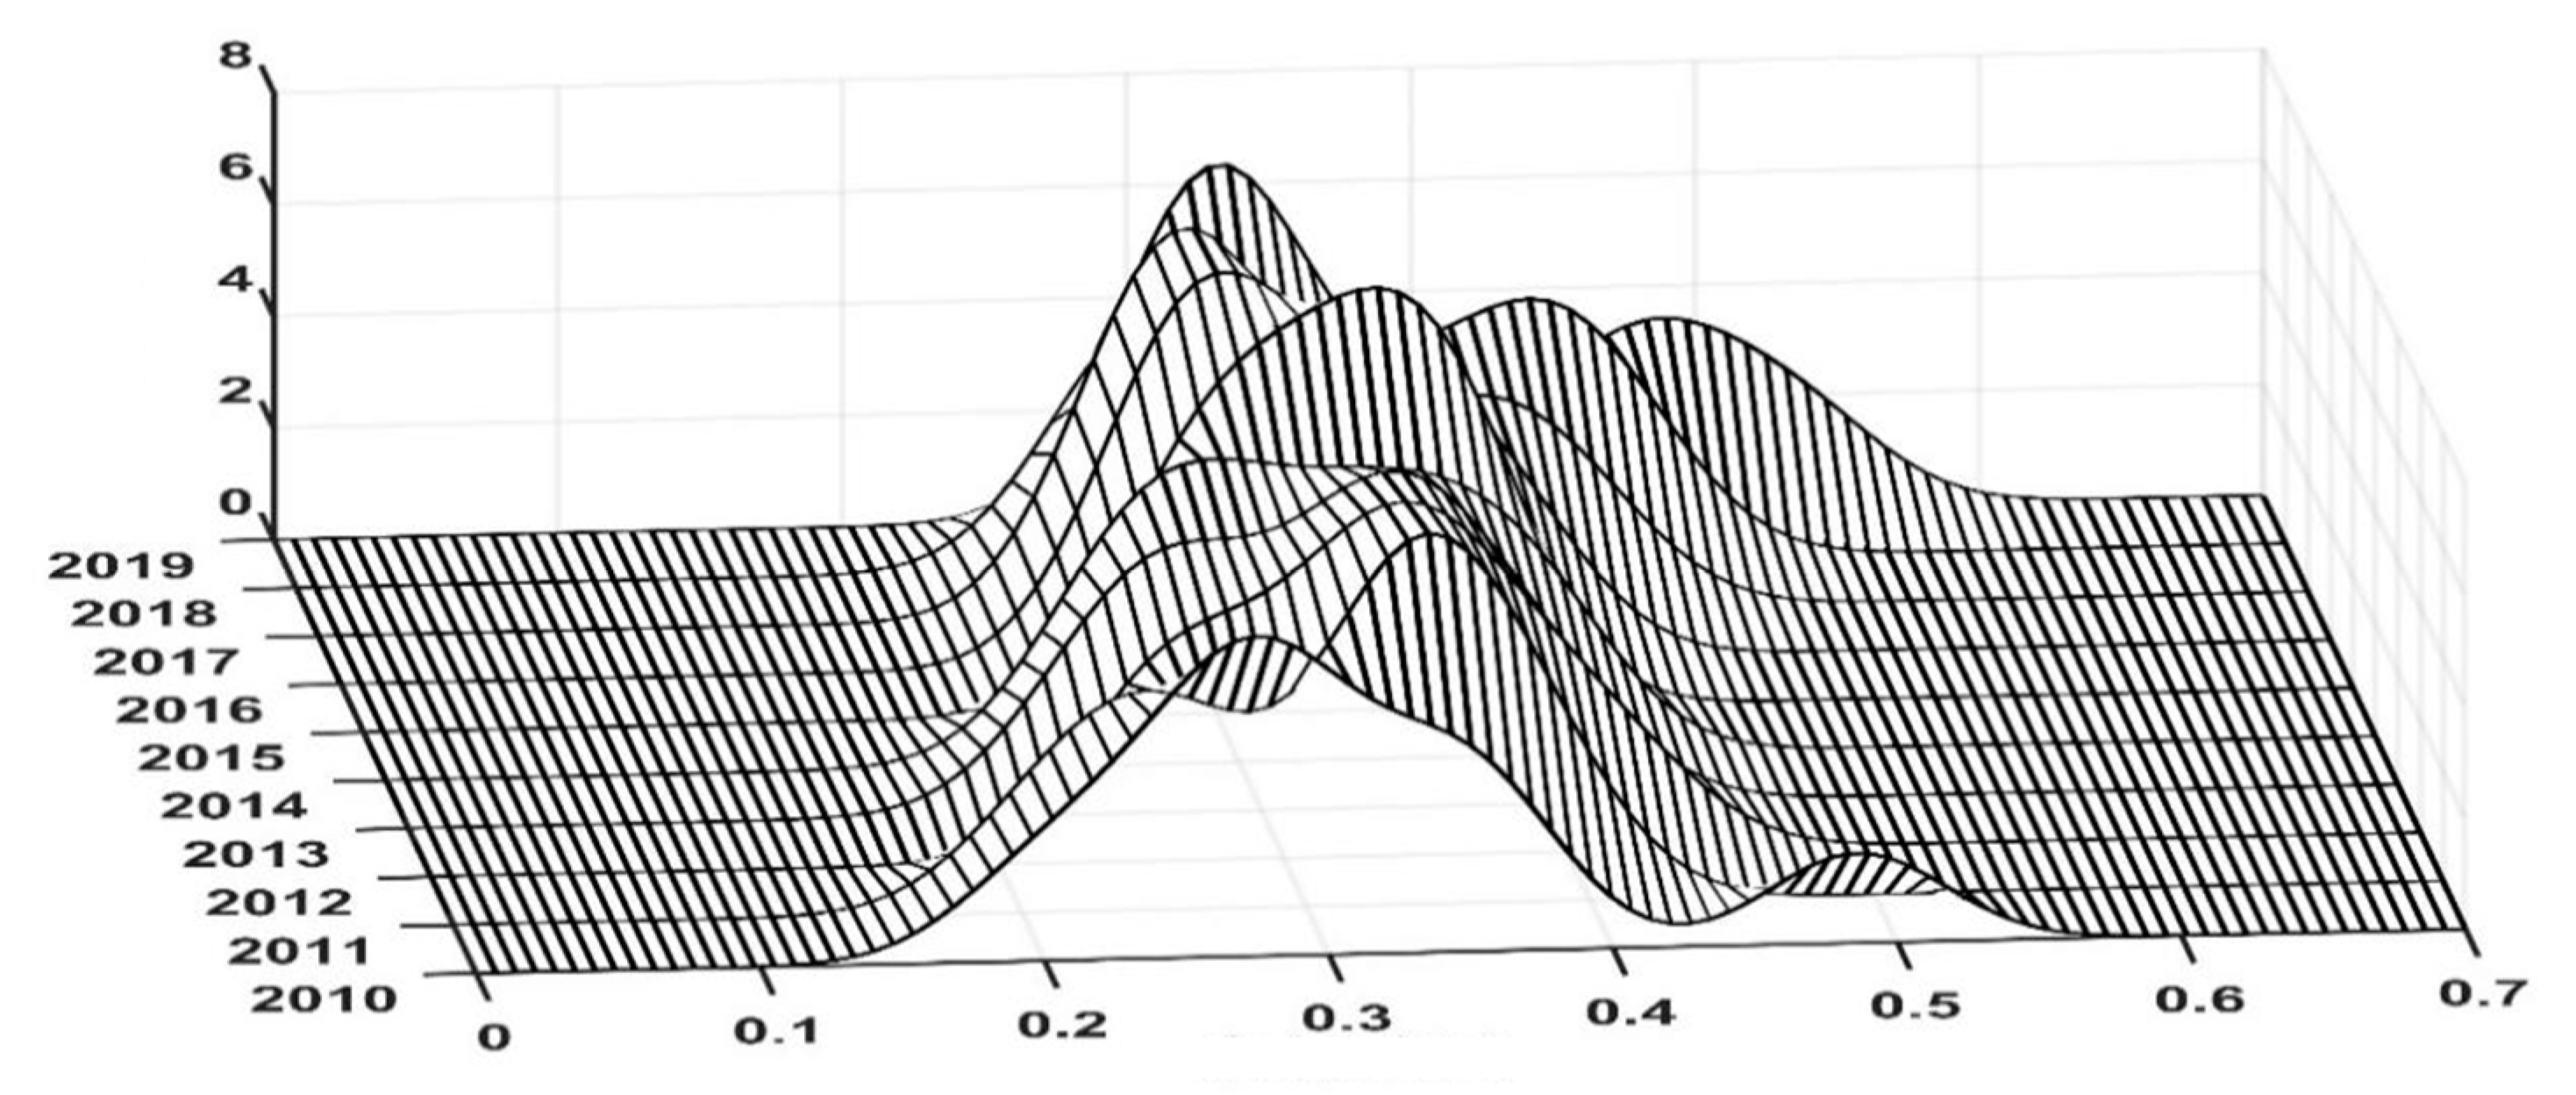
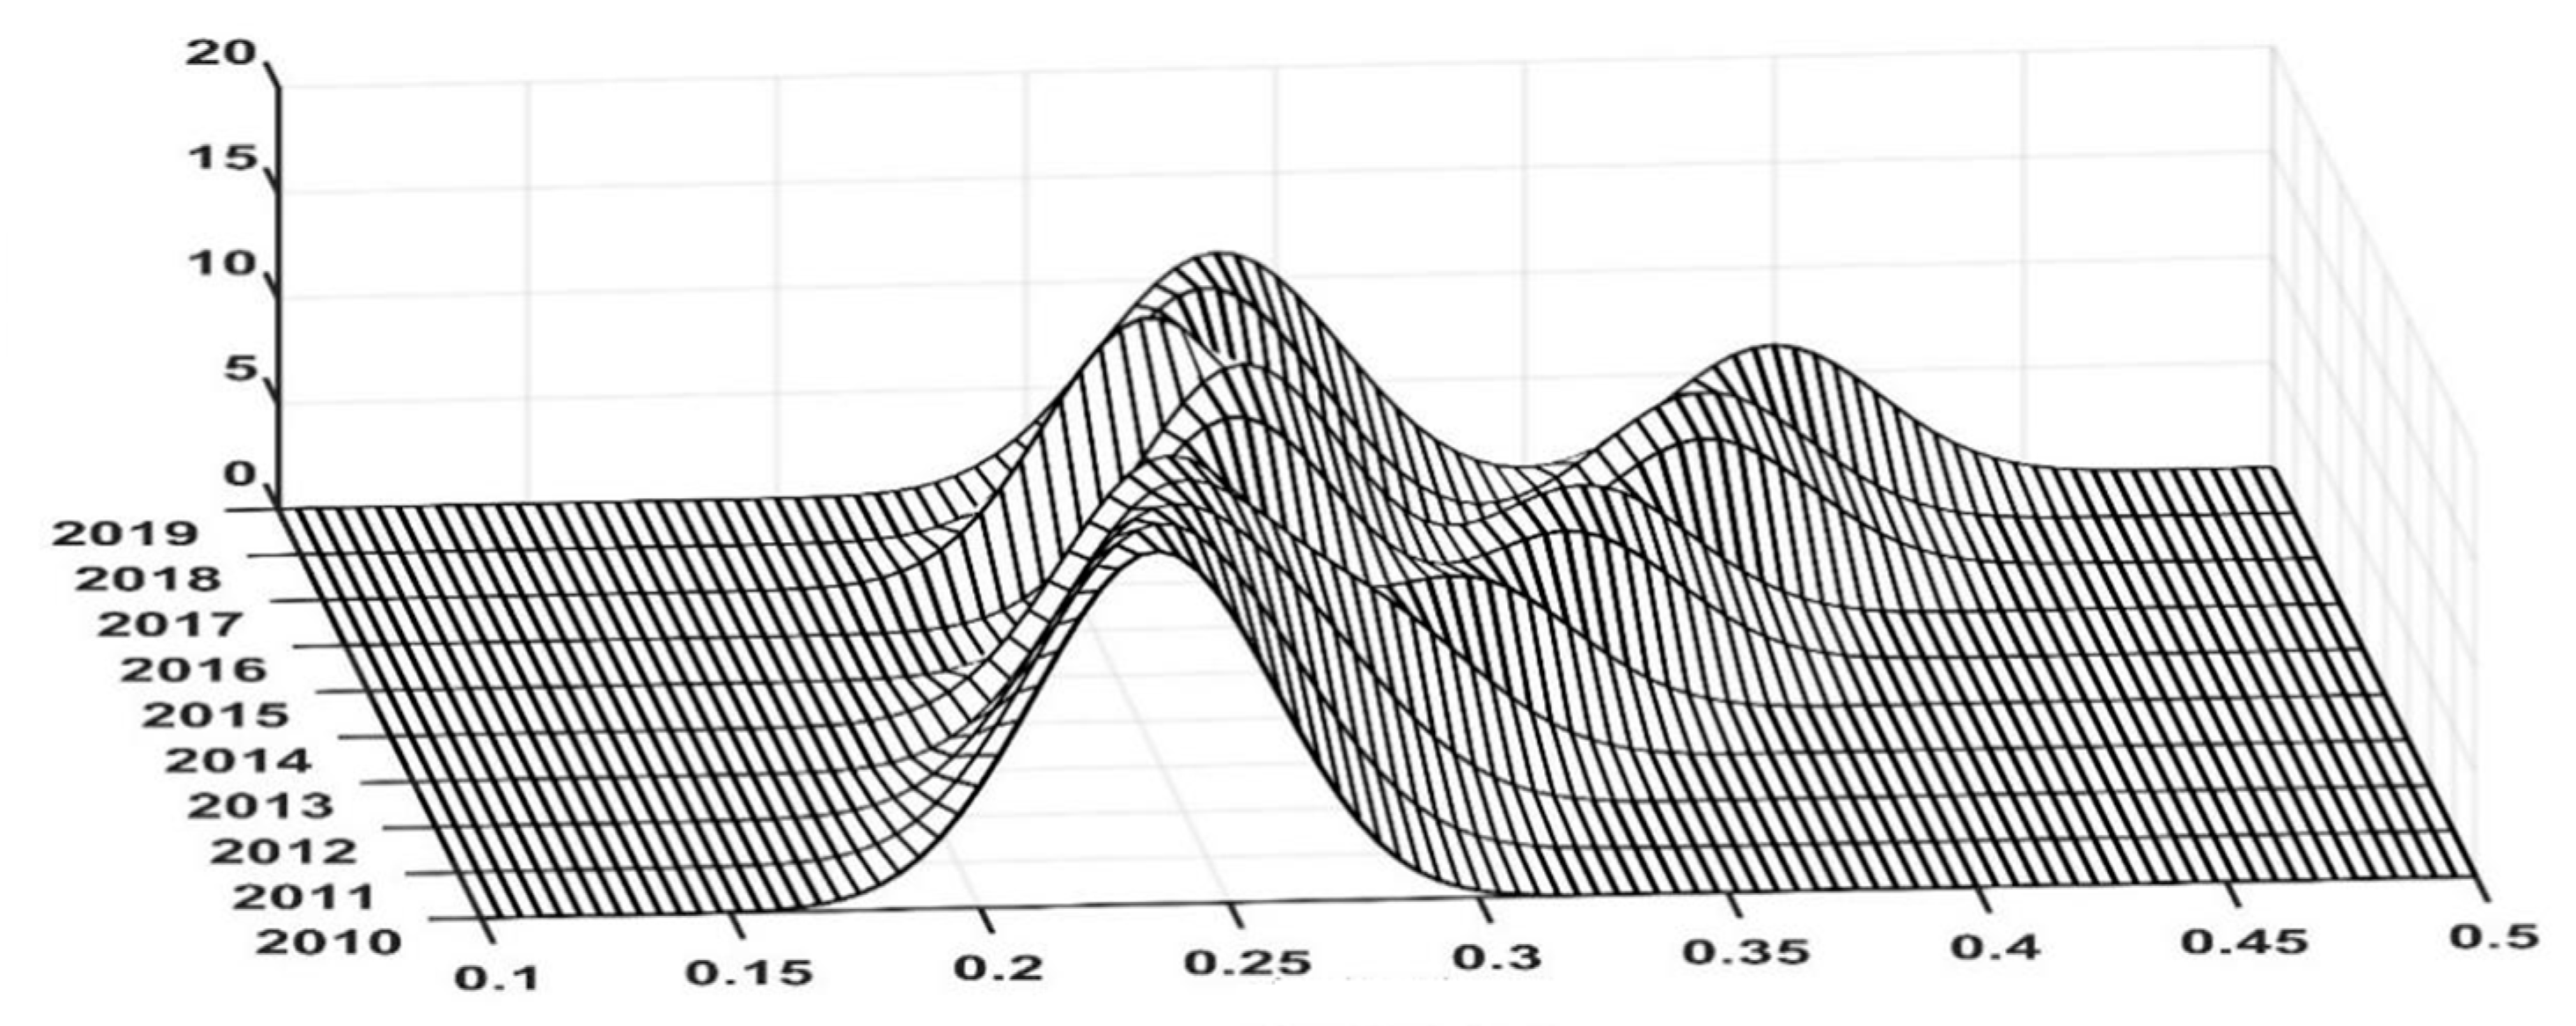
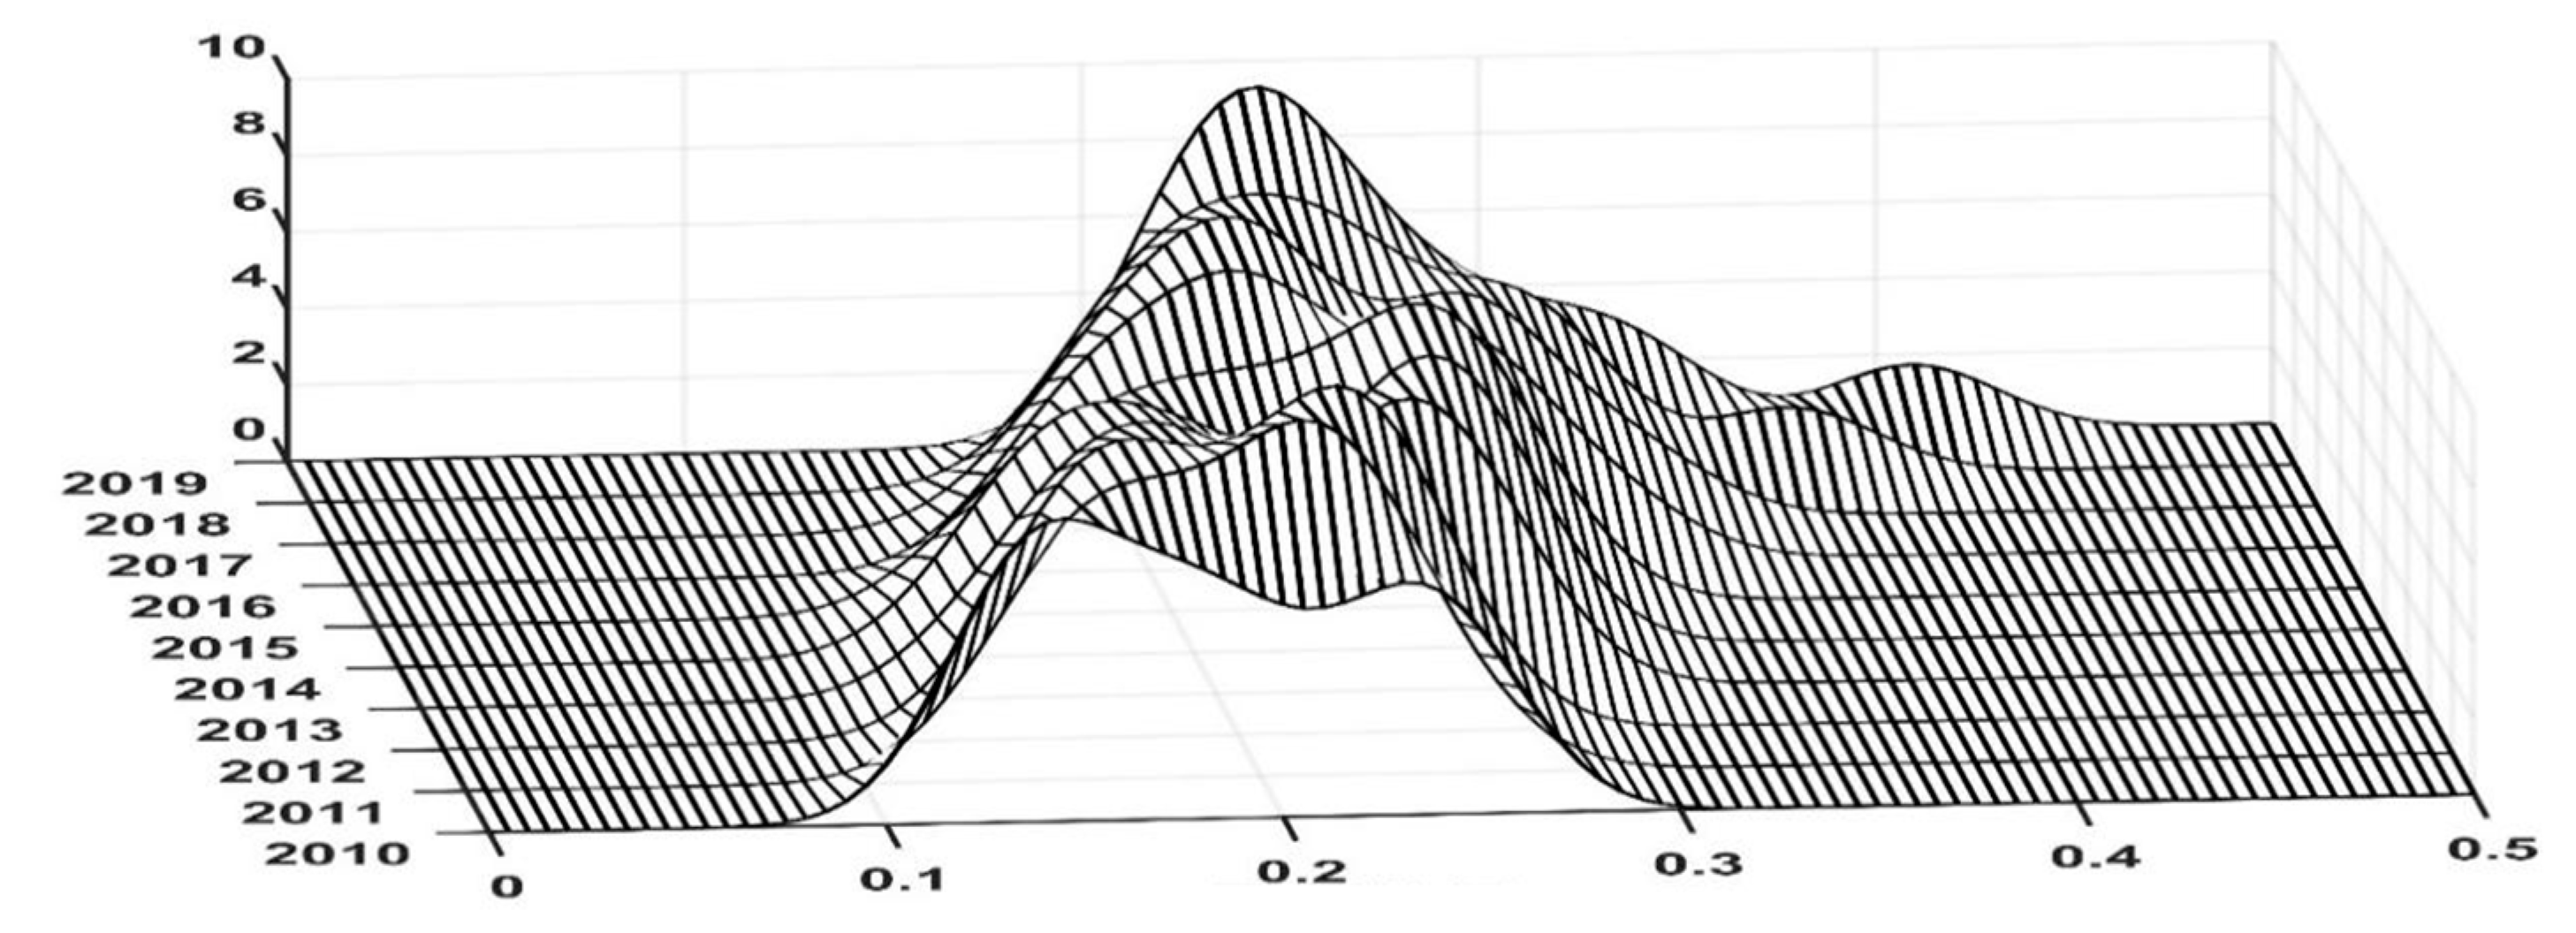
3.1.2. Dynamic Evolution
3.2. Spatial Dimensional Analysis and Auto-Correlation Analysis of the LHIQUD
3.2.1. Spatial Dimensional Analysis
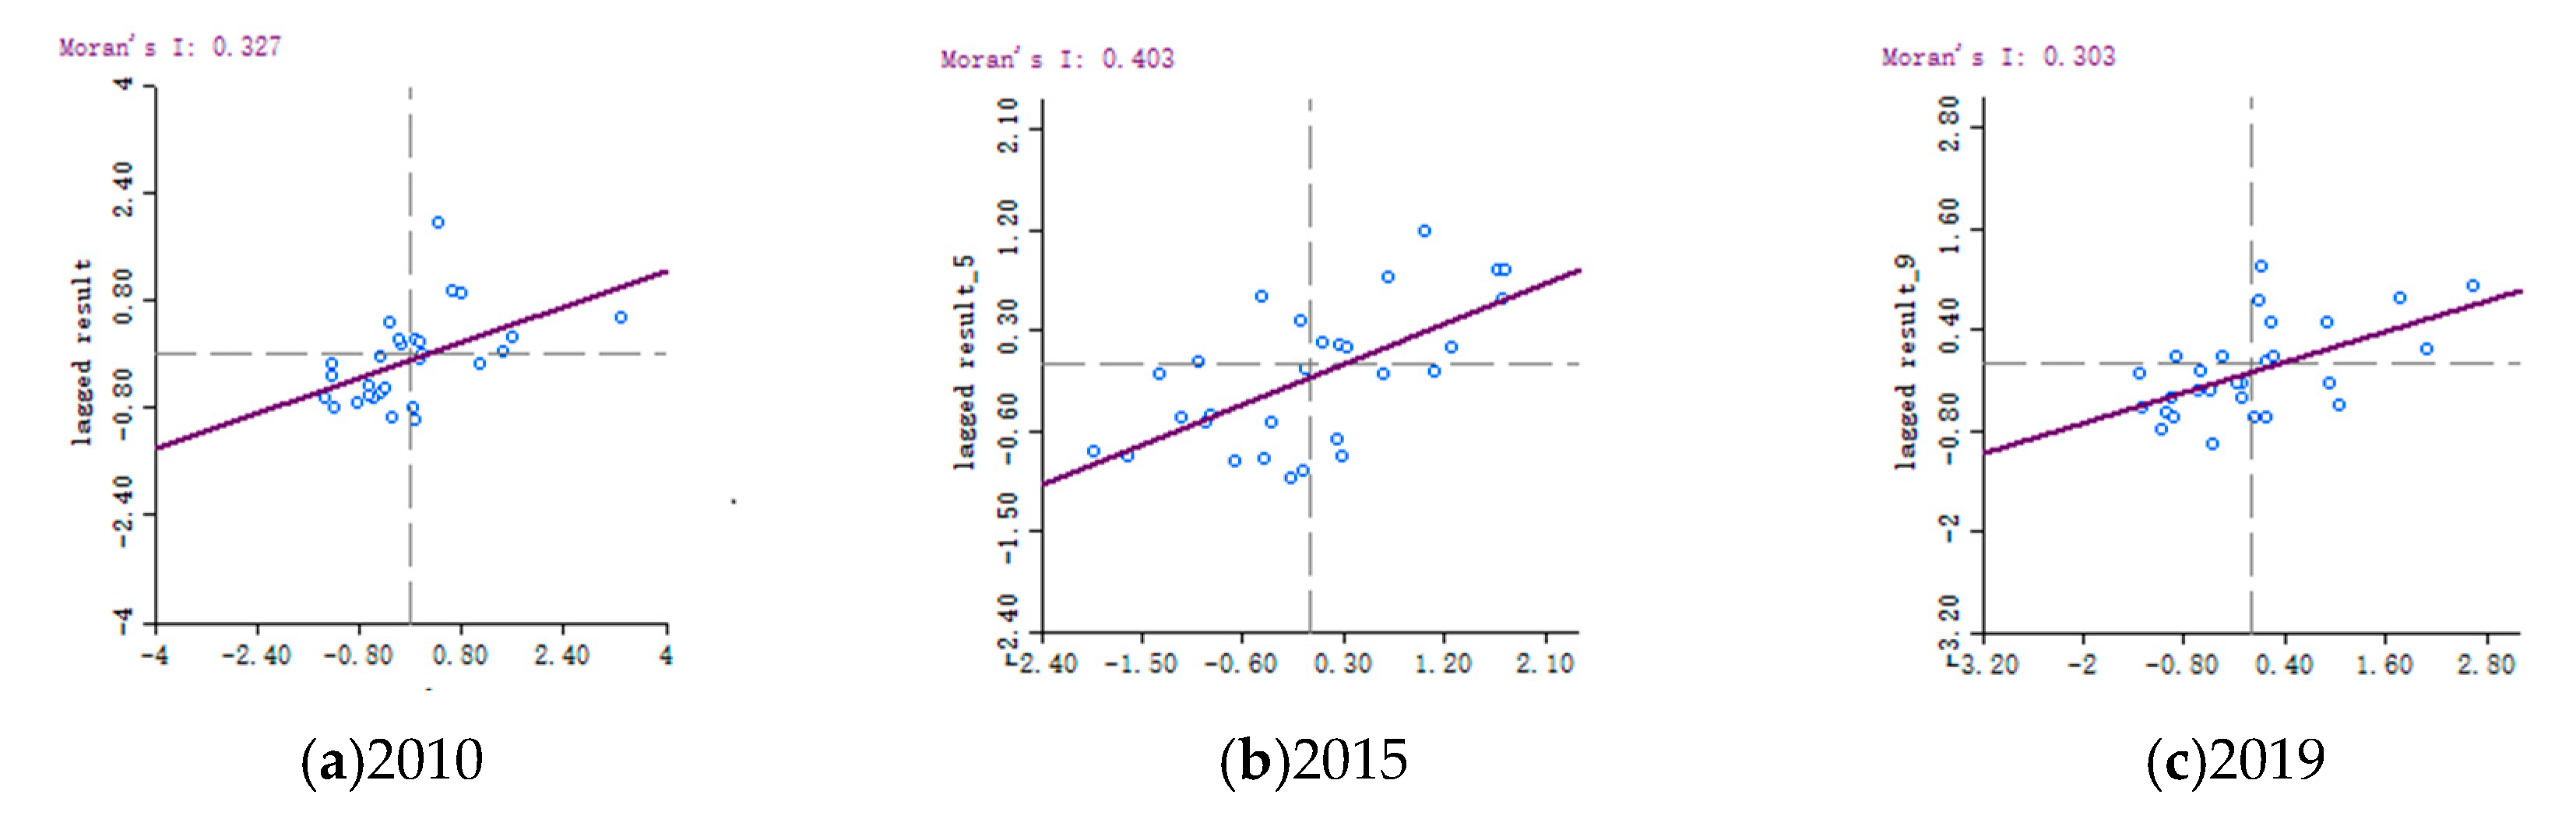
3.2.2. Spatial Auto-Correlation Analysis of the LHIQUD
- (1)
- Global auto-correlation analysis of the LHIQUD
- (2)
- Local auto-correlation analysis of LHIQUD
4. Discussion
5. Conclusions and Suggestions
5.1. Conclusions
5.2. Suggestions
Author Contributions
Funding
Data Availability Statement
Acknowledgments
Conflicts of Interest
References
- Wang, K.; Li, X.; Lu, J.; Zhou, B.; He, Y. Low-carbon development path of livestock under carbon medium and target. Trans. Chin. Soc. Agric. Eng. 2022, 38, 230–238. [Google Scholar]
- Gu, X.; Du, H. Policy logic and realization path of resource utilization of livestock and poultry manure. Agric. Mod. Res. 2020, 41, 772–782. [Google Scholar]
- Liu, G.; Luo, Q.F.; Zhang, L.X. 40th anniversary of livestock reform and opening up: Achievements, challenges and countermeasures. Chin. Rural Econ. 2018, 12, 19–36. [Google Scholar]
- Wei, M.; Li, S.H. Measurement research on the level of high-quality development of Chinese economy in the new era. Quant. Econ. Tech. Econ. Res. 2018, 35, 3–20. [Google Scholar]
- Shi, B.; Ren, B. Measurement and analysis of high quality development of China’s inter-provincial economy. Econ. Probl. 2018, 04, 1–6. [Google Scholar]
- Wang, F.; Shi, X. The measurement and influencing factors of the high quality development level of China’s manufacturing industry. China Soft Sci. 2022, 02, 22–31. [Google Scholar]
- Huang, S.C.; Zhang, S.Q. Review on the evaluation index system of high-quality development of manufacturing industry in China. Stat. Decis. 2021, 37, 5–9. [Google Scholar]
- Zhang, L.; Luo, B.L. High-quality development of agriculture in China: Essential Regulation and Strategic Choice. Tianjin Soc. Sci. 2020, 05, 84–92. [Google Scholar]
- Zhong, Y. Agricultural development orientation towards high-quality development stage. Mid-State J. 2018, 05, 40–44. [Google Scholar]
- Zhang, W.F. Adhere to the goal of high-quality development to accelerate the construction of food industry power. People’s Forum 2018, 25, 6–9. [Google Scholar]
- Gao, X.; Yin, C.J. Research on measurement and evaluation of high quality development level of Chinese agriculture under new development concept. Agric. Resour. Reg. China 2022, 3, 1–9. [Google Scholar]
- Chen, L.W. Thoughts on Accelerating the high quality development of livestock in Zhejiang. New Ctry. 2020, 2, 5–7. [Google Scholar]
- Xiong, X.Z.; Xiong, H.; Ma, X.P.; Yang, C. Spatial difference and dynamic evolution of high quality development level of livestock in China. Agric. Resour. Reg. China 2022, 43, 1–14. [Google Scholar]
- Wang, M.L.; Li, P.C.; Ma, X.P. The impact of scale selection on LHIQUD of livestock and its path optimization: Based on the perspective of scale of pig breeding. China’s Rural Econ. 2022, 3, 12–35. [Google Scholar]
- Yu, F.W.; Huang, X.; Wang, G.L. High quality development of livestock:Theoretical interpretation and realization path. China’s Rural Econ. 2021, 4, 85–99. [Google Scholar]
- Xin, L.; An, X.N. Construction and measurement analysis of China’s agricultural high-quality development evaluation system. Econ. Vert. Horiz. 2019, 5, 109–118. [Google Scholar]
- Li, X.W.; Xu, S.B. Research on measurement and spatial distribution characteristics of high quality agricultural development level based on new development concept. Jiangxi Univ. Financ. Econ. 2020, 6, 78–94. [Google Scholar]
- Lu, H.G.; Zheng, J.X.; Wei, Z. Evaluation of high quality development level of animal husbandry in Hubei Province and its coupling coordination: From the perspective of industry chain. Chin. J. Agric. Resour. Reg. 2002, 43, 251–261. [Google Scholar]
- Gu, H.B.; Wu, C. Evaluation of high-quality agricultural development in six provinces in central China. Yunnan Agric. Univ. (Soc. Sci.) 2019, 13, 74–82. [Google Scholar]
- Khandi, S.A.; Mandal, G.M.K.; Hamdani, S.A. Knowledge level of Gujjars about modern animal husbandry practices. Environ. Ecol. 2010, 28, 1257–1260. [Google Scholar]
- Terry, C. Livestock and animal husbandry in early Medieval England. Quat. Int. 2014, 346, 109–118. [Google Scholar]
- Wen, M.; Yong, H. Research on the status quo, challenges and countermeasures of high-quality development of animal husbandry in Inner Mongolia. Inn. Mong. Soc. Sci. 2022, 43, 205–213. [Google Scholar]
- Xing, K. Economic High-quality development research based on tax cut and fee reduction. Financ. Mark. 2020, 5, 22. [Google Scholar] [CrossRef]
- Herrero, M. The roles of livestock in developing countries. Animal 2013, 7, 3–18. [Google Scholar] [CrossRef]
- Song, Y.P.; Fan, X.Q.; Zheng, H. Technical optimization of high-quality development of animal husbandry in China. Huazhong Agric. Univ. (Nat. Sci. Ed.) 2022, 3, 87–95. [Google Scholar]
- General Office of the State Council. Opinions on Promoting High-Quality Development of Livestock. 2020. Available online: https://baijiahao.baidu.com/s?id=1679008698896133724&wfr=spider&for=pc (accessed on 3 February 2024).
- Central Government of the People’s Republic of China. China Central Document No.1. 2021. Available online: http://www.moa.gov.cn/ztzl/jj2021zyyhwj/xcbd_26481/202102/t20210222_6361874.htm?ivk_sa=1024320u (accessed on 22 February 2021).
- Central Government of the People’s Republic of China. China Central Document No.1. 2024. Available online: https://baijiahao.baidu.com/s?id=1789880649512727090&wfr=spider&for=pc (accessed on 3 February 2024).
- Tubiello, F.N.; Salvatore, M.; Rossi, S.; Ferrara, A.; Fitton, N.; Smith, P. The Faostat database of greenhouse gas emissions from agriculture. Environ. Res. Lett. 2013, 1, 015009. [Google Scholar] [CrossRef]
- Lang, H.; Xiao, S.S.; Wang, Y. Analysis of decoupling effect between agricultural carbon emission and economic growth in Sichuan Province. Shandong Agric. Univ. (Soc. Sci. Ed.) 2019, 2, 69–78+158. [Google Scholar]
- Fu, Y.; Wang, L.H.; Cai, X. Embodied technological progress of agricultural capital and its influencing factors: Empirical evidence from Jilin Province. Contemp. Econ. Stud. 2013, 8, 65–69. [Google Scholar]
- Ma, Z.H.; Wang, M.Z.; Wen, L. Life cycle assessment of greenhouse gas emissions from large-scale beef cattle breeding farms. Agro-Environ. Sci. 2010, 29, 2244–2252. [Google Scholar]
- Wang, G.G.; Yang, C.; Wang, M.L. Measurement of development level and regional differentiation of modern livestock in China. Huazhong Agric. Univ. (Soc. Sci. Ed.) 2018, 6, 7–13+150–151. [Google Scholar]


| Level 1 | Level II | Specific Calculation Method | Indicator Attributes |
|---|---|---|---|
| Quality and efficiency improvement | Livestock labor productivity | Output value of livestock/employed persons | + |
| Livestock added value per unit of water | Livestock added value/livestock water consumption | + | |
| Growth rate of livestock | (Current livestock product output - previous output)/previous output | + | |
| Improvement of livestock stations per thousand pigs, cattle and sheep | Number of improved stations/Number of pigs, cattle and sheep | + | |
| Green livestock certificates | Number of green food certificates ×proportion of livestock products | + | |
| Coordination and sharing | Coordination degree of grain and livestock production | Shown in Indicator interpretation (1) | - |
| Share of achievements of livestock | [(Added value of livestock/local GDP)× disposable income ratio of rural-urban residents]1/2 | + | |
| Meat Product Diversity Index | (Meat production-pork production)/Meat production | + | |
| Ratio of total output value of livestock to agriculture | Total output value of livestock/total output value of agriculture | + | |
| Green development | Waste water discharge of 10,000 yuan livestock added value | Livestock wastewater discharge/livestock added value | - |
| Biogas output of 10,000 yuan added value of livestock | Biogas production/value added of livestock | + | |
| Carbon emissions per 10,000 yuan of livestock added value | Shown in indicator explanation (2) | - | |
| Innovation and development | Livestock machinery total power per labor | Total power of livestock machinery/employees | + |
| Number of computers per hundred households in rural areas | Statistical yearbook data | + | |
| Percentage of graduates in livestock stations | Graduate students in livestock station/workers in livestock station | + |
| Type | High Level | Medium-High Level | Medium-Low Level | Low Level |
|---|---|---|---|---|
| Sample regions | Beijing, Tianjin, Hebei, Jiangsu, Zhejiang, Shandong, Shanxi, Heilongjiang | Guangdong, Inner Mongolia, Liaoning, Fujian, Henan, Chongqing, Sichuan | Jilin, Anhui, Hubei, Hunan, Guizhou, Xinjiang, Ningxia | Jiangxi, Guangxi, Yunnan, Shaanxi, Gansu, Qinghai |
| Year | 2010 | 2011 | 2012 | 2014 | 2015 | 2016 | 2017 | 2018 | 2019 |
|---|---|---|---|---|---|---|---|---|---|
| Moran index | 0.327 | 0.458 | 0.478 | 0.421 | 0.403 | 0.367 | 0.365 | 0.347 | 0.303 |
| Z price | 3.242 | 3.876 | 4.015 | 3.683 | 3.490 | 3.313 | 3.238 | 3.165 | 3.093 |
| P price | 0.002 | 0.001 | 0.001 | 0.001 | 0.001 | 0.003 | 0.002 | 0.003 | 0.003 |
| Year | H-H | L-L | H-L | L-H |
|---|---|---|---|---|
| 2010 | Beijing, Tianjin, Hebei and Jiangsu | Guangxi, Guizhou, Yunnan, Hubei, China In Hunan, Sichuan, and Xinjiang | ||
| 2011 | Beijing, Tianjin, Hebei and Jiangsu | Guangxi, Guizhou, Yunnan, Hubei, China Hunan, Sichuan and Gansu | Anhui | |
| 2012 | Beijing, Tianjin, Hebei and Jiangsu | Guangxi, Guizhou, Yunnan, Hubei, Hunan, Sichuan, Chongqing, Xinjiang | Anhui | |
| 2013 | Beijing, Hebei, Jiangsu and Shandong | Guangxi, Guizhou, Yunnan, Hubei, Hunan, Sichuan, Chongqing, Guangdong, Xinjiang | Anhui | |
| 2014 | Beijing, Hebei, Jiangsu and Shandong | Guangxi, Guizhou, Yunnan, Hunan, etc. Guangdong, Sichuan, and Xinjiang | Chongqing | Anhui |
| 2015 | Beijing, Tianjin, Hebei and Jiangsu | Guangxi, Guizhou, Yunnan, Hunan, etc. Sichuan, Xinjiang | Guangdong | Anhui |
| 2016 | Hebei, Shandong, and Jiangsu provinces | Sichuan, Yunnan, Guizhou, Guangxi, China Gansu, Xinjiang | Guangdong, Chongqing | Anhui |
| 2017 | Hebei, Shandong, Jiangsu and Anhui | Guangxi, Guizhou, Yunnan, Gansu and Xinjiang | Sichuan, Guangdong, Chongqing | |
| 2018 | Shandong, Jiangsu, Zhejiang and Anhui | Guangxi, Guizhou, Yunnan and Hunan | Sichuan, Guangdong, Chongqing | |
| 2019 | Beijing, Hebei, Jiangsu, Shandong, Jiangsu, Zhejiang, Anhui | Xinjiang, Gansu, Guangxi and Ningxia | Guangdong, Sichuan |
Disclaimer/Publisher’s Note: The statements, opinions and data contained in all publications are solely those of the individual author(s) and contributor(s) and not of MDPI and/or the editor(s). MDPI and/or the editor(s) disclaim responsibility for any injury to people or property resulting from any ideas, methods, instructions or products referred to in the content. |
© 2025 by the authors. Licensee MDPI, Basel, Switzerland. This article is an open access article distributed under the terms and conditions of the Creative Commons Attribution (CC BY) license (https://creativecommons.org/licenses/by/4.0/).
Share and Cite
Shi, S.; Guo, Y.; Liu, C.; Zang, F. Evaluation of the Regional Livestock High Quality Development in China Based on Spatial–Temporal Heterogeneity. Sustainability 2025, 17, 1290. https://doi.org/10.3390/su17031290
Shi S, Guo Y, Liu C, Zang F. Evaluation of the Regional Livestock High Quality Development in China Based on Spatial–Temporal Heterogeneity. Sustainability. 2025; 17(3):1290. https://doi.org/10.3390/su17031290
Chicago/Turabian StyleShi, Shuai, Yimeng Guo, Changyu Liu, and Faxia Zang. 2025. "Evaluation of the Regional Livestock High Quality Development in China Based on Spatial–Temporal Heterogeneity" Sustainability 17, no. 3: 1290. https://doi.org/10.3390/su17031290
APA StyleShi, S., Guo, Y., Liu, C., & Zang, F. (2025). Evaluation of the Regional Livestock High Quality Development in China Based on Spatial–Temporal Heterogeneity. Sustainability, 17(3), 1290. https://doi.org/10.3390/su17031290