1. Background
Ambitious climate change mitigation policies are on the one hand increasing the European Union (EU) demand for woody biomass while on the other potentially restricting the supply thereof. In particular, the amended EU’s Renewable Energy Directive (“RED III”) aims to increase the share of renewable energy in the EU’s overall energy consumption to 42.5% by 2030 [
1]. This is bound to further increase the use of wood for energy, as bioenergy currently contributes about 60% of renewable energy in the EU [
2], and around 60% of the biomass used for energy is wood-based [
3]. At the same time, the sustainability criteria concerning forest biomass harvesting are strengthened in RED III [
1], potentially restricting the supply of woody biomass.
Further, the EU’s updated Land Use, Land-Use Change, and Forestry (LULUCF) Regulation sets ambitious, binding national targets for the increase in net greenhouse gas (GHG) removals for the period 2026–2030, which together should deliver the collective EU target of 310 Mt CO
2 equivalent of net removals in the LULUCF sector in 2030 [
4]. For member states using their forests intensively, these carbon sink targets are likely to hinder an increase in fellings; rather, they will require lower levels of felling. As an example, for Sweden, with the highest requirements, the target for 2030 of the removal of 47.3 Mt CO
2 equivalent entails a nine percent increase compared to the average for the years 2016, 2017, and 2018 [
4]. Actually, at the overall-EU level, continuing past forest management practices is foreseen to further decrease the forest carbon sink [
5].
Additionally, the ongoing geopolitical crisis related to the Ukraine war has changed the conditions as regards both the availability of and the demand for woody biomass in the EU. The Council of the EU banned the import of most of the timber and timber products from Russia and Belarus covered by the EU Timber Regulation from entering the EU in 2022 [
6]; this, combined with, for obvious reasons, reduced exports from Ukraine, directly negatively affects the supply of woody biomass on the EU market. Before the war, Russia alone accounted for over 52% of extra-EU roundwood imports in 2019 [
7]. Further, elevated electricity prices within the EU—stemming from a rebound in economic activity after the COVID-19 pandemic as well as an increasing reliance on intermittent, weather-dependent energy sources [
8]—have been reinforced by sanctions on Russian hydrocarbons and the sabotage of the Nordstream natural gas pipelines. This situation is leading to a serious loss of competitiveness in energy-intensive industries relative to corresponding industries in regions with lower energy prices [
9], and it has already resulted in increased competition from energy uses for wood-based raw materials [
10].
Future impacts of the geopolitical crisis related to the war in Ukraine on international wood-product markets have been modelled, and models have also considered the EU’s LULUCF Regulation; these indicate higher global prices for roundwood and semi-finished wood products [
11]. The role of European forests in the EU climate policy context has been assessed in a quantitative sense, pointing to a development of the EU forest sink that is incompatible with the LULUCF target [
5]. Still other studies have undertaken a broader discussion of the degree to which different policy initiatives incentivize or disincentivize wood use, e.g., [
12,
13]. Still, an important knowledge gap exists as regards the question of what current and future policy (in-)coherences between the EU bioenergy and climate mitigation policy objectives related to the forest sector can be identified and why they occur.
By addressing this question, this paper adds to the scientific discussion by conducting an in-depth quantitative study of sources and uses—for material as well as energy purposes—of woody biomass in four European regions. Building on this, this paper provides a scenario analysis of the future wood availability in light of climate and energy policy and geopolitical developments. Notably, this paper provides an assessment of the coherence of the RED III and the LULUCF regulations based on fellings derived from reported and projected uses of wood for material and energy. To account for the substantial diversity of European regions in terms of population density, forest endowment, wood use [
14], and forest policy priorities [
15], results are presented and discussed for four European subregions of countries.
3. Material and Methods
The methodological approach used for collating and analyzing uses and sources of woody biomass is the one used by the European Commission Joint Research Centre (JRC) in deriving wood resource balance (WRB) sheets [
17]. The Wood resource balance (WRB) method, pioneered by Mantau (see, e.g., [
18]), is useful in providing an overview of sources and uses of woody biomass. In particular, the approach permits—by comparing reported sources of woody biomass with derived uses thereof—the detection of data irregularities. The sources of woody biomass are recorded on the left side of the main balance table. They are classified as primary sources (from forests and other wooded land), secondary sources (industrial by-products and residues, wood pellets, wood briquettes), and post-consumer wood. Both domestic production and net trade of these items are considered; however, for black liquor and post-consumer wood, only domestic production is considered. The right side of the main balance table shows the sectors where woody biomass is used: manufacturing of wood-based commodities and energy generation. All values are reported in a common measurement unit, cubic meters of solid wood equivalent, m
3SWE (the roundwood equivalent volume (green volume prior to any shrinkage) needed to produce the product in question).
The amounts of different types of woody biomass, primary sources (industrial roundwood and bark), and secondary sources (forest industry by-products and post-consumer wood) required for the manufacture of sawnwood (coniferous and non-coniferous), wood-based panels (veneer sheets, plywood, particle board, and fiberboard) and wood pulp (mechanical, chemical, semi-chemical, and dissolving) are derived from the Joint Forest Sector Questionnaire (JFSQ) data on the production of sawnwood, wood-based panels, and wood pulp, accessed through FAOSTAT [
19]. Thus, production data—converted to solid wood equivalents by multiplying the production value by the conversion factor for the country and product in question [
20]—are multiplied by input coefficients expressing the share of different woody biomass sources used in the manufacturing of a specific wood product [
18], specific for each country and product considered, to derive the amount of primary and secondary woody biomass used in the manufacturing of the wood product in question. For projection purposes, Gross Domestic Product (GDP) growth rates and GDP demand elasticities are applied to the JFSQ production data. Country- and product-specific GDP demand elasticities used in projections of the production of wood products are from the Global Forest Trade Model [
21], whereas GDP projections, which differ between EU member states and the non-EU countries (here Norway, Switzerland, and the UK), are from the Shell corporation [
22].
Domestic industrial by-products (solid and liquid), part of the secondary sources of woody biomass, are estimated from data on the production of sawnwood, wood-based panels, and wood pulp. Hence, production data, converted to solid wood equivalents using country- and sector-specific conversion factors [
20], are multiplied by country- and product-specific output coefficients [
20]. The volume of bark is derived from the sum of removals and net imports of industrial roundwood and fuelwood, respectively, by multiplying industrial roundwood and fuelwood volumes under bark by species-specific (coniferous and non-coniferous respectively) bark conversion factors [
23].
The 2019 Joint Wood Energy Enquiry (JWEE) [
24] is the main data source for the energy use of woody biomass, distinguishing between energy wood from direct (fuelwood), indirect (forest industry by-products and processed wood fuels), and unknown sources. The EU Reference Scenario 2020 [
25], through country-wise projections of biomass and waste, is the chief source for country projections of wood energy use. The JWEE provides data on the amounts of wood from direct (primary, under bark), indirect (secondary plus bark), and unknown sources.
For historic data, primary sources of woody biomass—removals (production) and trade of industrial roundwood and fuelwood—are obtained from the JFSQ, as are the trades of chips, particles, and other residues (net imports constitute a part of secondary sources of biomass), again accessed through FAOSTAT [
20]. Data on the productive function of forests are available from Eurostat European forest accounts [
26]. For projection and comparison (to reported removals) purposes, industrial roundwood (IRW) removals are derived from estimated uses of IRW for manufacturing of wood products—as detailed above—minus net imports of IRW, while fuelwood (FW) removals are estimated as direct wood uses for energy minus net imports of FW. Fellings are estimated from total removals (IRW + FW) as removals plus logging residues using information as to the relation between wood removals and fellings from Pilli et al. [
27].
Due to considerable uncertainties over time even in the midterm, a scenario analysis was chosen as the most appropriate approach for an outlook on the future use and availability of wood. Two main scenarios are set up, as different as possible in the quantitative sense so as to best span the whole set of feasible scenarios: (i) higher availability (HA), characterized by a lower future level of wood use and a higher level of roundwood imports, as compared to (ii) lower availability (LA), which considers a higher level of wood use, in particular for energy use so as to achieve the targets of RED III, and a lower level of roundwood imports, as imports from the Russian Federation and Belarus are not foreseen in this scenario. The scenarios are further detailed below.
The HA uses the GDP projections of the Shell corporation Energy Security Scenarios Archipelagos [
22], where global sentiment shifts away from managing emissions and towards energy security; however, the drive for energy security still includes the greater use of low-carbon technologies. The rates of change of biomass and waste in gross available energy in the EU Reference Scenario 2020 [
25] are used for the projections of wood used for energy (heat and power) for EU member states. For Norway and Switzerland, projections are based on historic developments in JWEE data [
24] using periods of lower usage (amounting to annual rates of change in energy wood use of −4.6% and −3.0% for Switzerland and Norway, respectively), while the rates of change used for the UK projections of wood used for energy are the average of the French and German ones according to the EU Reference Scenario 2020 [
25]. This choice is motivated by the circumstance that the historical development of the UK’s use of wood for energy is similar to those of France and Germany, and post-BREXIT, in the context of the Ukraine war, the UK and the EU have increased their coordination on energy [
28]. The share of woody biomass in biomass and waste is assumed to remain constant over the outlook period for all countries, as are the shares of the different categories of wood (direct, indirect, and unknown) in total energy use of wood. Trade is assumed to remain unchanged from year 2019 values for all countries in this study, the implicit assumption being that Europe has either managed to find replacements for imports of roundwood from the Russian Federation and Belarus or revoked sanctions in this respect (and convinced the Russian Federation and Belarus to resume exports of wood-based commodities to Europe).
The LA uses the GDP projections of the Shell corporation Energy Security Scenarios Sky 2050 [
22], which aims to achieve net-zero emissions by 2050. For EU MSs, this means the implementation of the 2023 revision of the Renewable Energy Directive EU/2023/2413 (RED III). The rates of change of biomass and waste in gross available energy in the EU Reference Scenario 2020 [
25] are used for the projections of wood used for energy (heat and power) for EU member states, corrected for the raised binding renewable target for 2030 of RED III [
1] of a minimum of 42.5% compared to the 32% used in the EU Reference Scenario 2020 [
25]. Hence, biomass and waste use (and thus also wood energy use) for year 2030 is increased by 32.8%, and the intermediate value for year 2025 is estimated through linear interpolation. After the year 2030, biomass and waste use develops according to the same rates of change as in the EU Reference Scenario 2020 [
25]. For Norway and Switzerland, projections are based on historic rates of change in the JWEE data [
24] using periods of higher usage (amounting to annual rates of change in energy wood use of 0.3% and 1.0% for Switzerland and Norway, respectively), while the rates of change used for UK projections of wood used for energy are the average of the French and German ones for the LA. Again, the share of woody biomass in biomass and waste is assumed to remain constant over the outlook period for all countries, as are the shares of the different categories of wood (direct, indirect, and unknown) in total energy use of wood. Trade in roundwood uses year 2019 values minus year 2019 values of imports from the Russian Federation and Belarus for all countries in this study, while trade in other woody biomass assortments remains unchanged from year 2019 values.
In order to clarify the impact of energy policies and as a means of sensitivity analysis, we add two subscenarios, HA_GDP0 and LA_GDP0, only differing with respect to the respective main scenario in that we assume no GDP growth and consequently no increase in the demand for industrial roundwood and thus no increase in fellings for material purposes.
4. State of Play in the Use and Supply of Wood
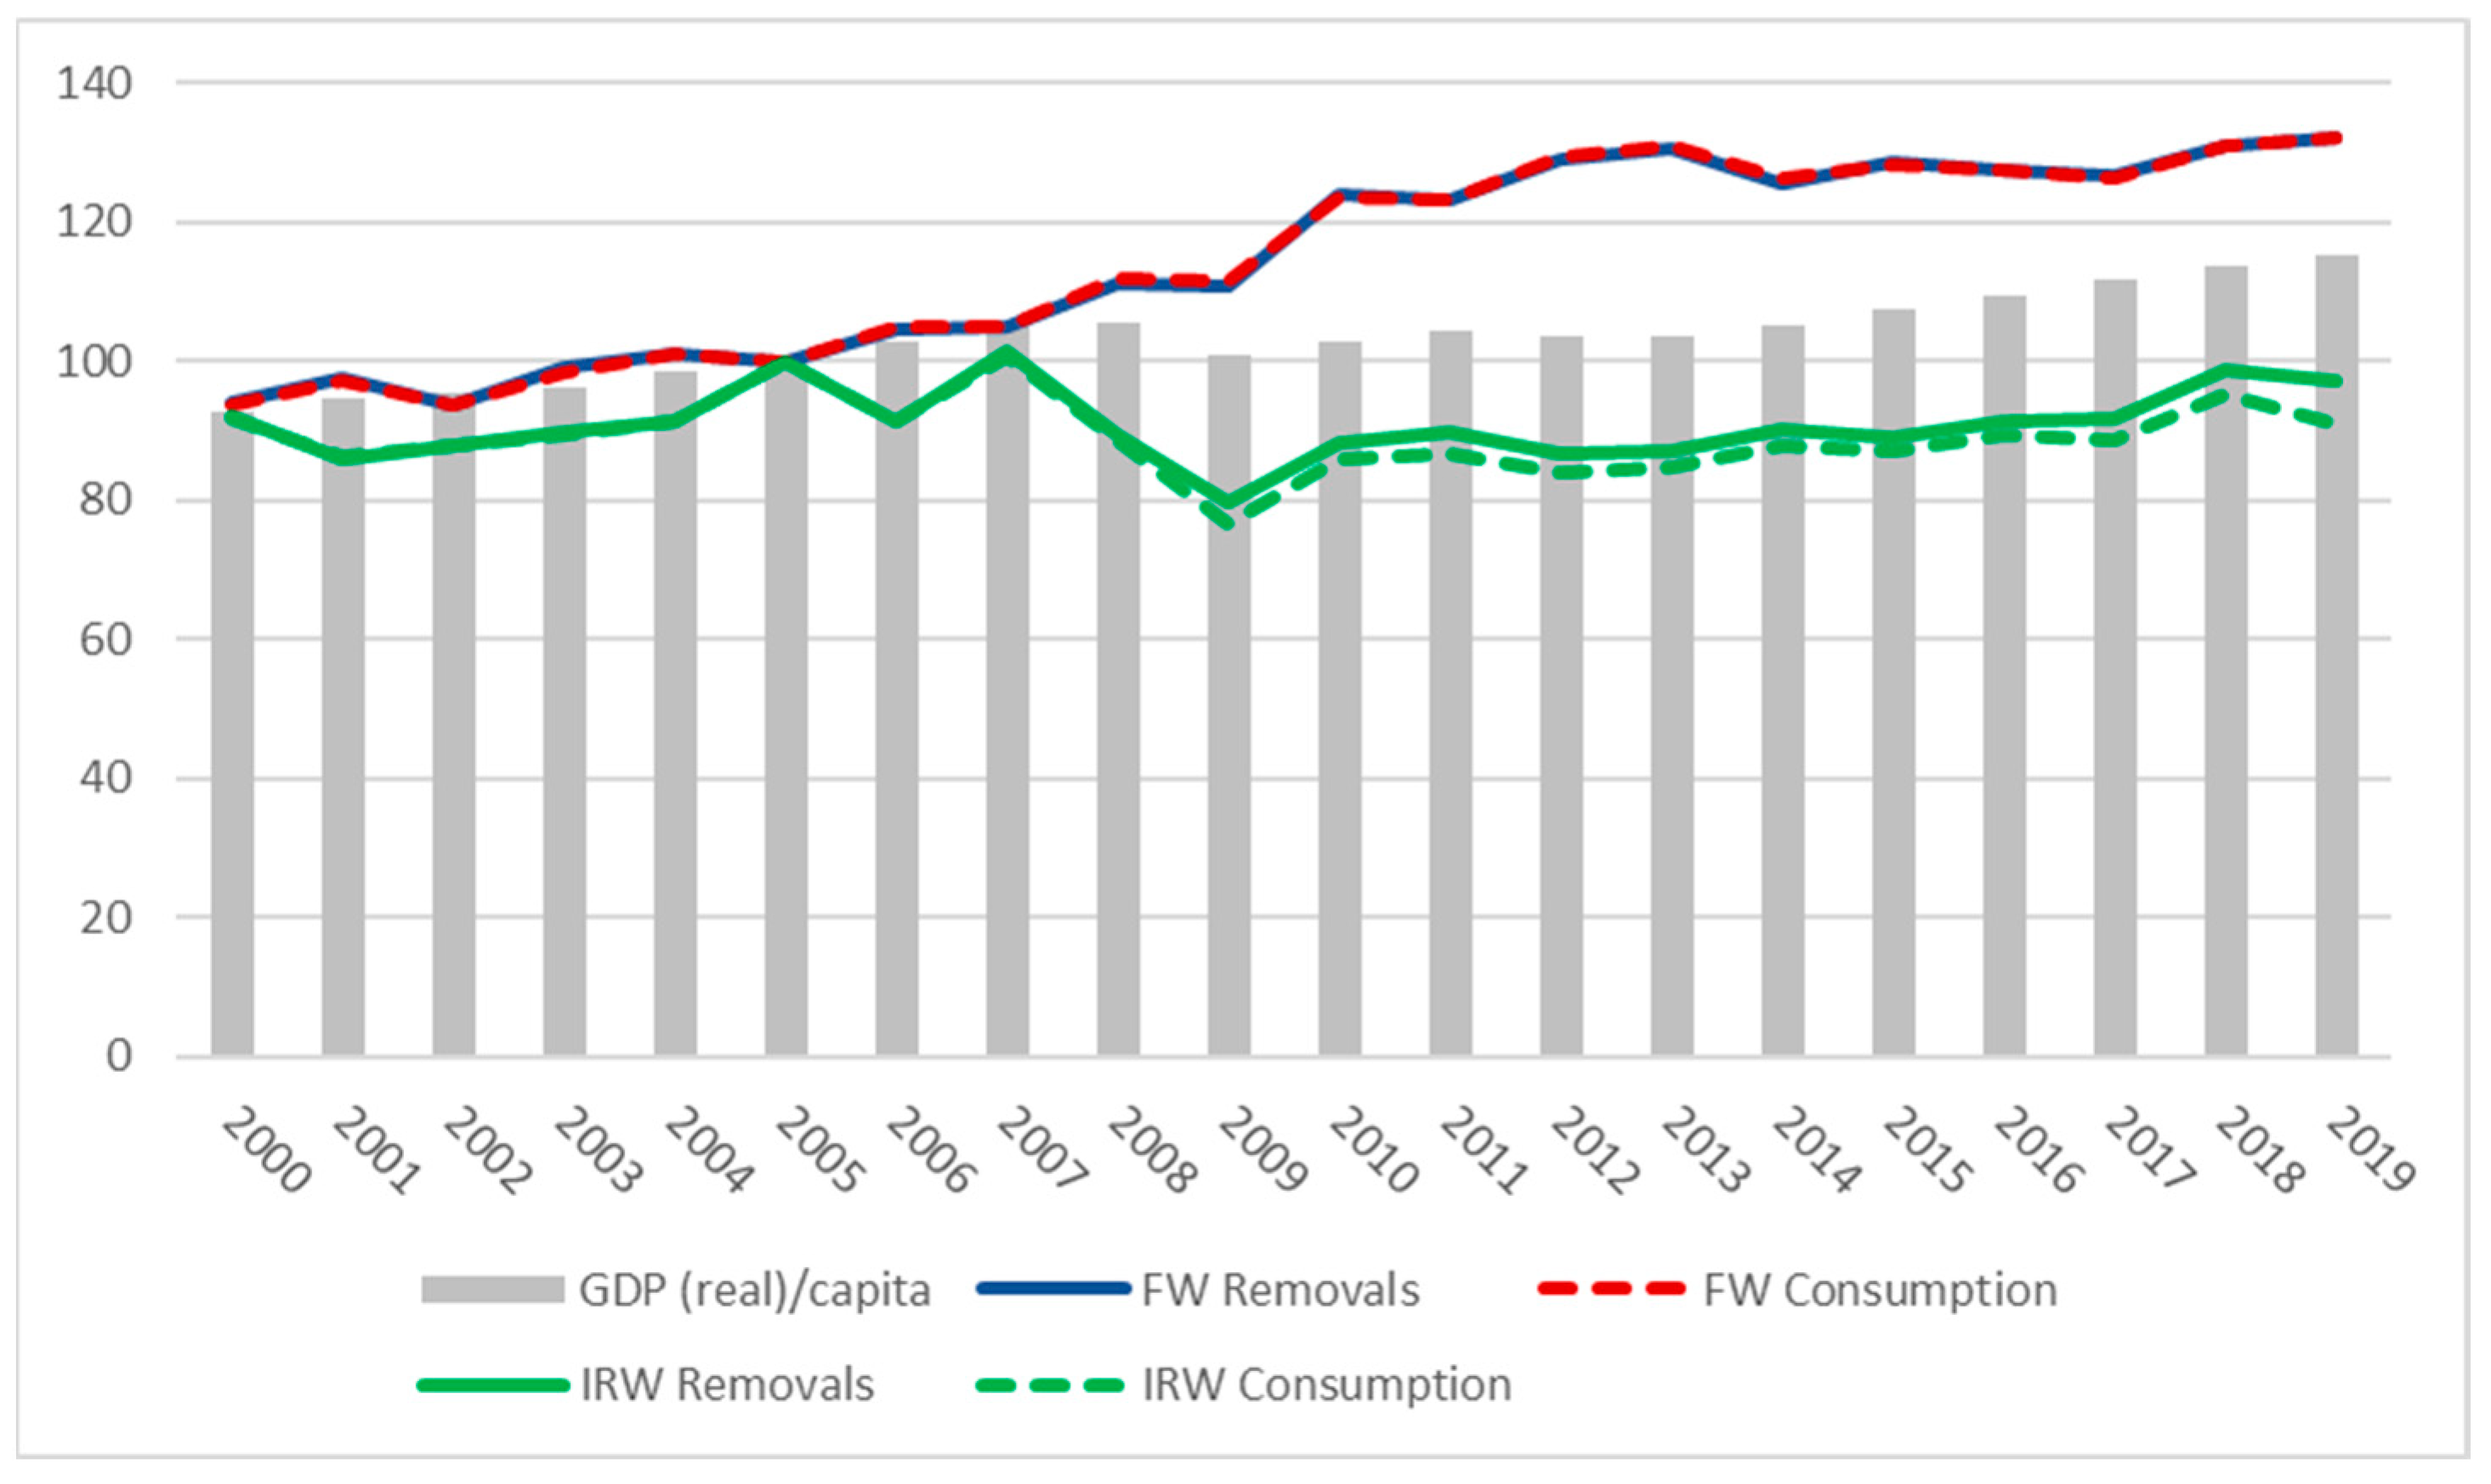
In per capita terms, removals and consumption of FW in the EU27 + the UK (EU28) outgrew IRW removals and apparent consumption (production + imports − exports) as well as GDP in the period 2007 to 2019, with a particularly marked increase just after the adoption of the Renewable Energy Directive (RED I) in 2009 (
Figure 1). A detailed analysis of this indicates that FW removals are underestimated. It is hard to make any other interpretation than that these forest-use developments were to a large extent driven by the introduction of RED I in the year 2009. The region is more or less self-sufficient when it comes to FW, with limited trade.
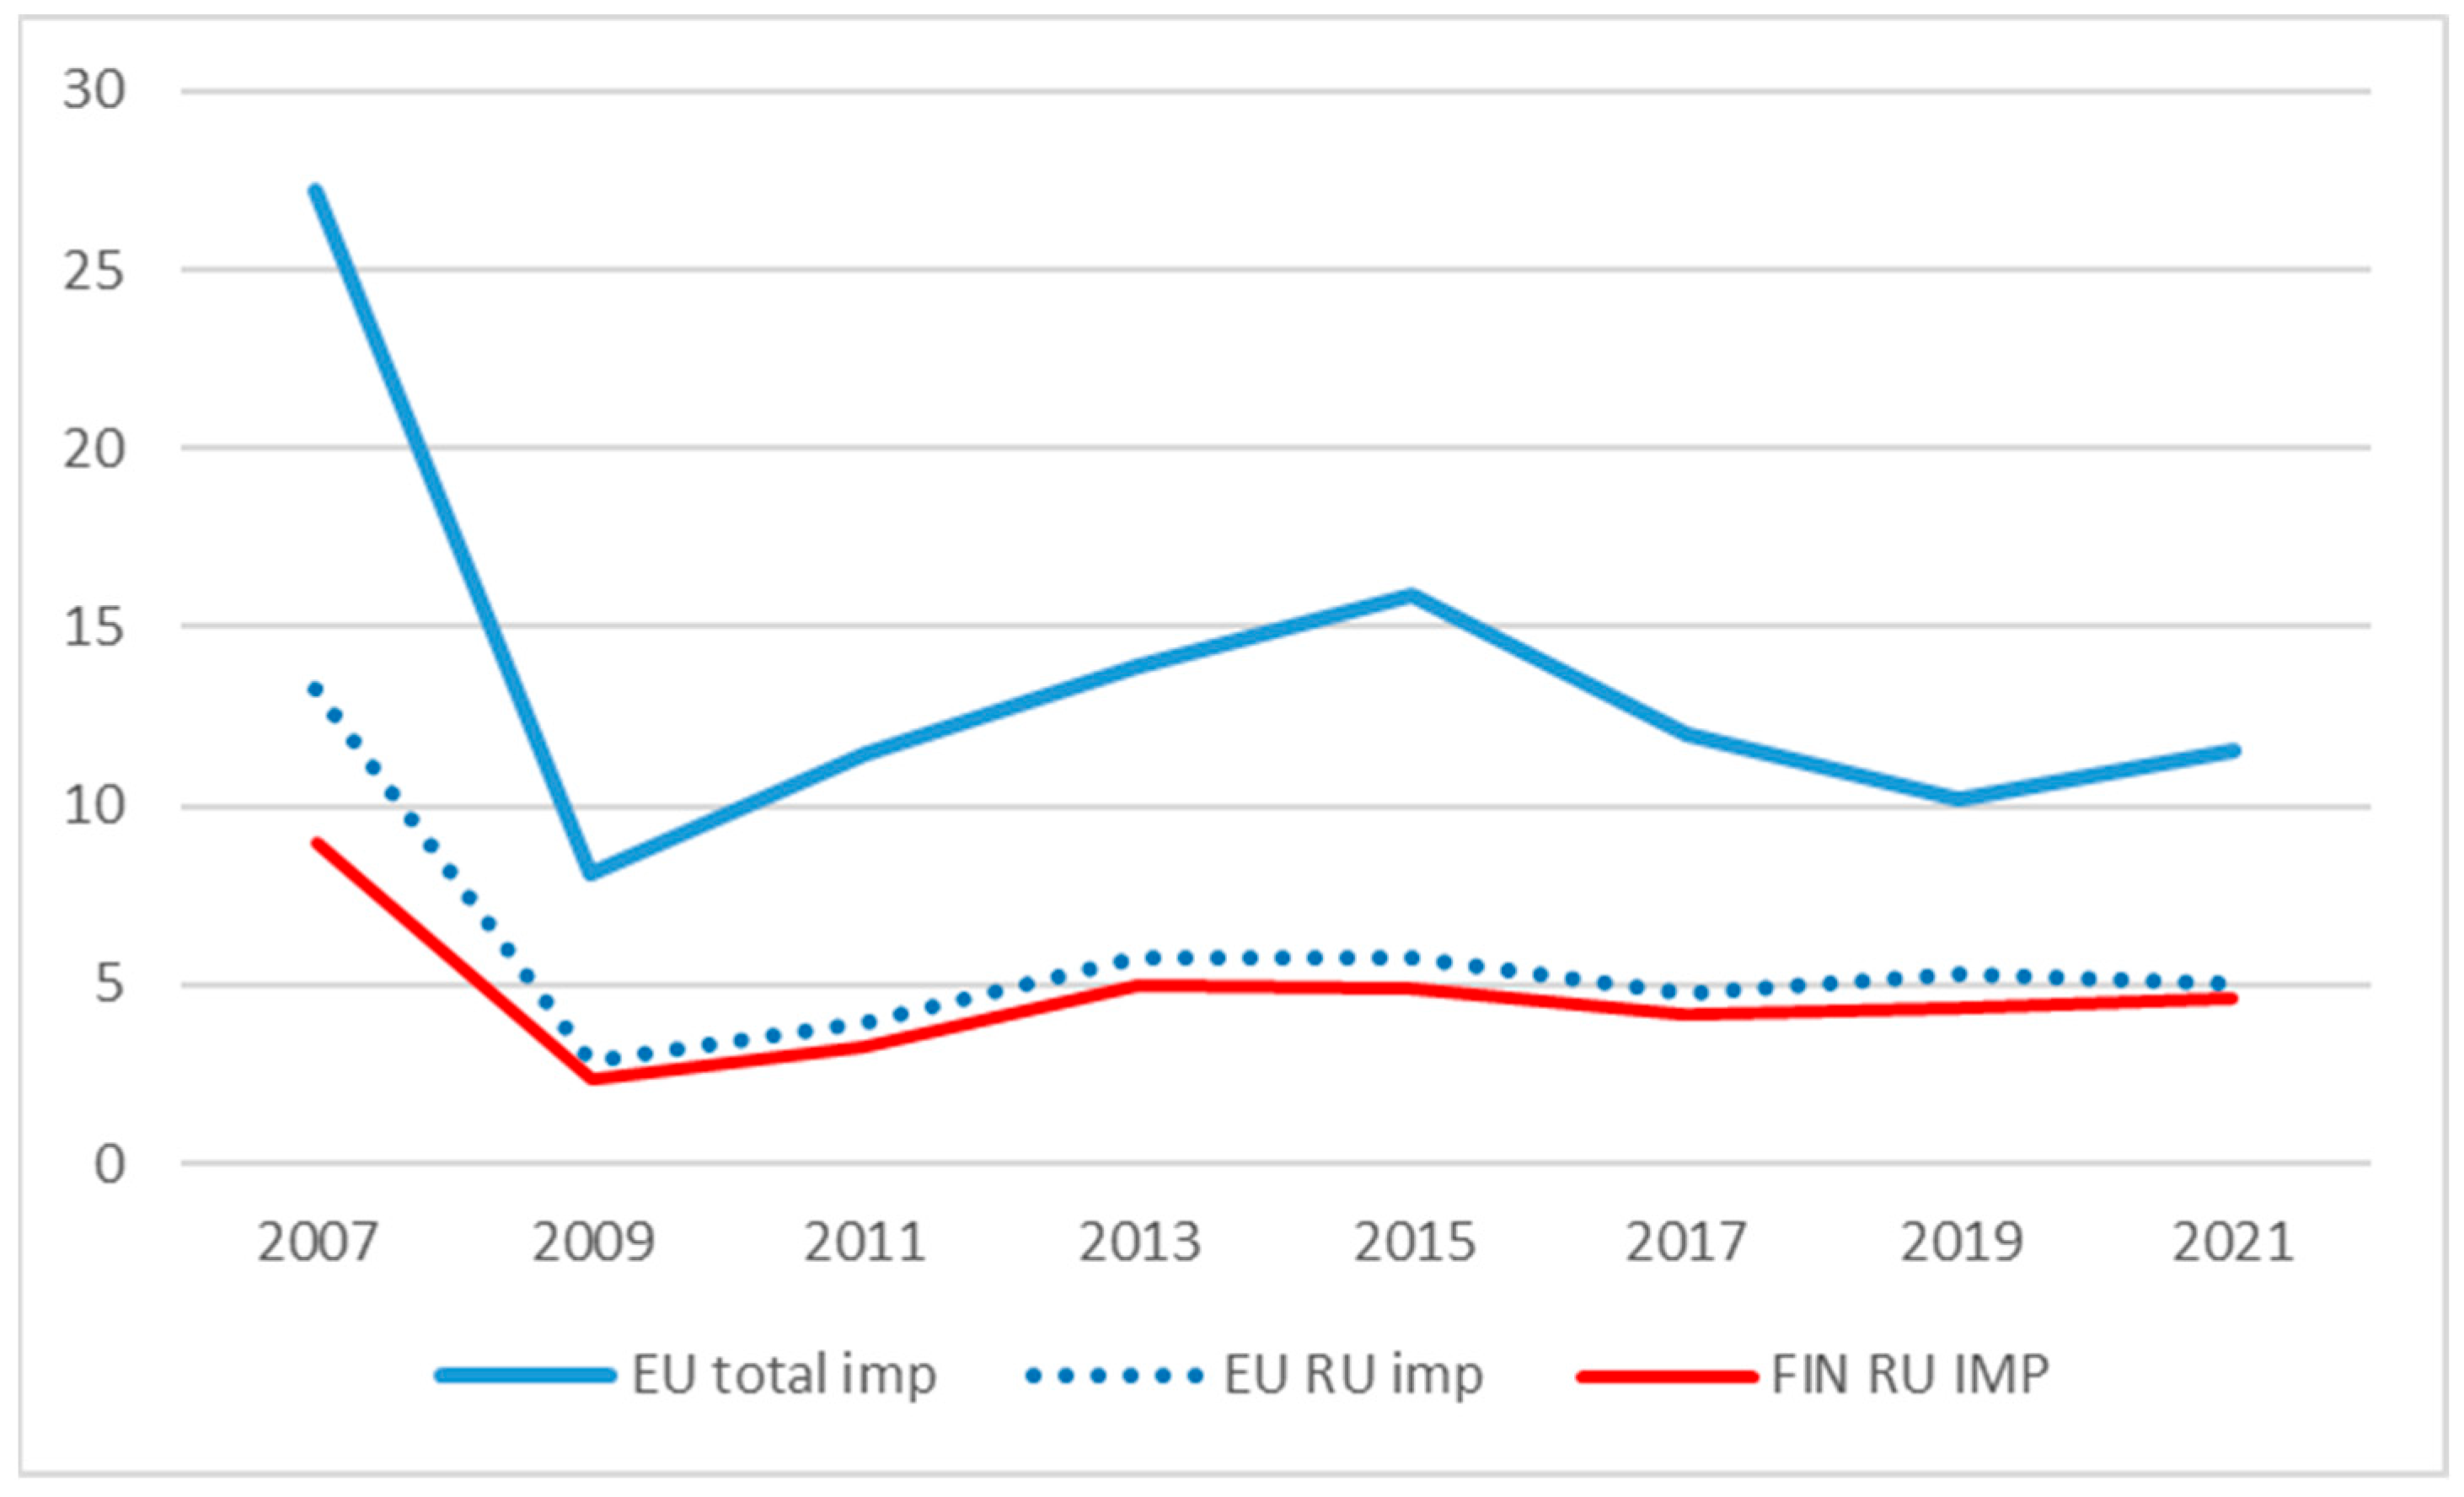
The EU has traditionally been a net importer of IRW. Before the financial crisis in 2009, imports ranged from 20 to 26 million m
3. Since then, imports have never exceeded 16.5 million m
3. In 2019, even minor net exports were recorded, mostly spruce logs from salvage logging due to bark beetle infestations. The Russian Federation has been the single most important supplier of roundwood to the EU28; Finland has dominated EU imports of roundwood from the Russian Federation (
Figure 2).
Table 2 and
Table 3 depict WRB sheets for the EU28 for the years 2009 and 2019, respectively. The overall use of woody biomass for energy in the EU28 increased by some 48%, or 159 million m
3, between 2009 and 2019, clearly reflecting the Renewable Energy Directive introduced in 2009. The overall use of woody biomass for material purposes increased by only 25%, or 102 million m
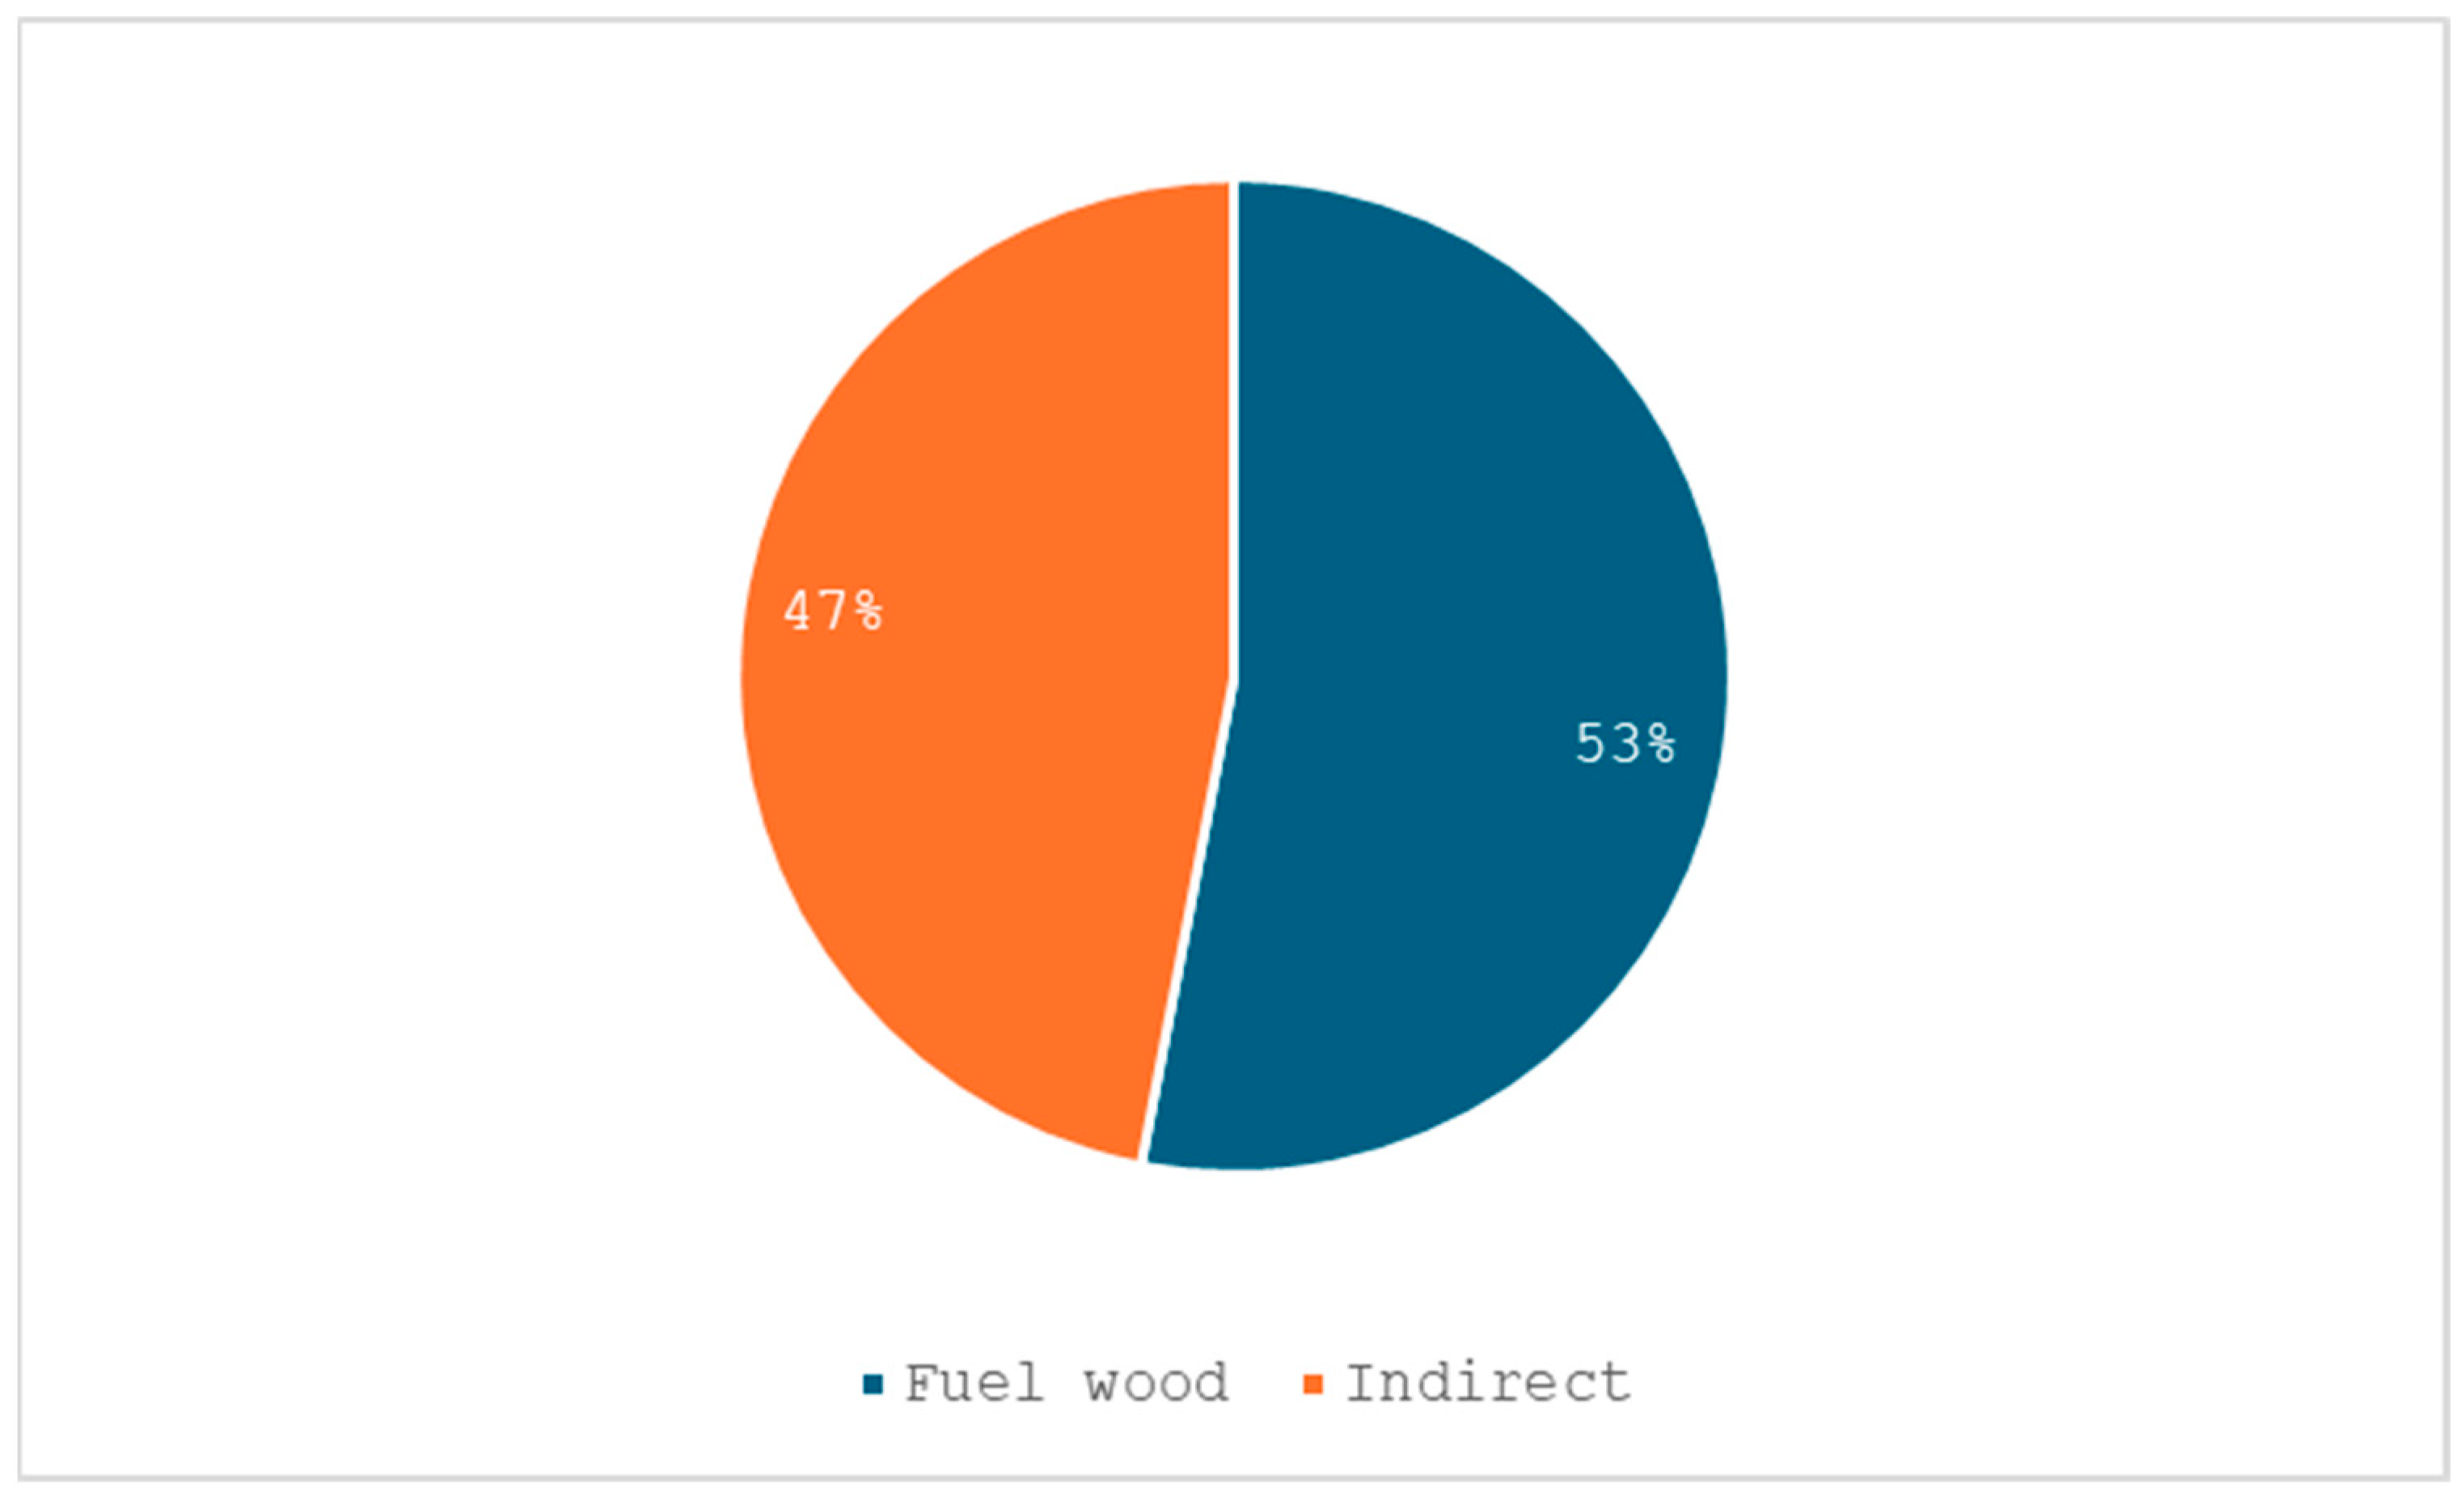
3, during the same period, notwithstanding that production levels were at a low in the year 2009 due to the financial crisis. The share of material uses, including manufacturing of wood pellets, in total uses of woody biomass decreased from 56% to 51% (
Figure 3 and
Figure 4). Secondary woody biomass (“indirect wood”) is the largest reported source for wood-based bioenergy, and its share increased from 46% to 52%. A noteworthy circumstance here is the strong increase in domestic production and net imports of wood pellets, with the UK as the main wood pellets importer.
Total EU28 wood removals—direct wood for energy plus estimated roundwood use of wood for material minus total net imports of roundwood (IRW + FW)—within the EU28 increased from 487 million m
3 under bark (ub) in 2009 to 668 million m
3 ub in 2019, a 37% increase. Unreported roundwood—the difference between the reported supply of roundwood (removals plus net imports of IRW and FW) and the derived use of roundwood for material and energy—increased from 31 million m
3 ub in 2009 (see [
31]) to 72 million m
3 ub ([
30] and own calculations) in the same period. For 2019, energy uses accounted entirely for the unreported removals; hence, the reported supply of IRW (removals plus net imports) exceeded estimated material uses by some 2.2 million m
3 ub, while the reported direct wood use for energy exceeded the reported supply of FW (removals plus net imports) by some 74.7 million m
3 ub. Roundwood used for manufacturing of sawnwood, wood-based panels, and wood pulp accounted for the major part of total roundwood use, 68% in 2009 and 66% in 2019 ([
30] and own calculations).
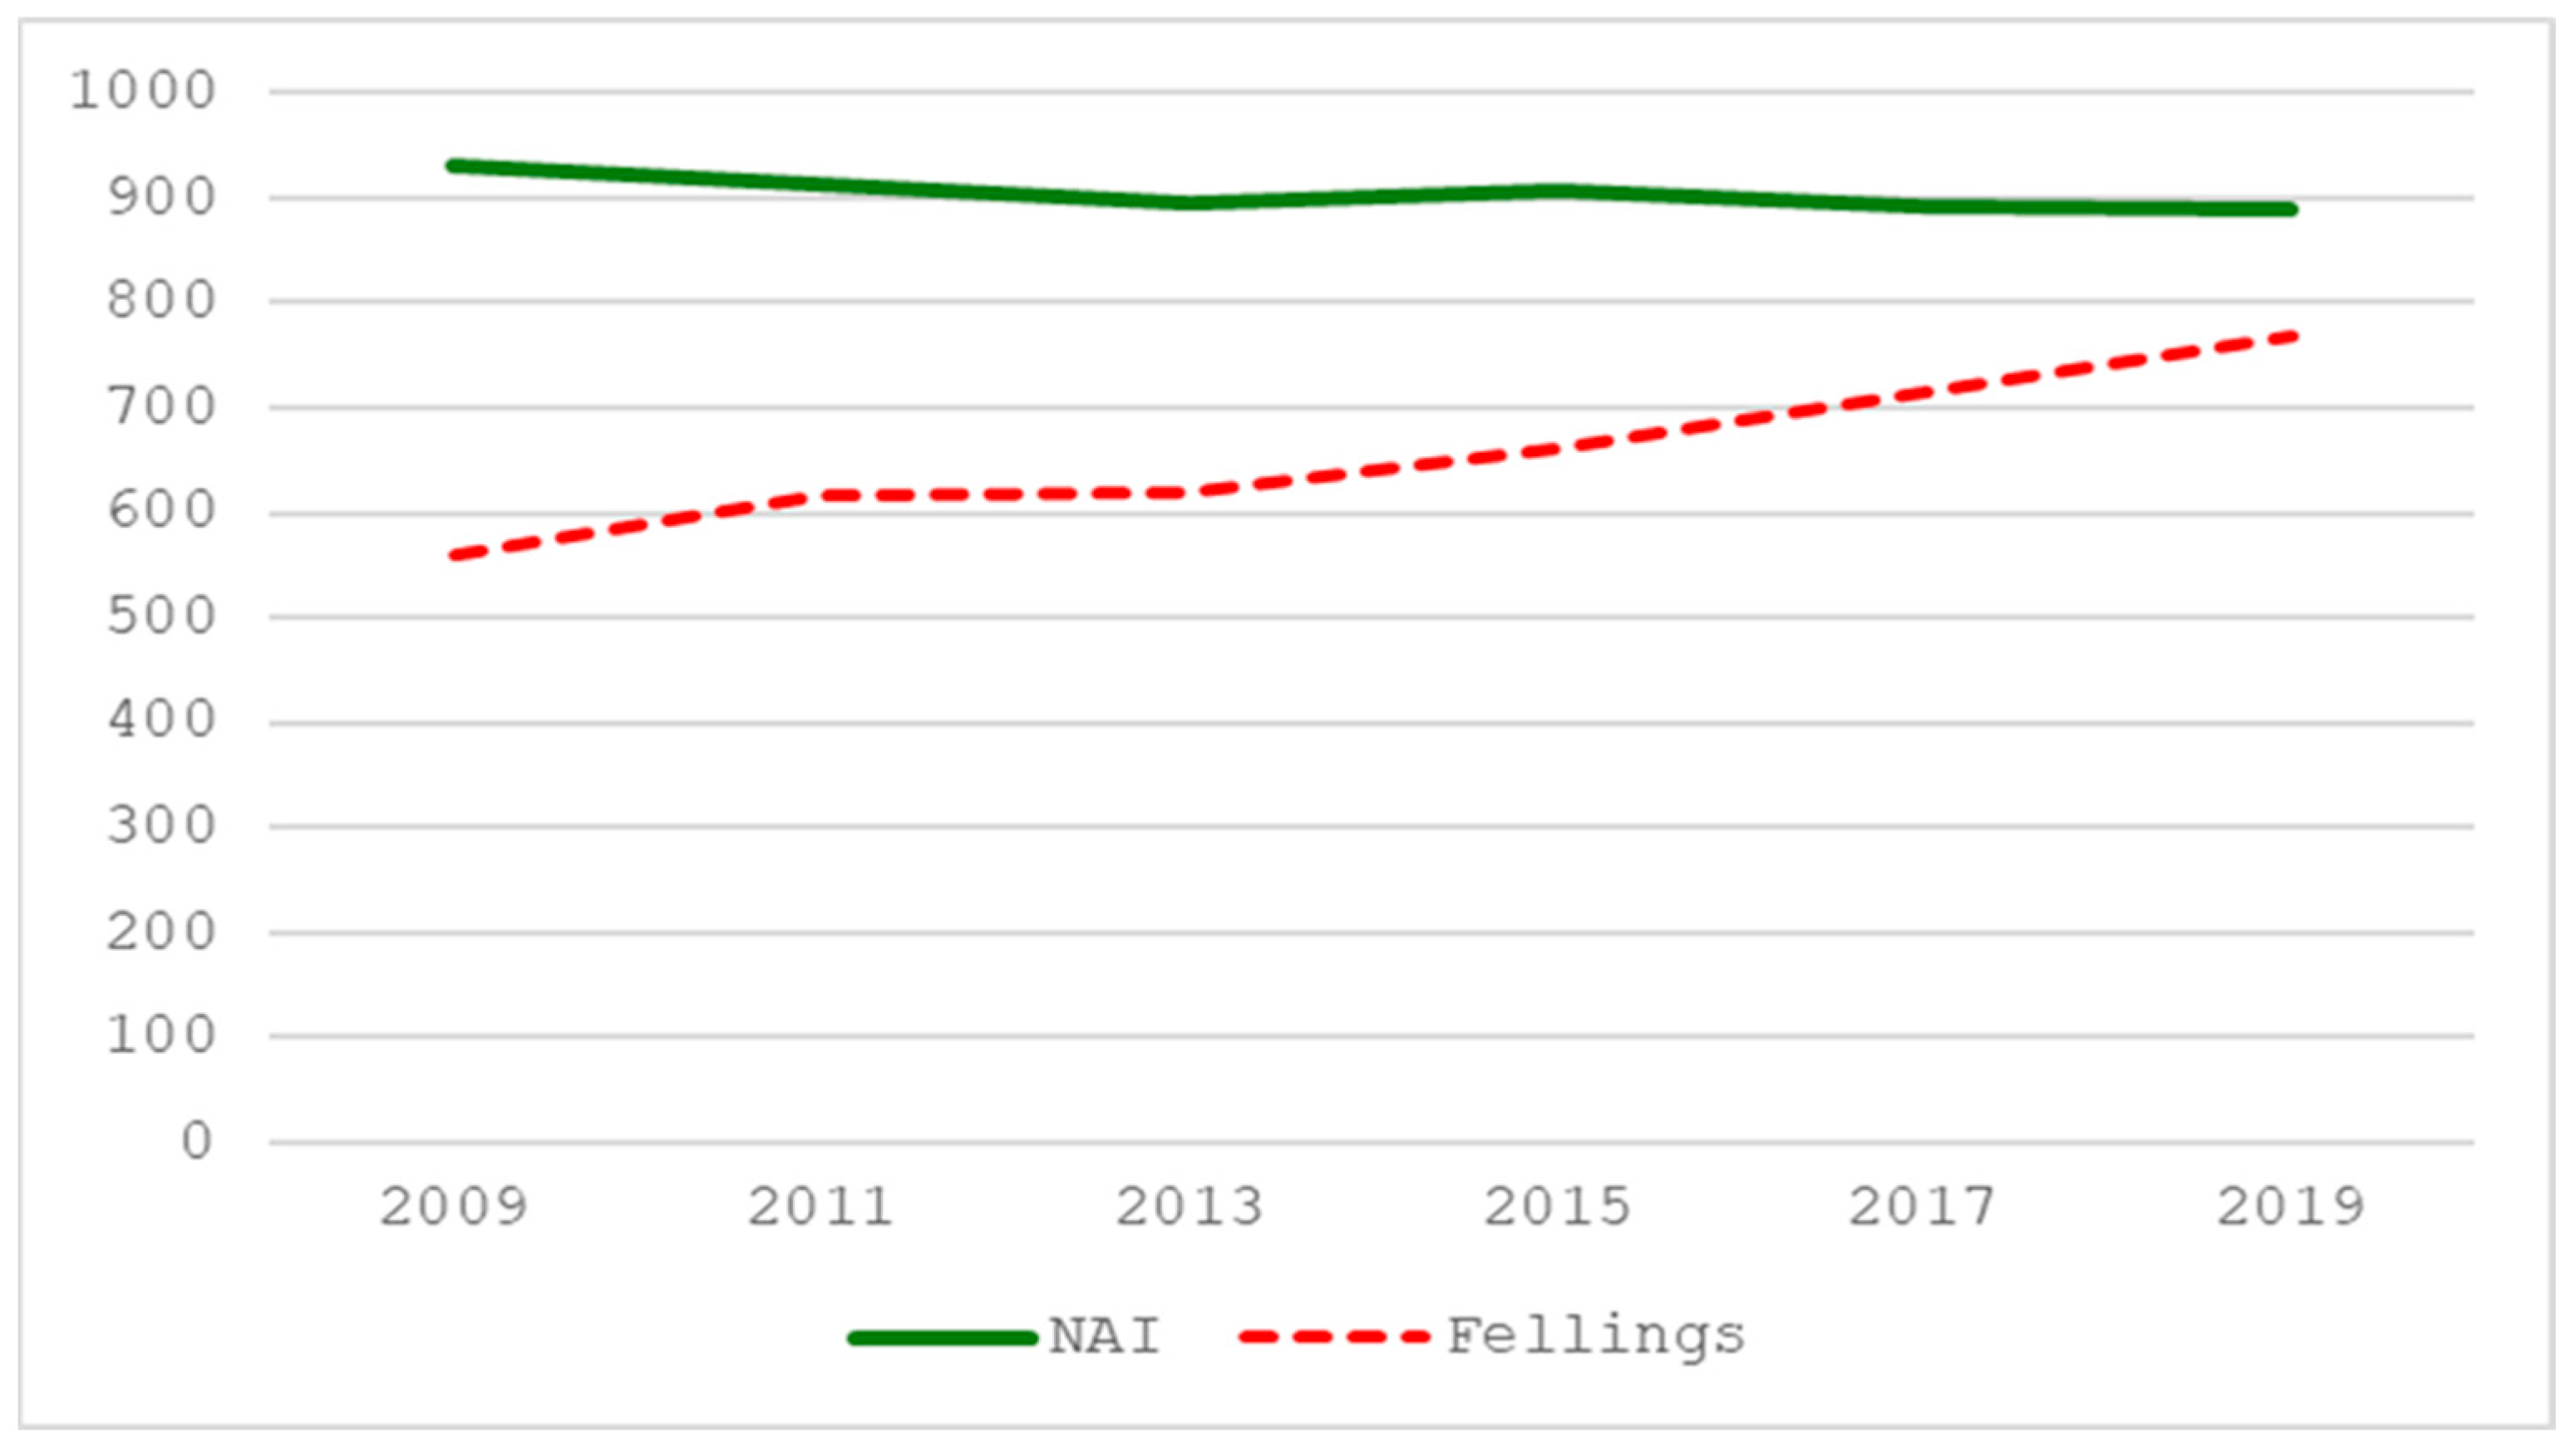
A basic indicator of the sustainability of wood supply is the comparison of net annual increment (NAI) of forests and fellings, with a fellings-to-increment (F/I) ratio lower than one indicating an increasing growing stock. For the period in question, the level of fellings (removals plus bark plus logging residues) was lower than NAI (
Figure 5). However, data indicate that fellings are growing faster than the net annual increment. As a matter of fact, the net annual increment decreased over the period, and NAI and fellings are seemingly converging, with the F/I ratio increasing from 0.60 to 0.86 over this ten-year period. This obviously has climate ramifications, as fellings growing faster than NAI entails a shrinking forest carbon sink (see, e.g., Korosuo et al. [
5]).
Looking more in detail,
Table 4 depicts the WRB for the year 2019 for Region North, comprising Finland, Norway, Sweden, and the Baltic countries. This is a relatively sparsely populated region, well endowed with forest resources with strong forest industries which play an important role in the national economy [
15] and a forest policy priority for sustained-yield forestry [
15]. Notwithstanding being forest-rich, the region is a net importer of industrial roundwood and forest industry by-products but a net exporter of wood pellets. Trade in fuelwood is insignificant. The WRB is well balanced; the “surplus” of sources of some 600 thousand m
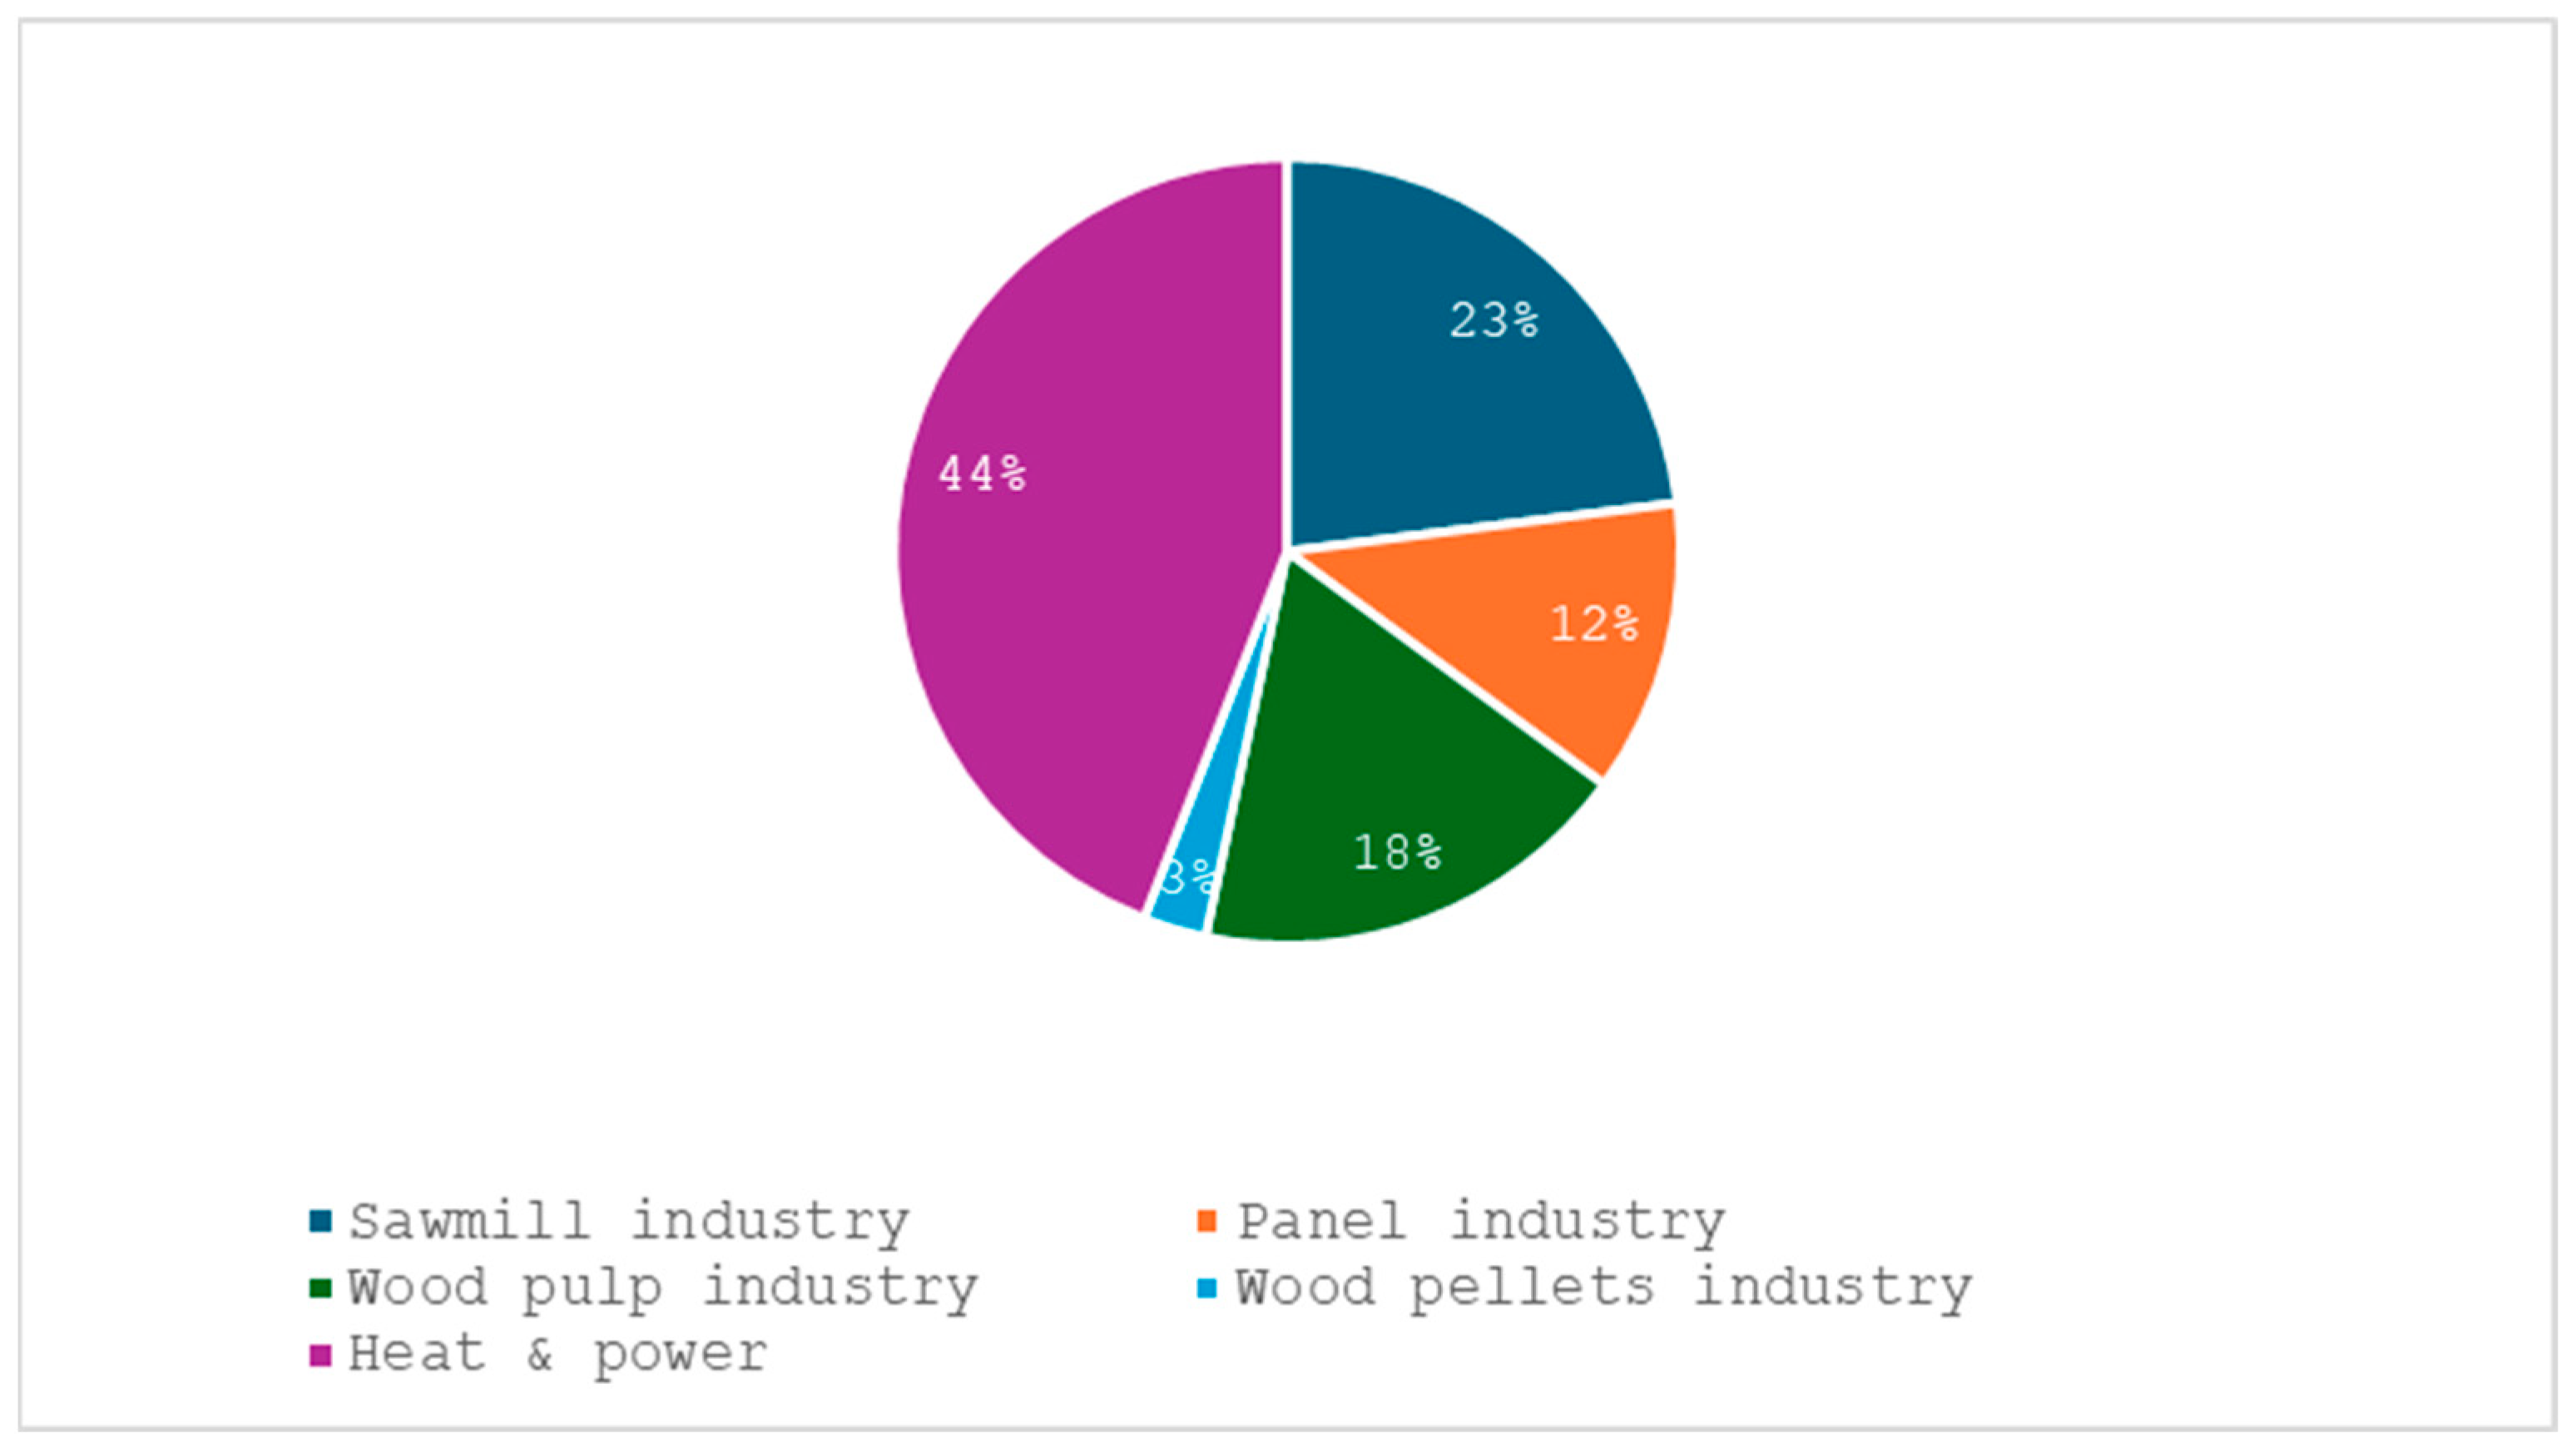
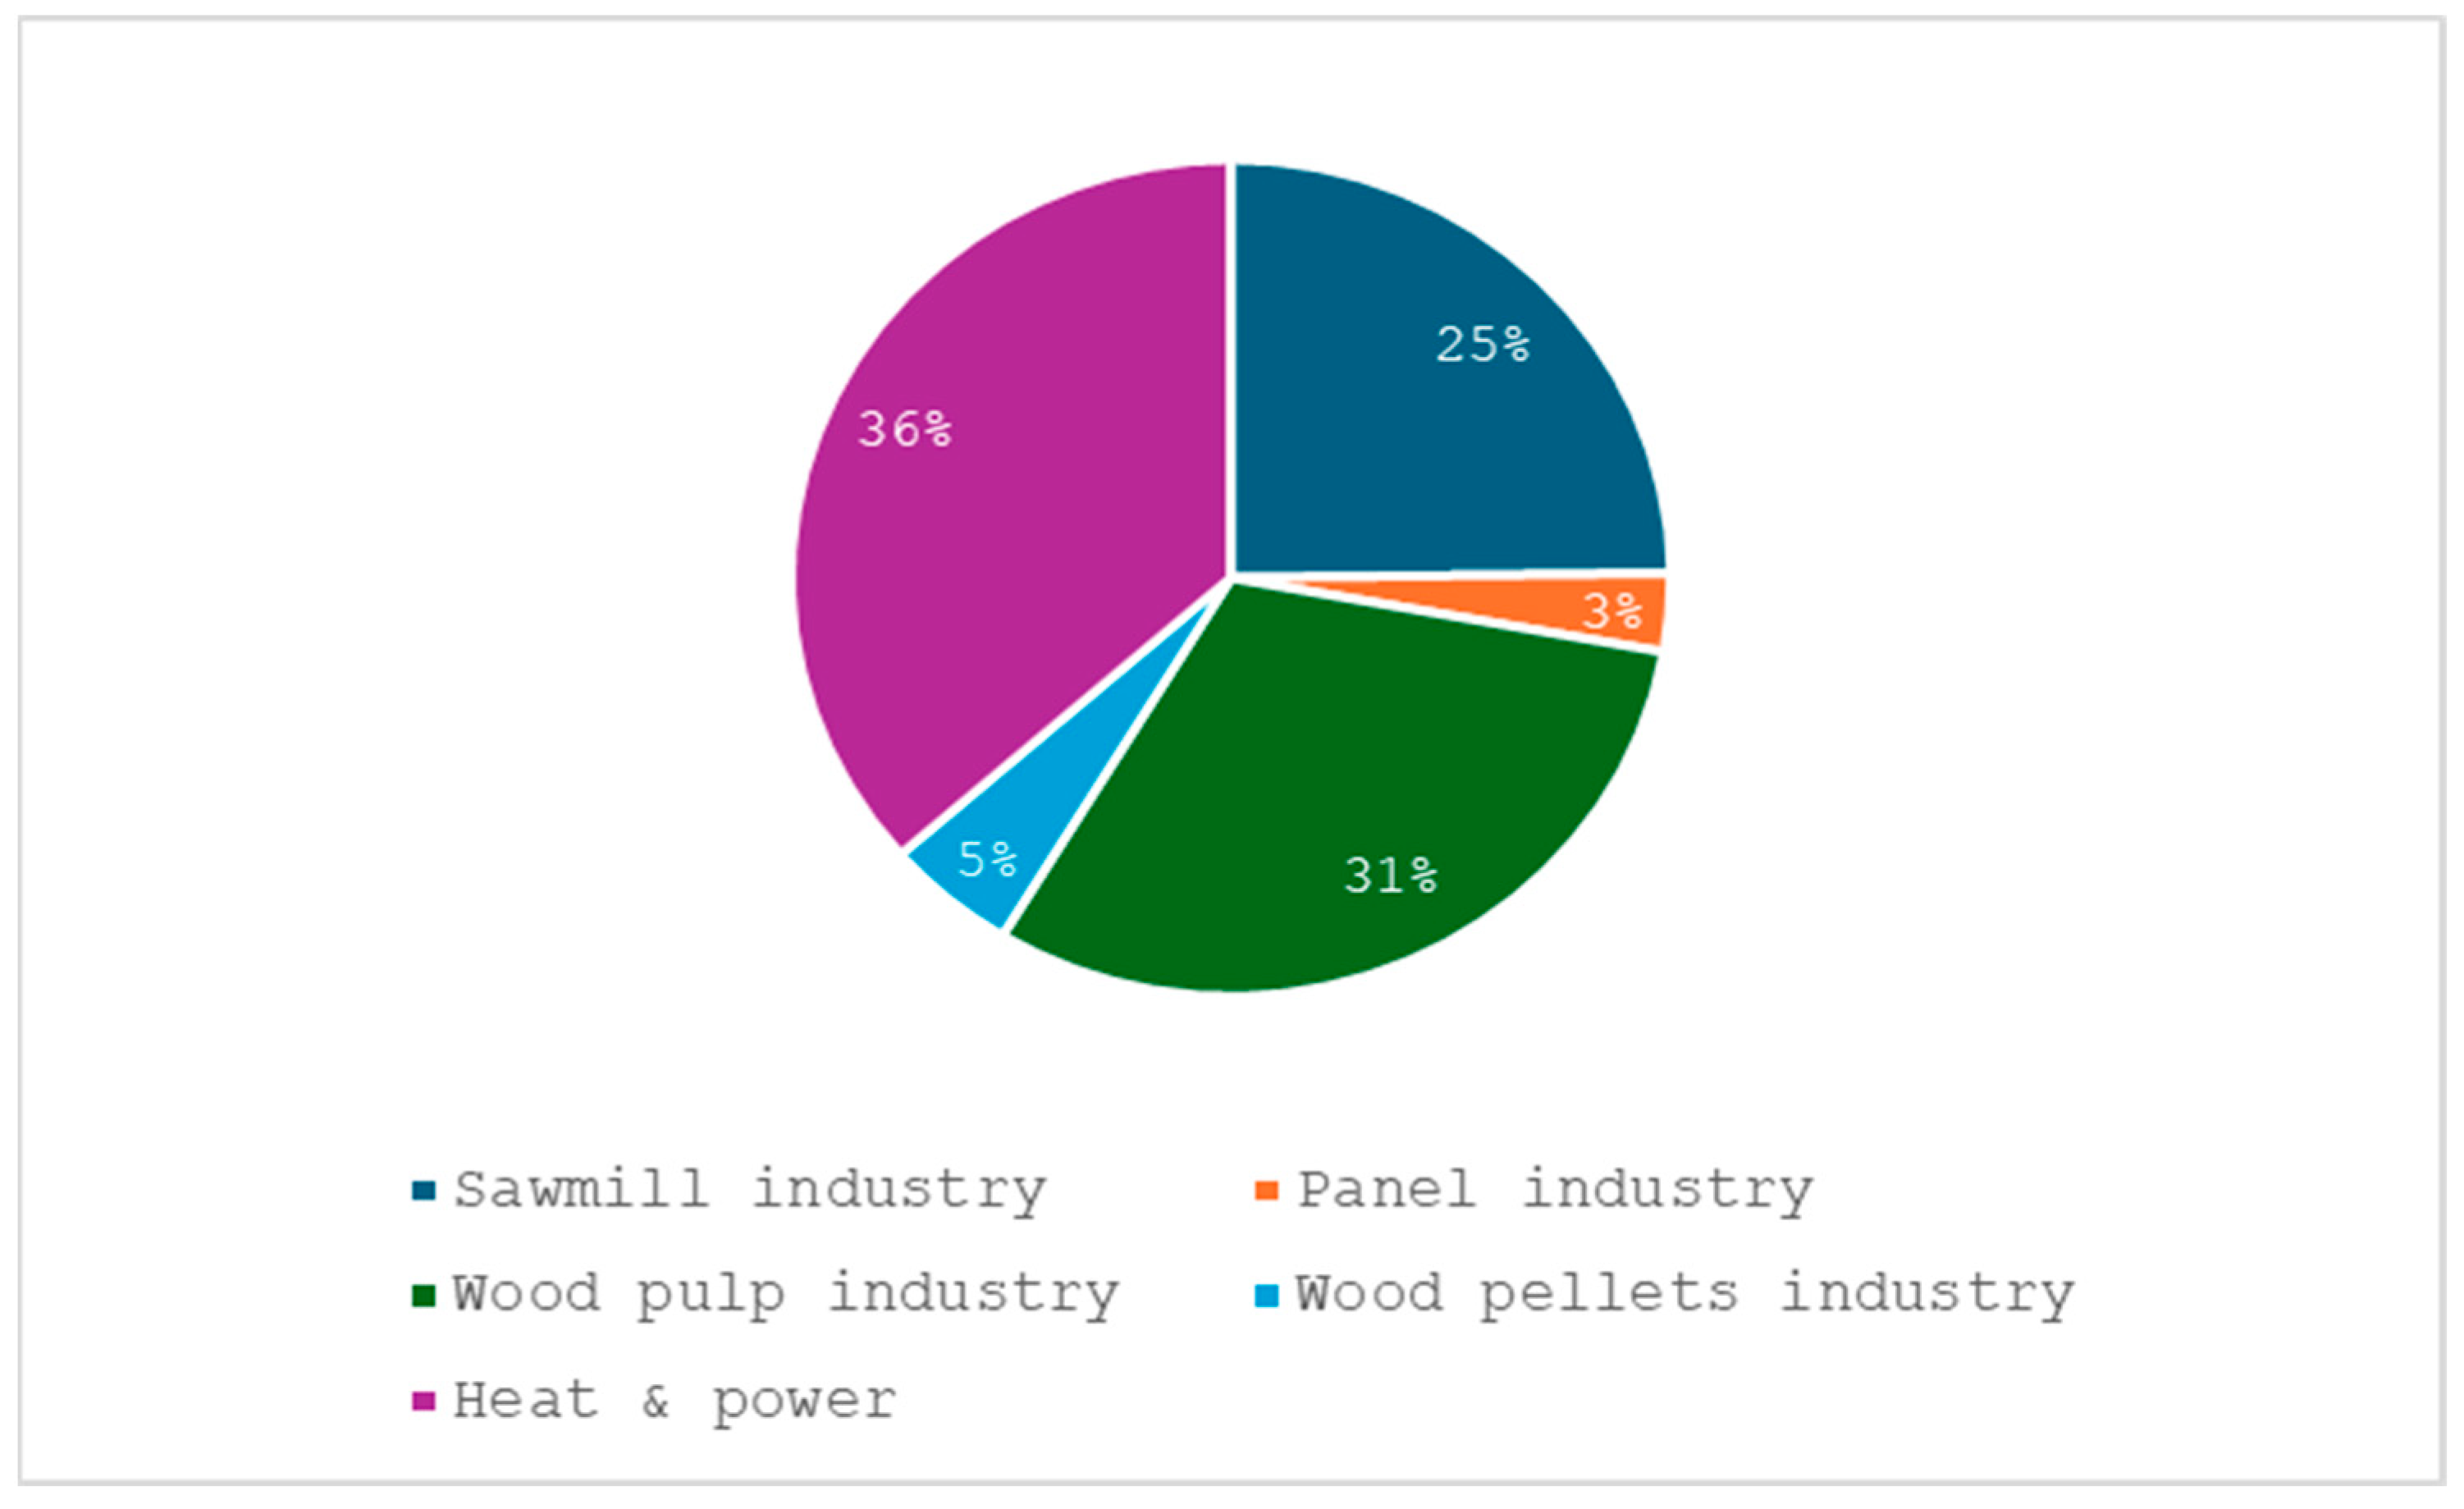
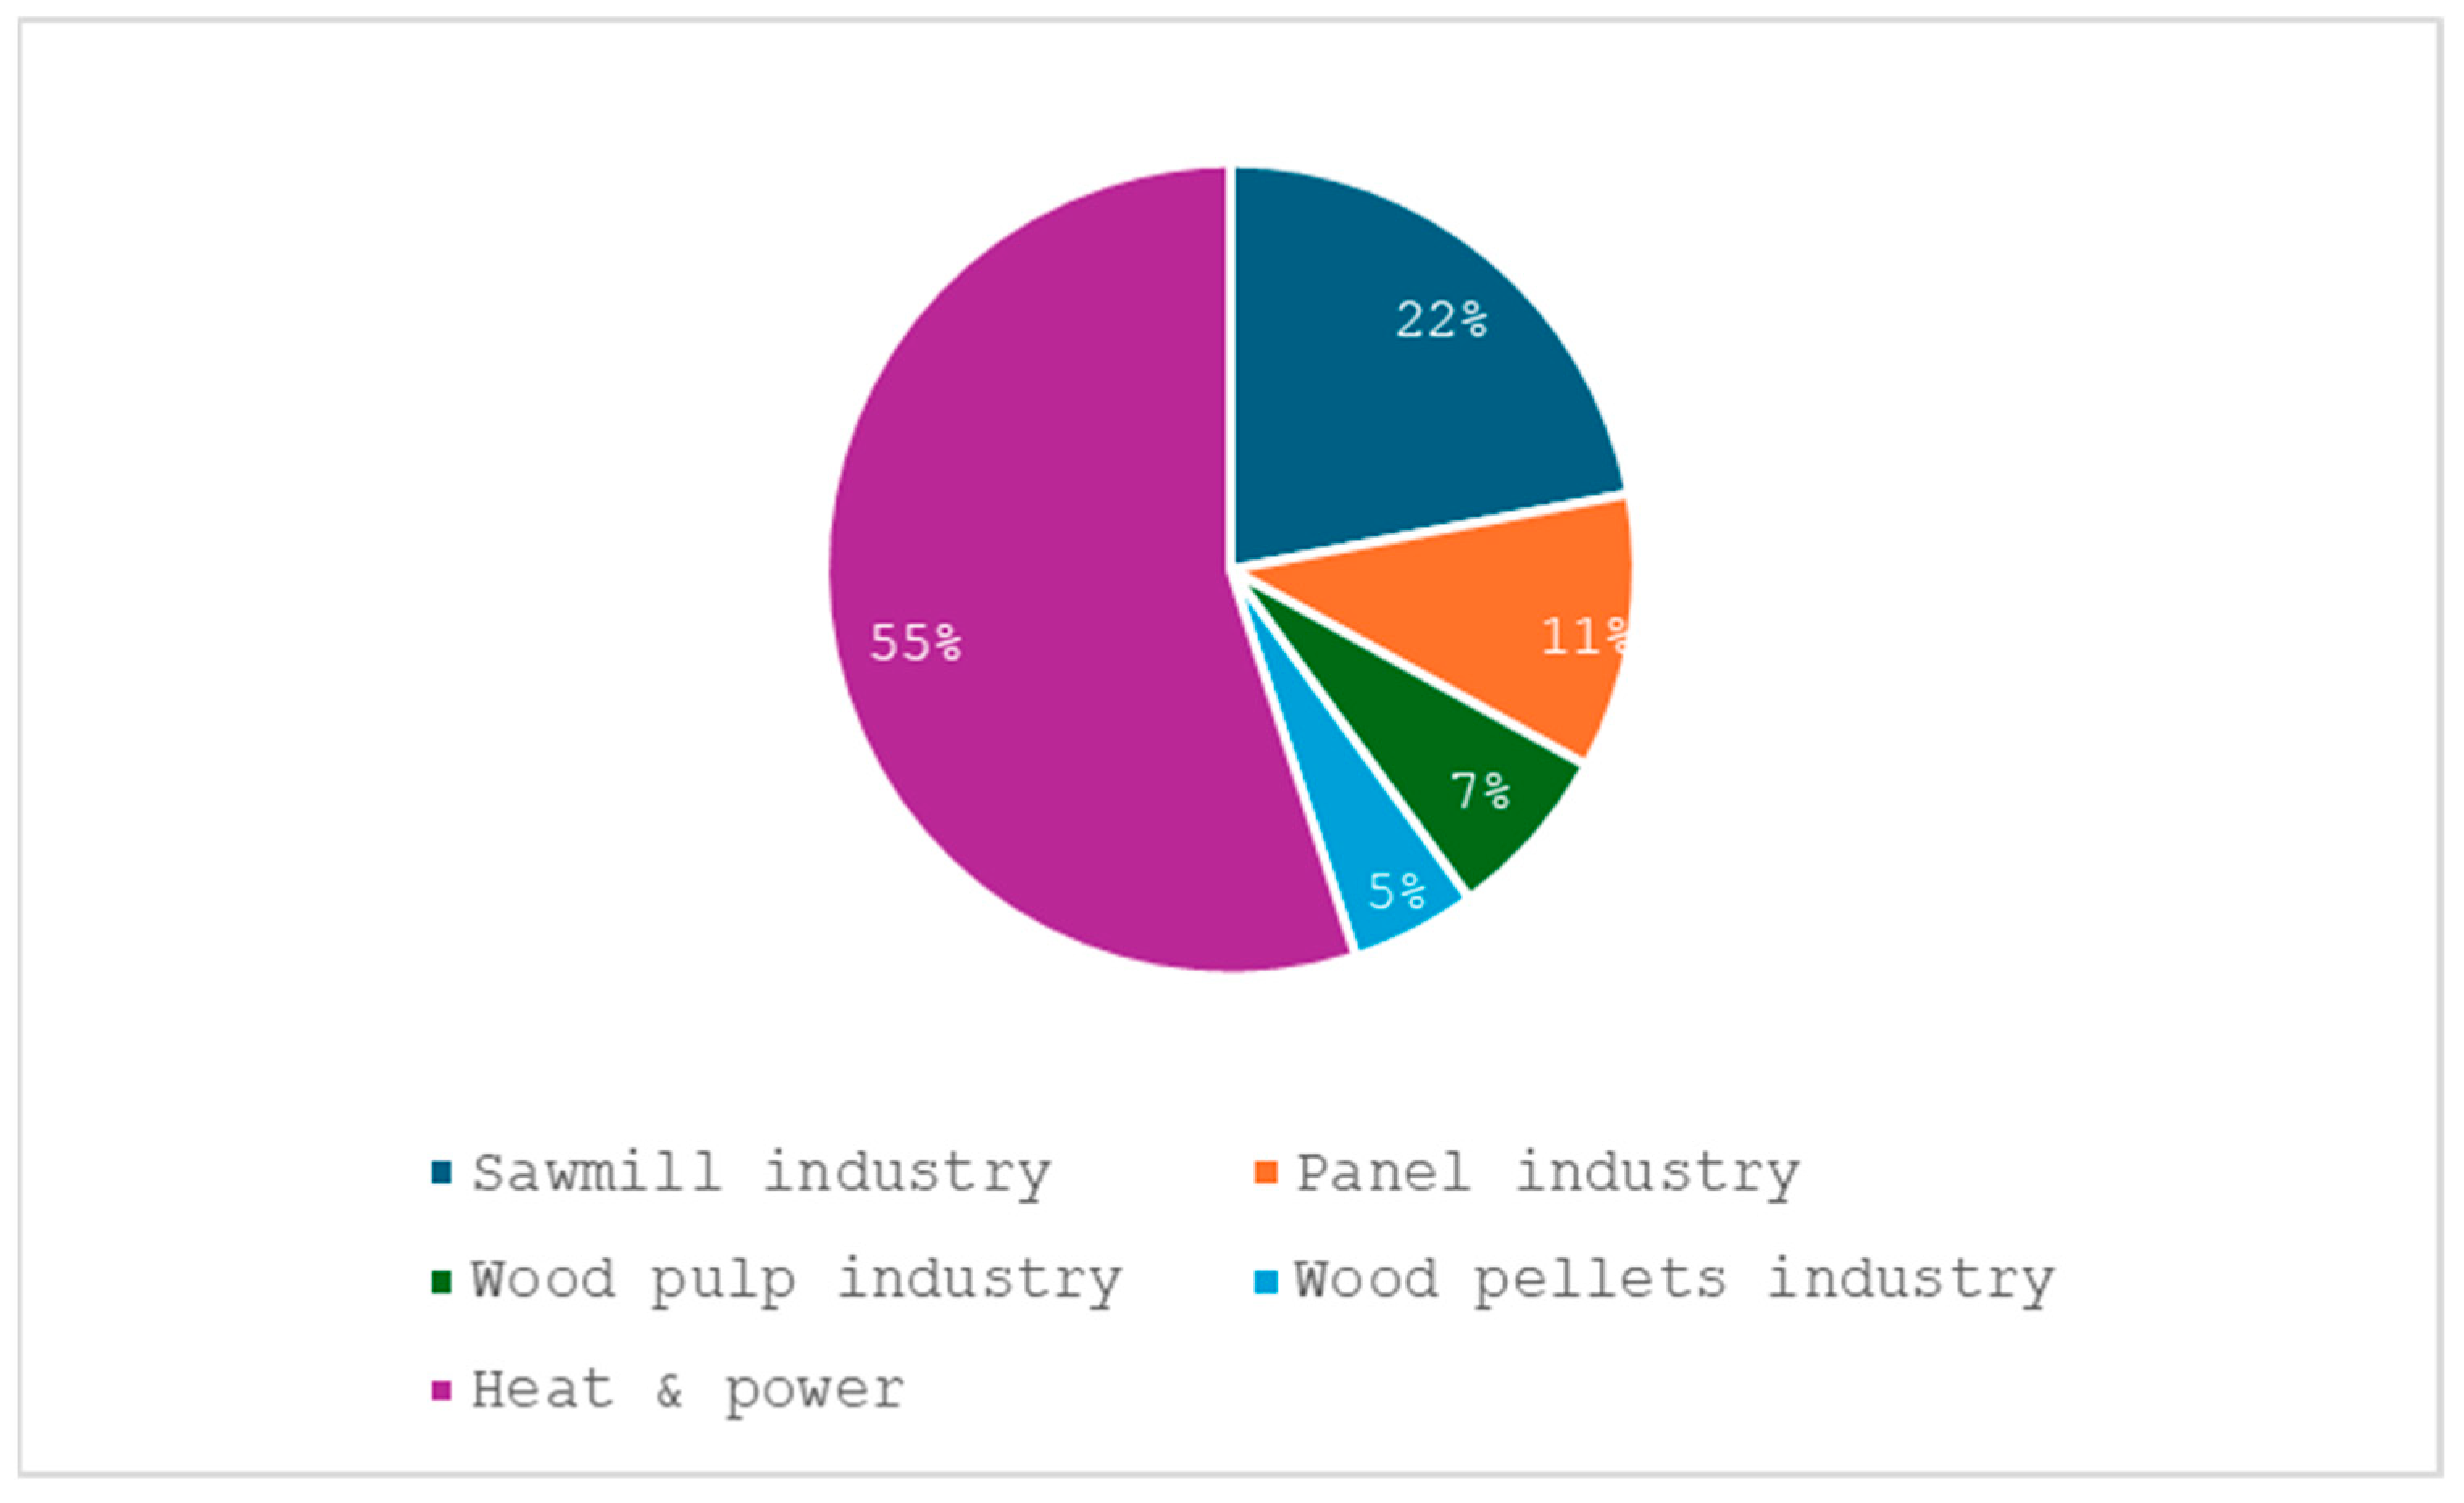
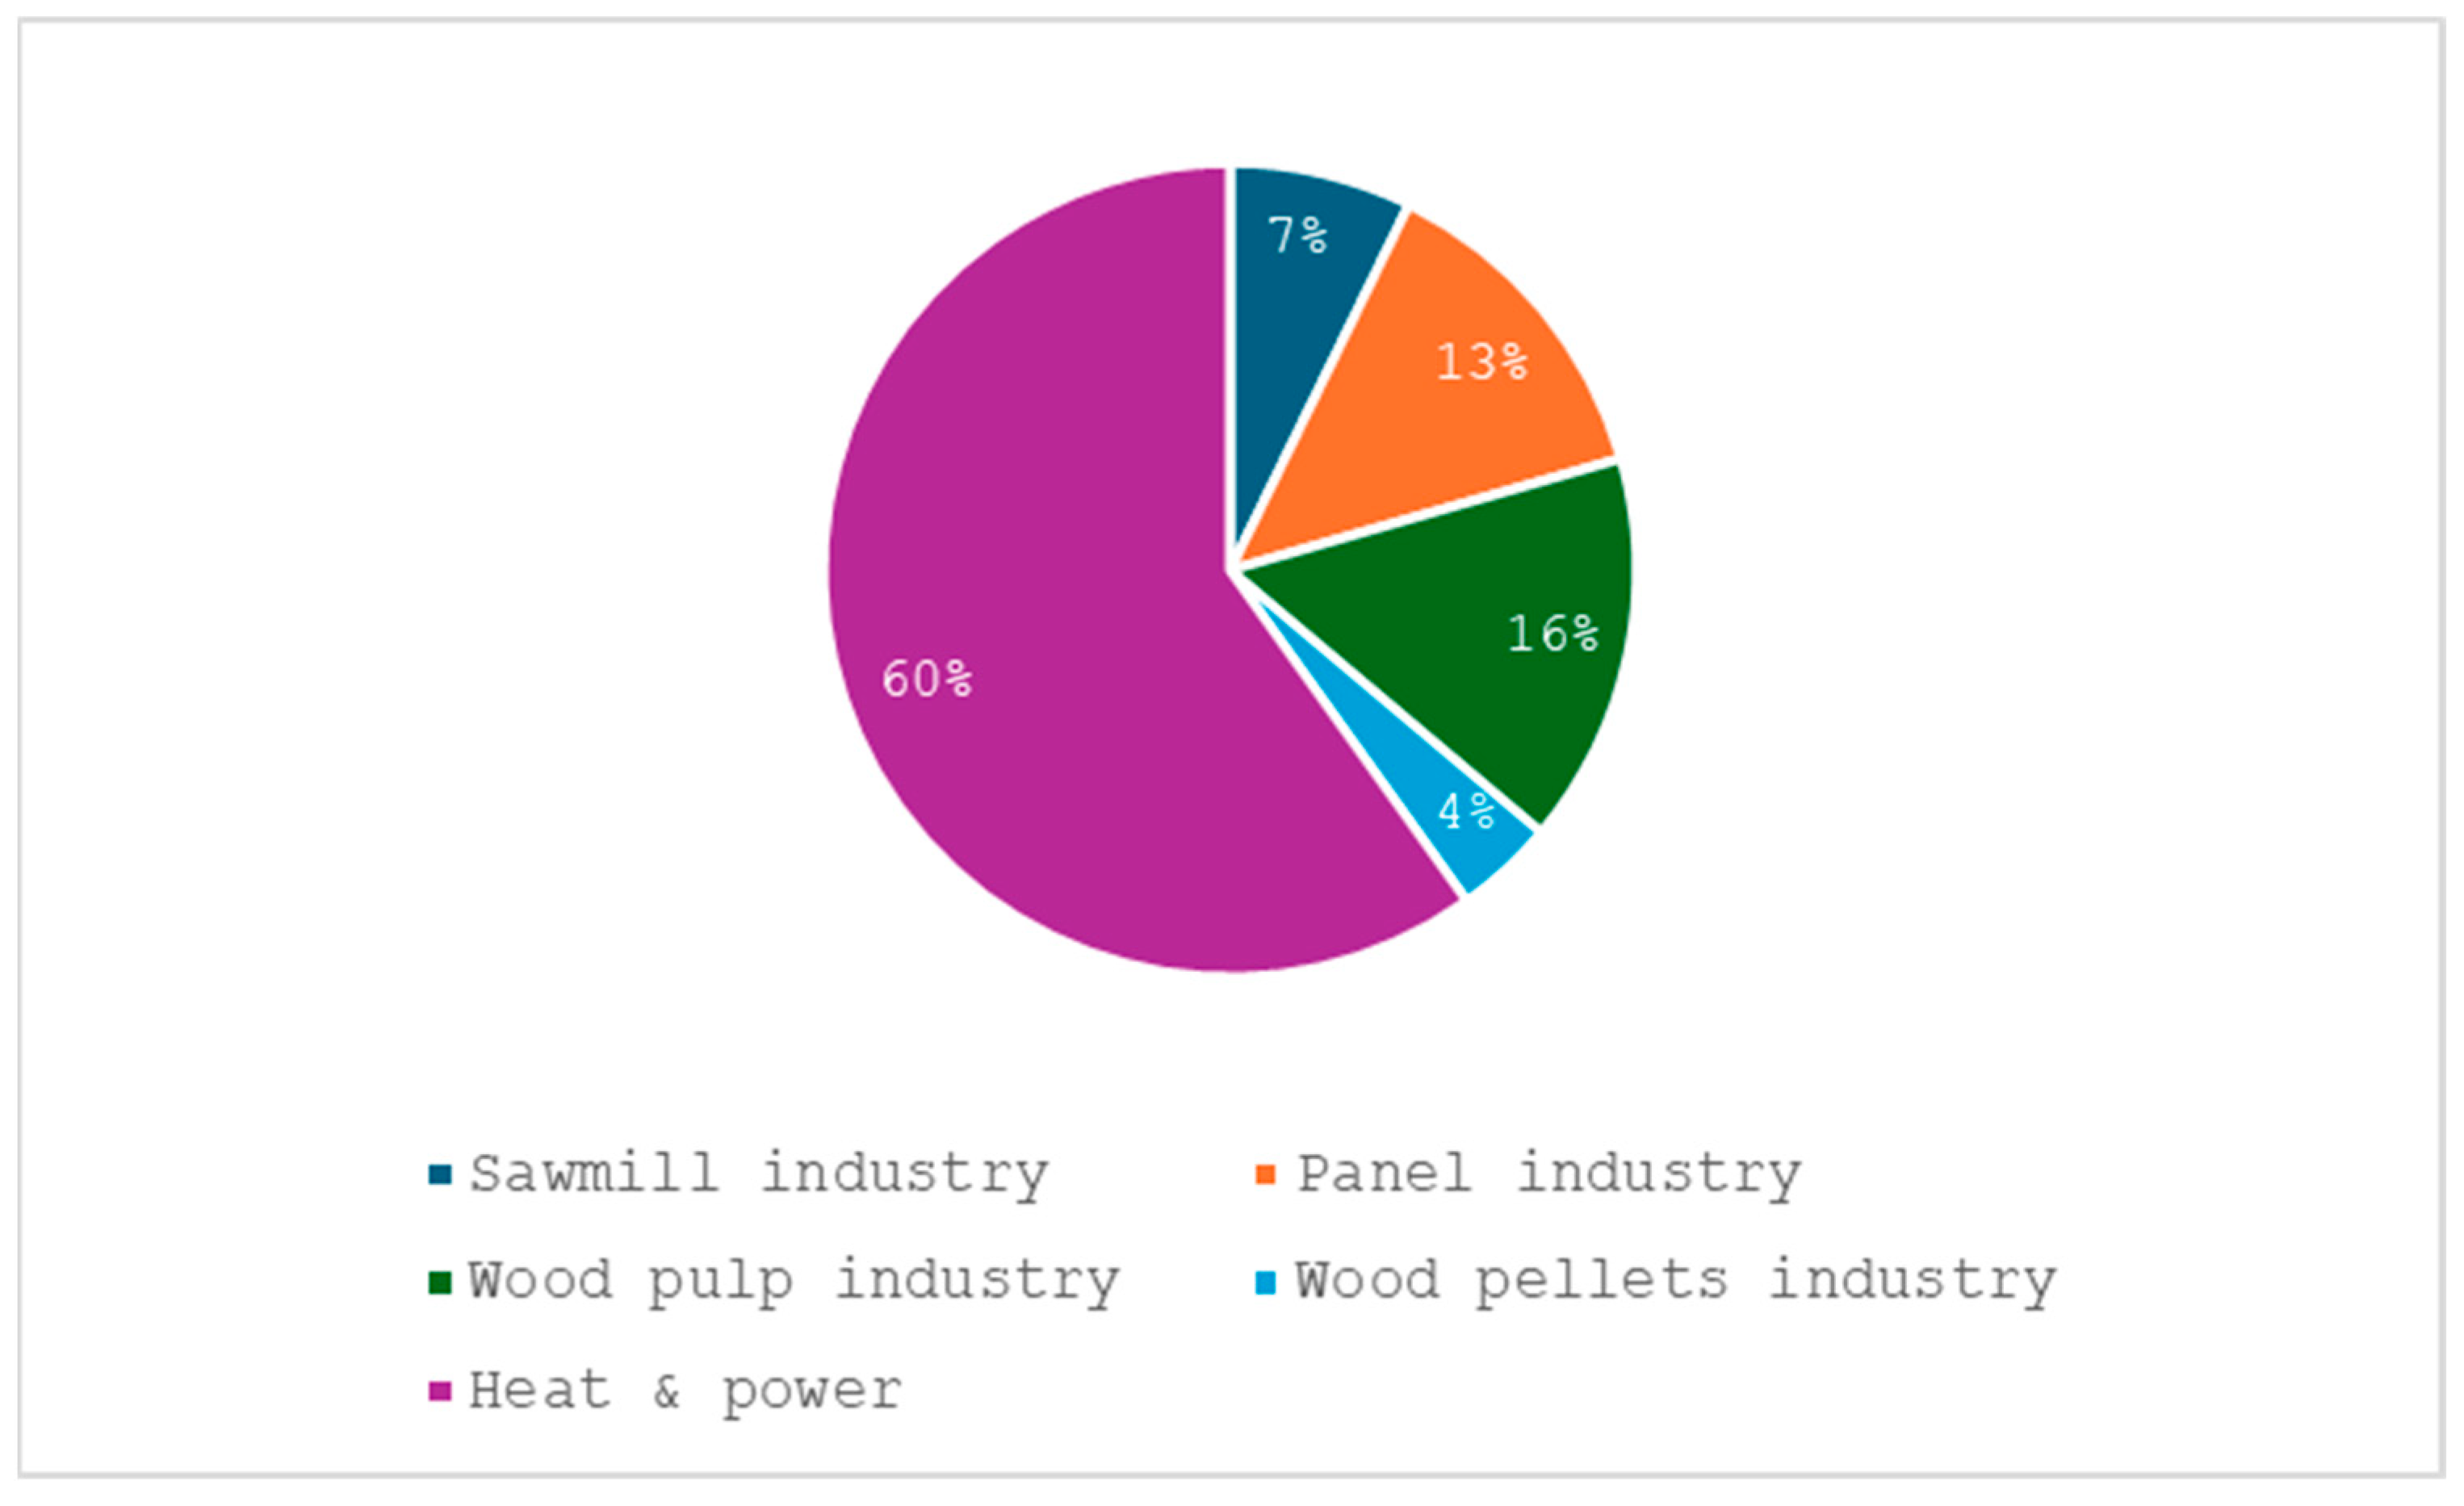
3 ub amounts to a mere 0.2% of total wood uses. The importance of the wood pulp industry in the forest-based industry is striking. This industry is the largest material user of wood, followed by sawmilling, while the wood-based panel industry is rather small in comparison (
Figure 6).
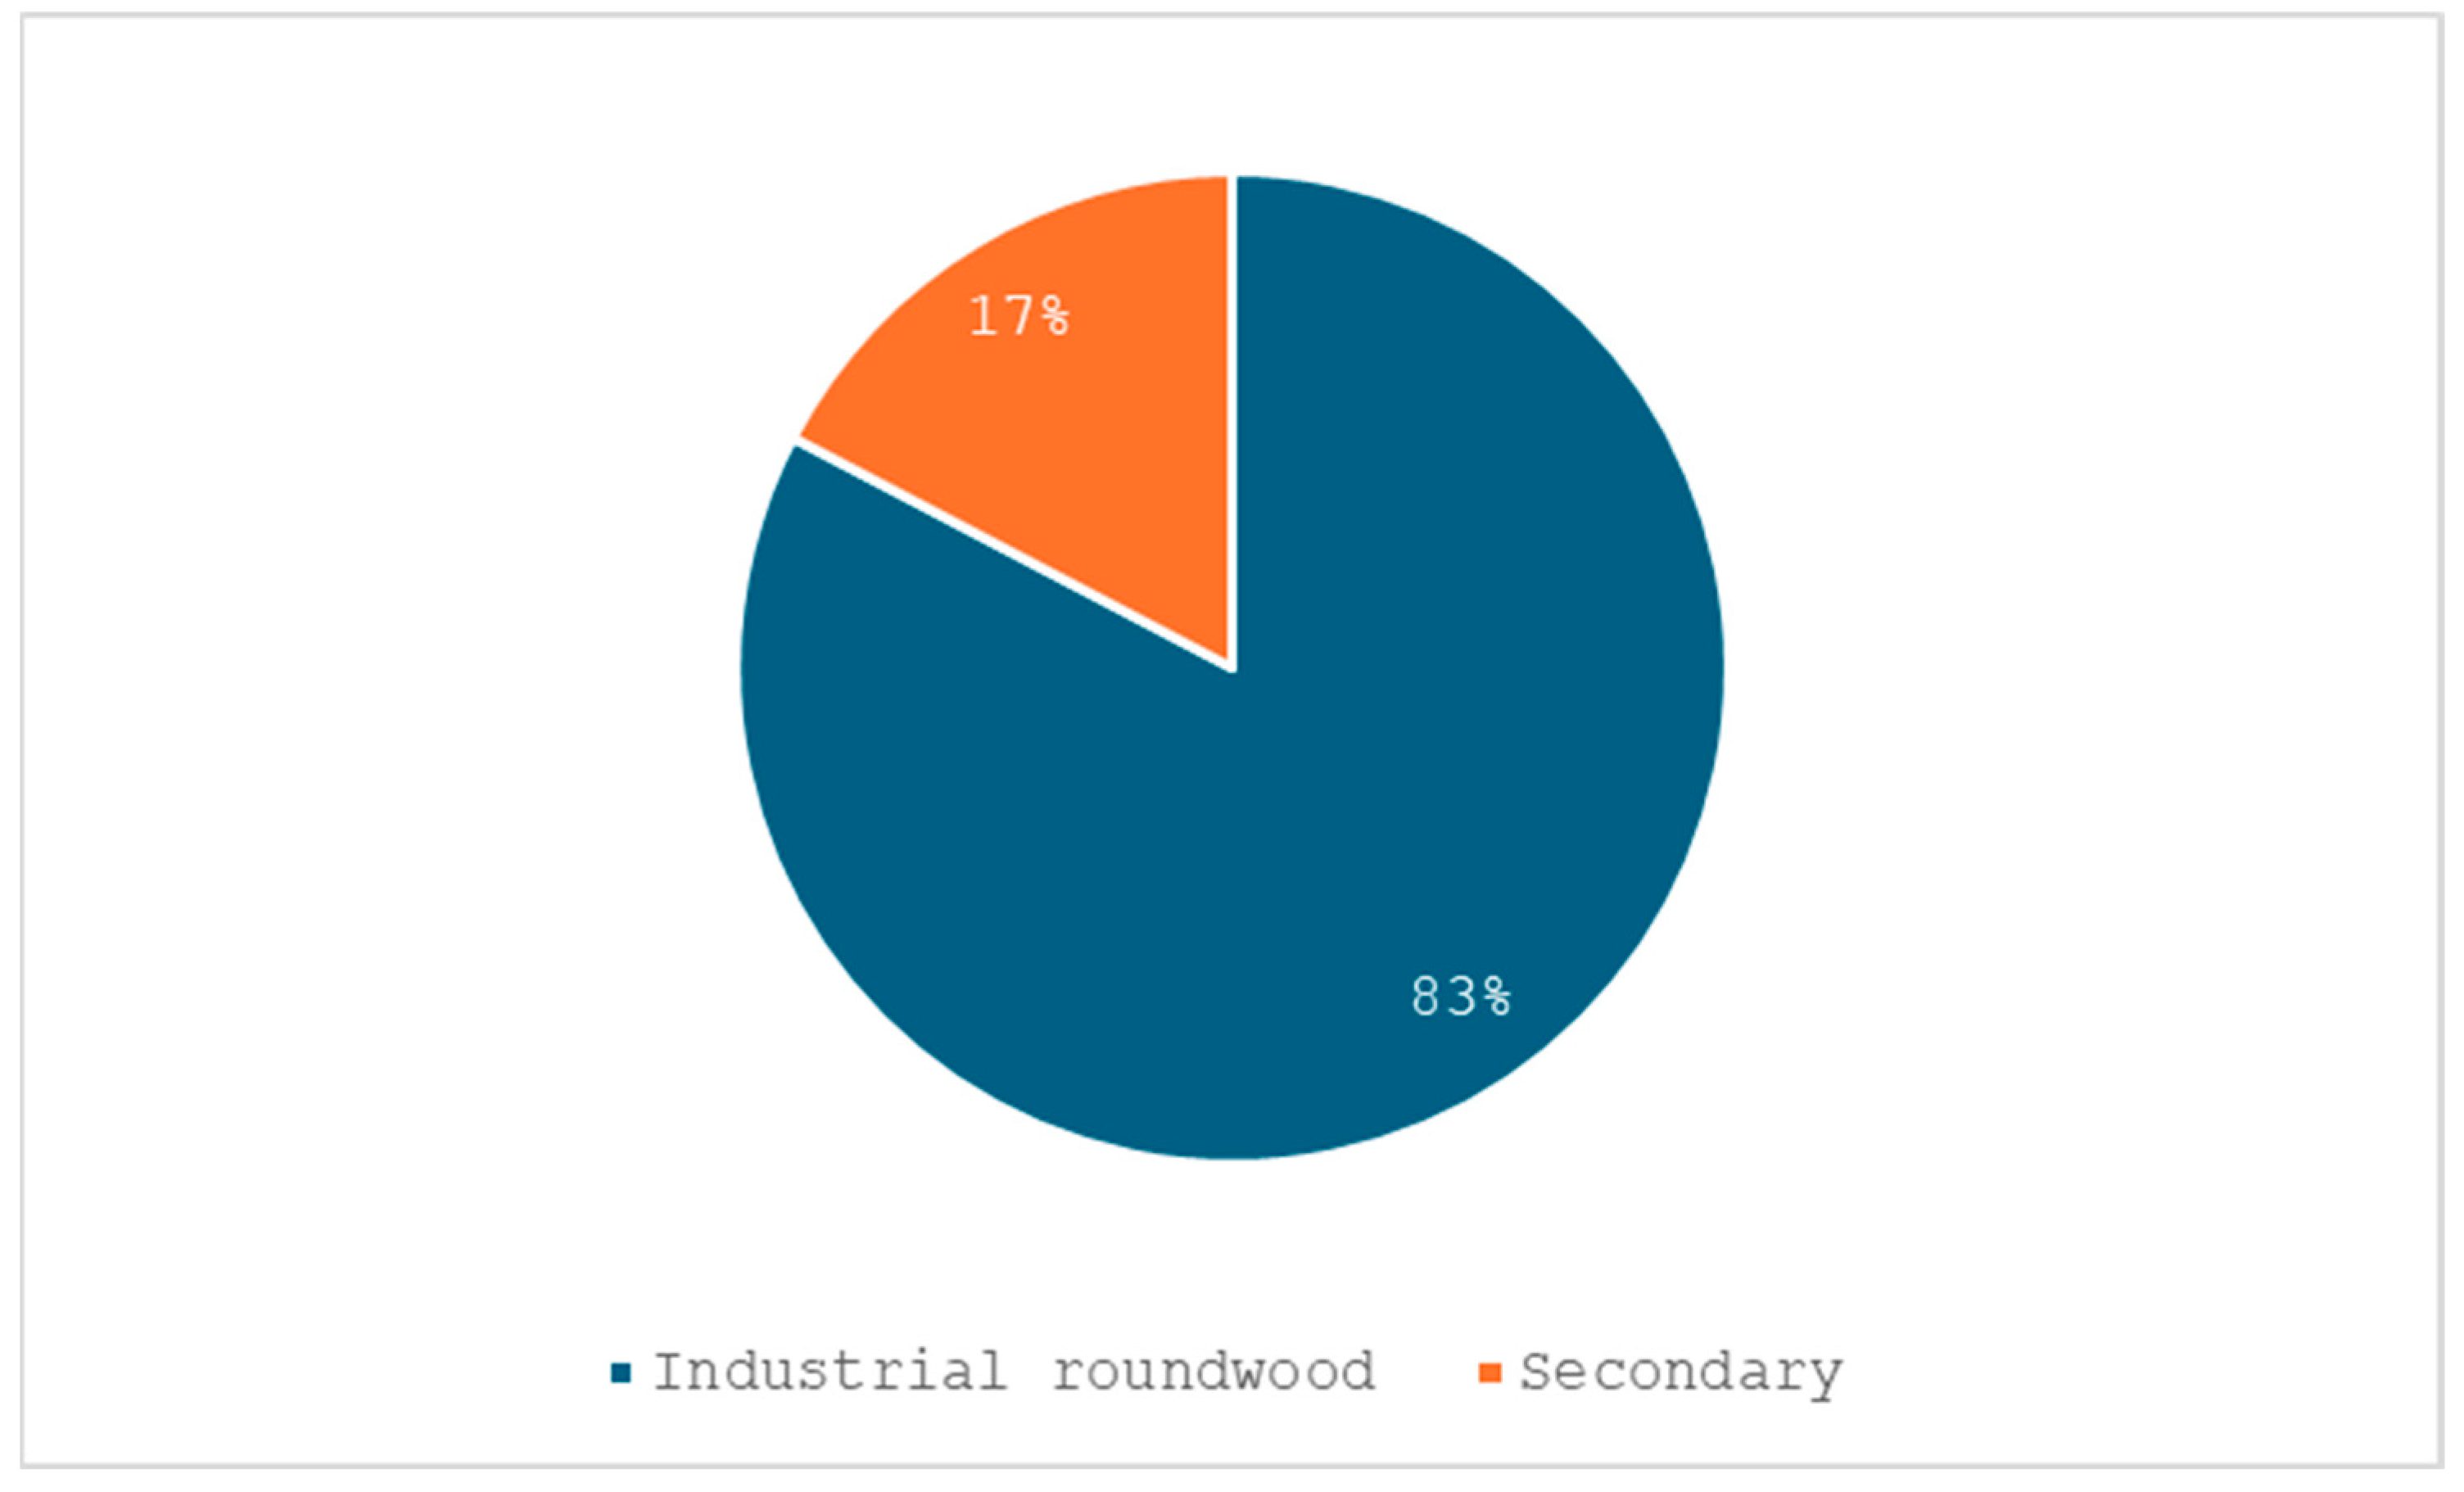
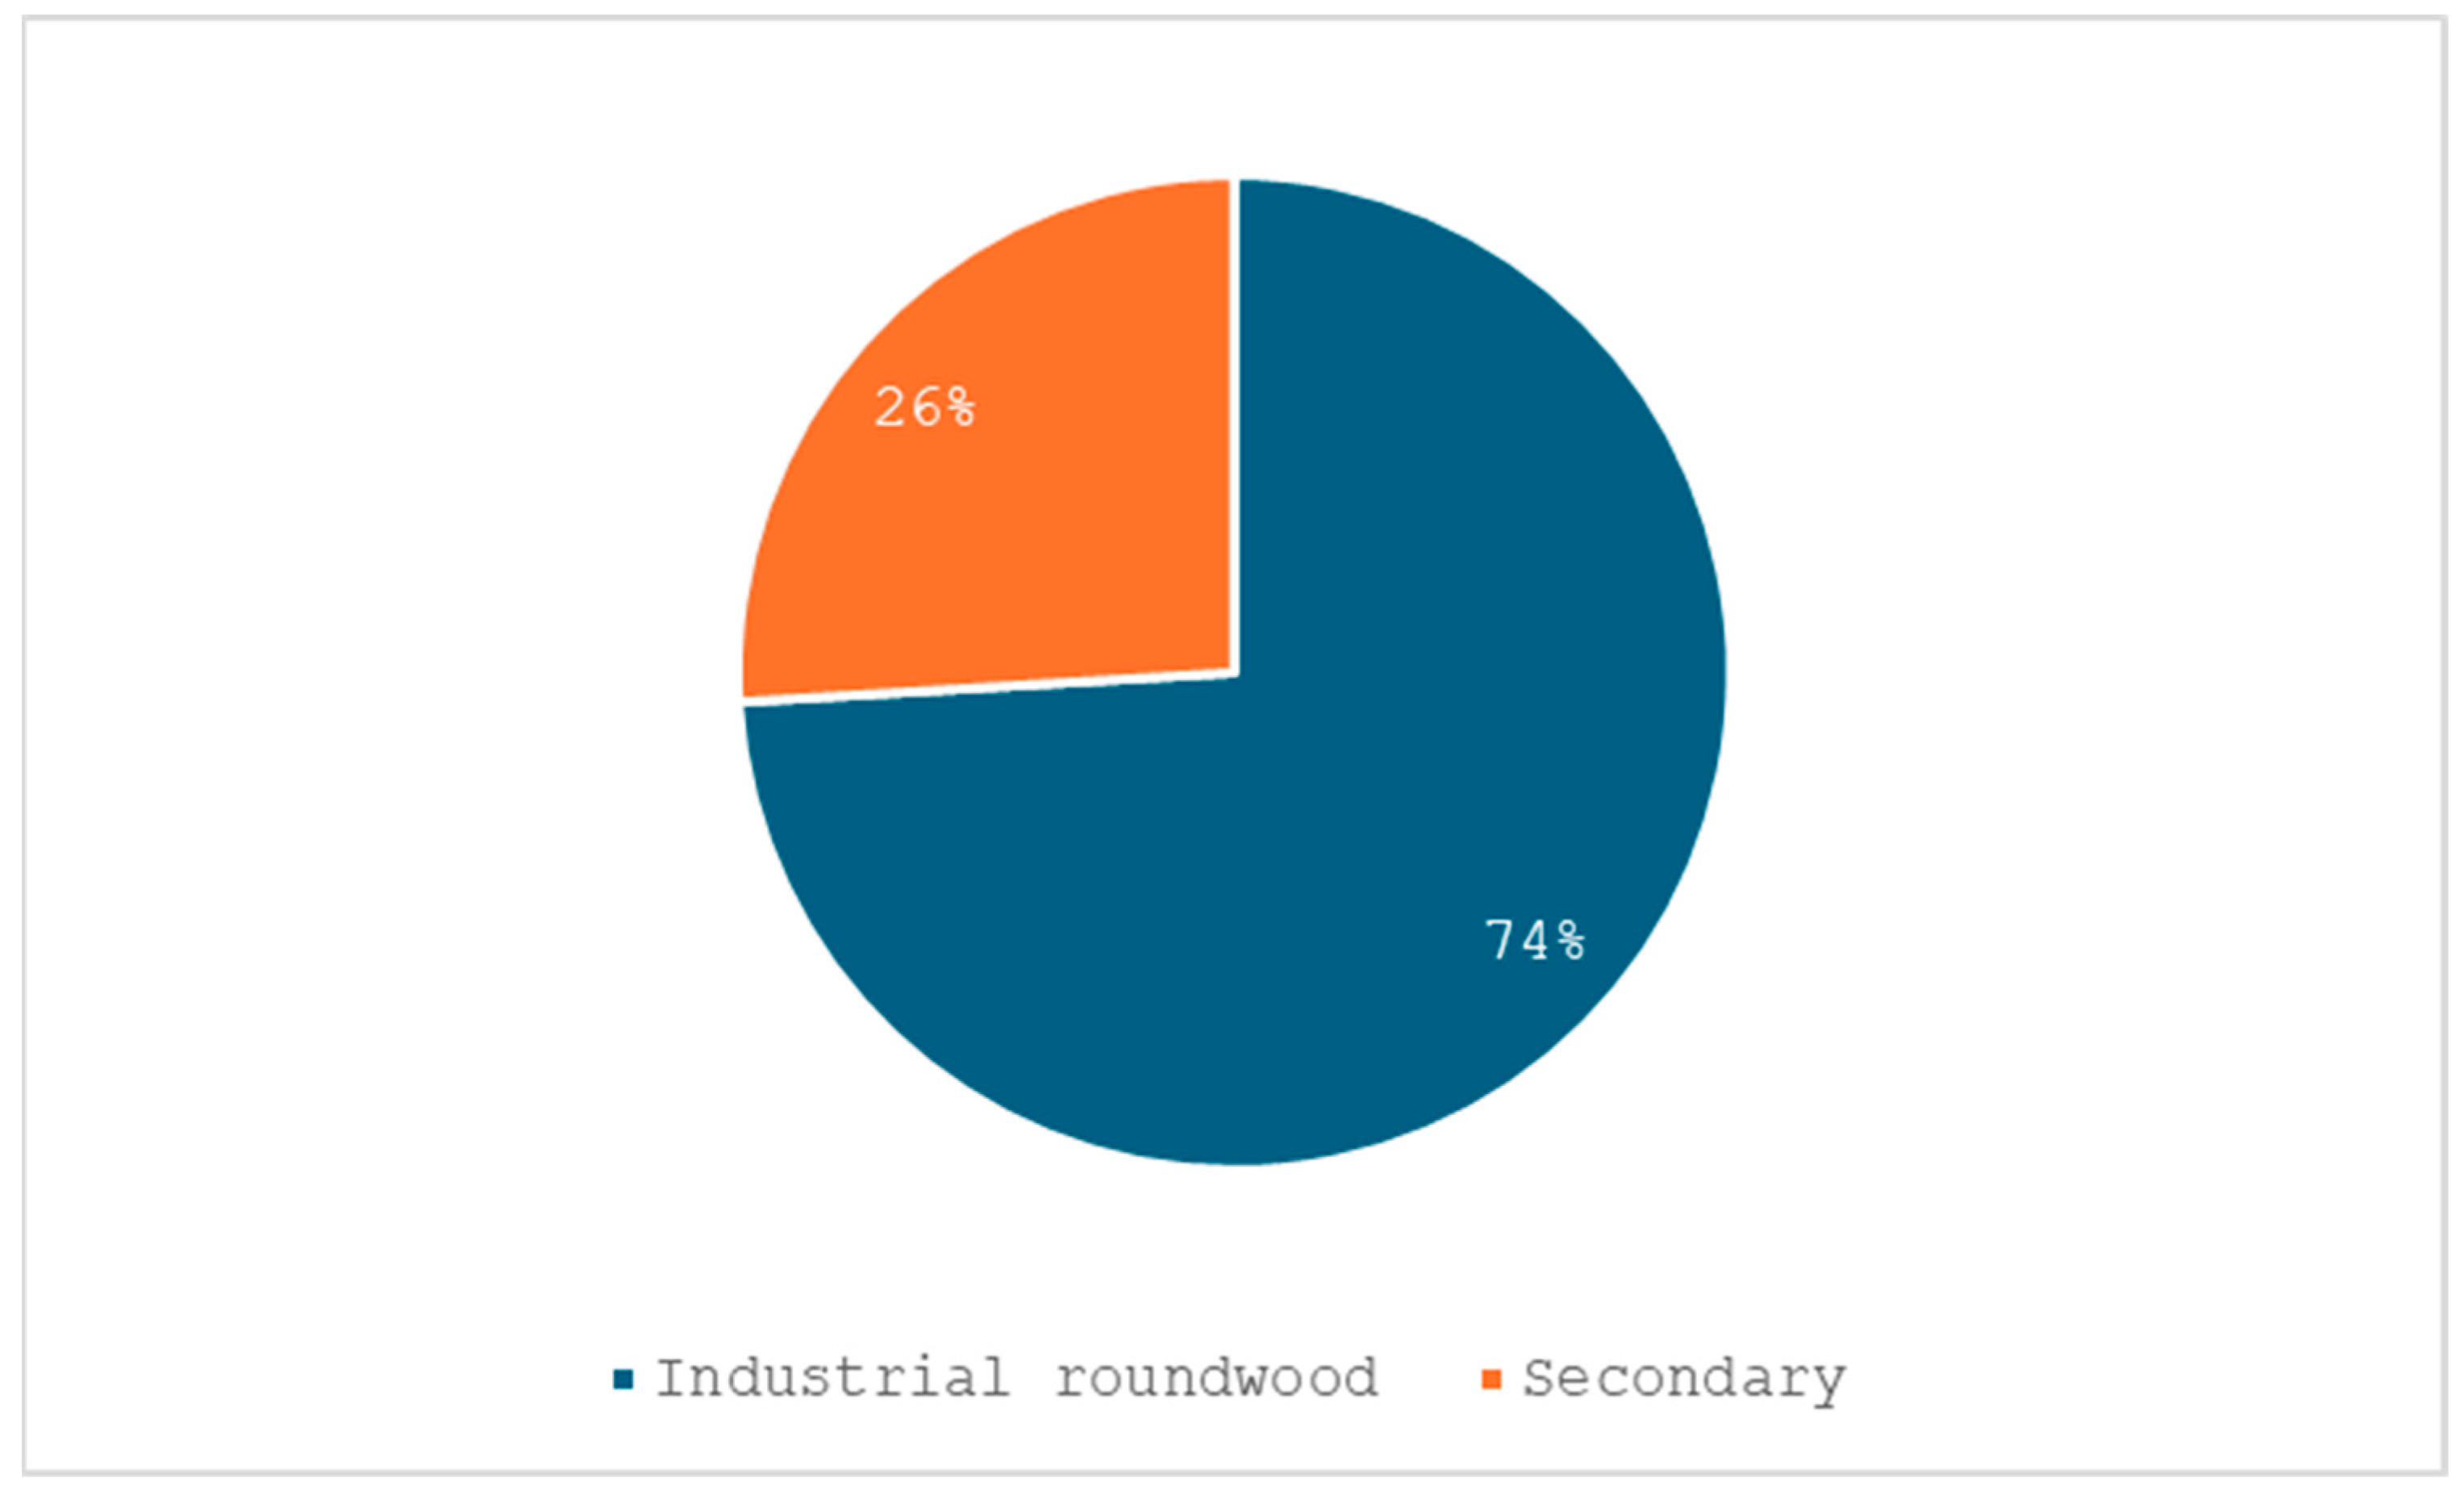
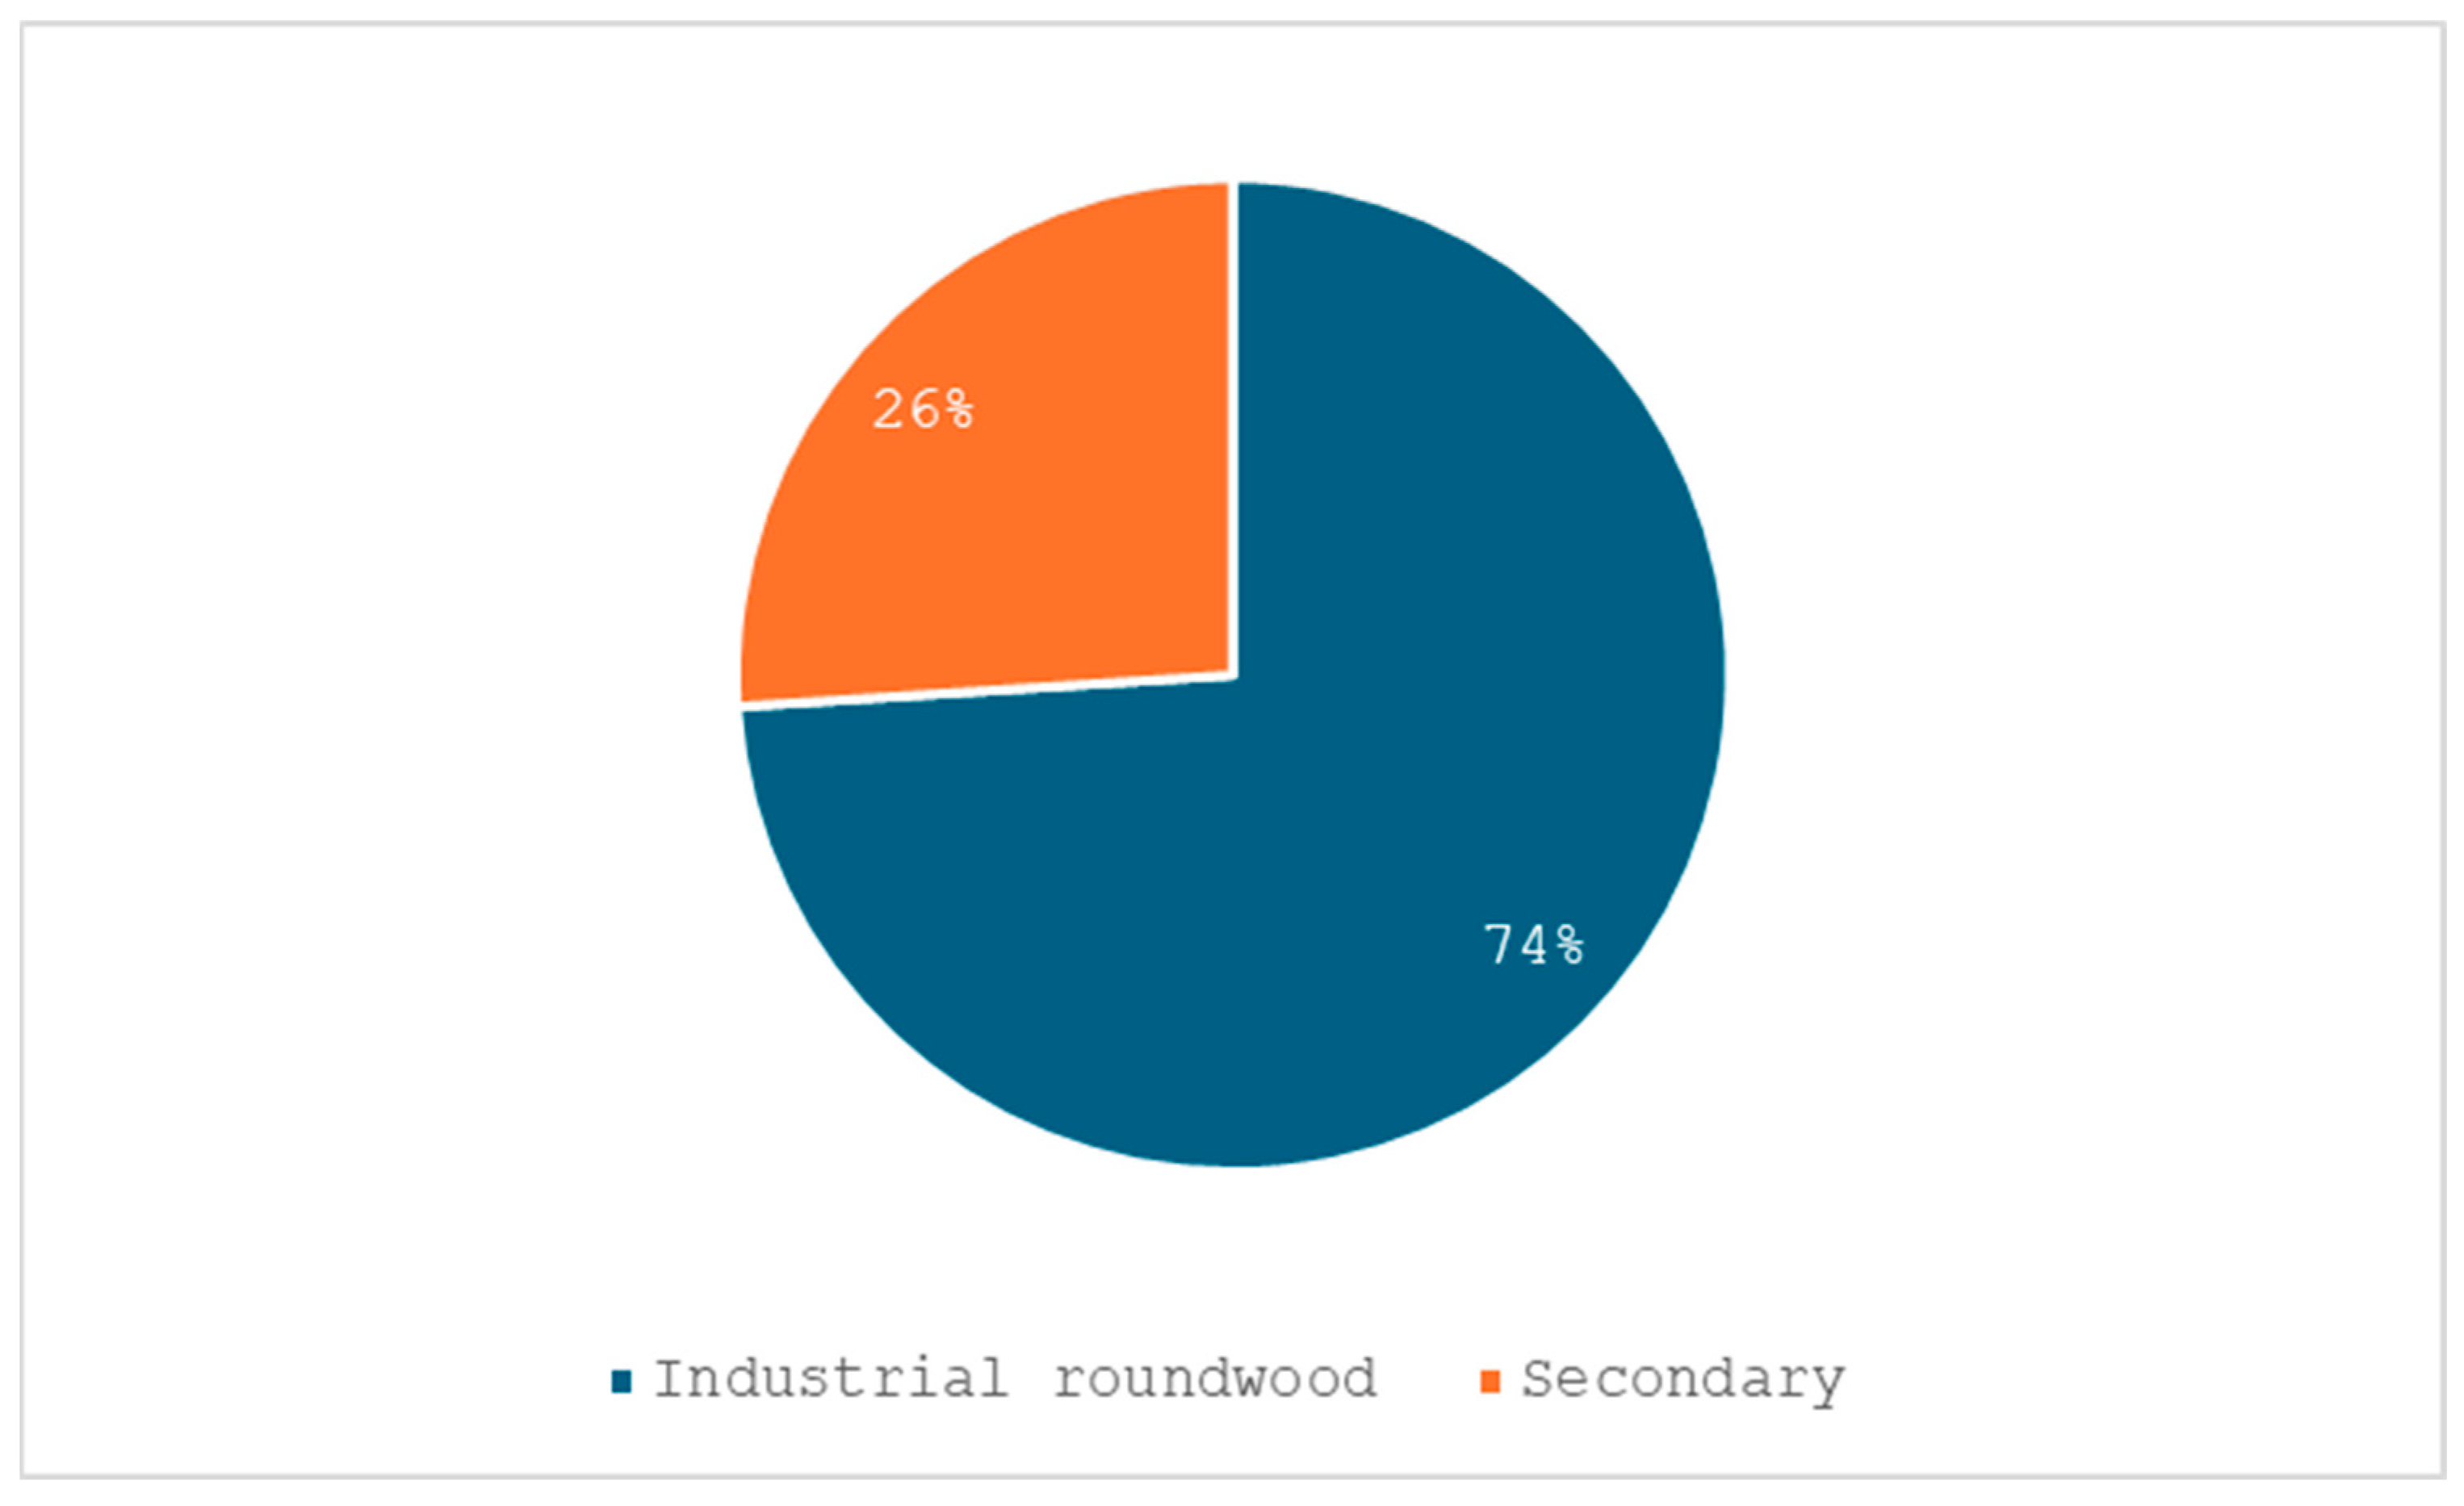
Wood-based manufacturing in all accounts for almost two-thirds of total wood uses. Wood-based manufacturing in the region is mainly based on primary wood sources, estimated at some 167 million m
3 ub, or 83%, while secondary wood sources account for around 17% (
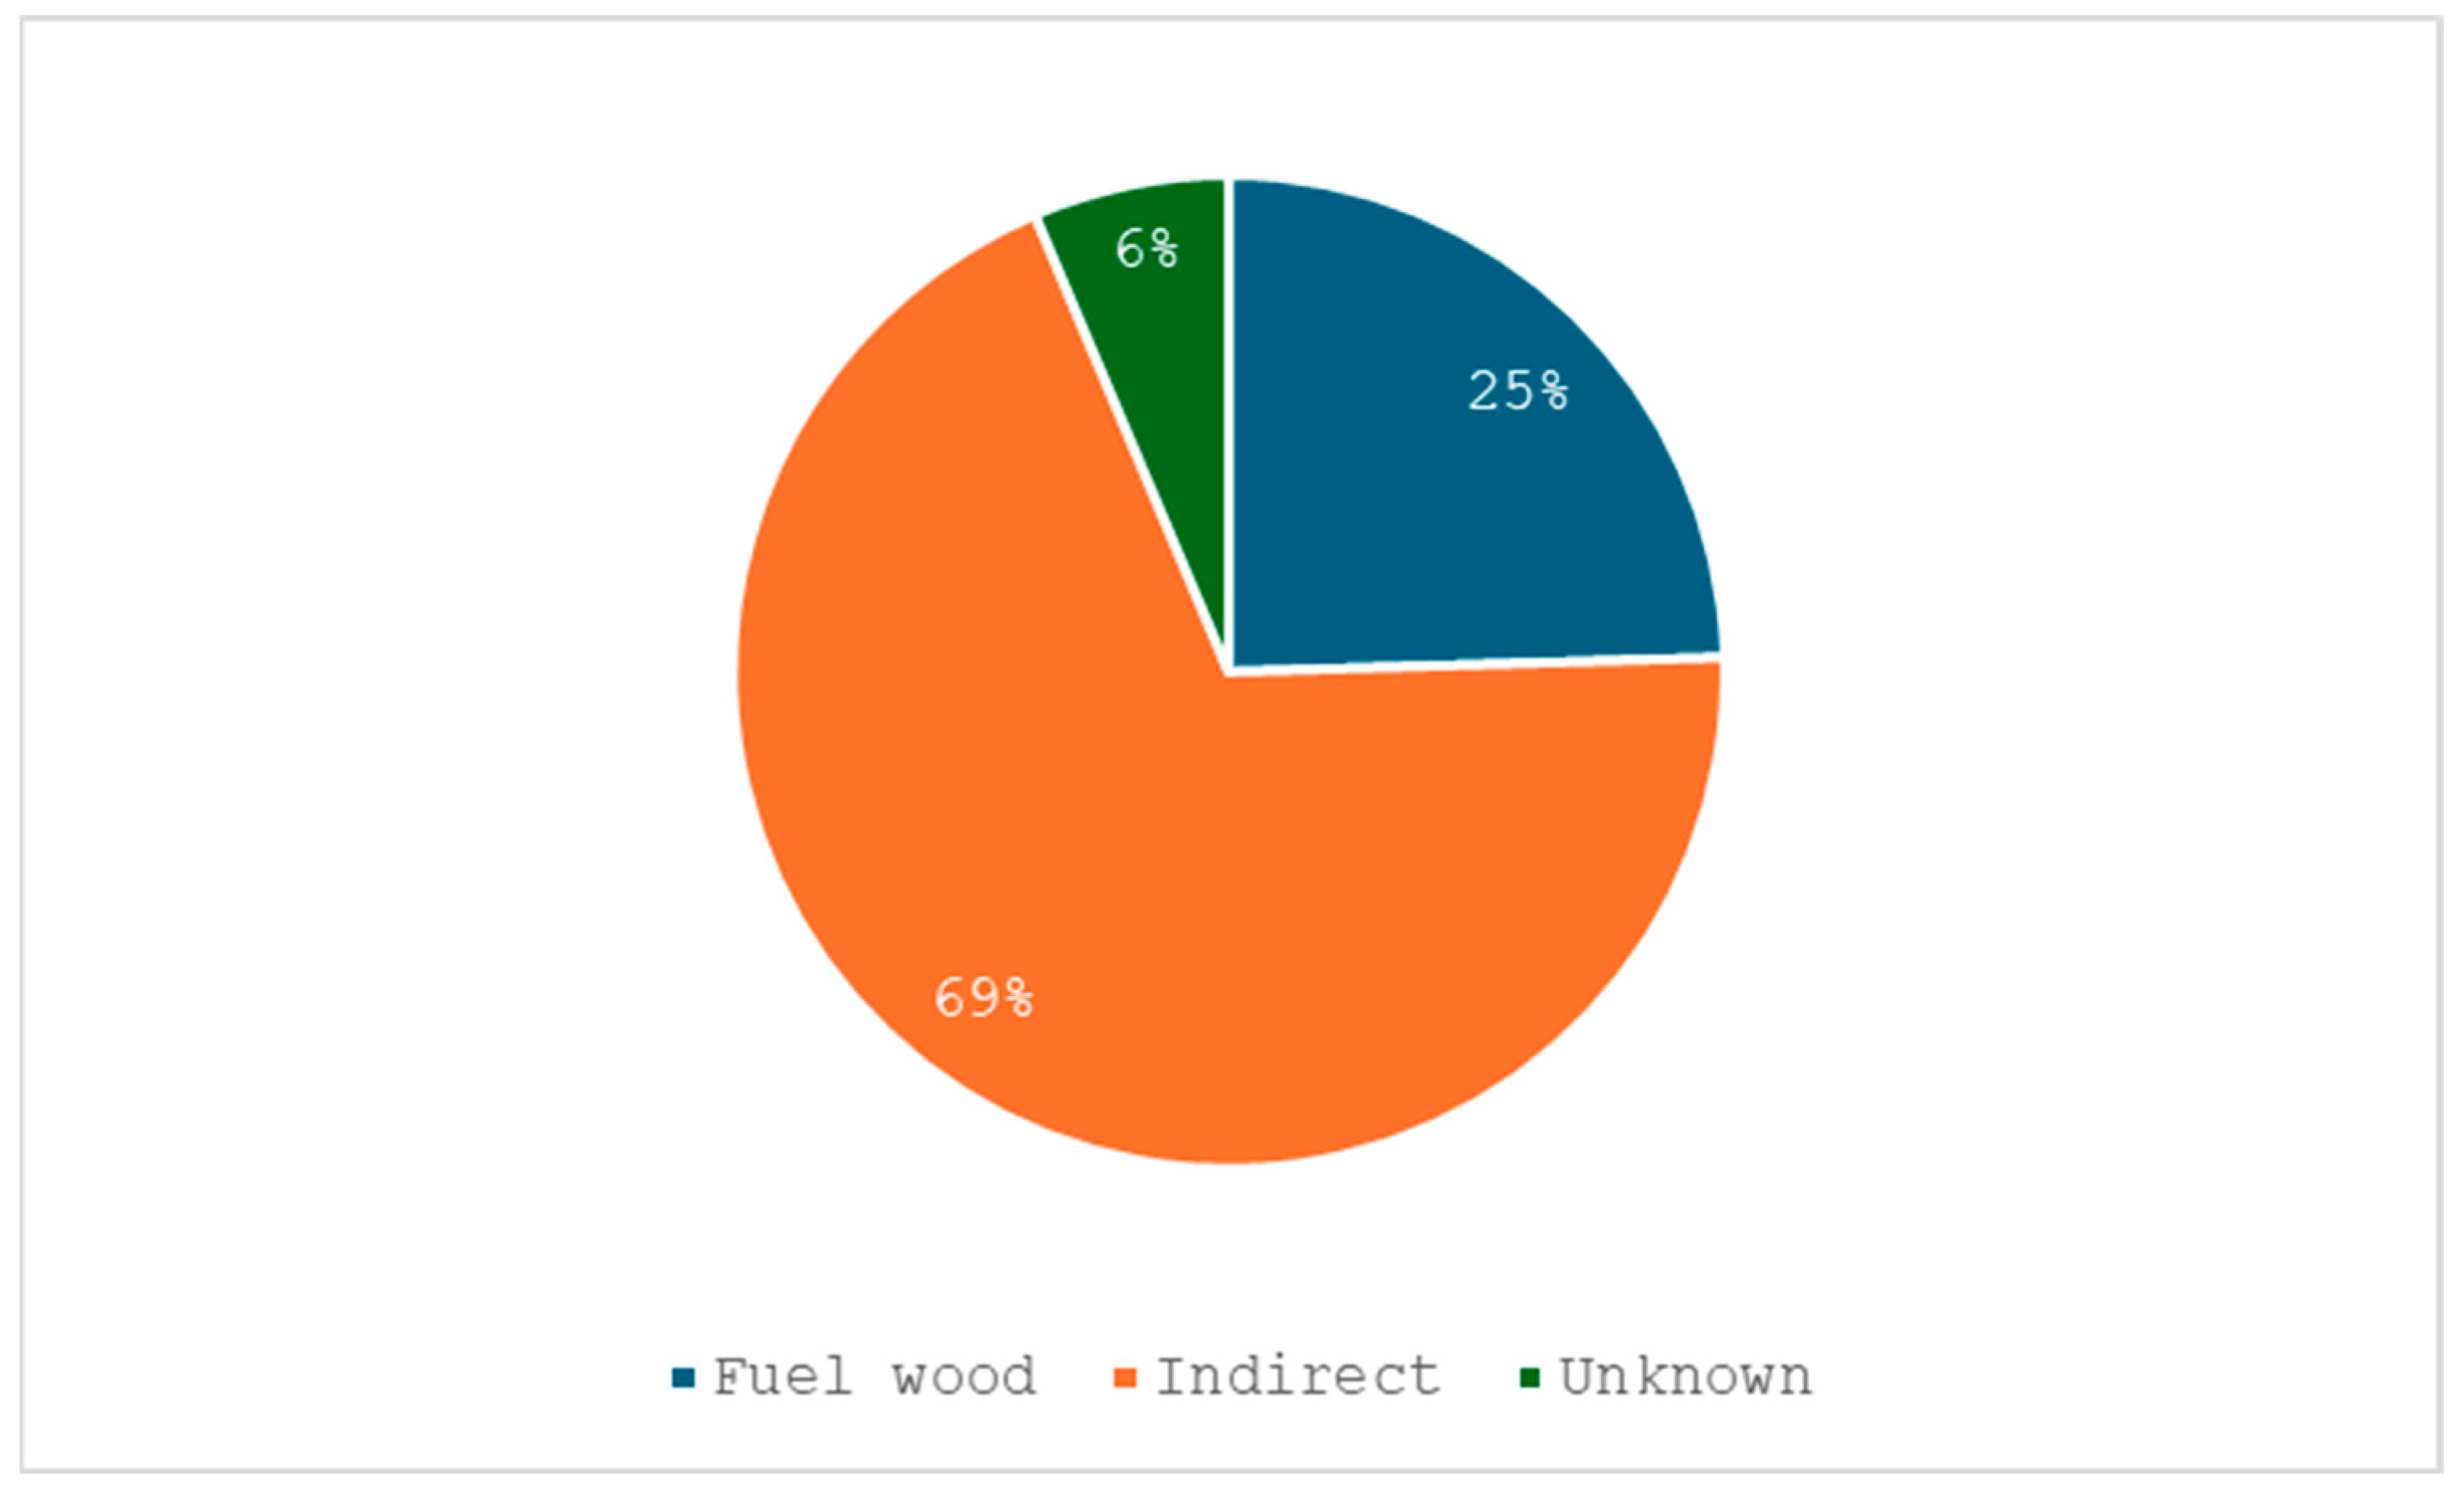
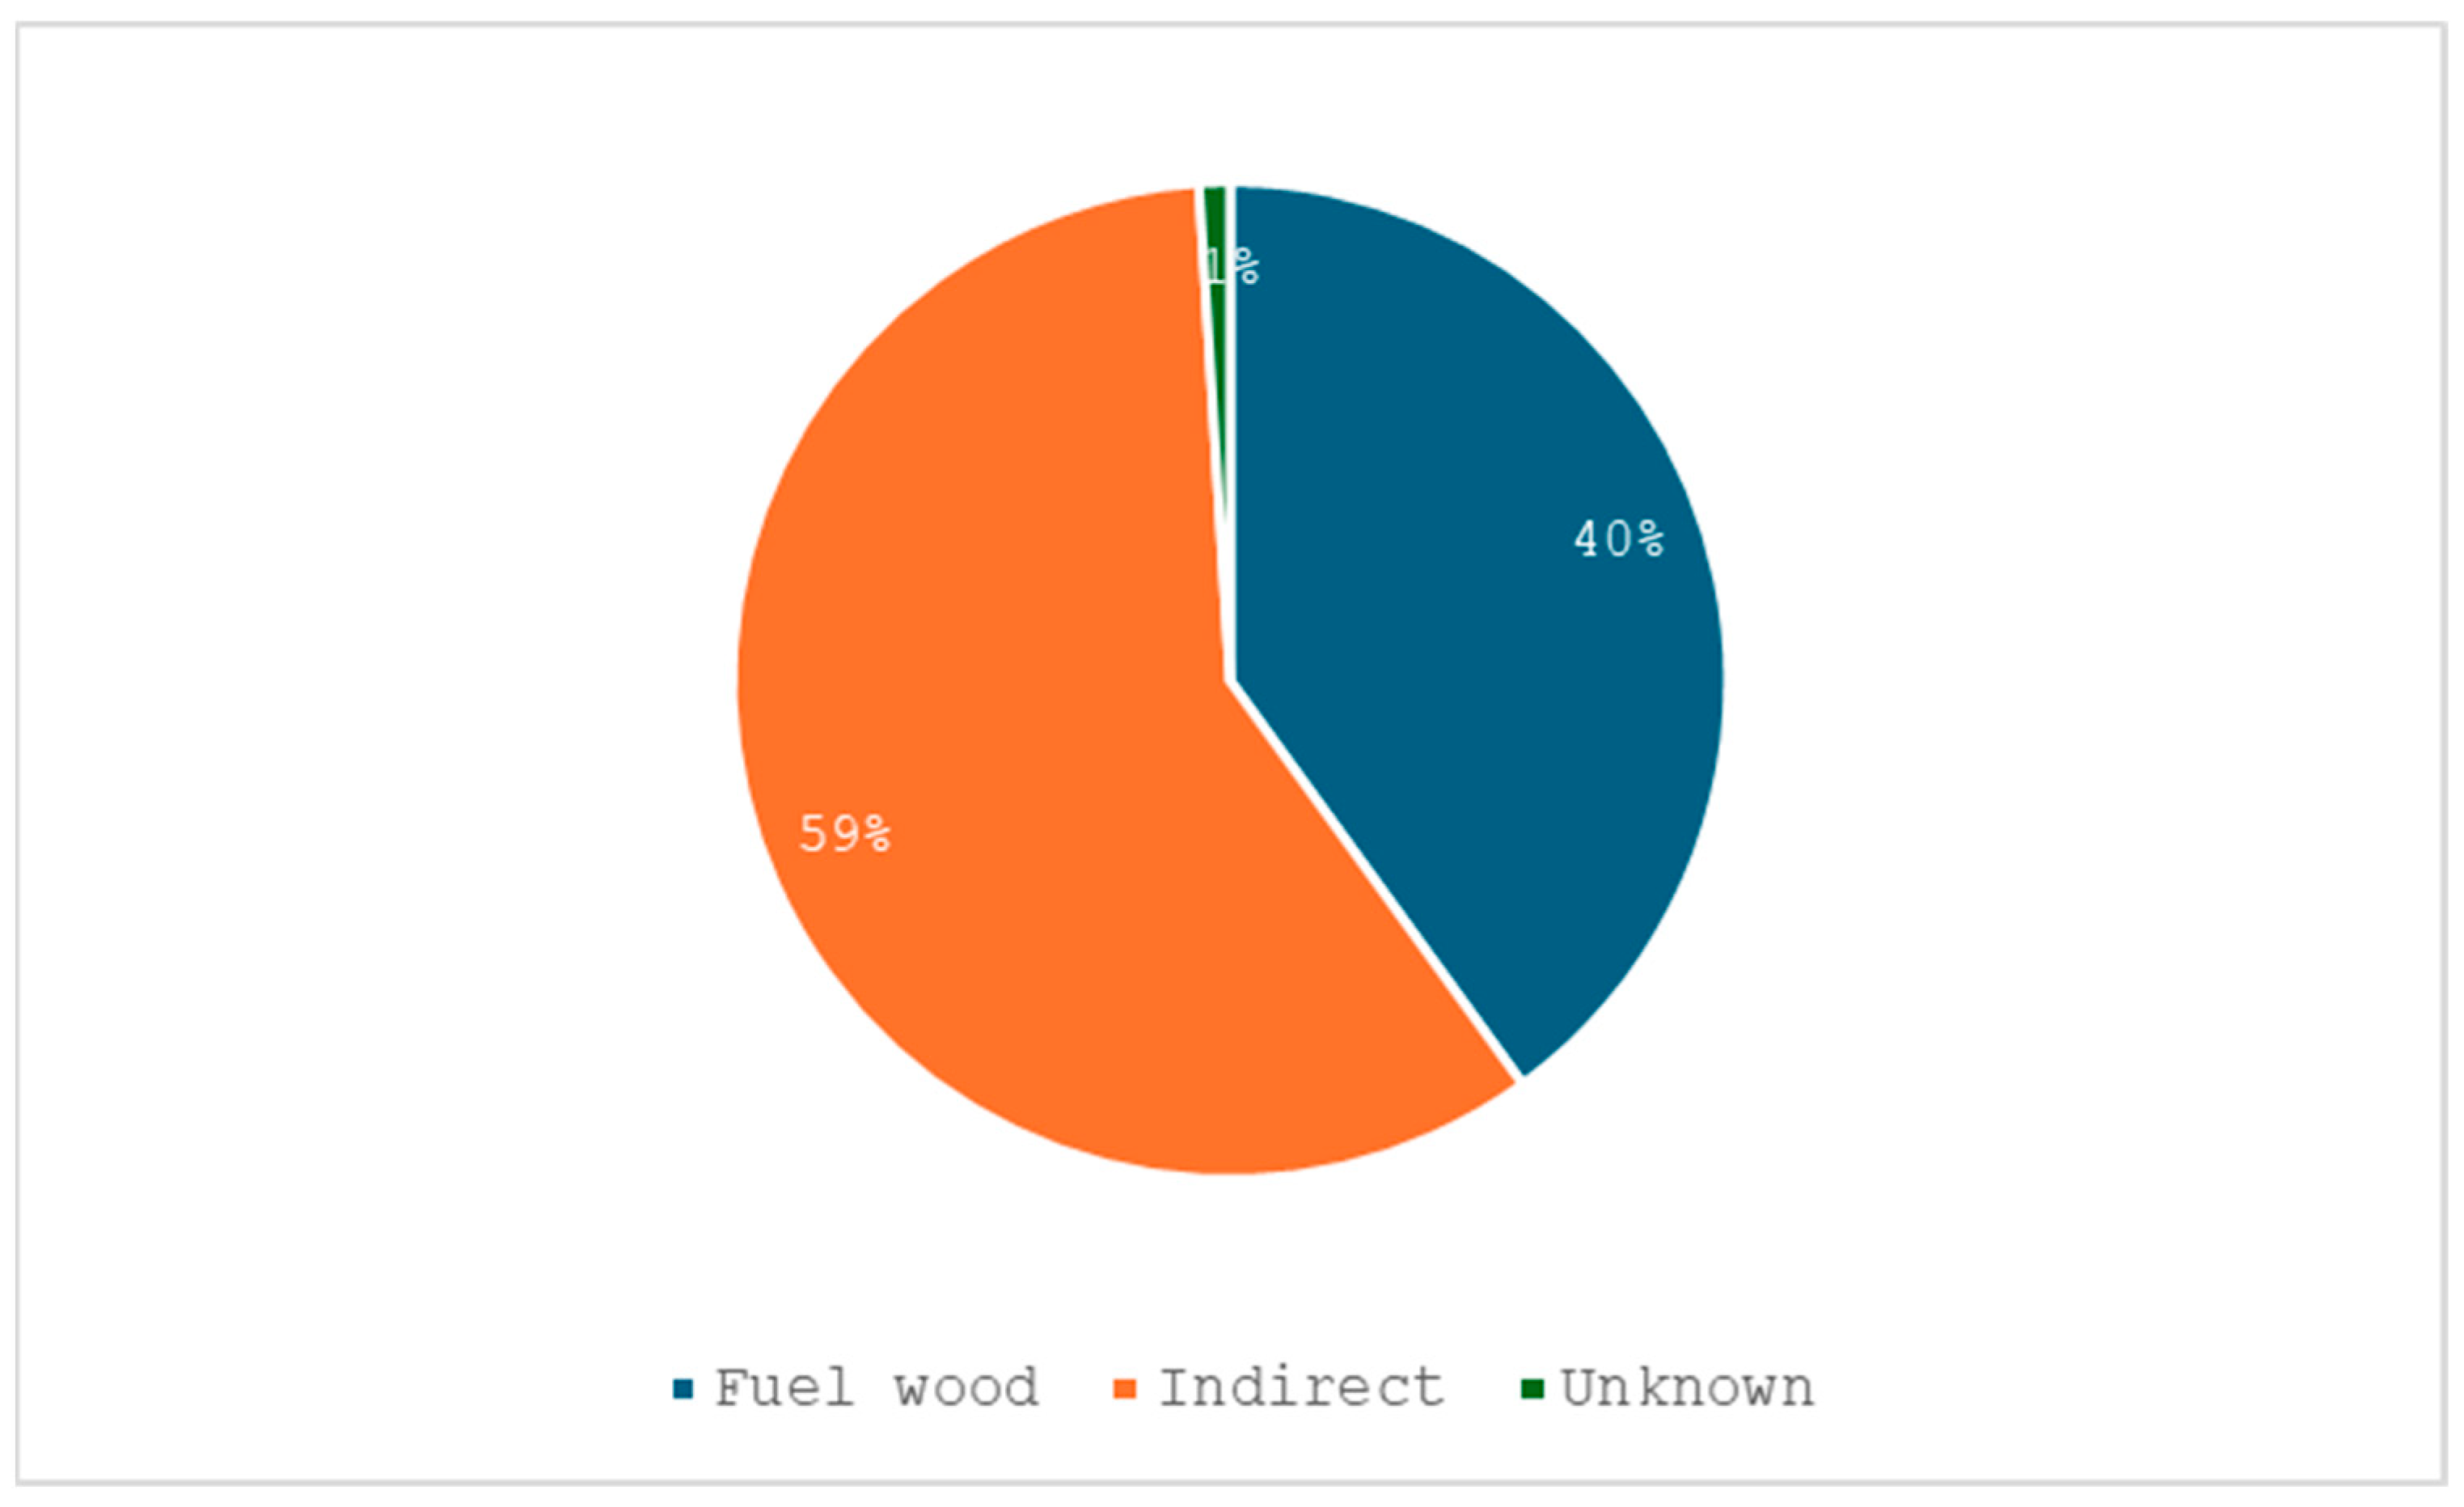
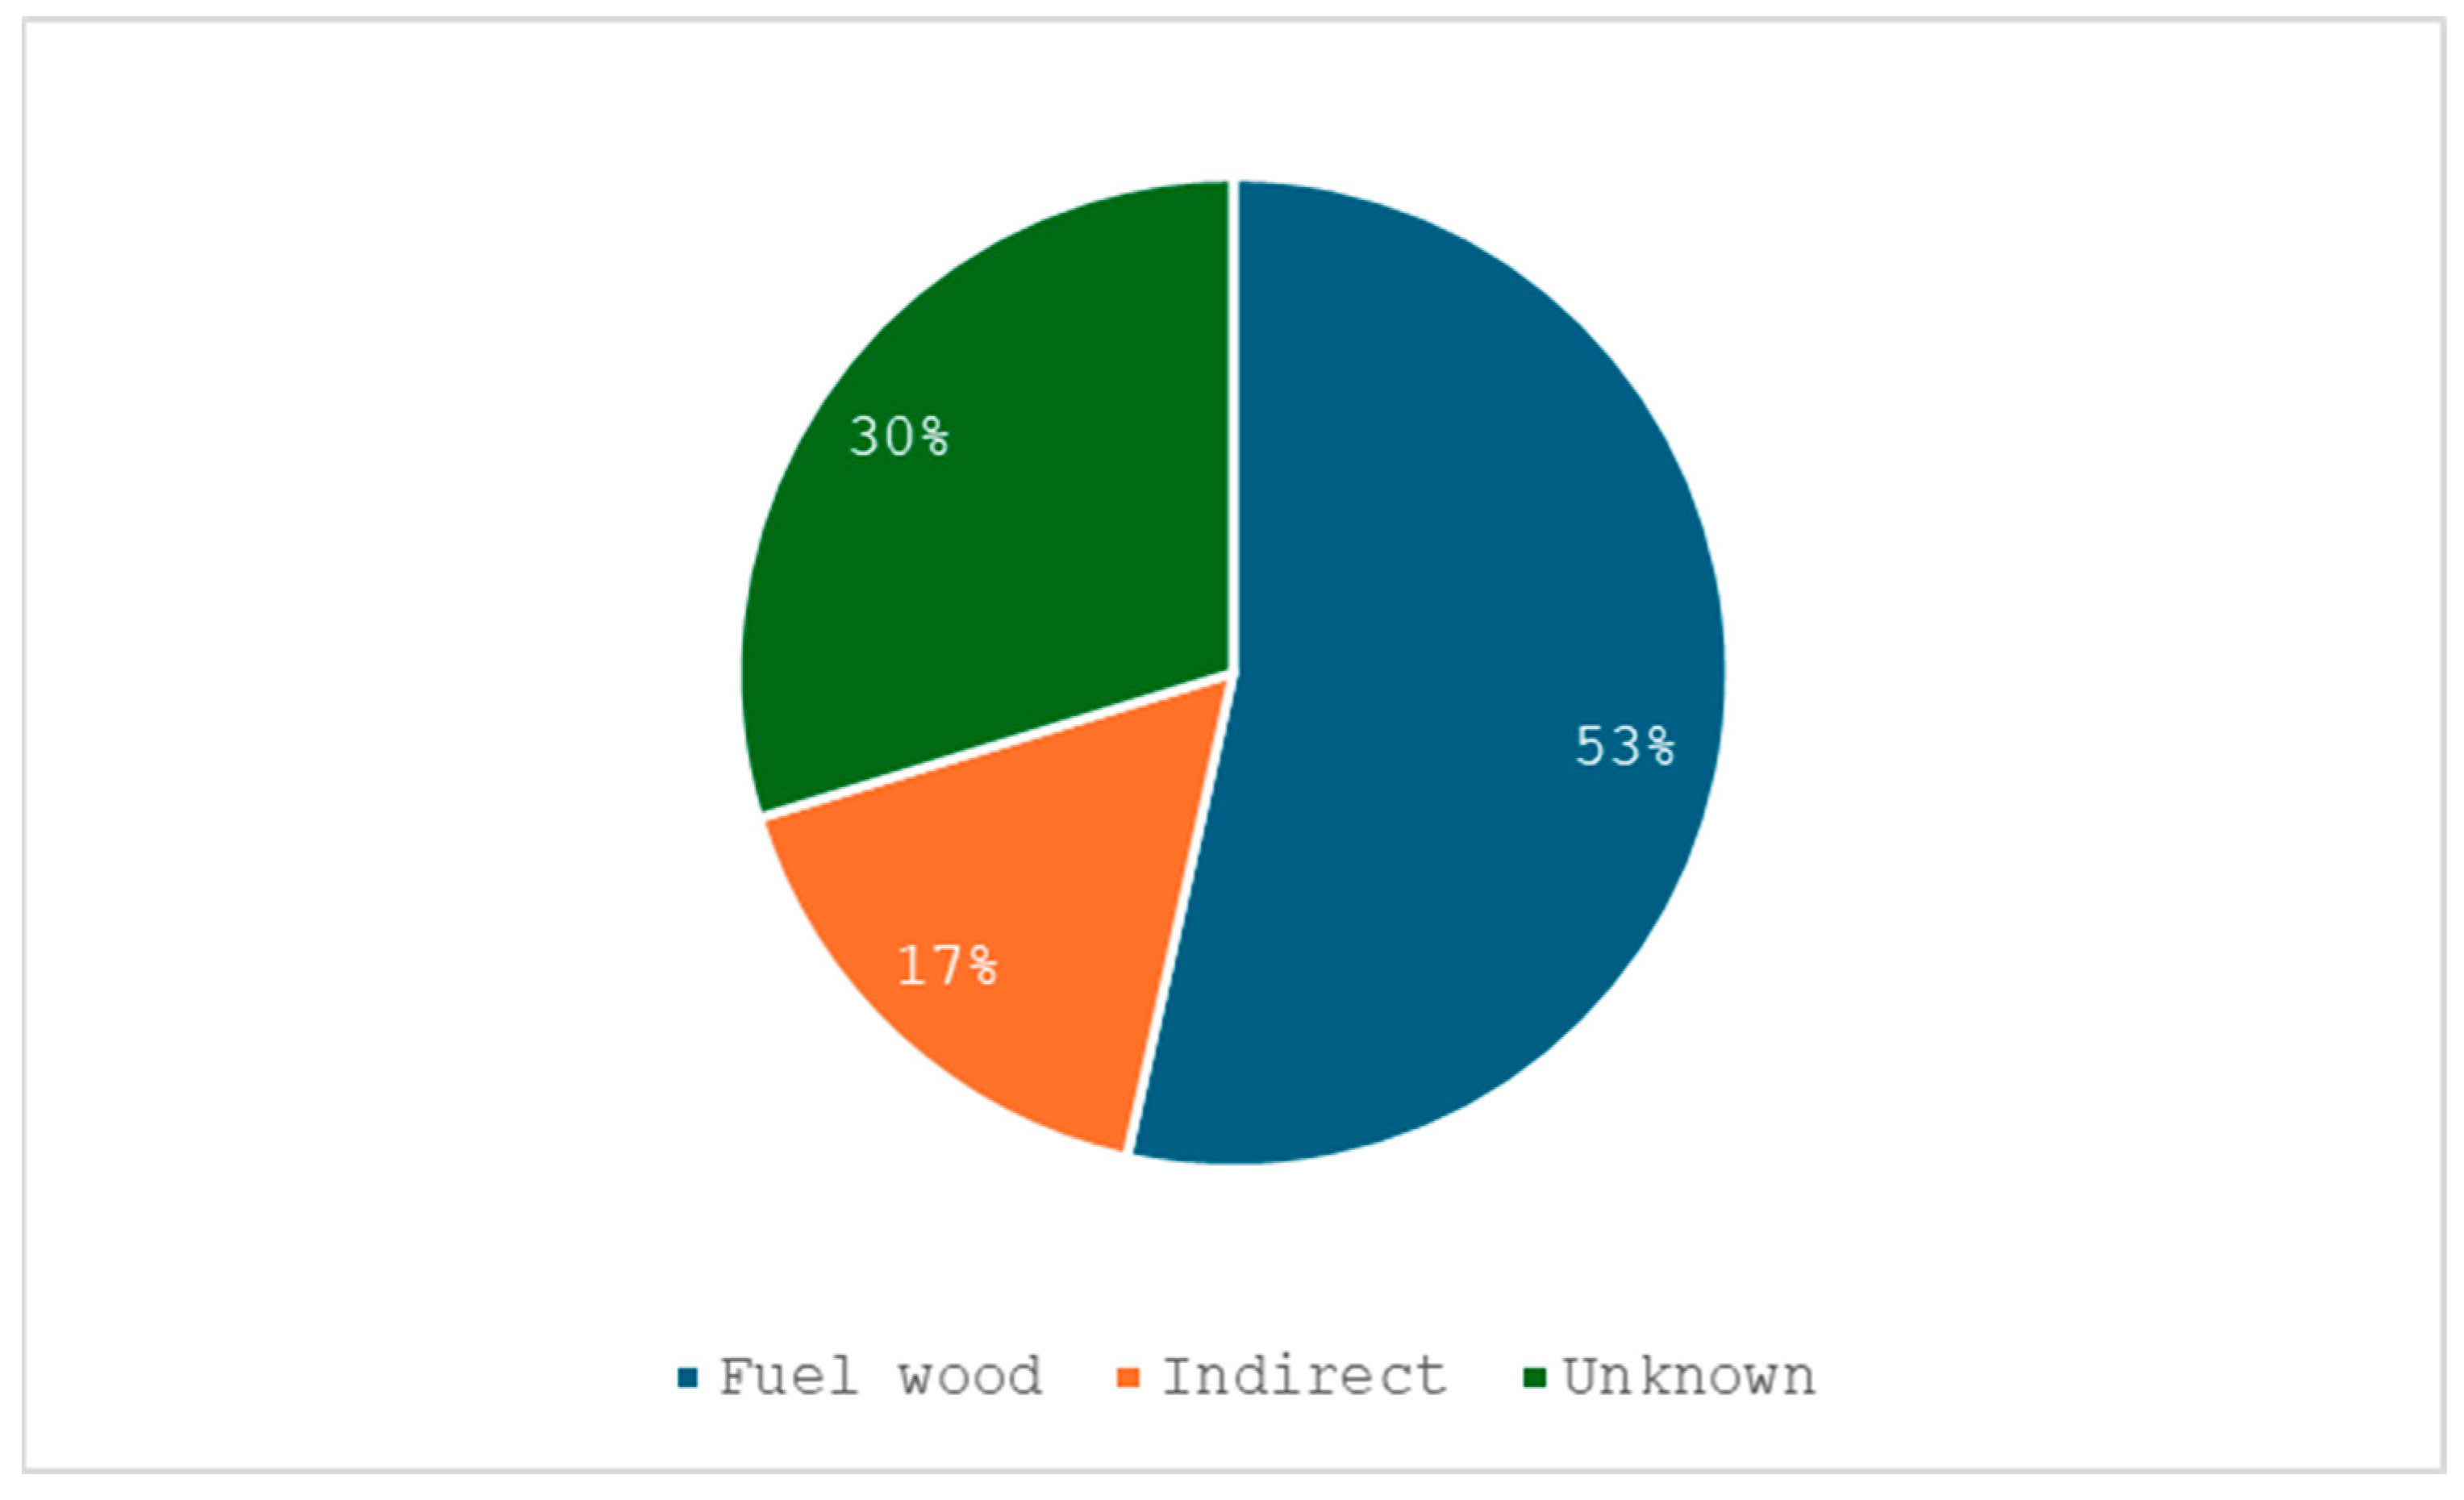
Figure 7). This circumstance is a reflection of the region being rich in forest resources and sparsely populated. Coniferous species dominate, accounting for 83% of the IRW used. Secondary woody biomass (“indirect wood”) is the largest reported source of wood-based bioenergy, accounting for 69%, or 80 million m
3 ub (
Figure 8), of which black liquor accounts for more than half (
Table 4). Wood of unknown origin accounts for six percent of energy wood uses. Energy uses account for only 15% of total primary wood use.
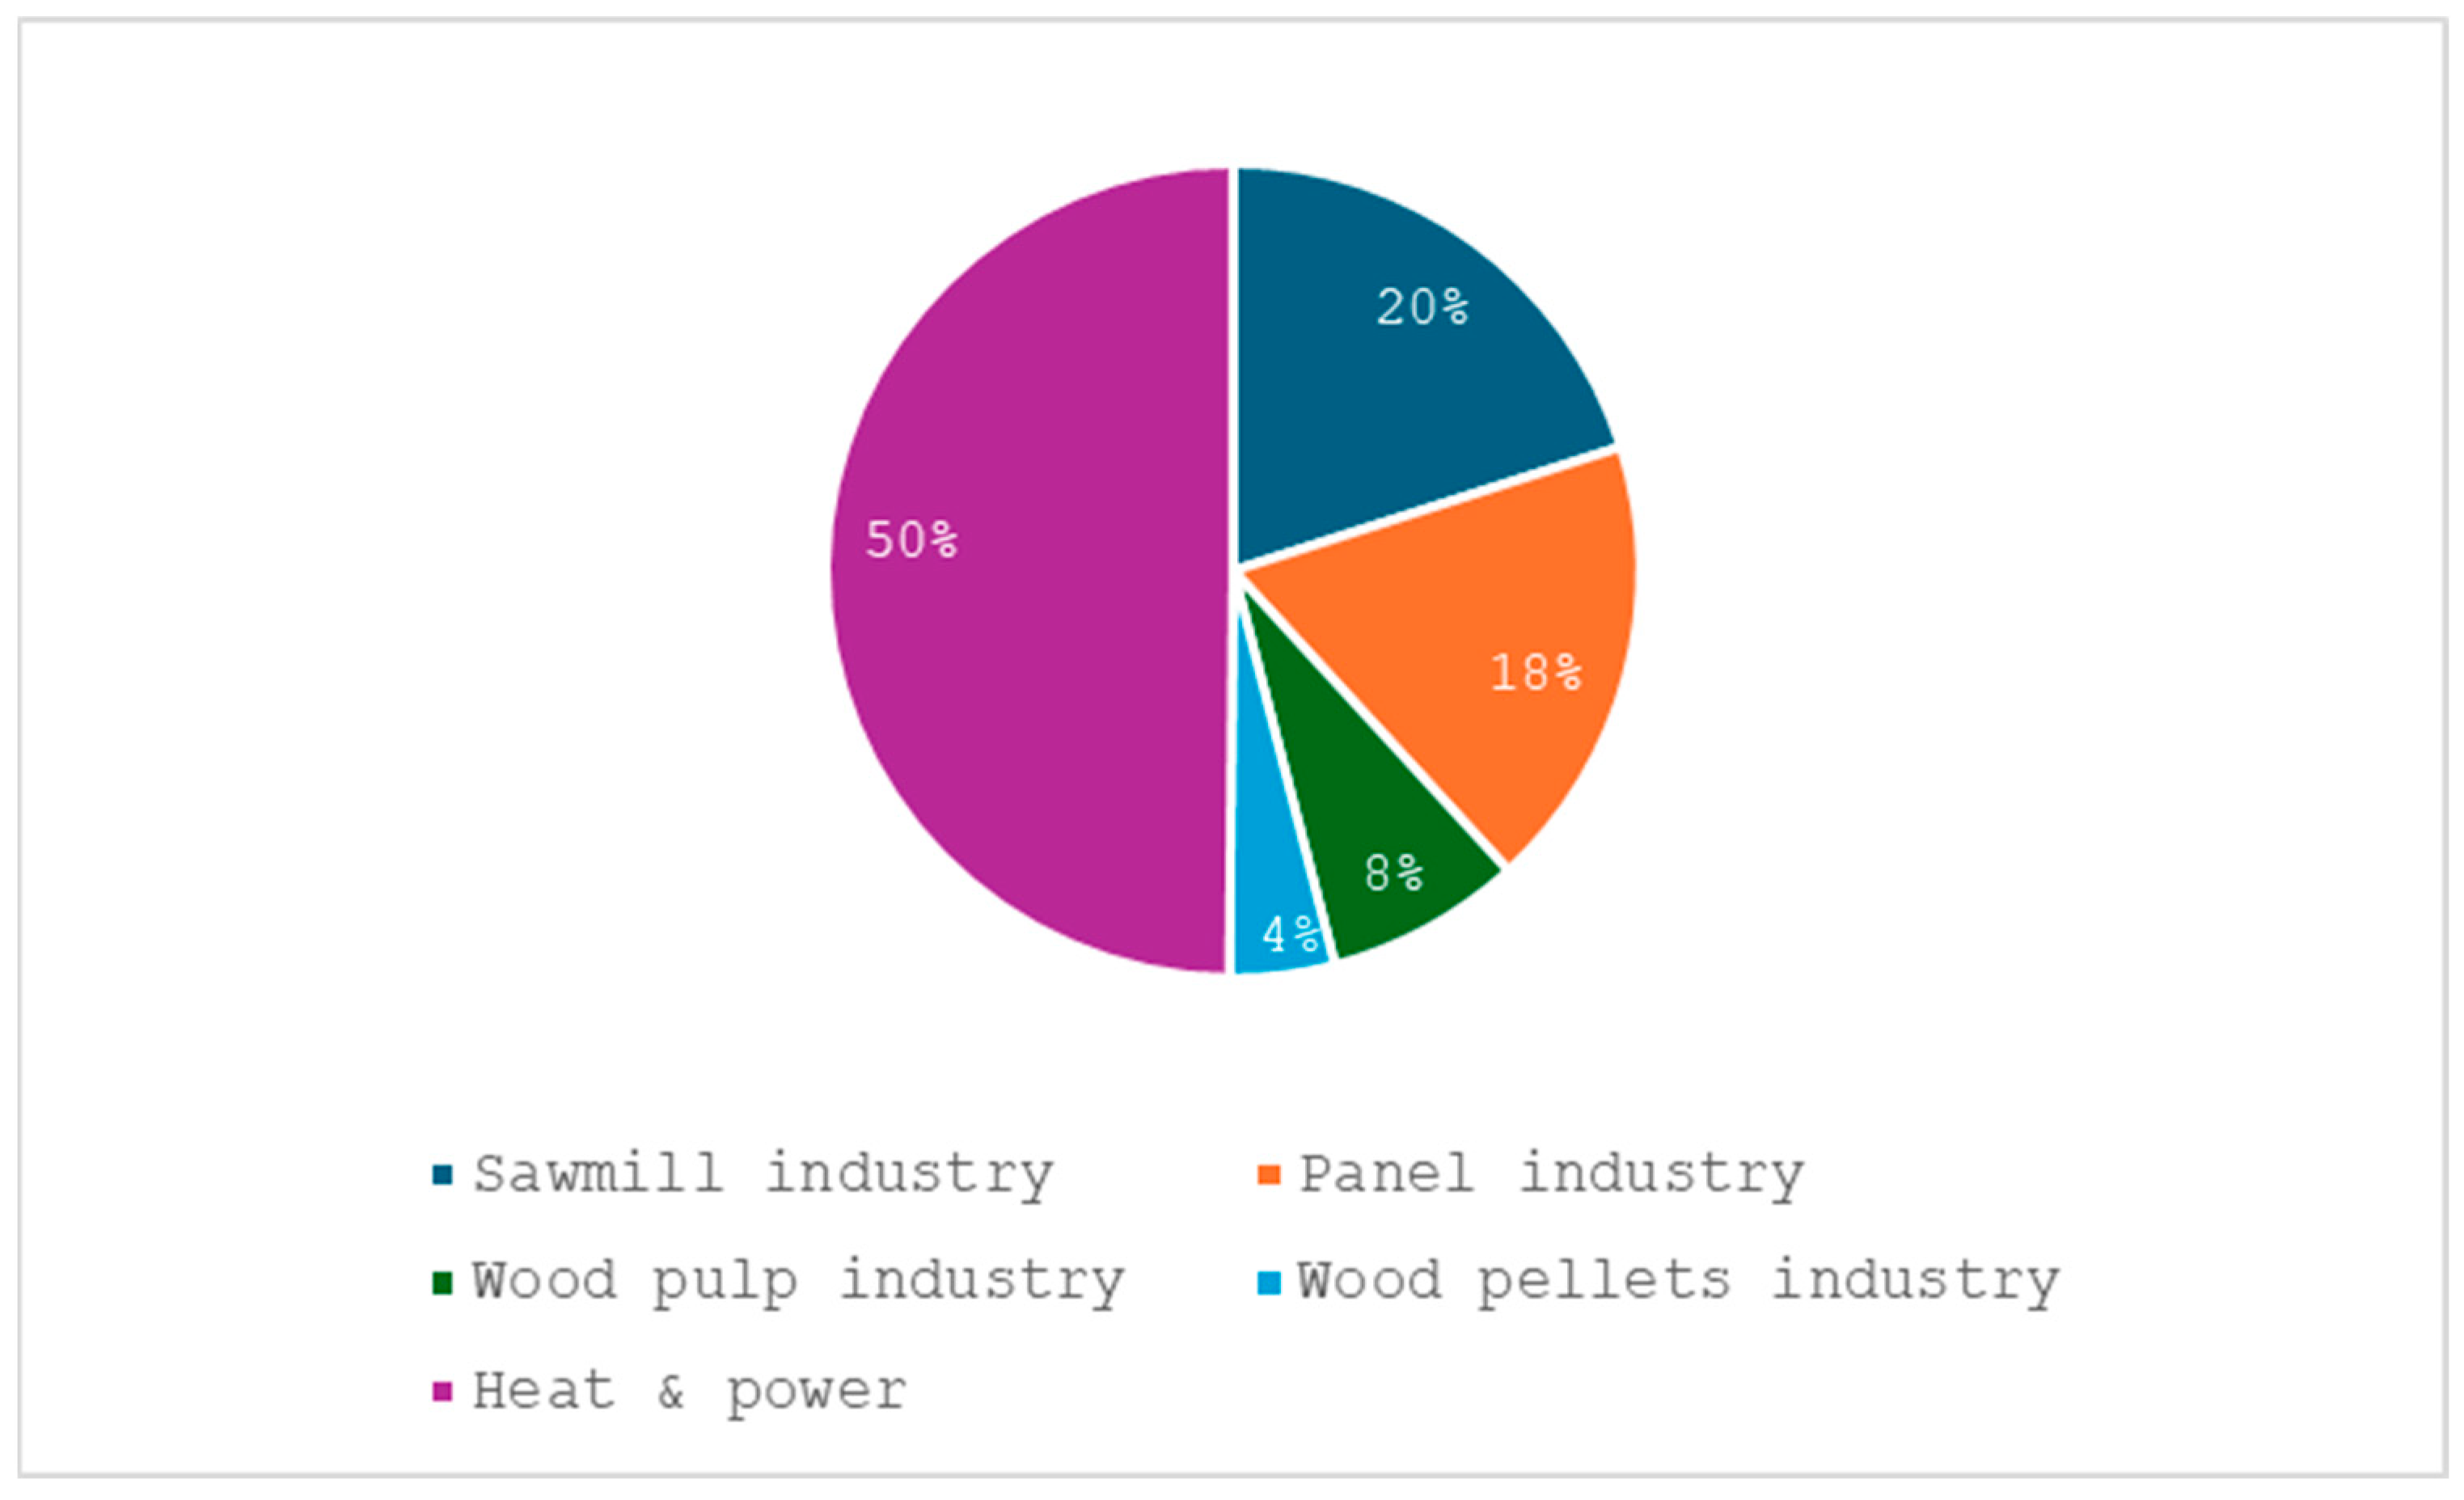
Table 5 depicts the WRB for year 2019 for Region West, comprising Austria, Belgium, Denmark, France, Germany, Ireland, Luxembourg, Netherlands, Switzerland, and the UK. This is a populous, densely populated region, less endowed with forests in terms of forest area per capita than Region North (see, e.g., [
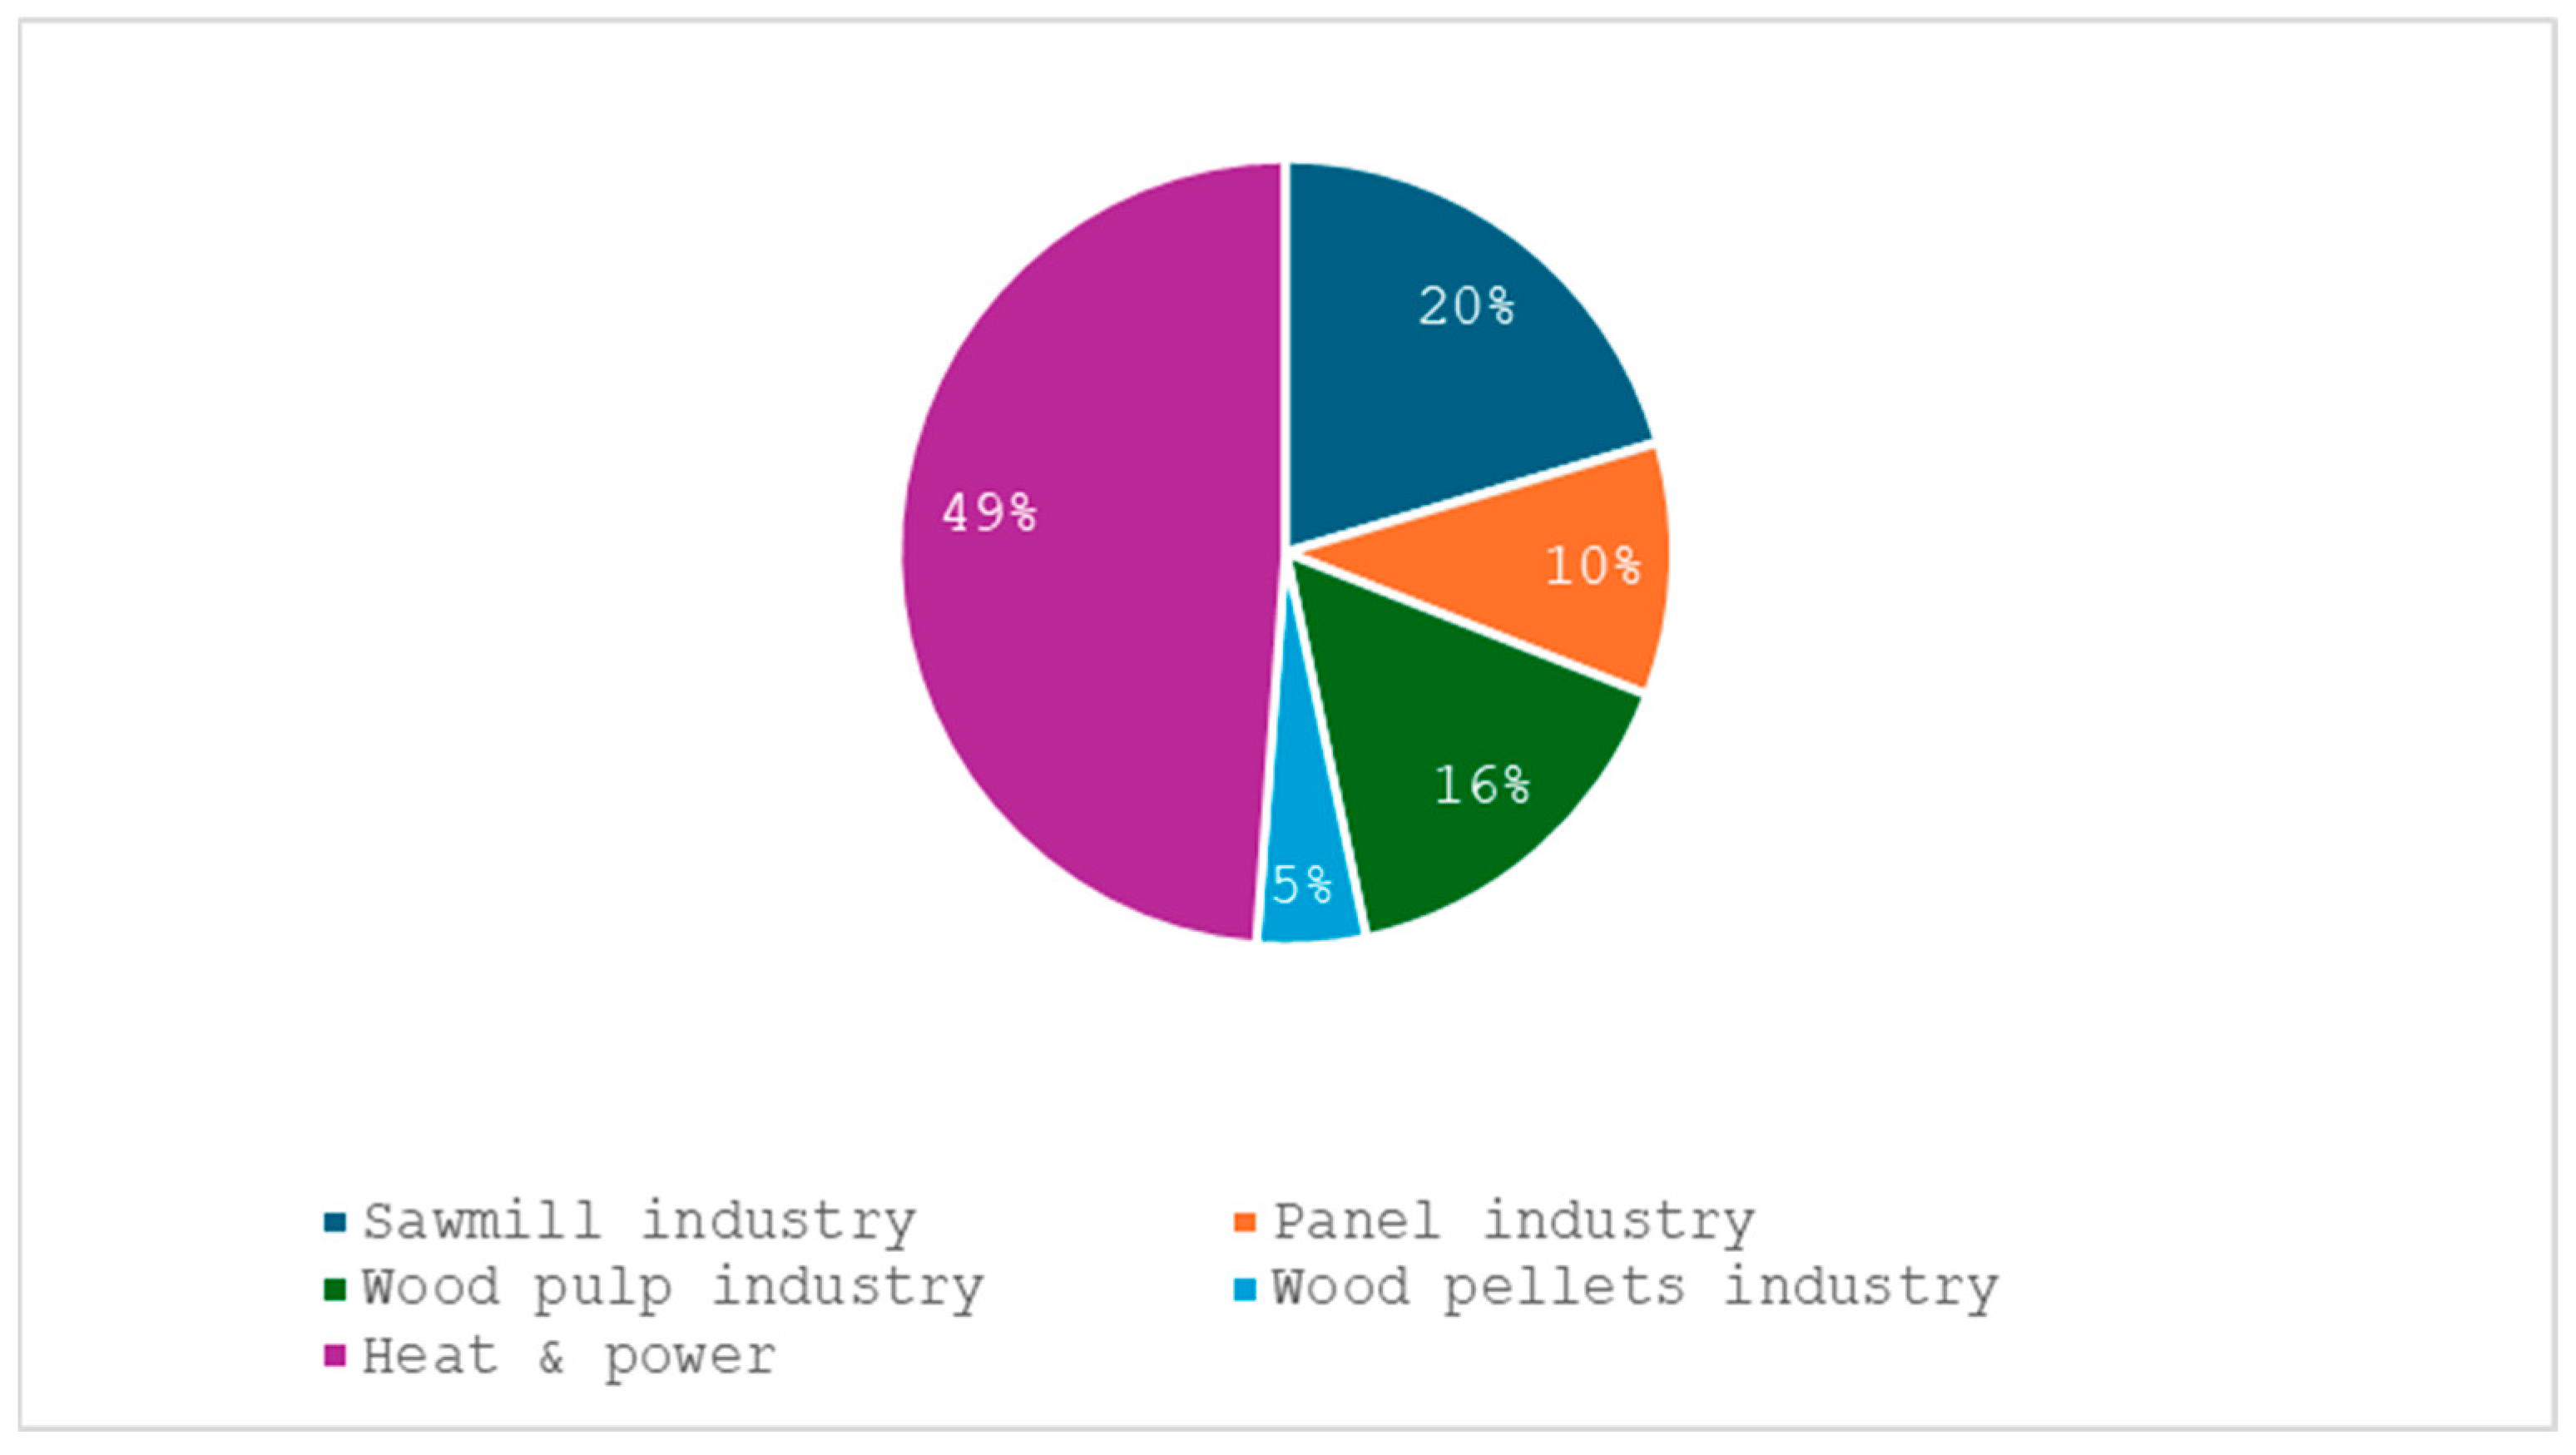
32]) and with forest policy priorities ranging from multifunctional forestry (Austria, France, Germany) to carbon (Ireland, the UK) and biodiversity forest management (BENELUX, Denmark, Switzerland). This region is the largest user of woody biomass of the four analyzed here. The solid-wood-products industry is dominating forest-based industry use of wood, with sawmilling being the largest material user of wood, followed by the wood-based panel industry, using half the amount of wood as compared to the sawmill industry (
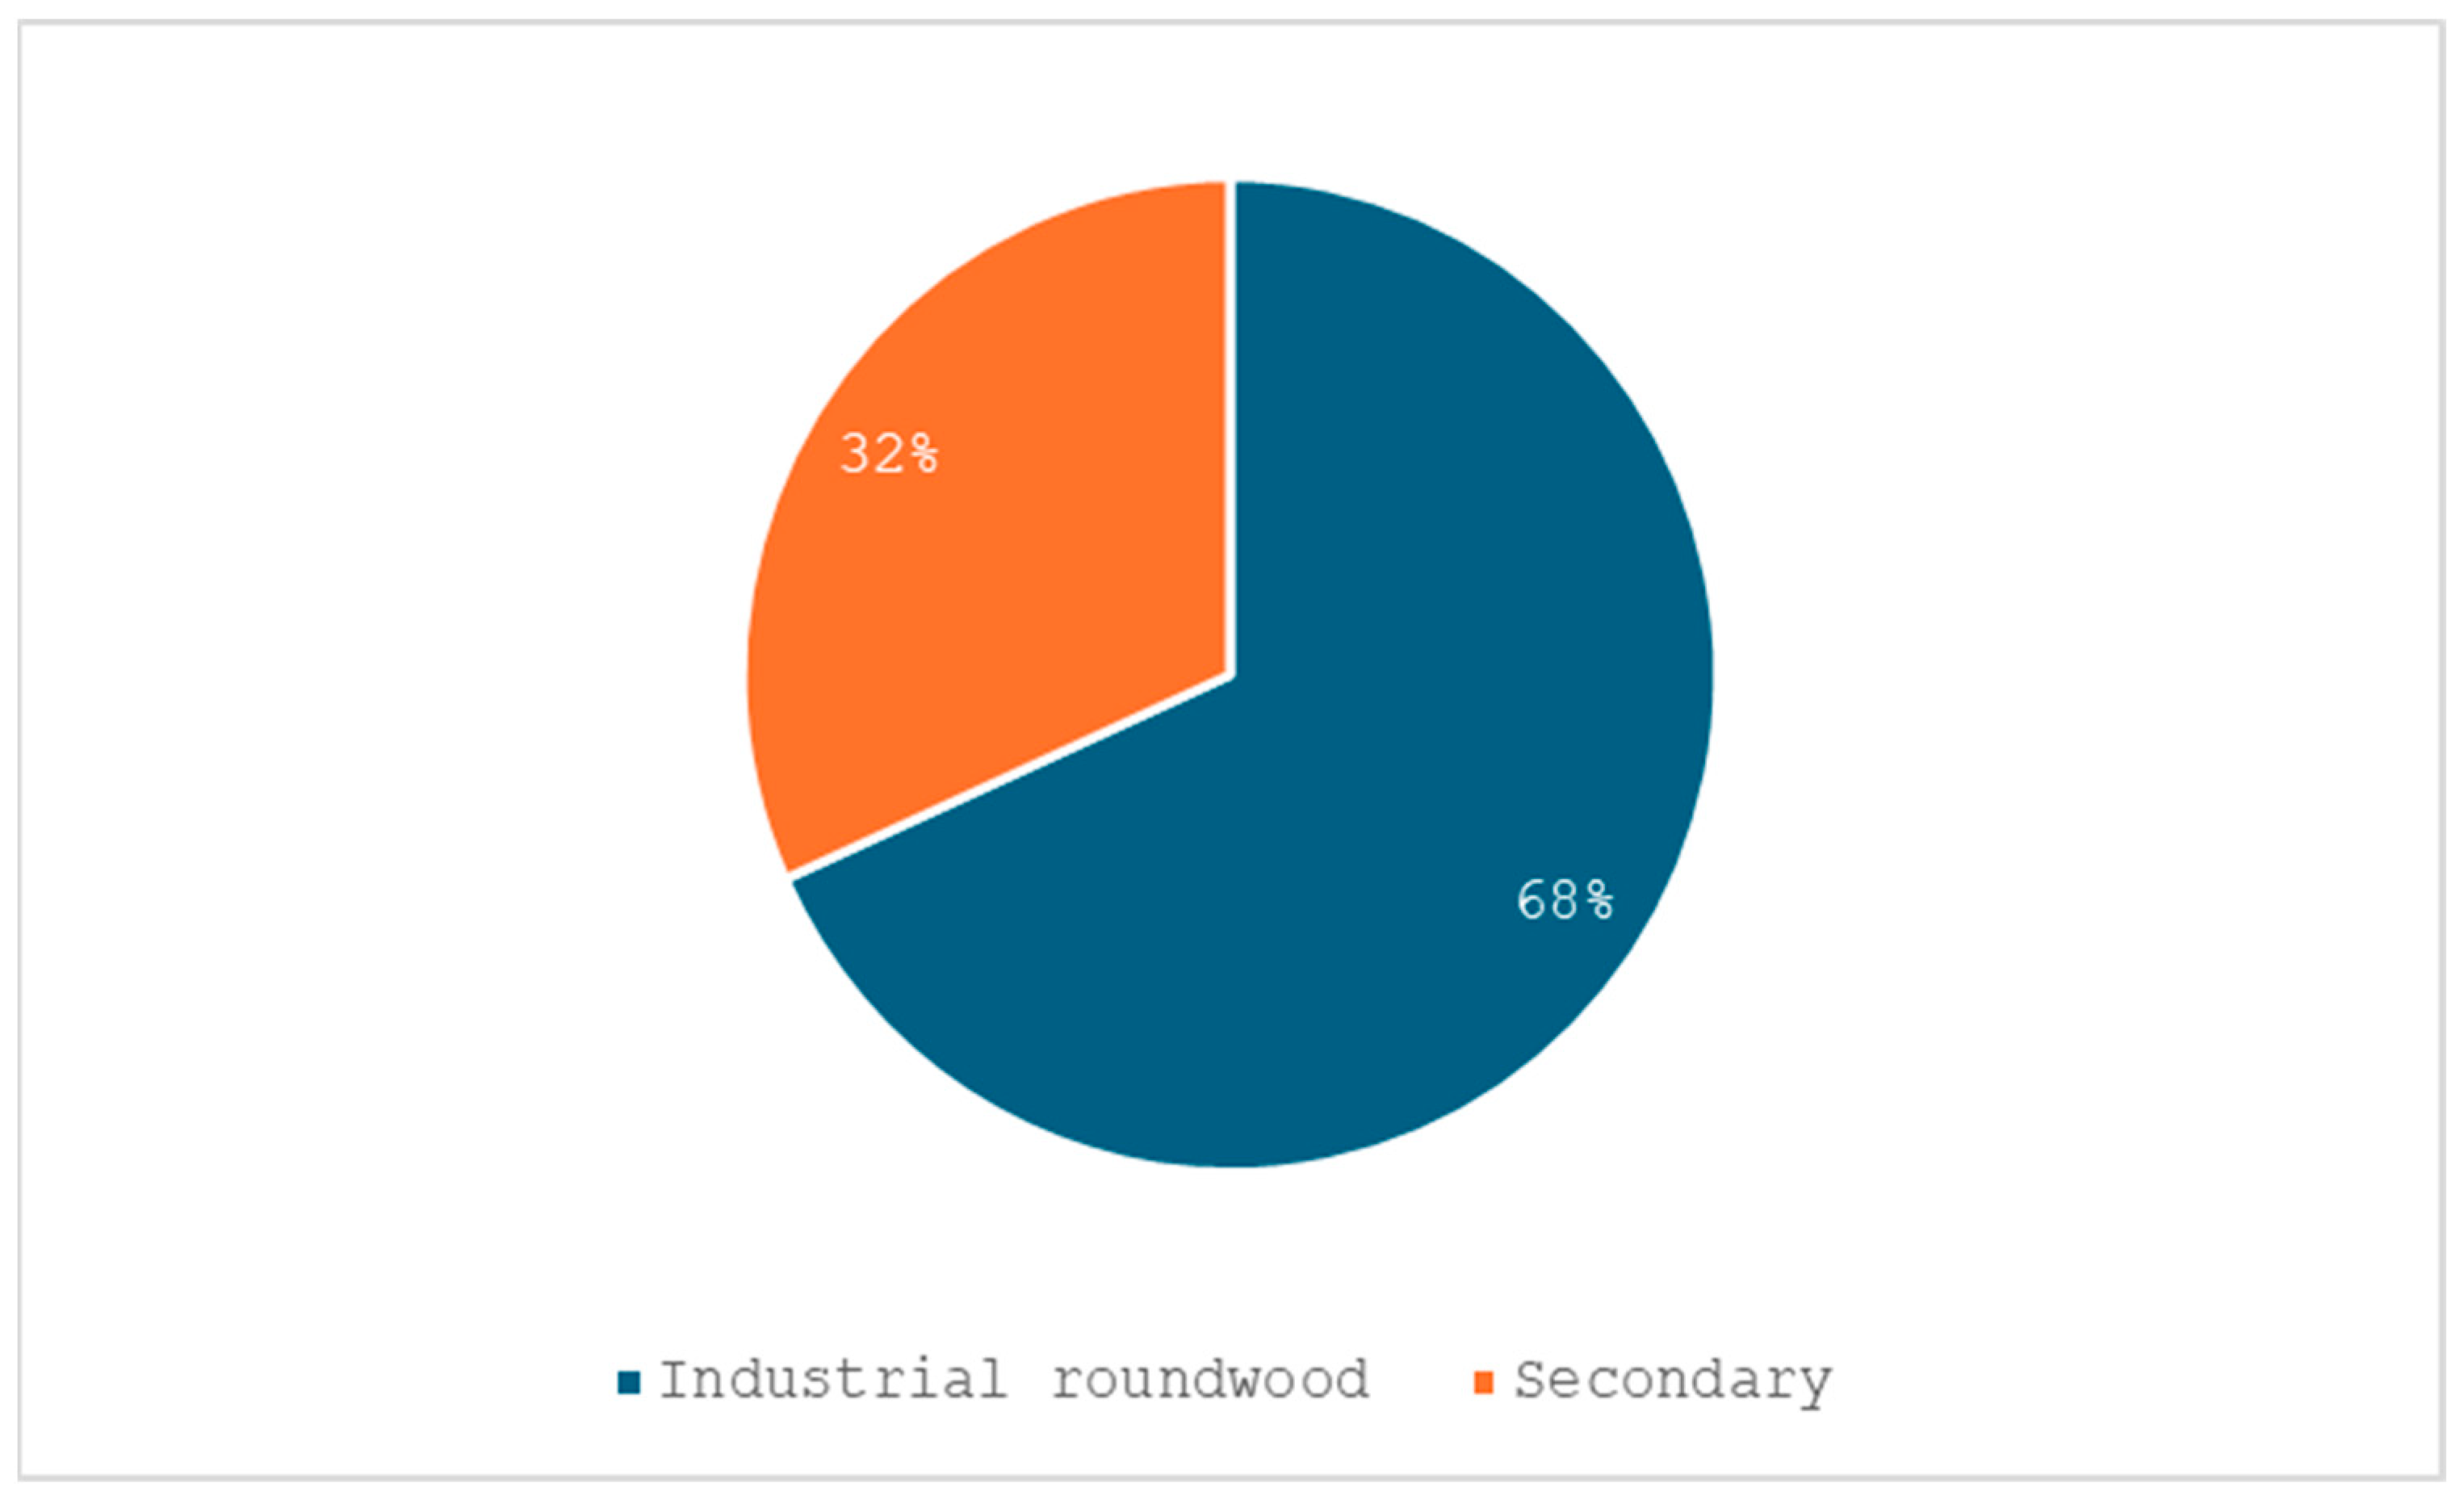
Figure 9). In all, energy uses account for some 55% of total uses of wood (ibid.) and 39% of primary wood use. Wood-based manufacturing in the region uses a larger proportion of secondary wood sources than Region North, 26% as compared to 17% (
Figure 10), including a substantial amount of recovered post-consumer wood, 8.6 million m
3 (
Table 5), a reflection of the region being more densely populated and relatively less endowed with forests, making reuse of woody biomass both more economically feasible and more of necessity. Again, coniferous species dominate IRW use, accounting for 84% of the IRW used. Secondary woody biomass (“indirect wood”) is again the largest reported source of wood-based bioenergy, accounting for 59% of the wood used for energy (
Figure 11).
Noteworthy is the circumstance that Region West used almost twice the amount of wood for energy compared to Region North but a smaller amount of wood in forest-based industries (
Table 4 and
Table 5). Turning to the sources side of the WRB, the region is a net importer of industrial roundwood and forest industry by-products and a major net importer of wood pellets. The UK accounted for 74% of these wood pellets net imports in 2019. Again, trade in fuelwood is insignificant. Notable is also the circumstance that, unlike Region North, in Region West, total sources fall significantly short of total uses by some 36 million m
3. This is mostly due to under-reported roundwood (
Table 6). Hence, the estimated amount of primary wood required for material and energy uses, 215 million m
3 ub, exceeds the recorded supply (removals + net imports) of roundwood (IRW + FW) with 29 million m
3 ub, of which 71%, 21 million m
3 ub, is attributed to energy uses. As several studies have indicated a strong tendency toward underestimation of removals and fellings in official statistics, see e.g., [
33,
34], it is reasonable to allocate the 29 million m
3 ub to roundwood removals. Corrected removals would then amount to 207 million m
3 ub.
Table 7 presents the WRB for Region East, comprising Bulgaria, Croatia, Czech Republic, Hungary, Poland, Romania, Slovakia, and Slovenia, for the year 2019. This is a region that is less populous and more endowed with forests in terms of forest area per capita than Region West, though it is less so than Region North (see, e.g., [
32]), and it has a forest policy priority for a combination of sustained-yield and multifunctional forestry. Region East registered notable net exports of industrial roundwood and wood pellets in 2019, while it was a net importer of forest industry by-products. Again, as in Region West, the solid-wood-products industry dominates industry use of wood, sawmilling being the largest material user of wood, closely followed by the wood-based panel industry (
Figure 12). Coniferous species dominate in the IRW use, though not to the same extent as is the case in Regions North and West, accounting for a share of 74%. Wood-based manufacturing in the region is based on secondary wood sources to the same degree, in relative terms, as Region West, 26% (
Figure 13), or 25 million m
3 ub.
Unlike Region North and Region West, primary woody biomass (“direct wood”) is the largest reported source of wood-based bioenergy, 53% (
Figure 14). A peculiarity is the high proportion, 30%, of wood of unknown/unspecified origin in the recorded energy use of wood (ibid.). Energy uses account for some 50% of total uses of wood (
Figure 12) and 42% of primary wood use. Again, the same as is the case in Region West, total sources fall short of total uses to a significant degree, some 33 million m
3 ub. The estimated amount of primary wood required for material and energy uses, about 120 million m
3, exceeds the recorded supply (removals + net imports of IRW and FW) with some 15 million m
3, which is completely due to energy uses. As a matter of fact, the recorded IRW supply exceeds estimated material roundwood needs by some ten million m
3 ub (
Table 8), implying that this amount of IRW was actually used for energy. Allocating the 15 million m
3 ub to roundwood removals results in corrected removals of 137 million m
3 ub, which can still be regarded as a conservative estimate, considering the considerable amount—around 28 million m
3 ub—of wood of unknown origin used for energy.
Table 9 presents the WRB for the year 2019 for Region South, comprising Cyprus, Greece, Italy, Malta, Portugal, and Spain. This region, quite heterogeneous in terms of forest endowment and the use of wood, uses the smallest amount of wood overall and has a forest policy priority for ecosystem forest management in support of recreation, carbon sequestration, and biodiversity conservation. The region is a net importer of all types of wood assortments. The wood pulp industry is the largest industrial user of wood, followed by the panel industry (
Figure 15). Interestingly, sawmilling is the smallest in terms of wood use. Energy uses account for some 60% of total uses of wood (ibid.). Wood-based manufacturing in the region is to a considerable degree based on secondary wood sources, 32% or some 16 million m
3 ub (
Figure 16). IRW use in this region is more evenly distributed in the tree species sense, with non-coniferous species accounting for 43%.
As in Region East, primary woody biomass is the largest reported source of wood-based bioenergy, 53% (
Figure 17). Again, the same as is the cases in Regions West and East, total sources fall short of total uses to a significant degree, about 32 million m
3, the largest gap in relative terms. The estimated amount of primary wood required for material and energy uses, about 75 million m
3 ub, exceeds the recorded supply with some 21 million m
3 ub, a gap entirely due to energy uses, as recorded IRW supply actually exceeds estimated material roundwood needs by some four million m
3 ub, while energy use of FW (direct wood) exceeds reported FW by around 24 million m
3 ub (
Table 10). Region South is the only region where energy uses of primary wood dominate, accounting for 54%. Corrected removals of roundwood are about 71 million m
3 ub.
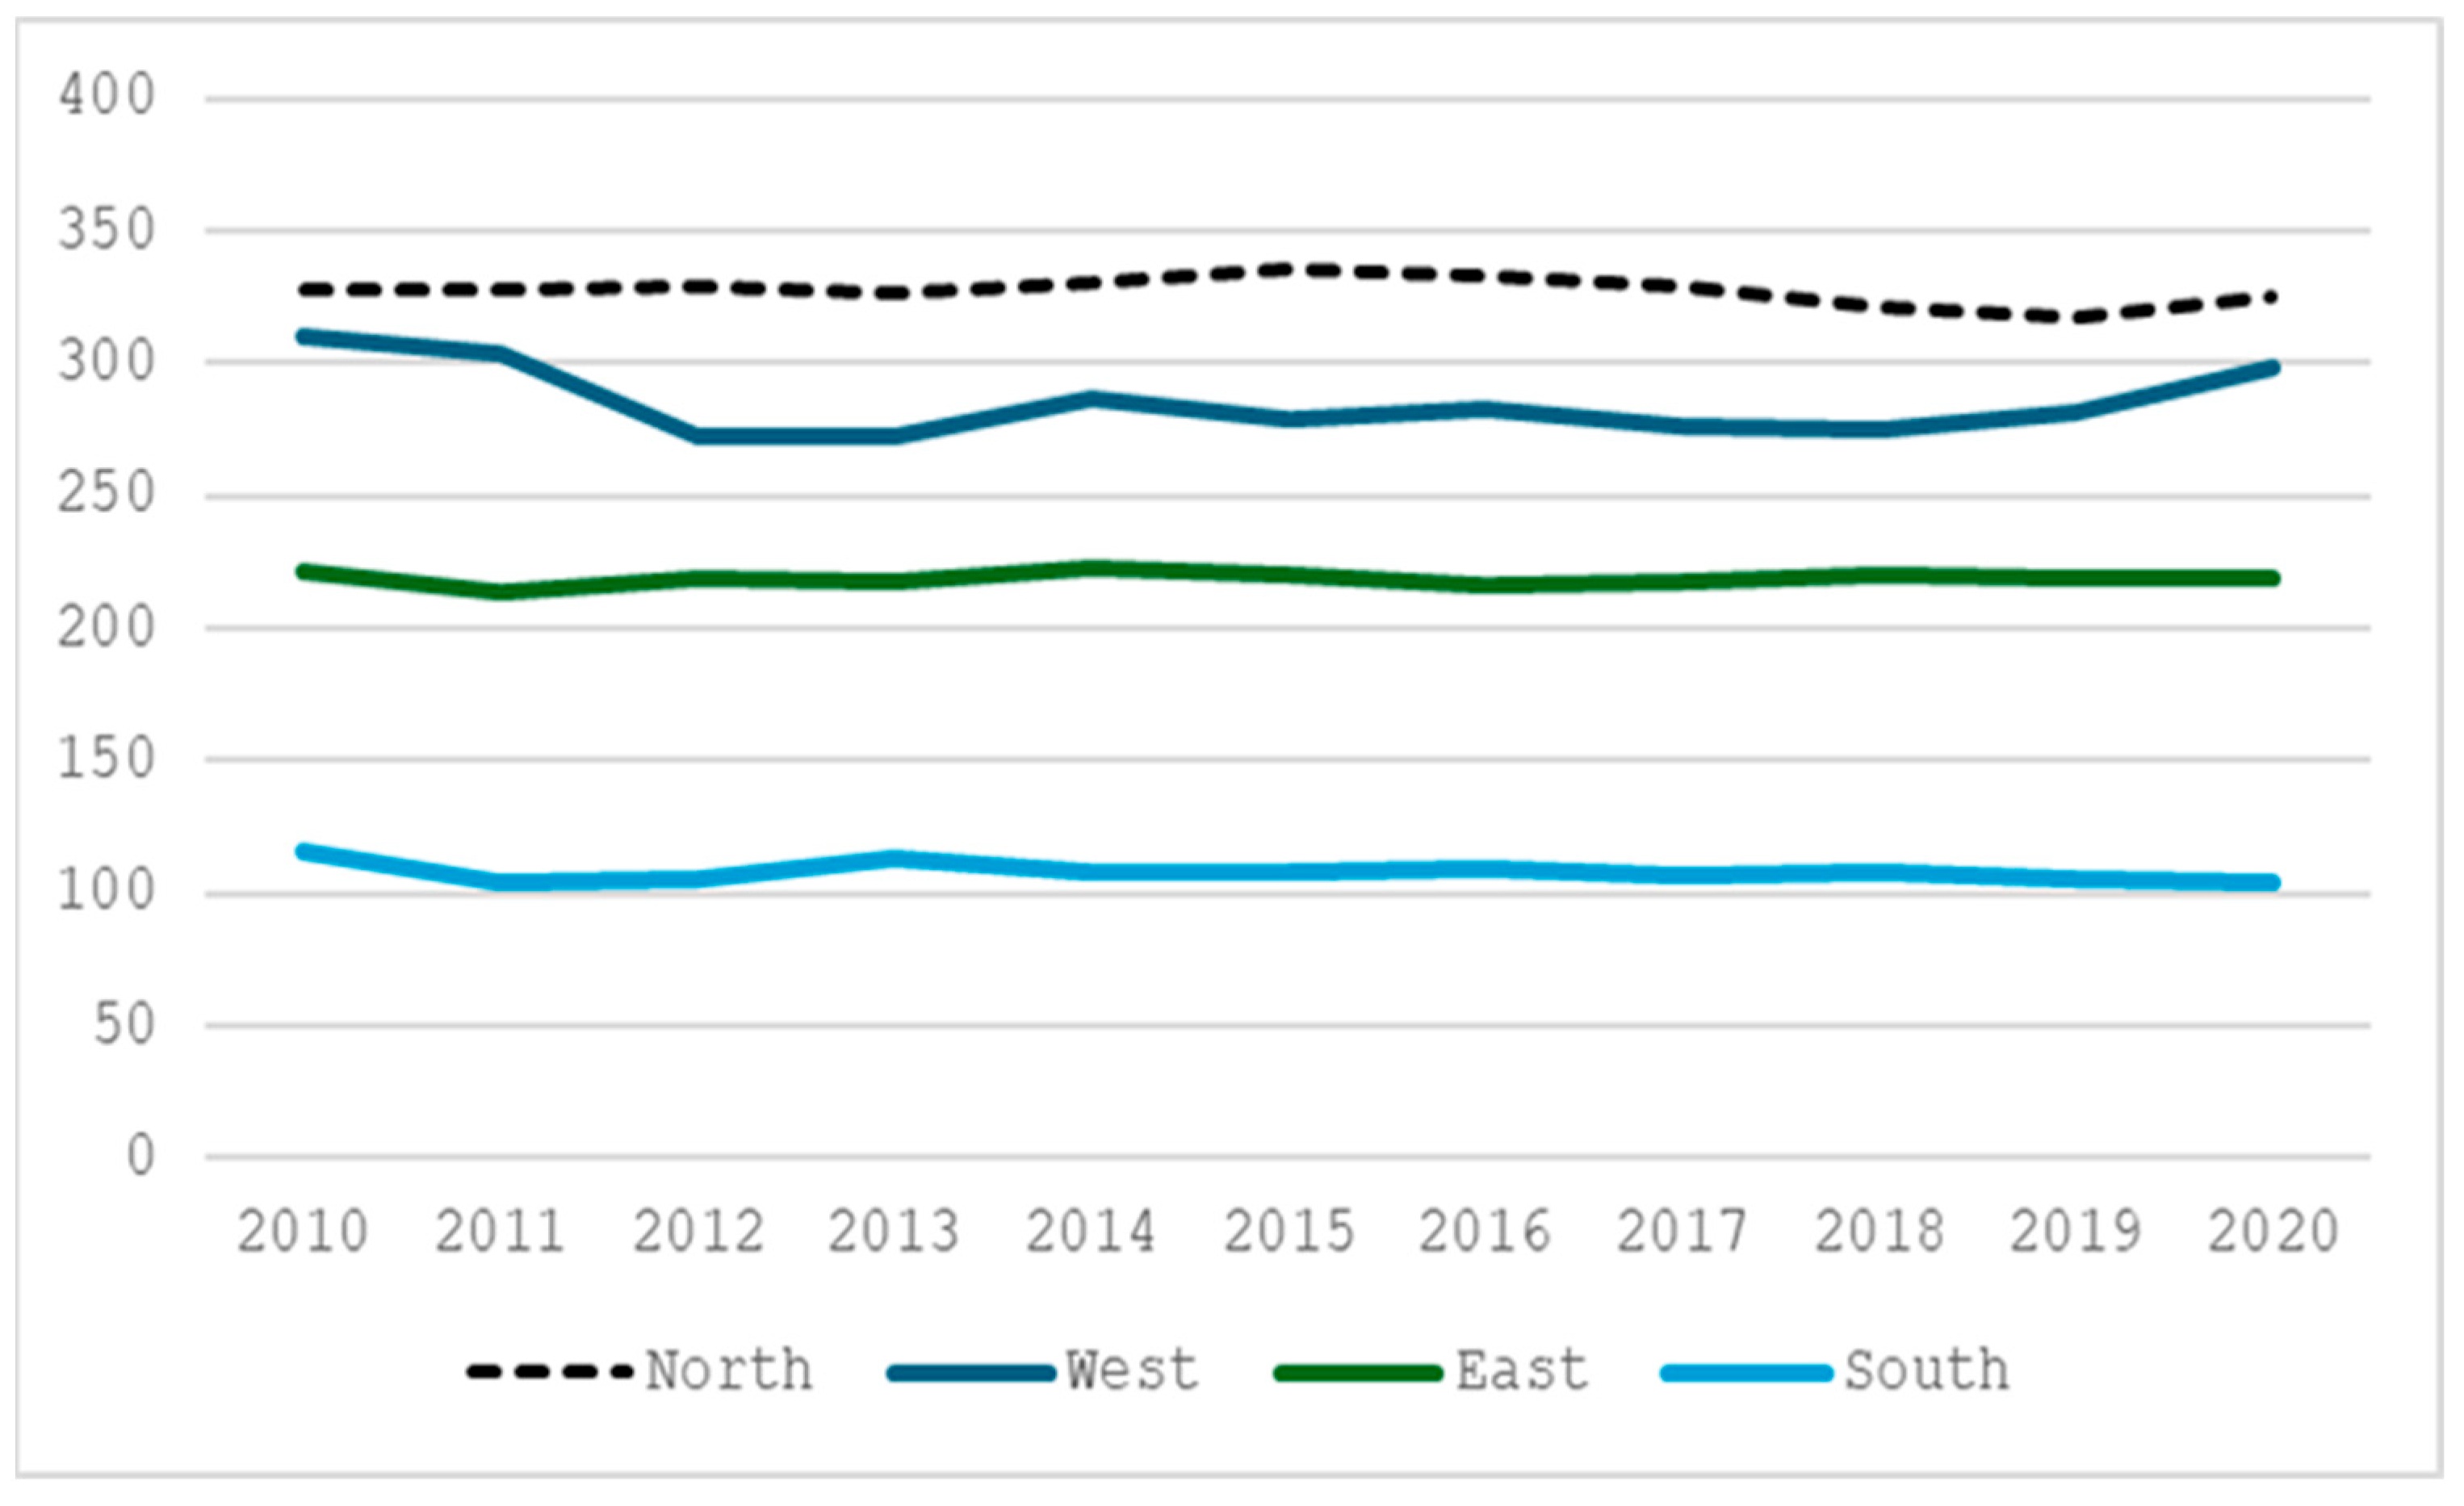
Table 11 summarizes fellings (removals + bark + logging residues) and increment data for the four regions under study and provides estimates of the fellings-to-increment (F/I) ratio for the year 2019. Seemingly, all regions fulfilled the basic sustainability requirement of F/I ratios smaller than one, implying increasing forest growing stocks as well as forest carbon stocks. However, the margins are small, in particular in Region West, and have very little room for increasing fellings. No clear trend in NAI over the period is discernible in any of the regions (
Figure 18), which implies that if NAI continue to remain stationary, increasing fellings will inevitably lead to decreasing forest carbon sinks (see, e.g., Korosuo et al. [
5]).
5. Outlook: Scenarios to 2040
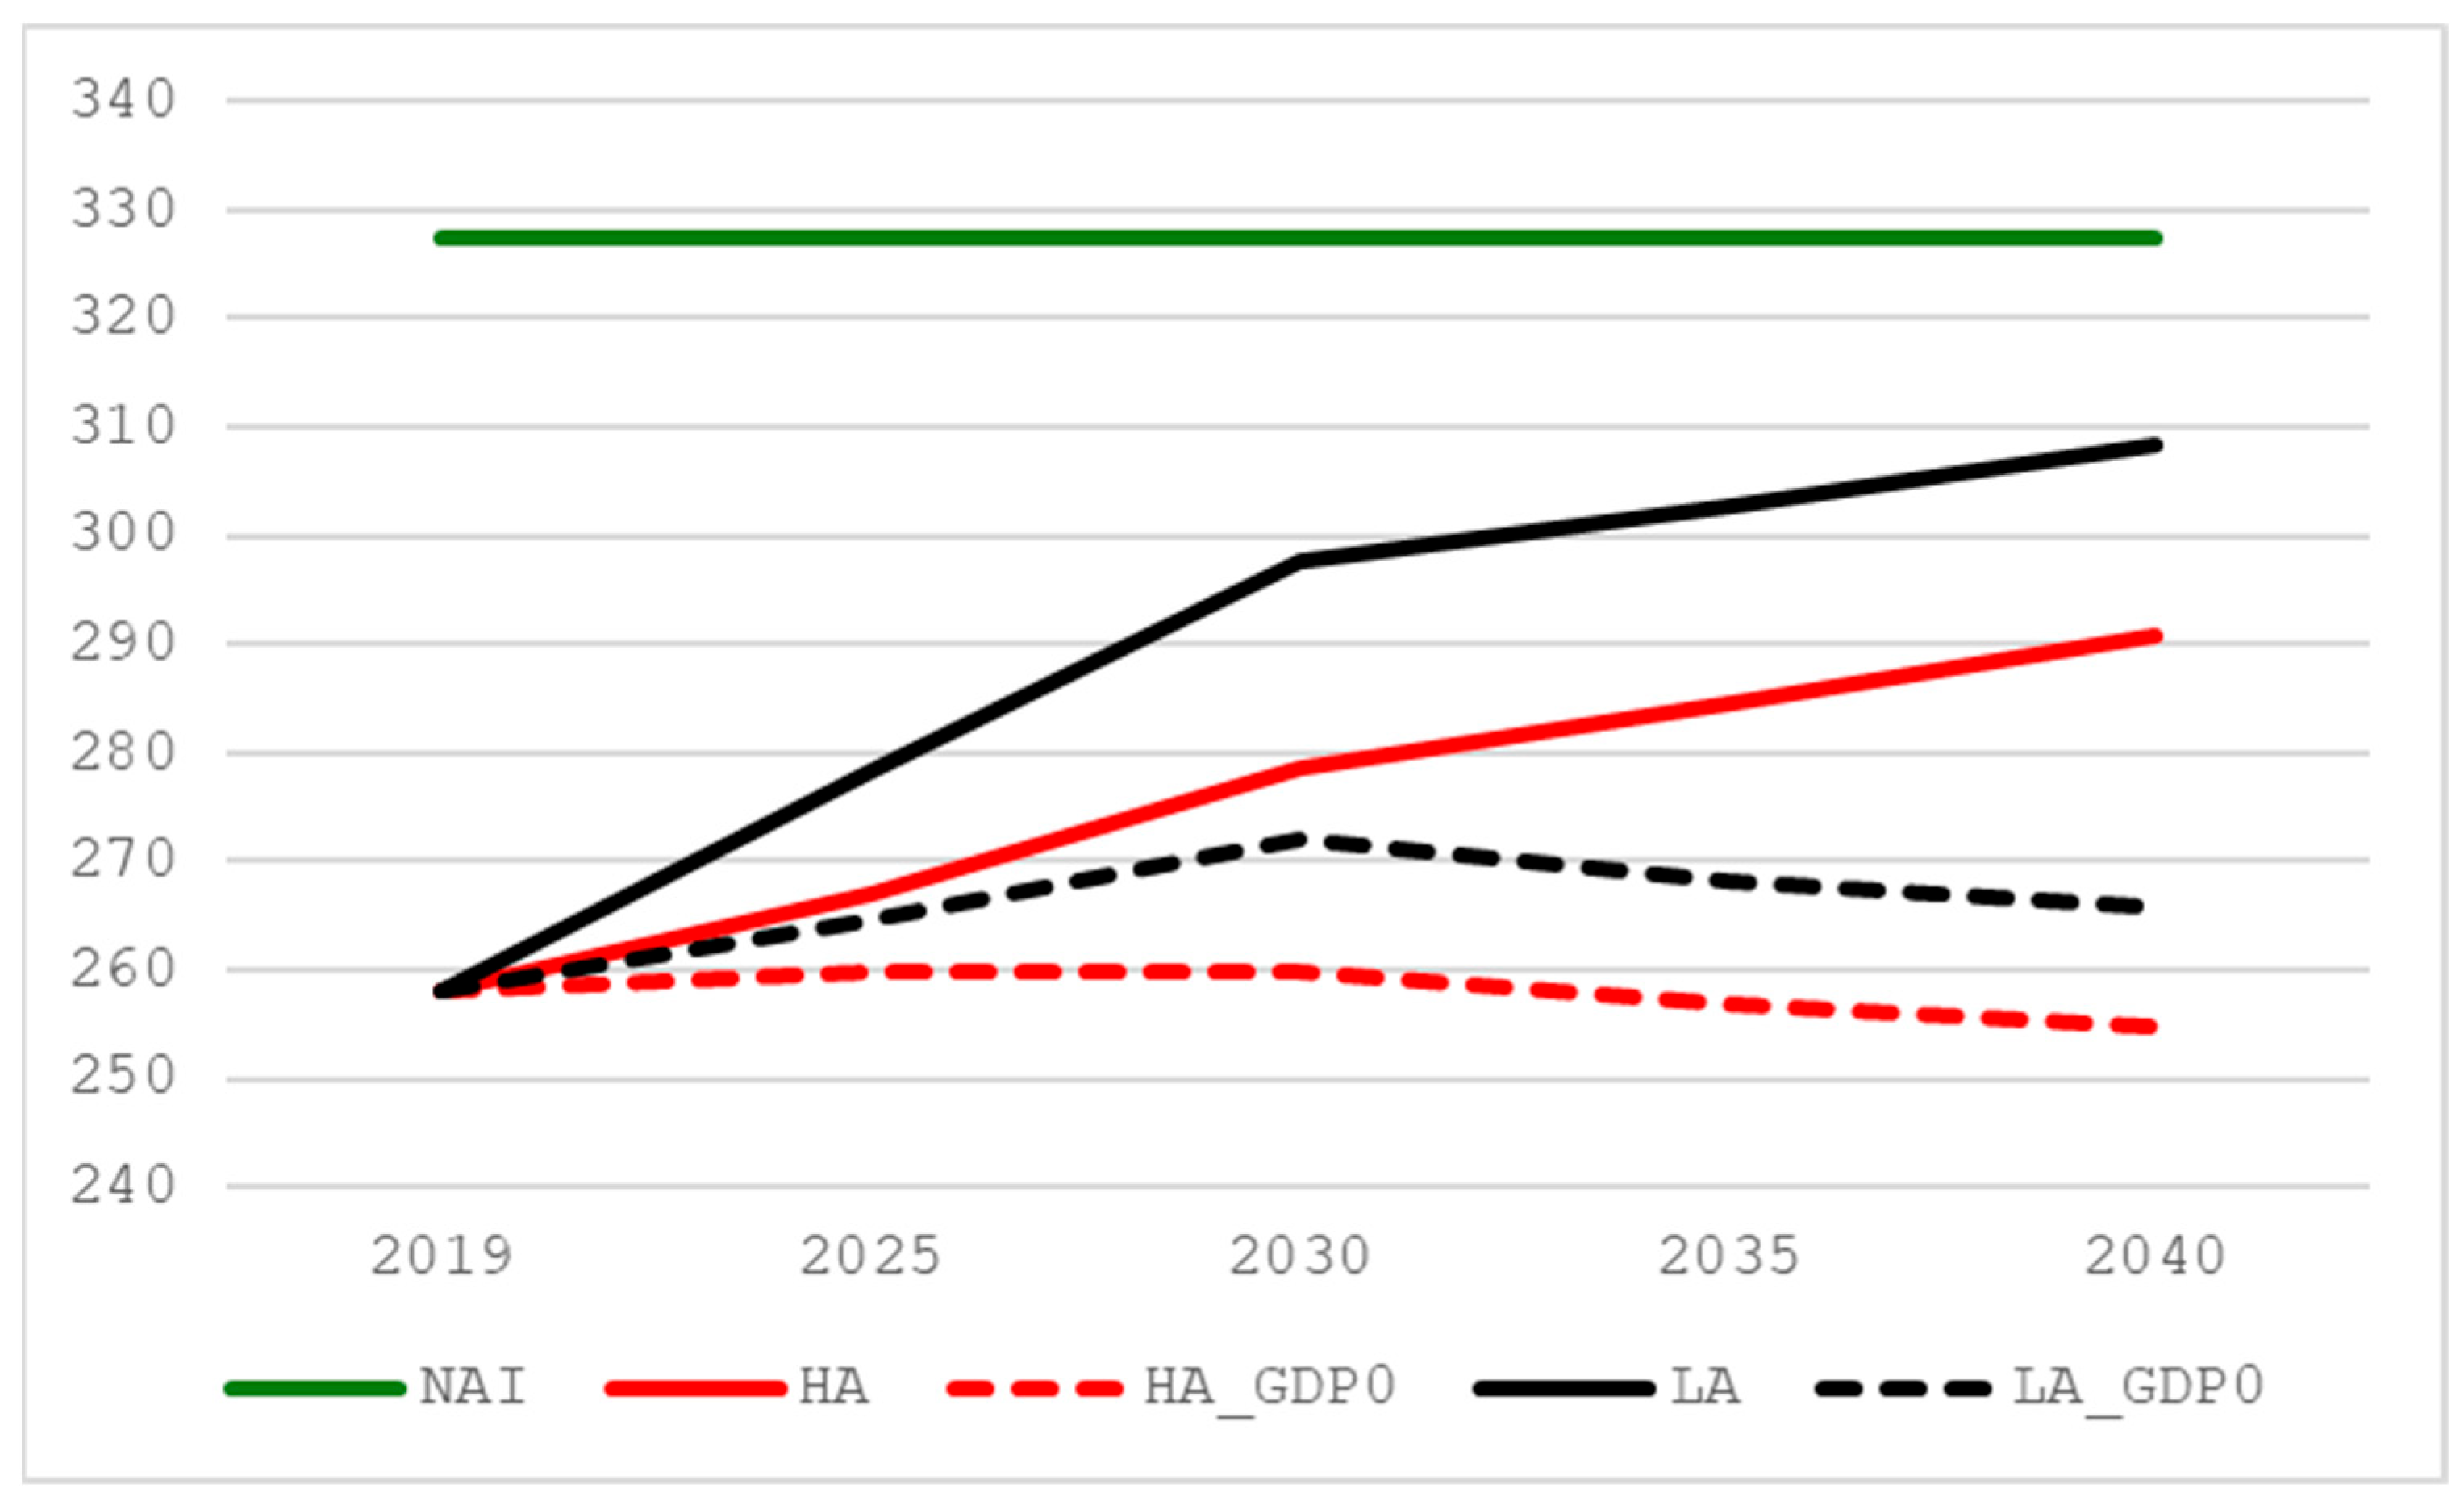
Figure 19 shows the evolution of fellings according to the four scenarios in Region North, and, for comparison, the average NAI for the period 2010 to 2020. Given the absence of a trend in the NAI, this can be seen as a plausible approximation of the future NAI. Fellings are lower than the NAI over the whole outlook period in all scenarios, resulting in increasing forest carbon stocks, obviously to a lesser extent in the LA scenarios. However, the forest carbon sink decreases over the whole outlook period in the HA and LA scenarios, and in the LA_GDP0 and HA_GDP0 scenarios until 2030, as fellings increase in these periods. In the HA scenario, total use of primary wood in Region North is projected to increase by some 13% from 2019 to 2040. This increase is entirely due to the use of primary wood for material, increasing by some 16% in all, while energy uses of primary wood actually decrease by 8.3% over the whole outlook period after an initial increase from 2019 to 2030 by 5.1%. In the LA scenario, total use of primary wood in Region North is projected to increase by some 17% from 2019 to 2040, as material uses of primary wood increase by 16%, while energy uses increase by around 21%. The increase in energy use of primary wood is sharpest between 2019 and 2030, 37%, reflecting the raised 2030 RED target. In the two scenarios where energy demand for primary wood drives changes in fellings, HA_GDP0 and LA_GDP0, fellings increase until year 2030 and then decrease, reflecting the foreseen gradual decline in the use of biomass and waste from 2030 in the EU Reference Scenario 2020 [
25] that forms the basis for assessment of energy use of wood as outlined in the Material and Methods Section. Hence, assuming no growth in the production of wood-based products in Region North, the forest carbon sink would increase from 2030 to 2040.
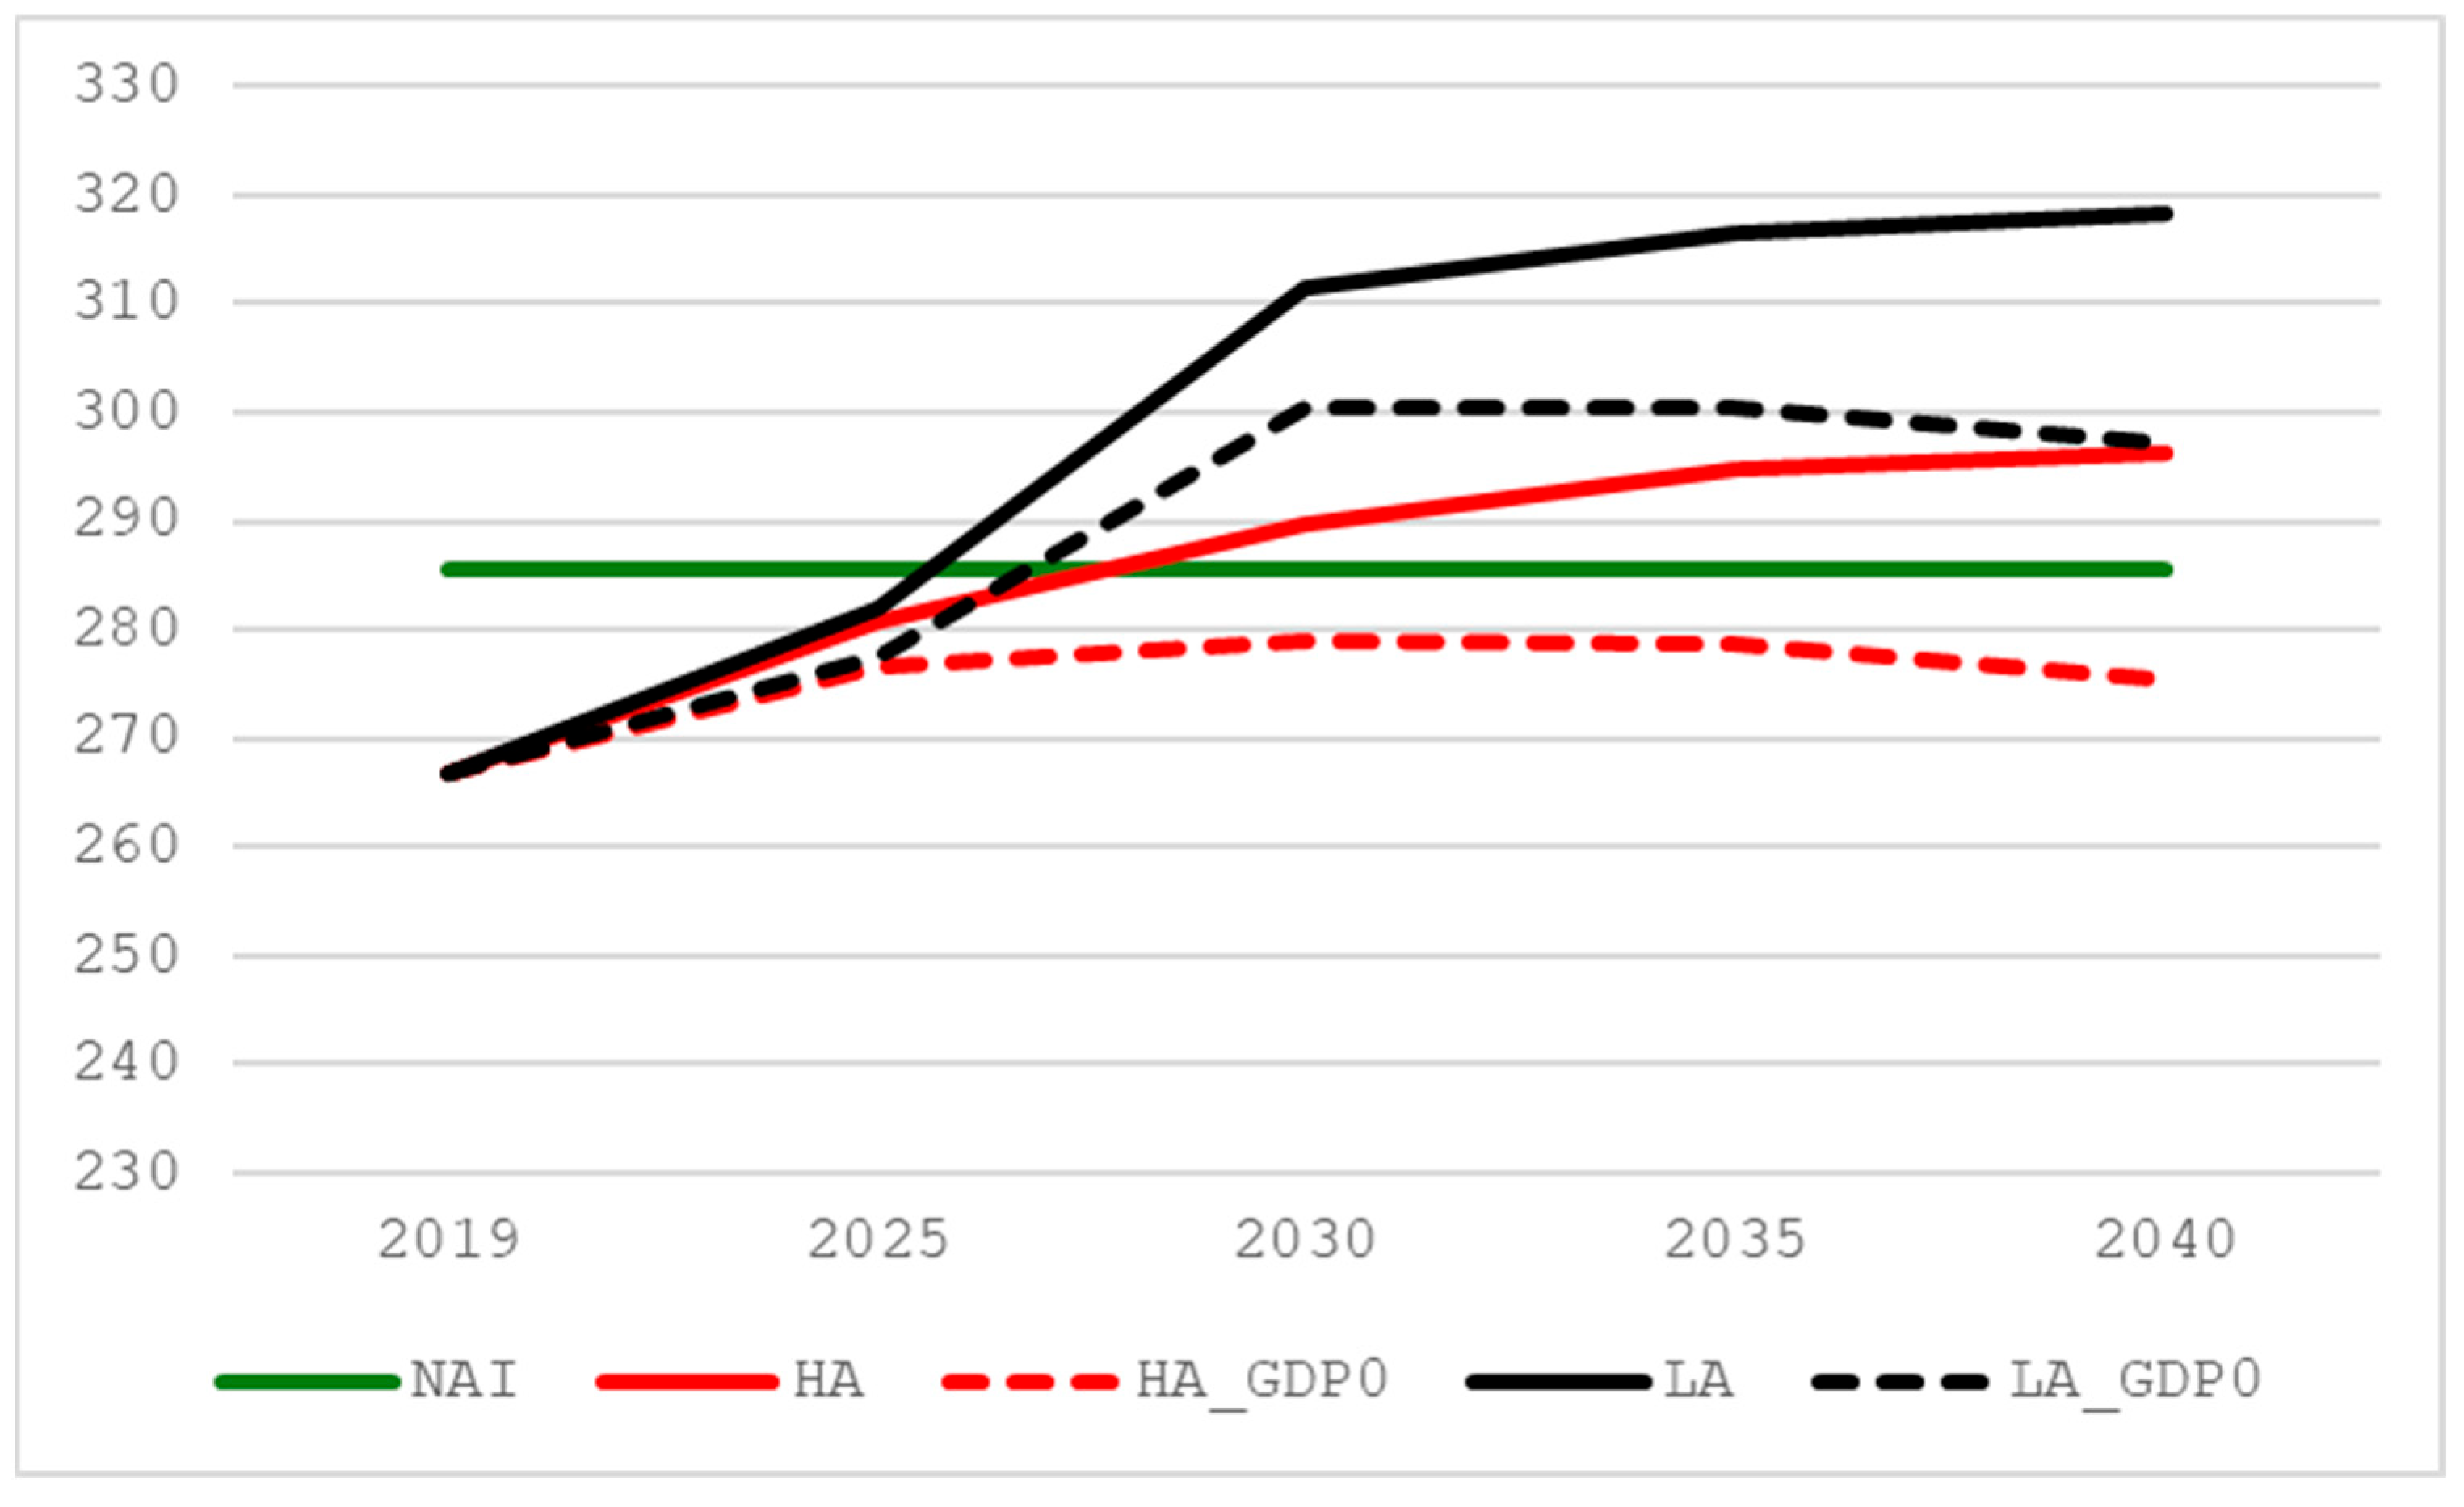
Figure 20 depicts projected fellings in the four scenarios in Region West for the period 2019 to 2040 and the average NAI for the period 2010 to 2020. Again, in the absence of a clear trend in the NAI, the average can be seen as a plausible approximation of the future NAI. In the HA scenario, year 2027 is the inflection point, after which fellings are greater than the NAI, resulting in decreasing growing and carbon stocks and the forest turning from a sink to a source of carbon. Total use of primary wood in Region West in the HA scenario is projected to increase by around 11% over the whole outlook period. Material primary wood uses are foreseen to increase by some 12% in all, while energy uses of primary wood, peaking in the year 2030, are projected to increase by about 8% over the whole outlook period in this scenario. In the LA scenario, 2025 is the inflection point, after which fellings are increasingly greater than NAI, resulting in progressively decreasing growing and carbon stocks and the forest turning from a sink to a substantial source of carbon. Total use of primary wood in the LA scenario is projected to increase by some 19% from 2019 to 2040, the largest part of which is due to a strong increase in energy use of primary wood, some 28% in all. Again, energy use of primary wood is projected to peak in year 2030. Thus, the same as in Region North, regardless of the scenario, the energy use of wood culminates in 2030, followed by a gradual, slow decline between 2030 and 2040. It is noteworthy that even assuming no growth in material uses of wood, the raised RED target for the year 2030 would lead to decreasing forest carbon stocks and turn the forest from a sink to a source of carbon from the year 2026 onward, according to scenario LA_GDP0. Only in the absence of growth in material uses of wood and under the assumption that the implementation of the 2018 revision of the RED target from the year 2018—32% renewable energy in total final energy consumption instead of the 42.5% in RED III—is applied in the EU Reference Scenario 2020 [
25] would the forest remain a carbon sink in Region West.
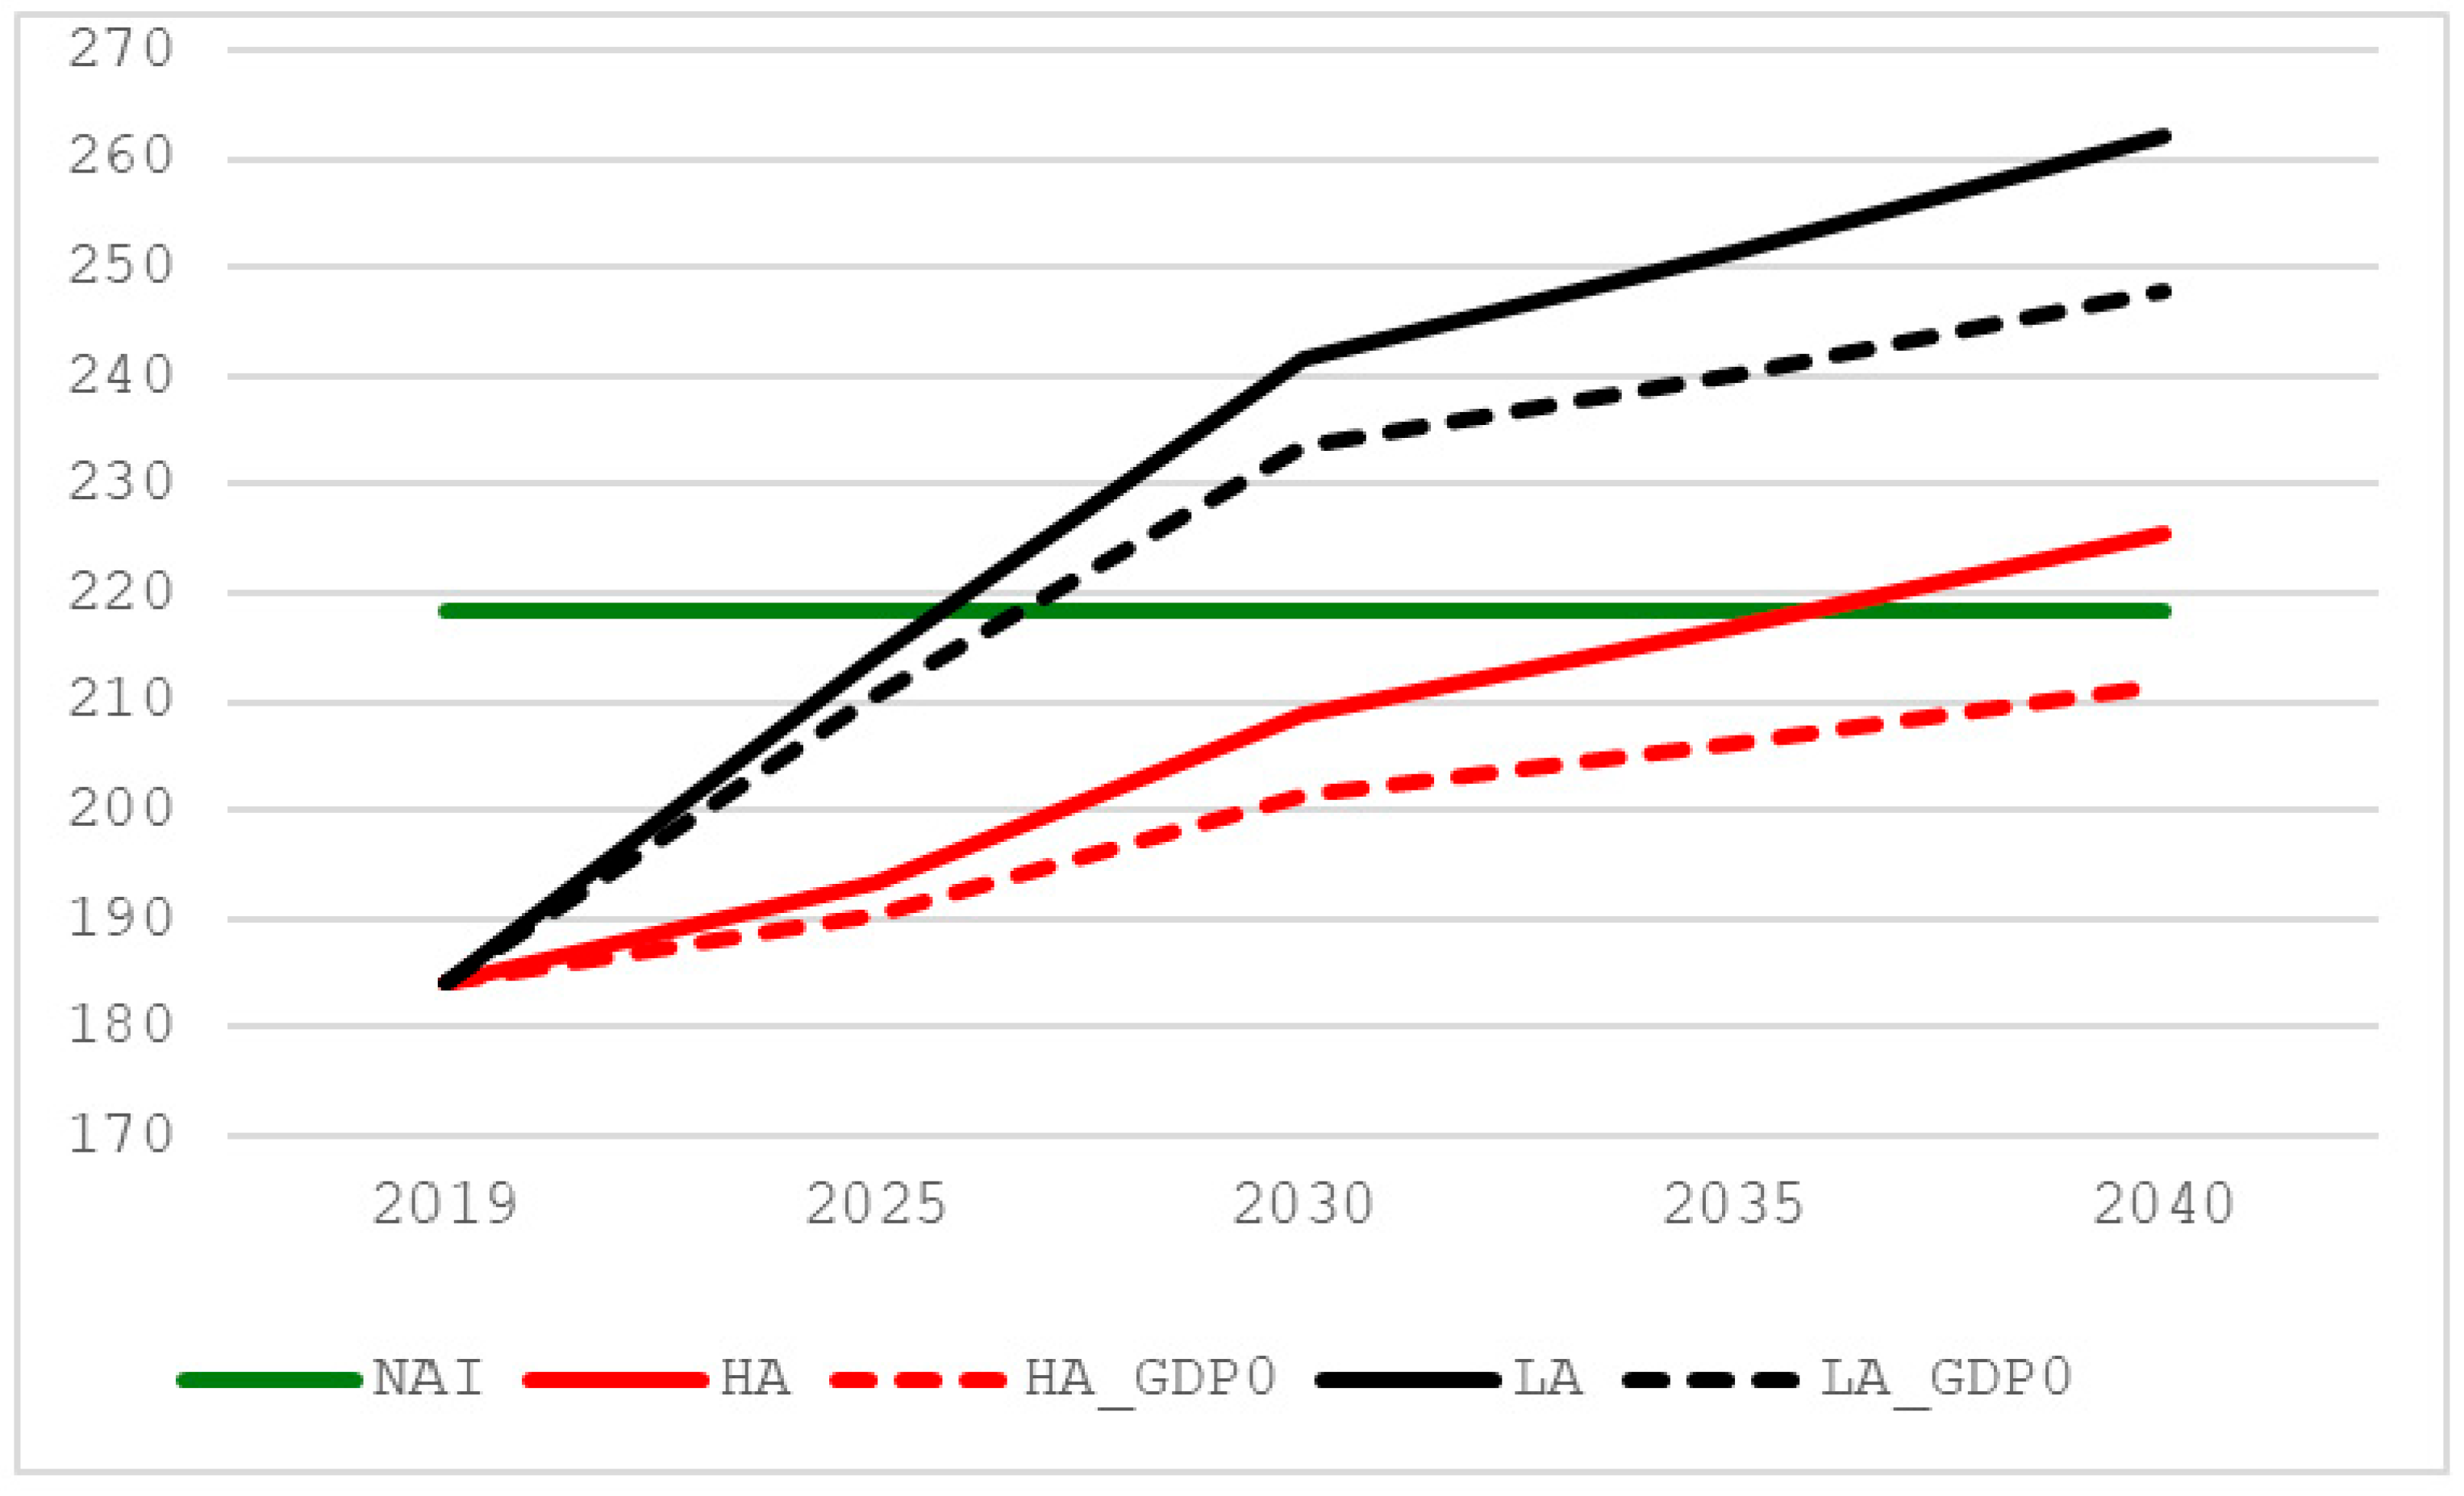
Figure 21 depicts projected fellings for the four scenarios and the average NAI for the period 2010 to 2020 in Region East. Yet again, in the absence of a clear trend in the NAI, the historic average can be seen as a plausible approximation of the future NAI. In the HA scenario, year 2035 is the inflection point, after which fellings become greater than the NAI, resulting in decreasing forest growing and carbon stocks and the forest turning from a sink to a source of carbon. Total use of primary wood in the HA scenario is projected to increase by around 26% from 2019 to 2040. Energy uses are projected to outgrow material ones, increasing by some 42% as compared to around 15% for material uses. The LA scenario sees a substantial increase in fellings; the rate of increase is highest from 2019 to 2030, some 35%, while the rate of growth between 2030 and 2040 is only 9.5%. Energy use of primary wood would almost double between 2019 and 2040. Here, the year 2025 is the inflection point, after which fellings become greater than the NAI. Again, the same as in Region West, even assuming no growth in material uses of wood, the RED III target for the year 2030 would lead to decreasing forest carbon stocks and turn the forest from a sink to a source of carbon from the year 2026 onward, according to scenario LA_GDP0. Only the combination of no growth in material uses of wood and the implementation of the lower target for 2030 in the 2018 revision of the RED applied in the EU Reference Scenario 2020 [
25] would lead to the forest remaining a carbon sink, albeit a shrinking one, in Region East for the whole outlook period.
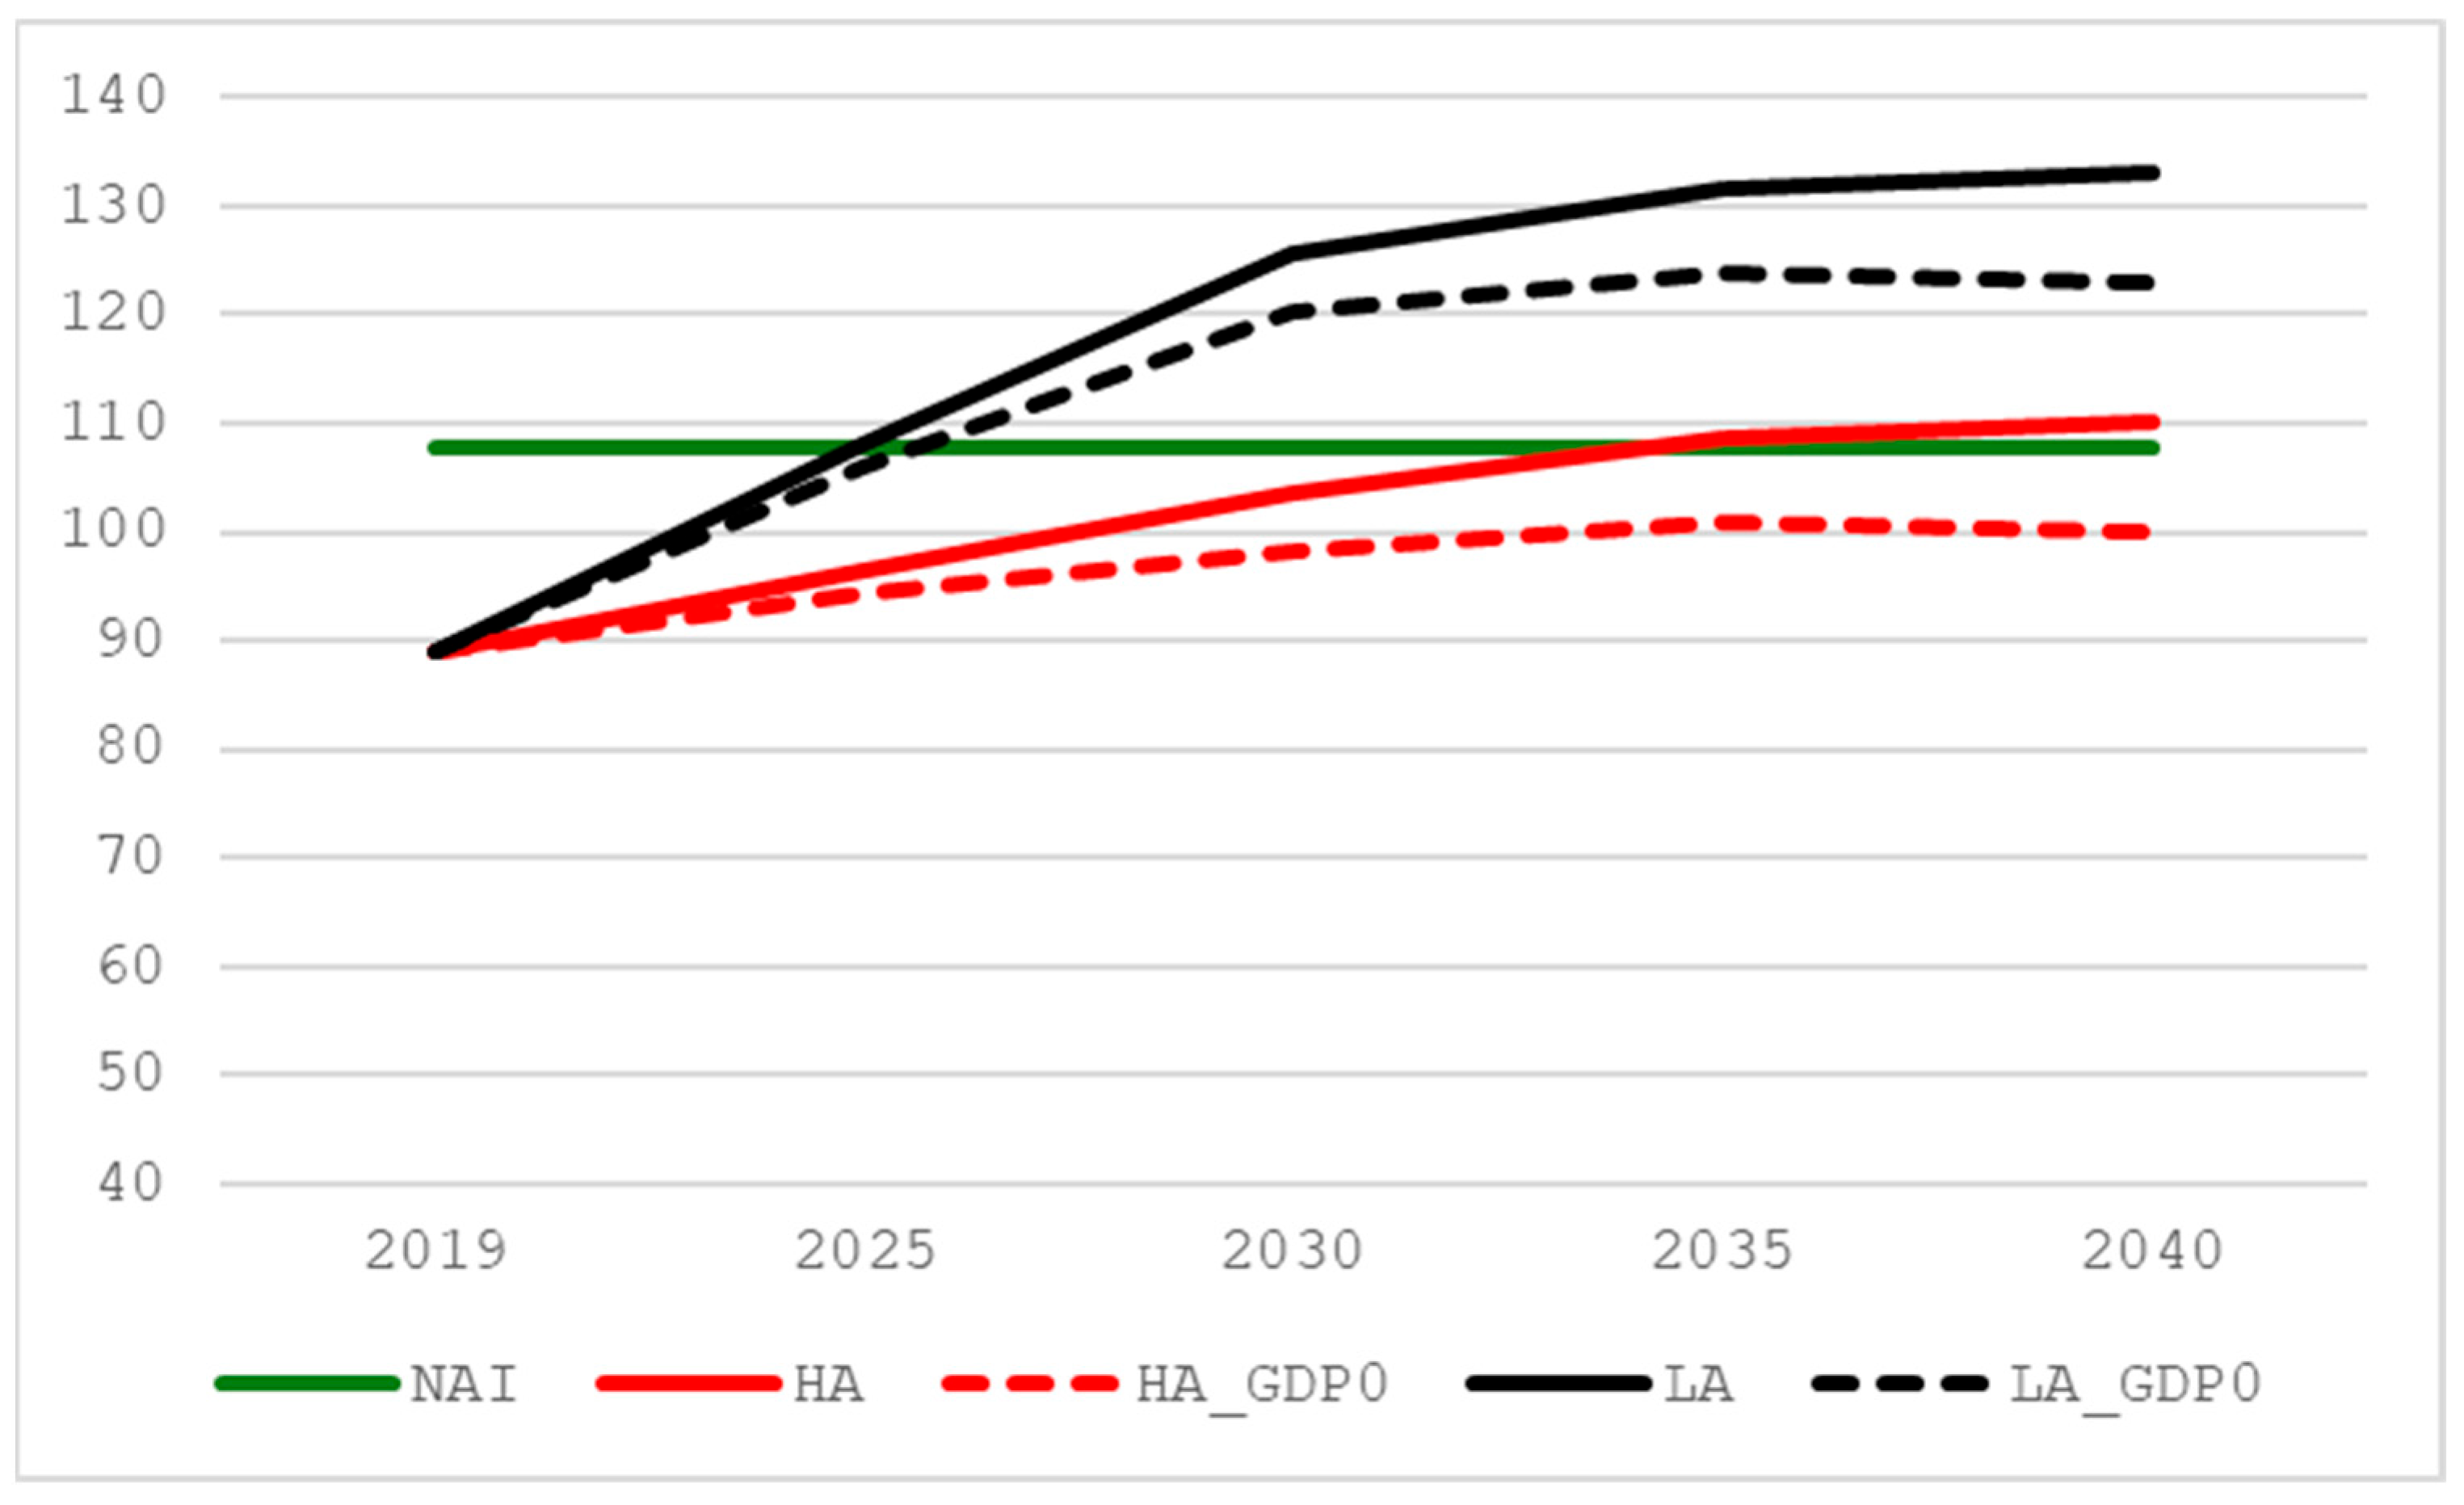
Figure 22 depicts fellings in the four scenarios and the average NAI for the period 2010 to 2020 in Region South. Yet again, in the absence of a clear trend in the NAI, the historic average can be seen as a plausible approximation of the future NAI. In the HA scenario, year 2035 is the inflection point, after which fellings become greater than the NAI, resulting in the forest turning from a sink to a source of carbon. Total use of primary wood in Region South increases by some 22.5% from 2019 to 2040 in this scenario, with energy and material uses projected to roughly grow at the same pace. In the LA scenario, the inflection point, after which fellings would be greater than the NAI, has already occurred in year 2025. The rate of increase in overall use of primary wood is highest from 2019 to 2030, 39%; between 2030 and 2040 it is a mere 5.7%. Total use of wood is projected to increase by around 47% from 2019 to 2040 in this scenario. Energy uses of primary wood, projected to grow by 67%, would mainly be responsible for this, while material uses increase by 23%. The same as in Regions West and East, even in the absence of growth in material uses of wood, the RED III target for the year 2030 would lead to decreasing forest carbon stocks and turn the forest from a sink to a source of carbon from year 2026 onward, according to scenario LA_GDP0. Only the combination of no growth in material uses of wood and the implementation of the lower target for 2030 in the 2018 revision of the RED applied in the EU Reference Scenario 2020 [
25] would permit the forest to remain a carbon sink in Region South for the whole outlook period.
6. Discussion and Conclusions
In addition to uncertainties surrounding any GDP projection, not least given the current geopolitical situation, structural changes in wood-products markets—notably falling demand for graphic paper over time—puts into question the aptness of GDP as a demand shifter and the reliability of demand elasticities (see, e.g., [
35]). This further motivates the use of scenario analysis to somewhat mitigate the aforementioned shortcomings. Further, the Ukraine–Russia armed conflict has already significantly affected the trade in wood products; however, longer-term impacts are uncertain. These effects are only partially accounted for in this study in the form of reduced imports of roundwood from Russia and Belarus. In addition, this study does not account for the impact of climate change on future regional forest growth. Hence, it is important to point out that the modelling results are “what-if” explorative scenarios, certainly not forecasts (“what-will-be”). Nevertheless, the overriding pattern of declining forest sinks until the year 2030 in all regions and in all scenarios is consistent with historical developments.
The four European regions under study differ in terms of population density, forest endowment, the size and composition of wood use, and forest policy priorities. In addition to forest endowment and, obviously, the relative size of wood use, the composition of wood use is determinant for how the regions fare in terms of the most basic form of sustainability, i.e., the development of the forest growing stock. Energy use of wood obviously precludes any further use. In contrast, wood-based manufacturing results in a main product which can be used once more for energy purposes in a single-stage cascade or, in a multistage cascade, at least once more in material form before disposal or recovery for energy purposes. In addition, wood-based manufacturing normally results in by-products which themselves can be used in the manufacturing of wood-based products or for energy generation.
In light of this, irrespective of the scenario envisioned, Region North is the only region that would see increasing forest growing stocks over the whole outlook period. This forest-rich region with a well-developed forest-based industry has the lowest overall share of wood used for energy and, importantly, by far the lowest share of energy in primary wood use. This outcome, i.e., increasing growing stocks over the whole outlook period, could also be seen as a reflection of the forest policy paradigm of the countries in this region of sustained-yield forestry [
36]. Still, even for Region North, the forest carbon sink would decrease over the outlook period at least until 2030 in all scenarios, as fellings grow faster than net annual increment, making it all but impossible to meet the EU LULUCF target for the year 2030. This conclusion is further strengthened considering that the scenario results do not account for the increased use of wood for energy purposes resulting from increased electricity prices as a consequence of sanctions and the sabotage of the Nordstream natural gas pipelines. This has led to a strong increase in fuelwood prices; e.g., in Finland, energy wood (fuelwood) prices were close to pulpwood prices in the third quarter of 2023 [
37]. Should this development continue, the closure or displacement of some wood-using industries can be expected to speed up (see, e.g., [
10]). This could somewhat ease the demand for wood in European regions while obviously hampering the growth of the European bioeconomy. The potential easing of sanctions on Russian hydrocarbons following the end of hostilities should reduce the energy demand for wood, which would be beneficial for wood-using industries and would increase the sustainability of forest usage in Europe through reduced fellings, ceteris paribus.
The results of this study clearly suggest that current renewable energy policies alone would lead to a strong increase in the demand for wood, at least until 2030. Results on the factual (ex-post) and projected (ex-ante) fellings indicate incongruence between the policy objectives of the amended Renewable Energy Directive (RED) and the revised LULUCF Regulation. This is a further confirmation of the persistence of horizontal and vertical policy incoherencies described in previous policy studies (e.g., [
12,
15,
36]), despite numerous voices that have highlighted the necessity of effective coordination of policies affecting the forest sector [
36].
There are a number of potential options, and combinations thereof, to mitigate these cross-sectoral and multilevel policy trade-offs. Net annual increment could be increased by increasing gross annual increment and/or reduce natural losses. This could prove difficult, though, at least in the short to medium term, particularly given climate change-induced calamities such as the recent bark beetle infestation. Secondly, the forest area could be expanded through afforestation; this, besides potentially jeopardizing other important land uses such as food production, would have minor effects in the time frame of this study. Thirdly, efforts could be made to increase imports of wood raw materials. It is, however, difficult to see how imports could be substantially increased given the geopolitical situation and environmental policy instruments in place, notably the EU Timber Regulation [
38] and its coming replacement, the EU Regulation on Deforestation-Free Products [
39], which constrain rather than promote transnational timber trade [
15]. Further, from a climate change mitigation perspective, this would in any case be a dubious approach, as it would imply increasing fellings and/or crowding out of wood uses elsewhere, possibly negating any climate benefits achieved in Europe. More promising avenues are to increase the efficiency in manufacturing and energy generation along with an overall enhancement of cascading wood use. The high share of primary woody biomass in wood used for heat and power in all European regions but Region North underscores the importance of increased cascading. However, achieving both RED and LULUCF policy targets would most likely require a combination of increasing forest growth and enhanced cascading.


