1. Introduction
Fossil fuels dominate the global energy supply, accounting for 85.5% of consumption, but their use leads to resource scarcity, climate change, pollution, and environmental degradation. In 2024, energy demand grew by 2.5%, driven mainly by natural gas and renewables, while coal use declined. Renewables, especially solar, achieved record growth, highlighting the shift toward sustainable energy. However, solar photovoltaic (PV) systems, a key renewable energy source, face efficiency challenges due to dependency on atmospheric conditions and partial shading caused by factors like shadows and dust.
Partial shading is a critical impediment to the optimal performance of solar arrays. Even a single shaded solar cell in a series, parallel, or other configuration can result in efficiency losses for the entire array. As shading on one array can adversely affect all interconnected arrays, this problem becomes even more pronounced when multiple arrays are linked to meet specific voltage and current requirements. Solar panels can be shaded by a variety of obstacles, including buildings, trees, and elevated structures, and atmospheric conditions, like partially cloudy weather. In reality, it is impossible to completely eliminate shading on panels, so mitigating these factors is a complex challenge. Therefore, strategies must be developed to minimize the detrimental effects of partial shading on solar panel efficiency [
1].
The power output of a PV array is decreased by partial shading because it causes mismatch loss inside the string of traditional series–parallel configurations. To address these problems and boost performance, previous studies have tended to focus primarily on either interconnection schemes or MPPT techniques. Solutions include maximum power point tracking (MPPT) [
2], bypass diodes [
3], and optimized array designs, like series–parallel, cross-tied, bridge-link, or honeycomb configurations, to minimize mismatch losses [
4,
5,
6,
7].
MPPT algorithms are defined to track the GMPP by analysis of the PV curves. The repetitive occurrence of false MPPT has been reported in many cases. It has been observed in previous research that the fragment saturation in the PV curves confuses the MPPT algorithms’ ability to track the GMPP efficiently. MPPT algorithms can only find the GMPP precisely if there is consistency in the PV curve. Consistent irradiance and exposure to sunlight of the whole array cannot be promised due to the dependency on the weather and environment conditions. The fragments in the PV curve can be controlled by considering the shading effects prior to the array design, so that minimal shade fluctuations occur on the array. Various interconnection schemes have been employed to improve PV curves. These interconnection schemes include HC [
6], cross-tying [
7], and bridge linking [
8]. These reduce the shade effects to further minimize the power fluctuation, which causes fragment saturation in PV curves. These interconnection patterns or schemes split the panel’s arrays into small pieces of series and parallel configurations, and then form these smaller arrays into different patterns, creating the HC, BL, and TCT schemes [
9]. All of these schemes propose a regularized pattern of the panel configuration without accounting for the fact that the shading conditions will not be similar for all arrays, which are at different locations of the globe. Assuming a site has solar tracker racking, where the whole array will be at the same azimuth, it can follow a regular pattern of interconnection by following the aforementioned schemes. An array with fixed-tilt racking on the east-, west-, and south-facing roofs with some tress around a side cannot follow a regular pattern for interconnection. There should be an interconnection scheme that takes the prior site conditions into account and proposes site-specific interconnection to gain the maximum output from the system and make the PV curve less fragmented or consistent up to an extent so that MPPT can work properly. It was observed in an empirical literature review that a regularized or fixed connection pattern in the PV array cannot make the PV curve stable or less fragmented. The BL configuration, while it yields maximum output, among other things, also introduces fixed bridge links among the PV panels, such as links among the diodes in a full-wave rectifier. This connection scheme lacks the consideration of mismatch losses, as the upstream and downstream panels on the link face different irradiance levels. This pattern, again, produces large mismatch losses compared to those panels that are linked with the same level of irradiance. Hence, modifying the BL configuration is necessary to further minimize these losses, making the PV curve less fragmented and more stable. This study provides innovative solutions to address the challenges posed by shading, proposing a Modified BL configuration to enhance the PV system performance under real-world conditions. The Modified BL configuration will not follow the regular pattern for panel interconnection but will be set up in such a manner to bridge the panels based on the irradiance level. Furthermore, in this work, the key performance metrics, such as the energy yield, module temperature, and overall system stability, are analyzed. The Modified BL configuration minimizes the shading impact by ensuring that only a few cells are affected, reducing losses and enhancing system reliability.
Additionally, this configuration addresses the issue of connecting multiple solar modules, preventing the efficiency degradation of the entire string in case any panel is shaded. This feature is particularly significant in real-world scenarios, ensuring optimal energy output, even under partial shading conditions. Moreover, the Modified BL configuration is compatible with maximum power point tracking (MPPT), enhancing the energy yield of connected solar cells. It supports MPPT functionality, dynamically optimizing the operating point of each cell, thus maximizing energy generation and minimizing the impact of partial shading.
2. Materials and Methods
During power dissipation, shaded modules exhibit reverse bias behavior due to a mismatch between the PV modules. As a result, the shadowed modules’ temperature rises, causing hotspots and damage. To lessen the hotspot impact, passive diodes are positioned in between the PV modules. A PV array will exhibit several maximum power peaks as a result of these bypass diodes, requiring the implementation of a sophisticated MPPT algorithm [
10].
Partial shading conditions are the reasons for mismatch losses across PV designs. As a result, PV systems may draw less energy from the sun. PSCs on PV arrays can be reduced by selecting the appropriate PV design, moving the PV modules physically, and utilizing maximum power point tracking (MPPT) [
11,
12,
13,
14].
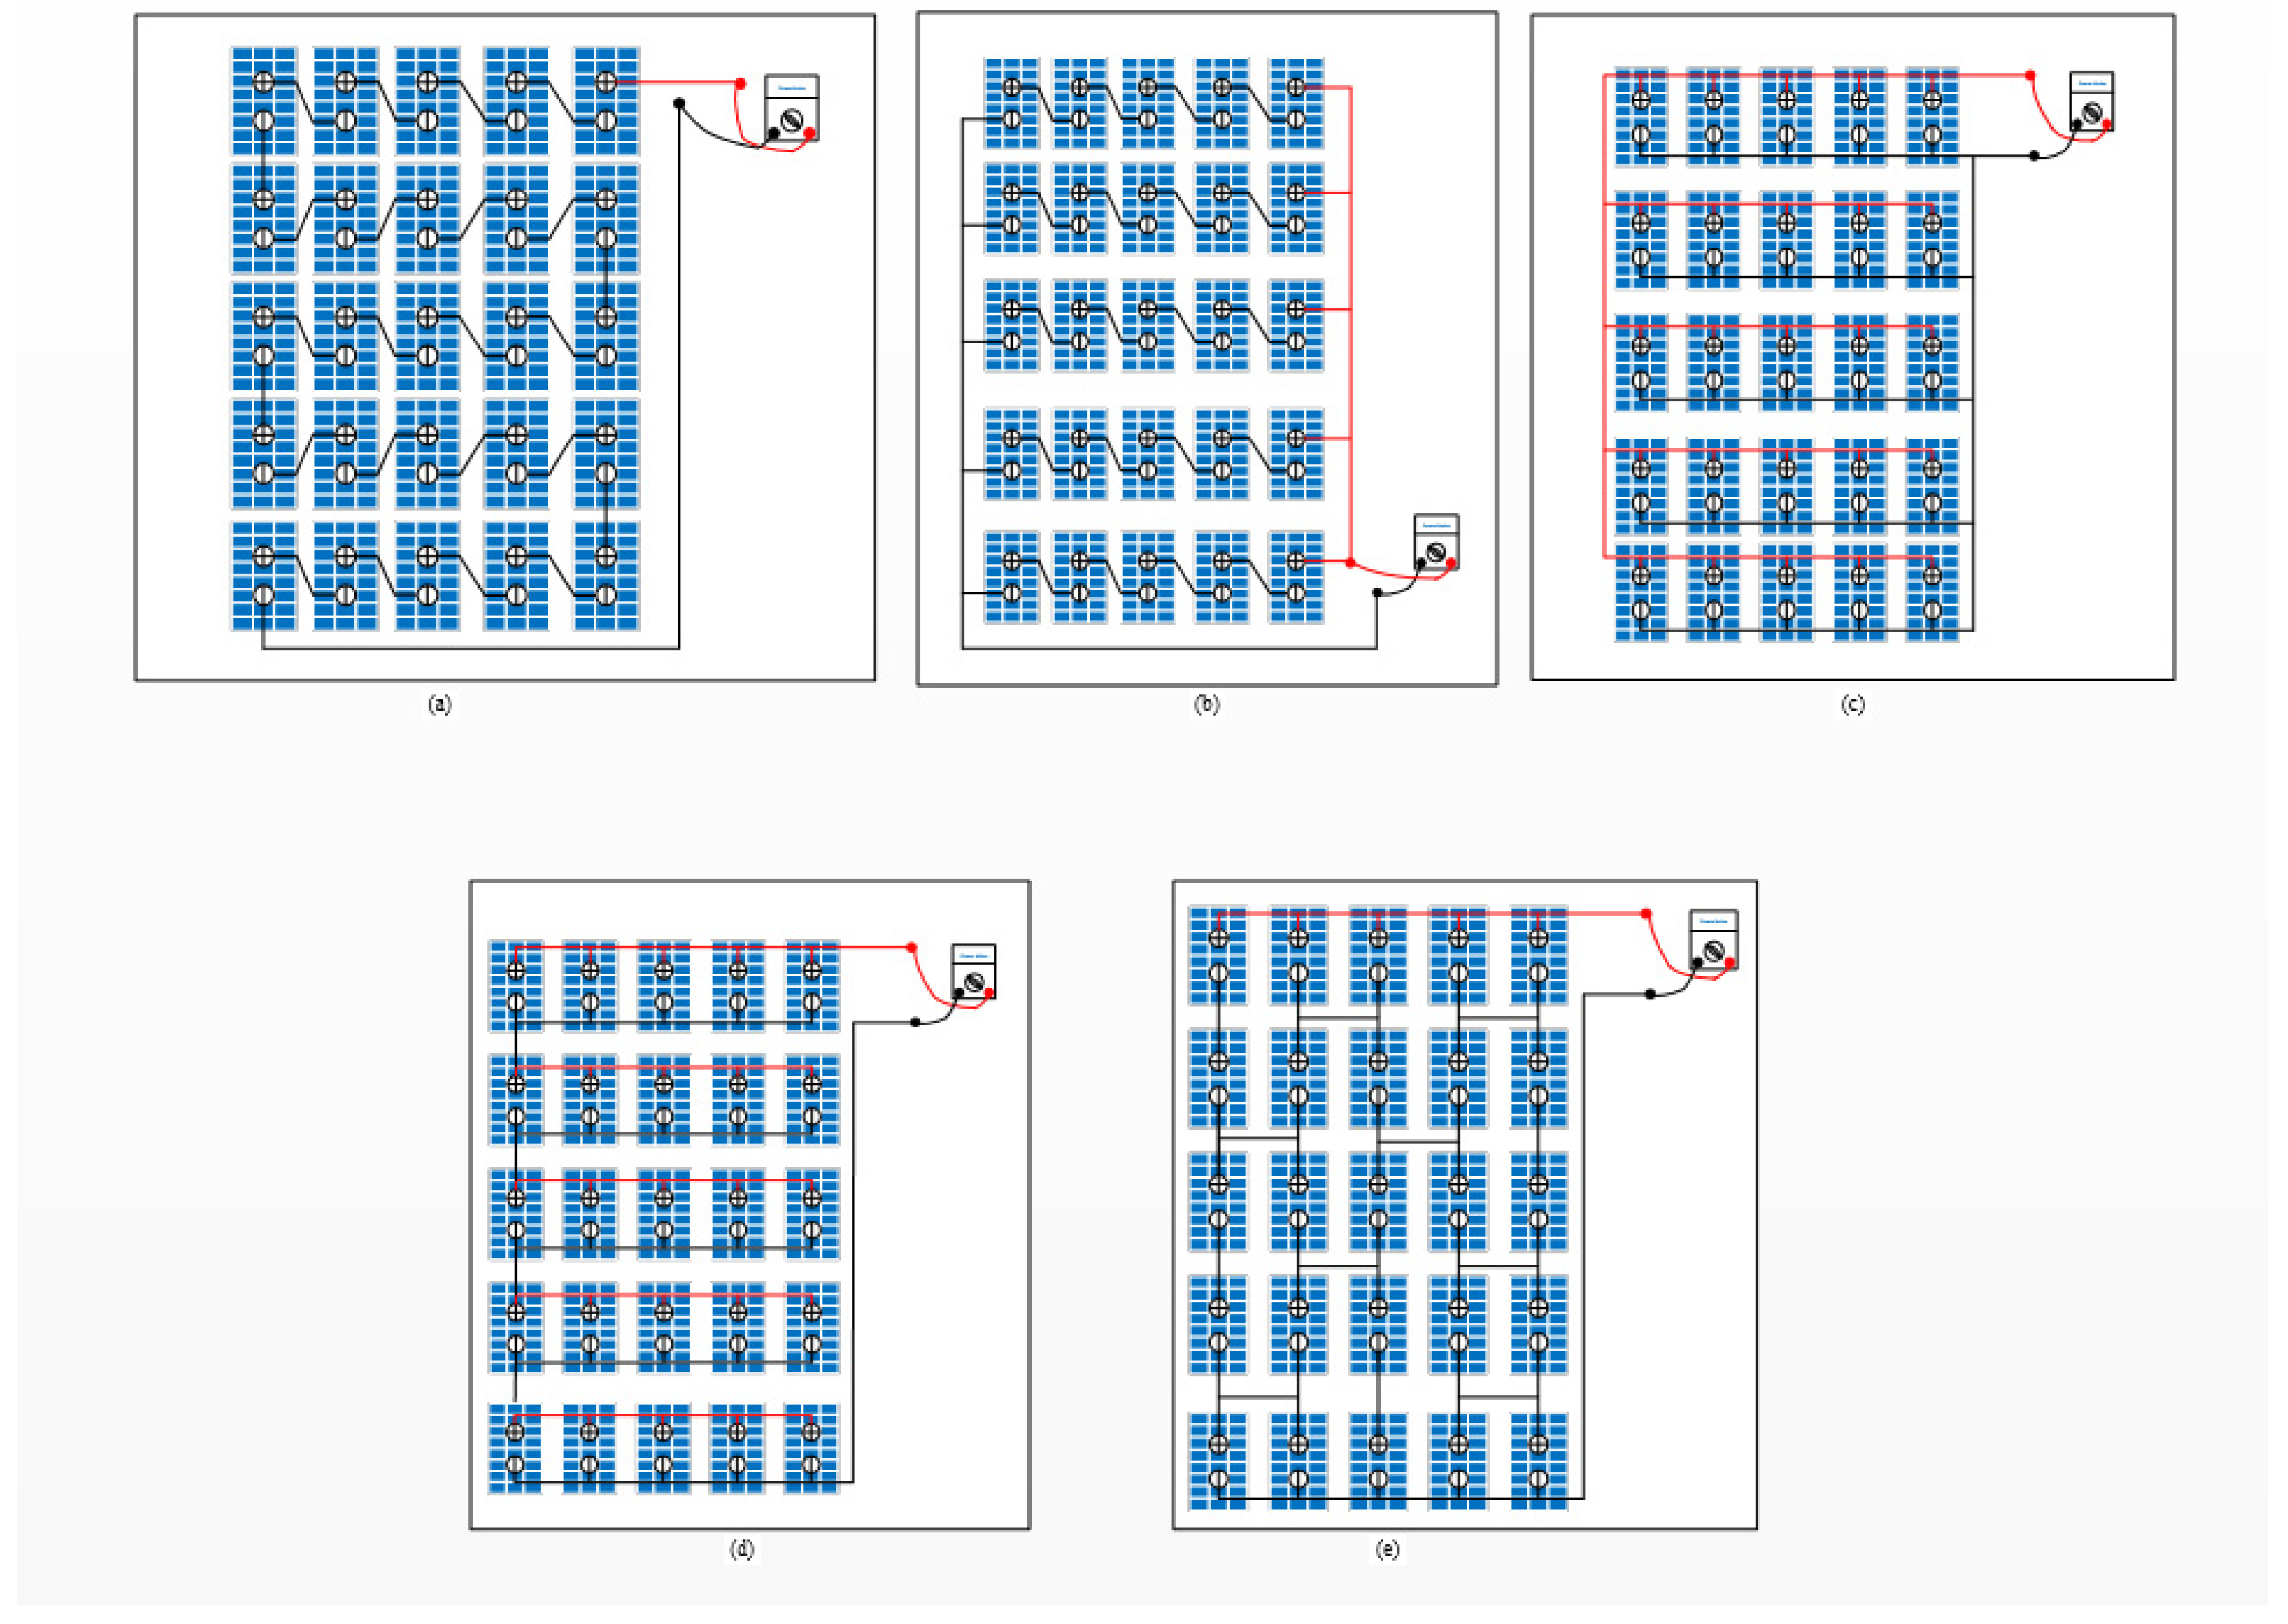
Figure 1 shows several PV configurations as series, parallel, series–parallel (SP), total cross-tied (TCT), and bridge-linked (BL) configurations [
15,
16,
17,
18,
19]. The fundamental configurations are series and parallel, as seen in
Figure 1a,d; detailed discussion on these configurations can be found in [
11,
20,
21,
22].
Lower voltage and current are produced in both series and parallel arrangements. To obtain the necessary voltage, the module is first connected in a series. After that, it is connected in parallel with another series-connected module. In a TCT configuration, ties are connected across rows of junctions to form an SP configuration. Across the ties in a TCT configuration (
Figure 1c), the voltages are equal. The current is evenly distributed across the various ties. As a result of the SP configuration, power is obtained.
Figure 1e shows a BL configuration in which the modules are connected as bridge rectifiers. There is a series connection between two modules and then a parallel connection between them in the bridge. Ties are present between the bridges. By appropriately adding the voltages in series and the currents in parallel, the voltages and currents are calculated.
2.1. Modeling of a PV Module
Usually, the modeling approach is implemented using lumped circuit models for PV systems. There are several lumped circuit models for PV available, including the PV double diode model [
20], the “Rs” model (which consists of an ideal model with a series resistance), the PV model (which consists of an ideal model with series and shunt resistances), and the ideal PV model (which consists of a current source and a diode). These lumped circuit models are used to model PV modules. Each lumped model demonstrates a varying degree of accuracy and complexity when used to model PV modules. The number of diodes and the use of shunt and series resistances distinguish the various lumped circuit models from one another. There is considerable variation in the methods used to find the parameters of these lumped models. A lumped model’s complexity is directly correlated with the quantity of parameters that require identification. The lumped model’s complexity grows together with the complexity of the methods used to calculate its parameters and execution time. The solar cell is the only energy source shown in
Figure 2.
The positive current is defined as the source current or the current flowing through the active devices. Since energy is used by the passive components, the current for these devices is deemed negative as per Kirchhoff’s current law.
2.2. Analysis of Partial Shading Conditions
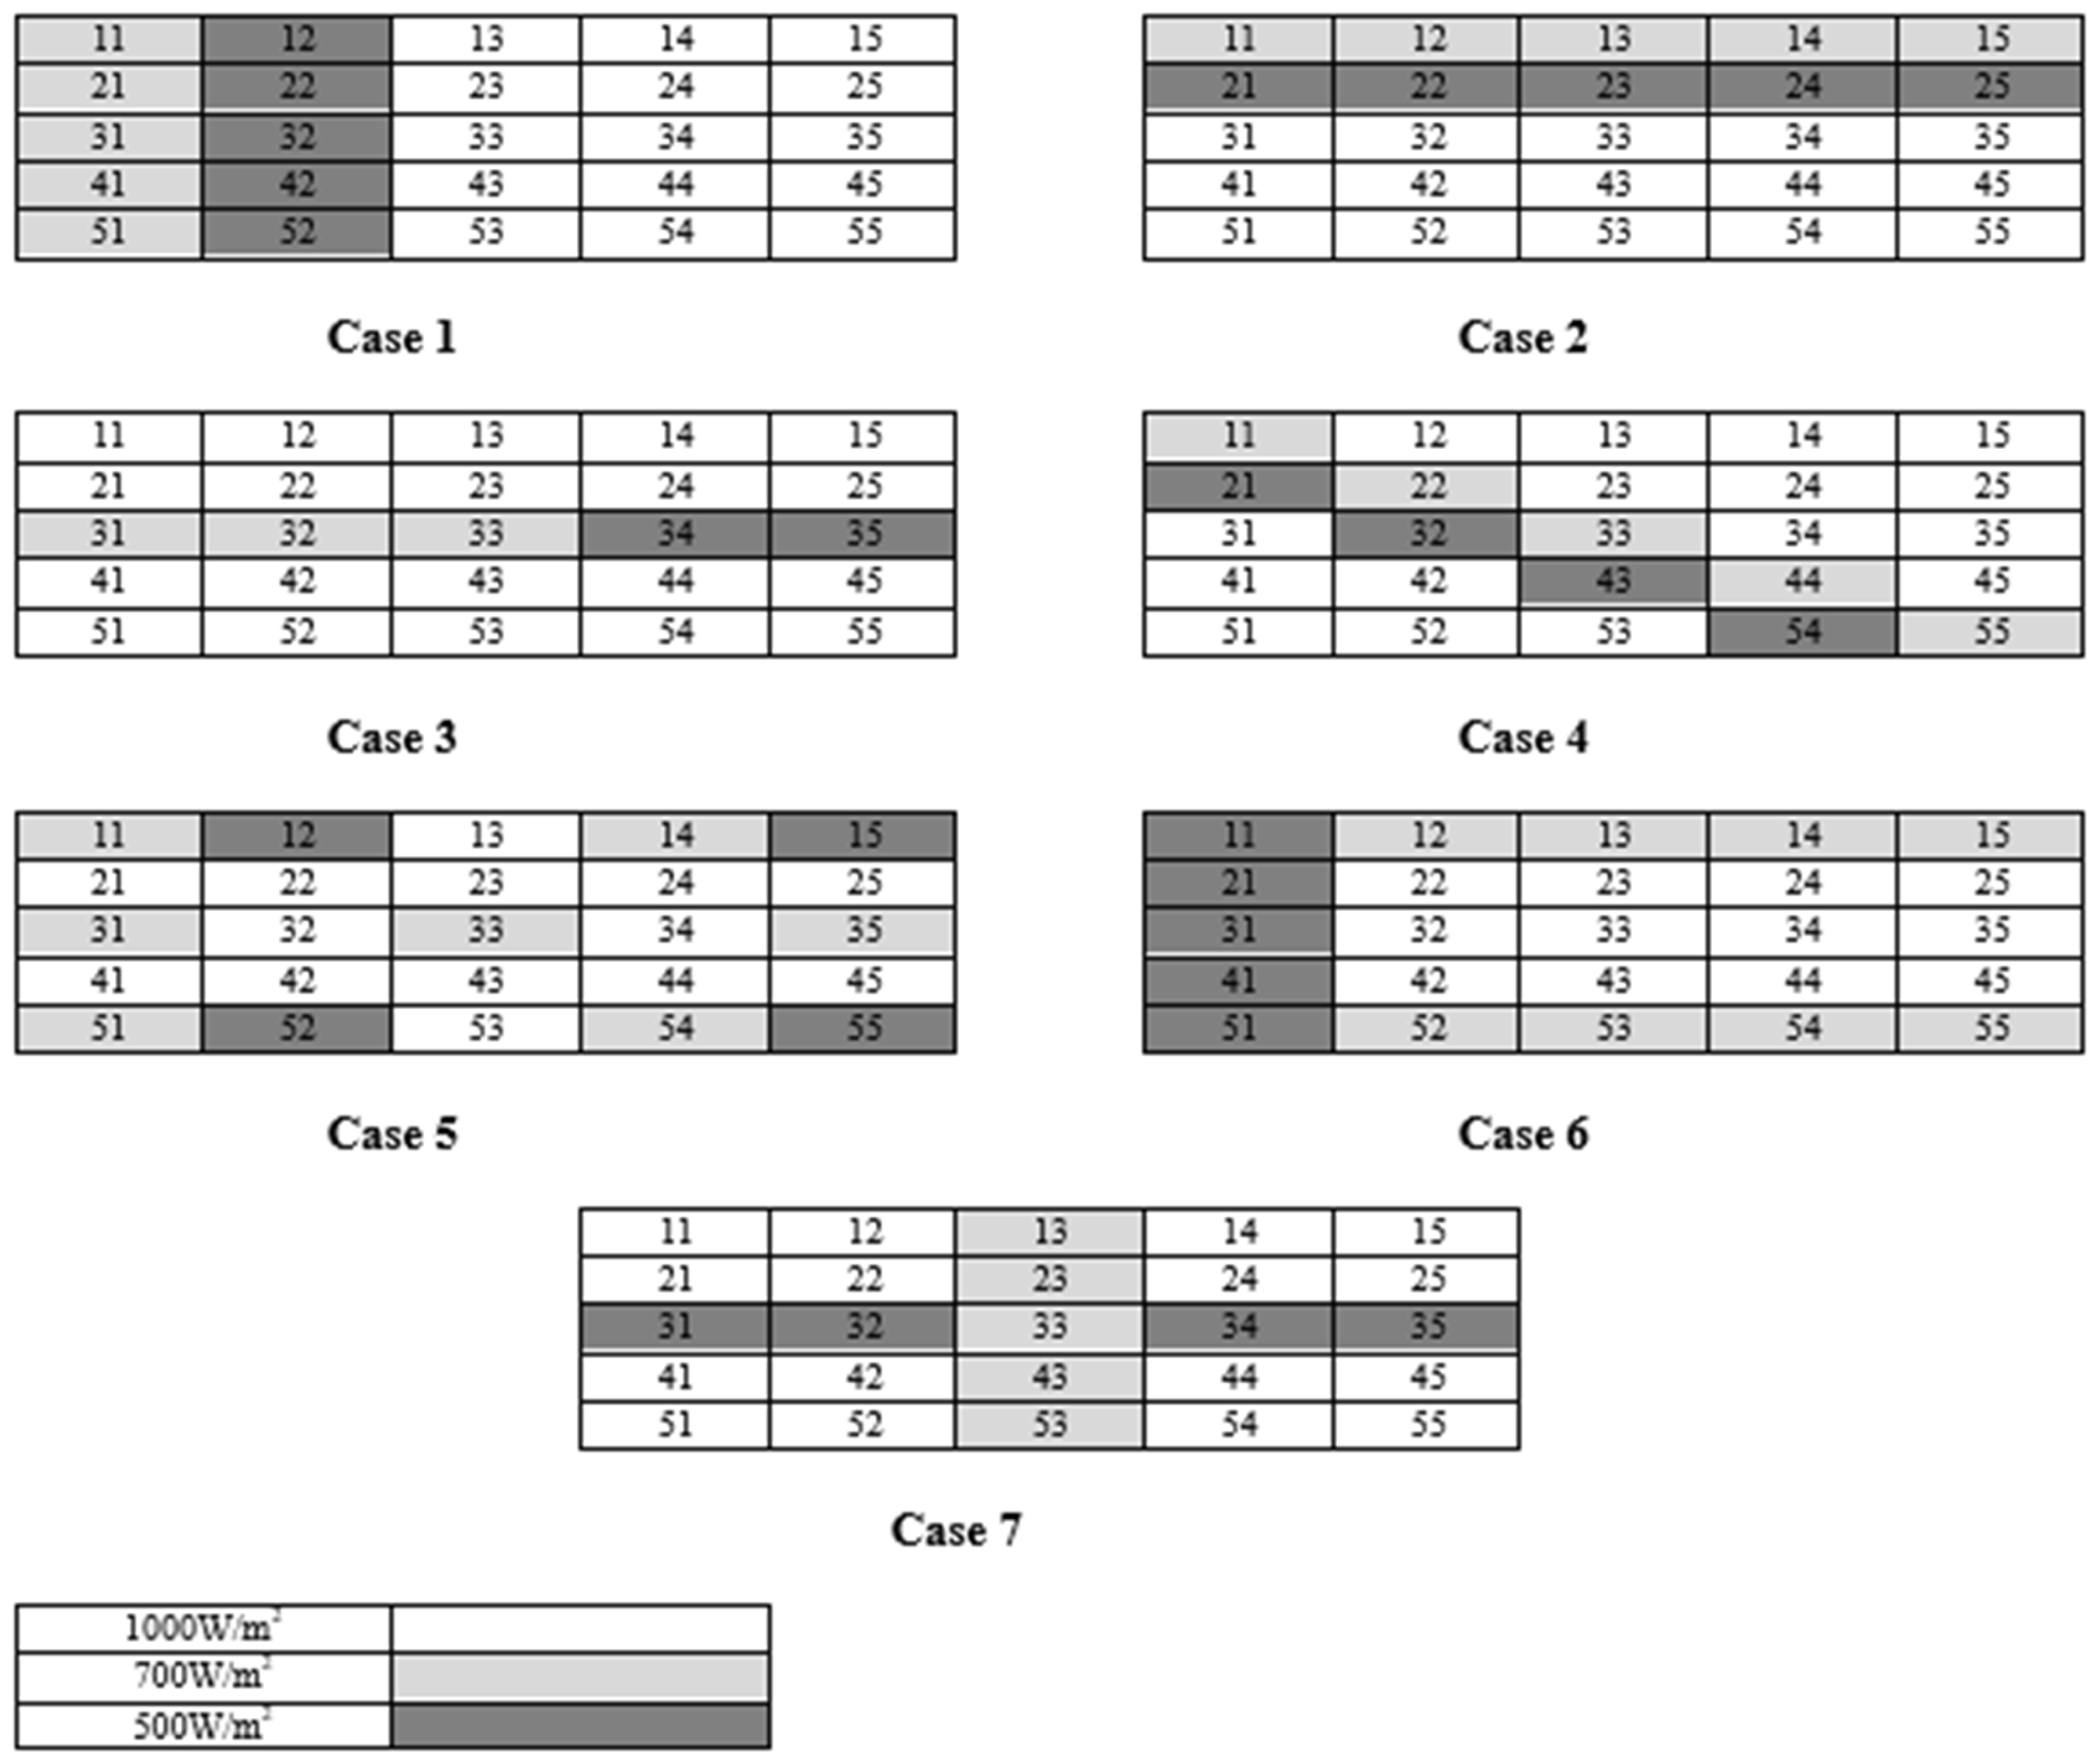
Components of the PV array, module, or cell will not receive the necessary amount of irradiance when there is partial shading. Conditions of partial shading may arise because of nearby buildings, dust, trees, or utility and lighting poles. The discretization approach affects the modeling result correctness to some extent. Ensuring that the PV panels were appropriately represented in the modeling process was crucial because one of the primary goals of this study was to ascertain how well PV systems work even when partially shaded. The square crystalline silicon cells in the reference PV panel were arranged in a 5 × 5 arrangement and evenly spaced along the module’s length and width.
Figure 3 illustrates the shading effects on a PV array by a nearby building and electric pole. The PV modules were seen to obtain different irradiance values as a result of passing clouds, which resulted in random shading conditions. Different shading patterns, such as short–narrow, short–wide, long–narrow, long–wide, and diagonal, are regarded as shading conditions on PV arrays.
To thoroughly investigate the impact of partial shading on PV array configurations, a comprehensive analysis was conducted on a 5 × 5 PV array under various shading conditions. These conditions included diagonal, short–narrow (SN), long–narrow (LN), short–wide (SW), and long–wide (LW) shading patterns, which were carefully simulated to mimic real-world scenarios [
12]. This study examined the effects of shading on PV configurations at a temperature of 25 °C, with diverse irradiance values. In the uniform shading condition, all 25 modules of the PV array received an equal irradiance value of 1000 W/m
2 under standard test conditions (STCs). However, in the considered shading conditions, the shaded modules received unequal amounts of irradiance, specifically 700 W/m
2 and 500 W/m
2 under STCs. This allowed for a detailed evaluation of how different shading patterns and intensities affected the performance of various PV array configurations. The analysis aims to provide valuable insights into the impact of partial shading on PV array performance, ultimately supporting the development of more efficient and resilient solar energy systems.
2.3. Array Selection
A 5 × 5 PV array, comprising a total of 25 modules, was utilized to evaluate the performance of various PV configuration schemes. The array was arranged in a matrix with 5 rows and 5 columns, as illustrated in
Figure 3. Each module was assigned a unique number in the matrix to facilitate the analysis. The maximum irradiance level considered for the modules was 1000 W/m
2, which is the standard test conditions (STCs) for photovoltaic modules, as highlighted in white color in
Figure 3. However, to simulate partial shading conditions, some modules were intentionally set to receive lower irradiance levels, ranging from 700 W/m
2 (grey color) to 500 W/m
2 (black color). The values of 1000 W/m
2, 700 W/m
2, and 500 W/m
2 are represented with white, grey, and black colors, respectively, as shown in
Figure 3. This controlled environment allowed for a comprehensive investigation of how different PV configuration schemes responded to various shading scenarios, enabling the identification of optimal configurations for maximizing energy output under partial shading conditions. By analyzing the performance of each module and the overall array, valuable insights were gained into the effects of partial shading on PV array performance and the efficacy of different configuration schemes in mitigating these effects. The PV array configuration is shown in
Figure 4.
2.4. Performance Parameter
The PV array configurations were rigorously evaluated and analyzed based on three key performance indicators: maximum power (
Pgmp), fill factor (
FF), and mismatch loss (
ML). Under various shading conditions, these matrices provided a comprehensive understanding of the array’s efficiency. In partial shading conditions (PSCs), the fill factor (
FF) is defined as the product of the open-circuit voltage and the short-circuit current under the same conditions [
13]. In other words,
FF represents the ability of the PV array to convert available power into usable power. A higher
FF indicates better performance, as shown in Equation (1). The optimal PV array configuration can be identified and selected for various shading scenarios, ensuring maximum energy output and efficiency.
where the short-circuit current,
, open-circuit voltage,
, and
Pgmp are used to calculate the maximum global power available in partial shading conditions.
The power loss resulting from the mismatch between the individual PV modules and the global maximum power available from the PV array designs under partial shading conditions (PSCs) was measured by a crucial performance statistic called mismatch loss (
ML). It is defined as the discrepancy between the global maximum power output from the PV array configuration and the total of the maximum powers available from each PV module. Stated differently,
ML is the power loss resulting from a system in which individual modules are connected and function in non-uniform shading conditions. The main cause of this loss is the variance in the current and voltage outputs between the modules, which lowers the total power output. By minimizing the mismatch loss (
ML), the overall efficiency and performance of the PV array can be significantly improved, ensuring optimal energy harvesting under various shading conditions. This is calculated by Equation (2).
is the total global maximum power available from the PV array configurations under PSCs, and is the amount of individual accessible maximum power from the PV modules.
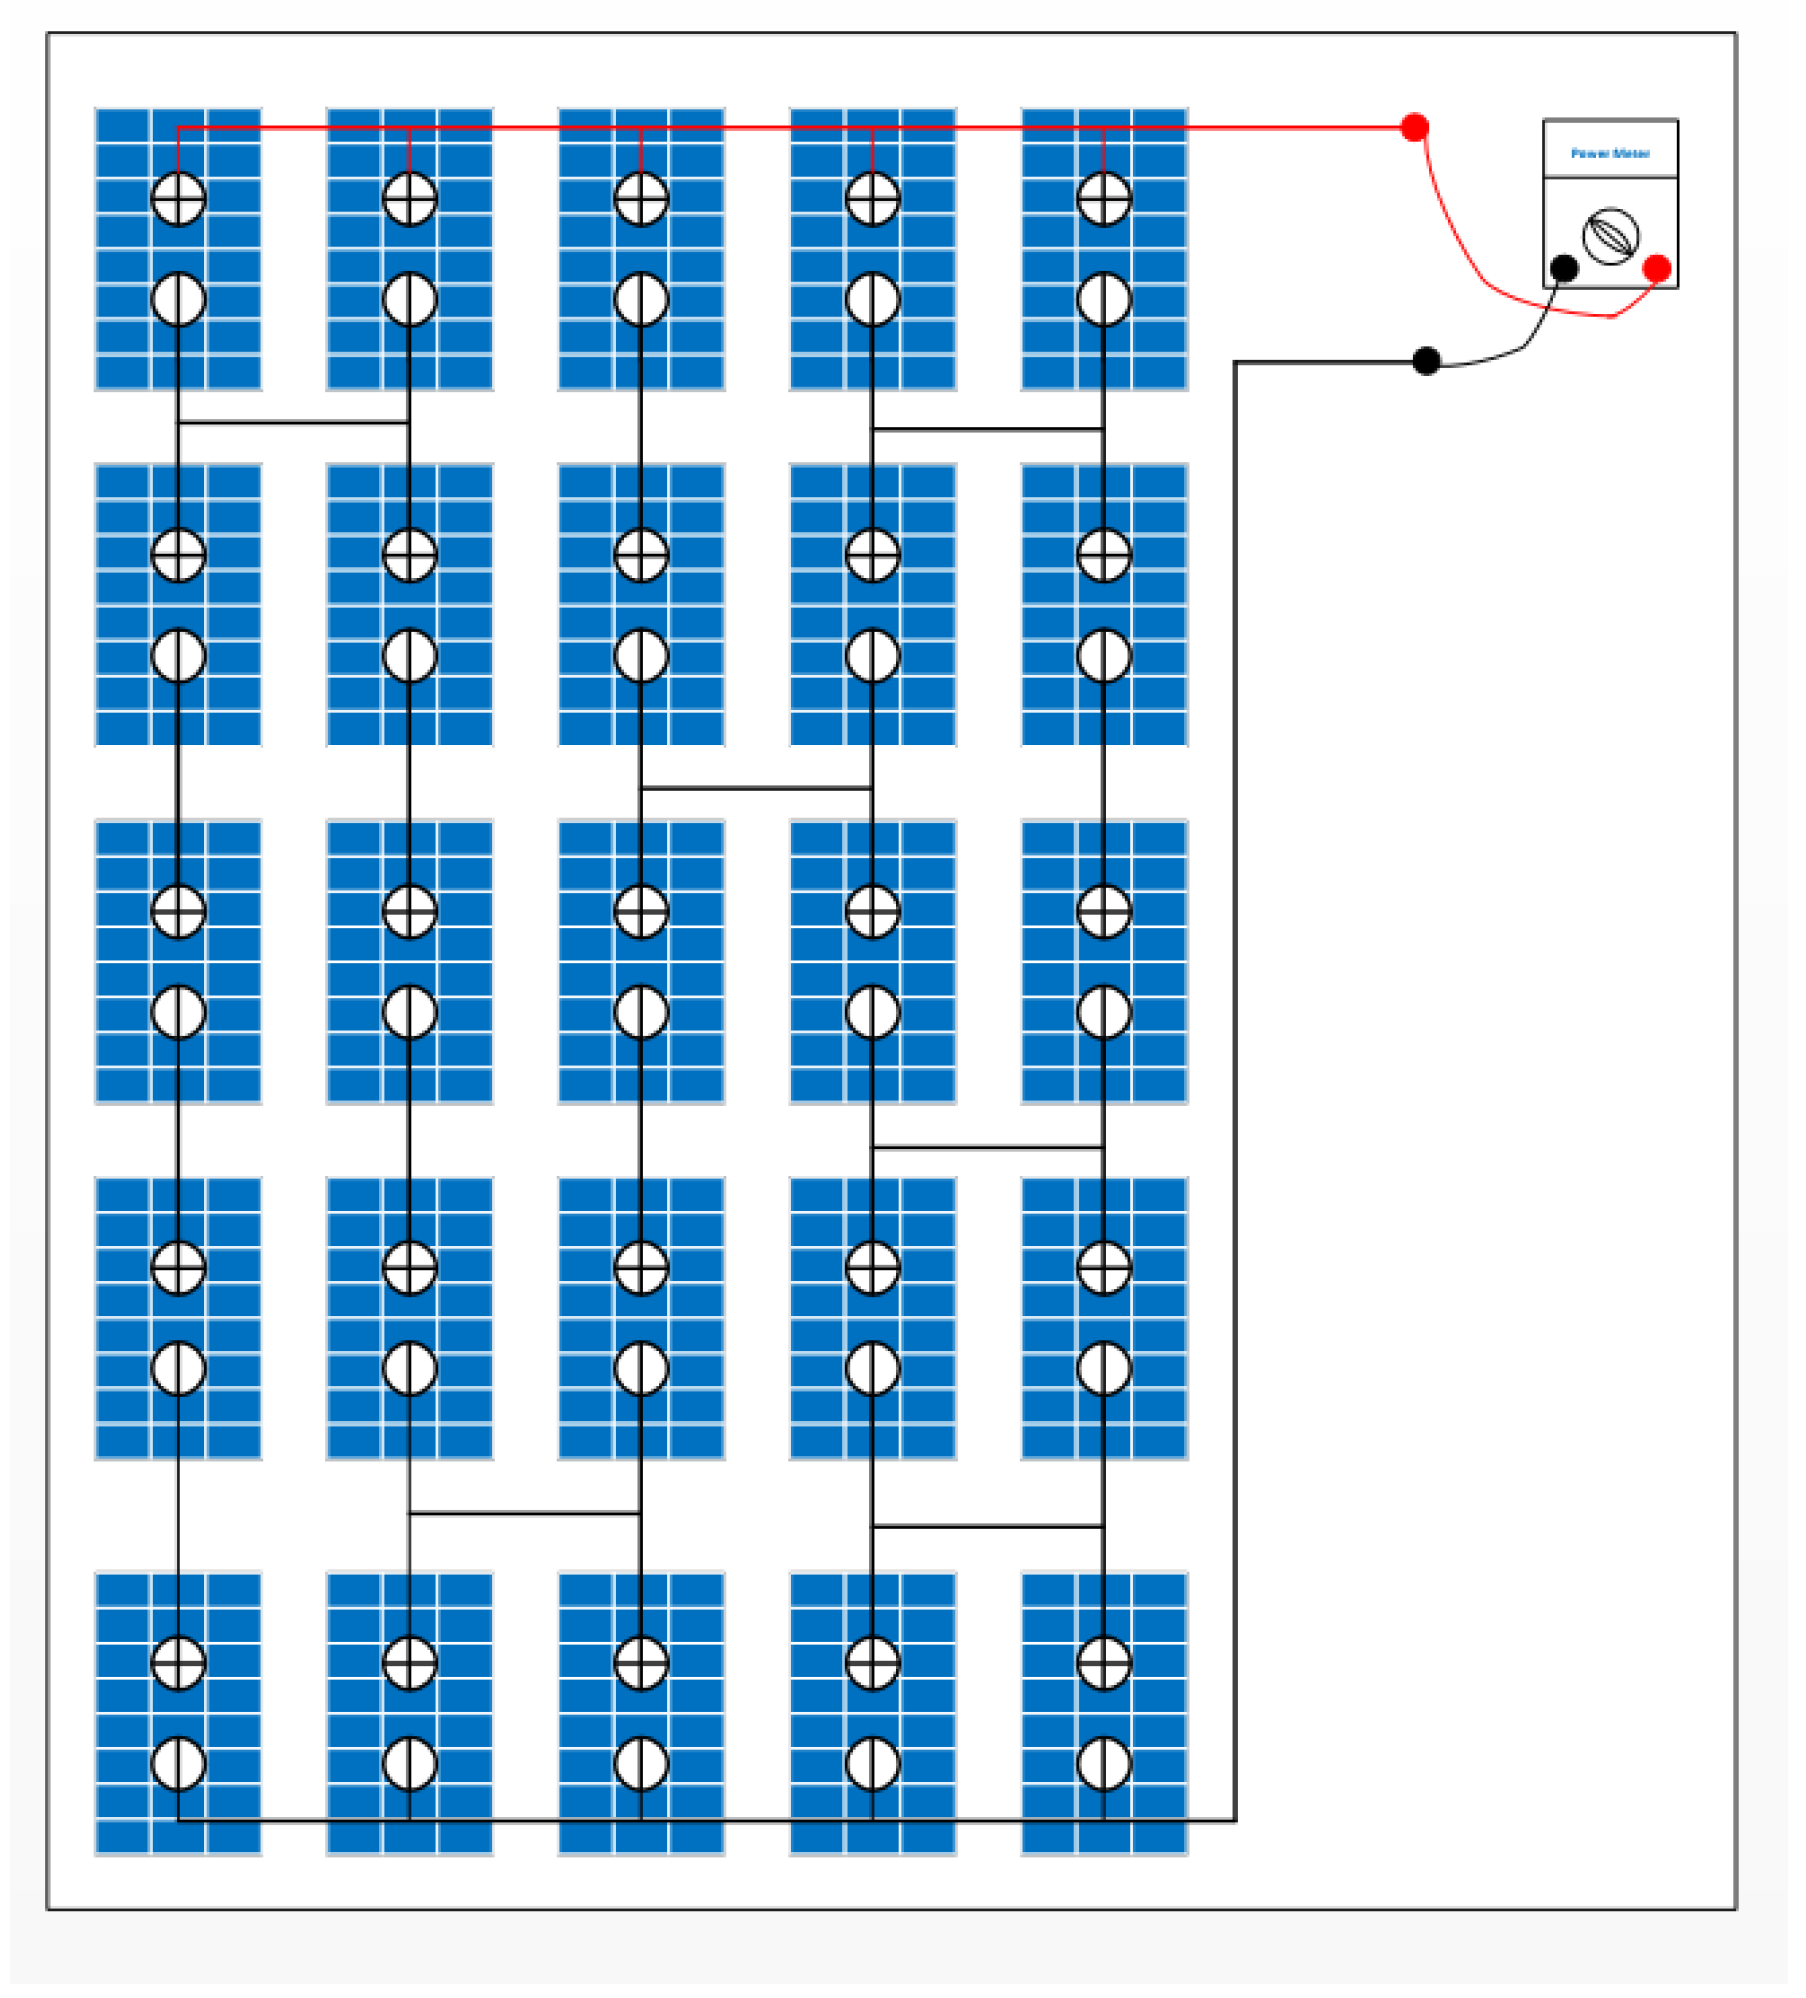
2.5. Proposed Modified BL Configuration
This study aims to improve the performance of the bridge-linked (BL) design while addressing the efficiency issues caused by shade on photovoltaic (PV) arrays. Incidents involving shading cause solar panels to produce less energy, which lowers the overall efficiency of interconnected arrays. Conventional BL arrangements use different links for every two diodes, such as complete rectifier circuits. By optimizing the BL arrangement, this study reduces the effects of shading and increases the overall efficiency of the proposed strategy. The proposed Modified BL PV array configuration is shown in
Figure 5.
This study investigated several panel configurations and models to determine the efficacy of the bridge-linked PV setup. To increase the efficiency of the BL configuration, this study tested different solar panel locations and connections. Our methodology was centered on maximizing the energy yield even in the presence of partial shading by optimizing the topological arrangement of panels inside the BL configuration.
To reduce the negative effects on the entire array, a bridge link is introduced near the shaded panels in the proposed change. By setting up a row of two modules that are connected in series, this bridge link creates a parallel connection. This layout makes sub-arrays within the overall configuration, which allows for the interconnection of many arrays running at the same power level. Our goal is to isolate and reduce the effect of shading on the connected sub-arrays by carefully positioning the bridge connection in close proximity to the shaded panels, thus increasing the overall efficiency of the PV system.
Additionally, by permitting the configuration of arrays with fewer or more than four panels, this study accounted for partial shade scenarios. This adaptability makes it possible to maximize the efficiency of the array in accordance with the unique shading circumstances that arise. The proposed approach aims to maximize the overall efficiency of PV systems by flexibly adjusting the array layout to different degrees of shading.
3. Results
The performance of several PV setups under varying irradiance levels and partial shading conditions was assessed in MATLAB Simulink simulations. For this investigation, a 72-cell, 310 W solar module was chosen, with the specifications shown in
Table 1. A Simulink model of the PV array was used as the solar module in a range of scenarios. The parameters were utilized in the Simulink model, showing the exact layout of the PV array. The purpose of these simulations was to examine how varied irradiance levels and partial shading situations affected the maximum power production, fill factor, and mismatch loss of different PV setups. By using MATLAB Simulink (v2018), the simulations provided a comprehensive and detailed performance analysis of the PV configurations, enabling the identification of optimal configurations for maximizing energy output under various conditions.
Four topologies of photovoltaic arrays—total cross-tied (TCT), BL, series–parallel, and series—are thoroughly analyzed in this section under both normal and partial shading conditions (PSCs). Finding the optimal solar array structure with overall higher performance was the main goal, considering important parameters like the maximum power output and mismatching losses. The performance of each design was thoroughly examined, with an emphasis on reduced power losses and offsetting the impacts of partial shading. The format of the analysis allows for a comparative evaluation of the four configurations, with the ultimate goal of identifying the configuration that offers the best performance and is most appropriate for real-world uses. This study aims to provide important insight into the ideal photovoltaic array structure for different operating situations by analyzing the maximum power production and mismatching losses. This will aid in the creation of more durable and efficient solar energy systems.
3.1. Series PV Array Configuration
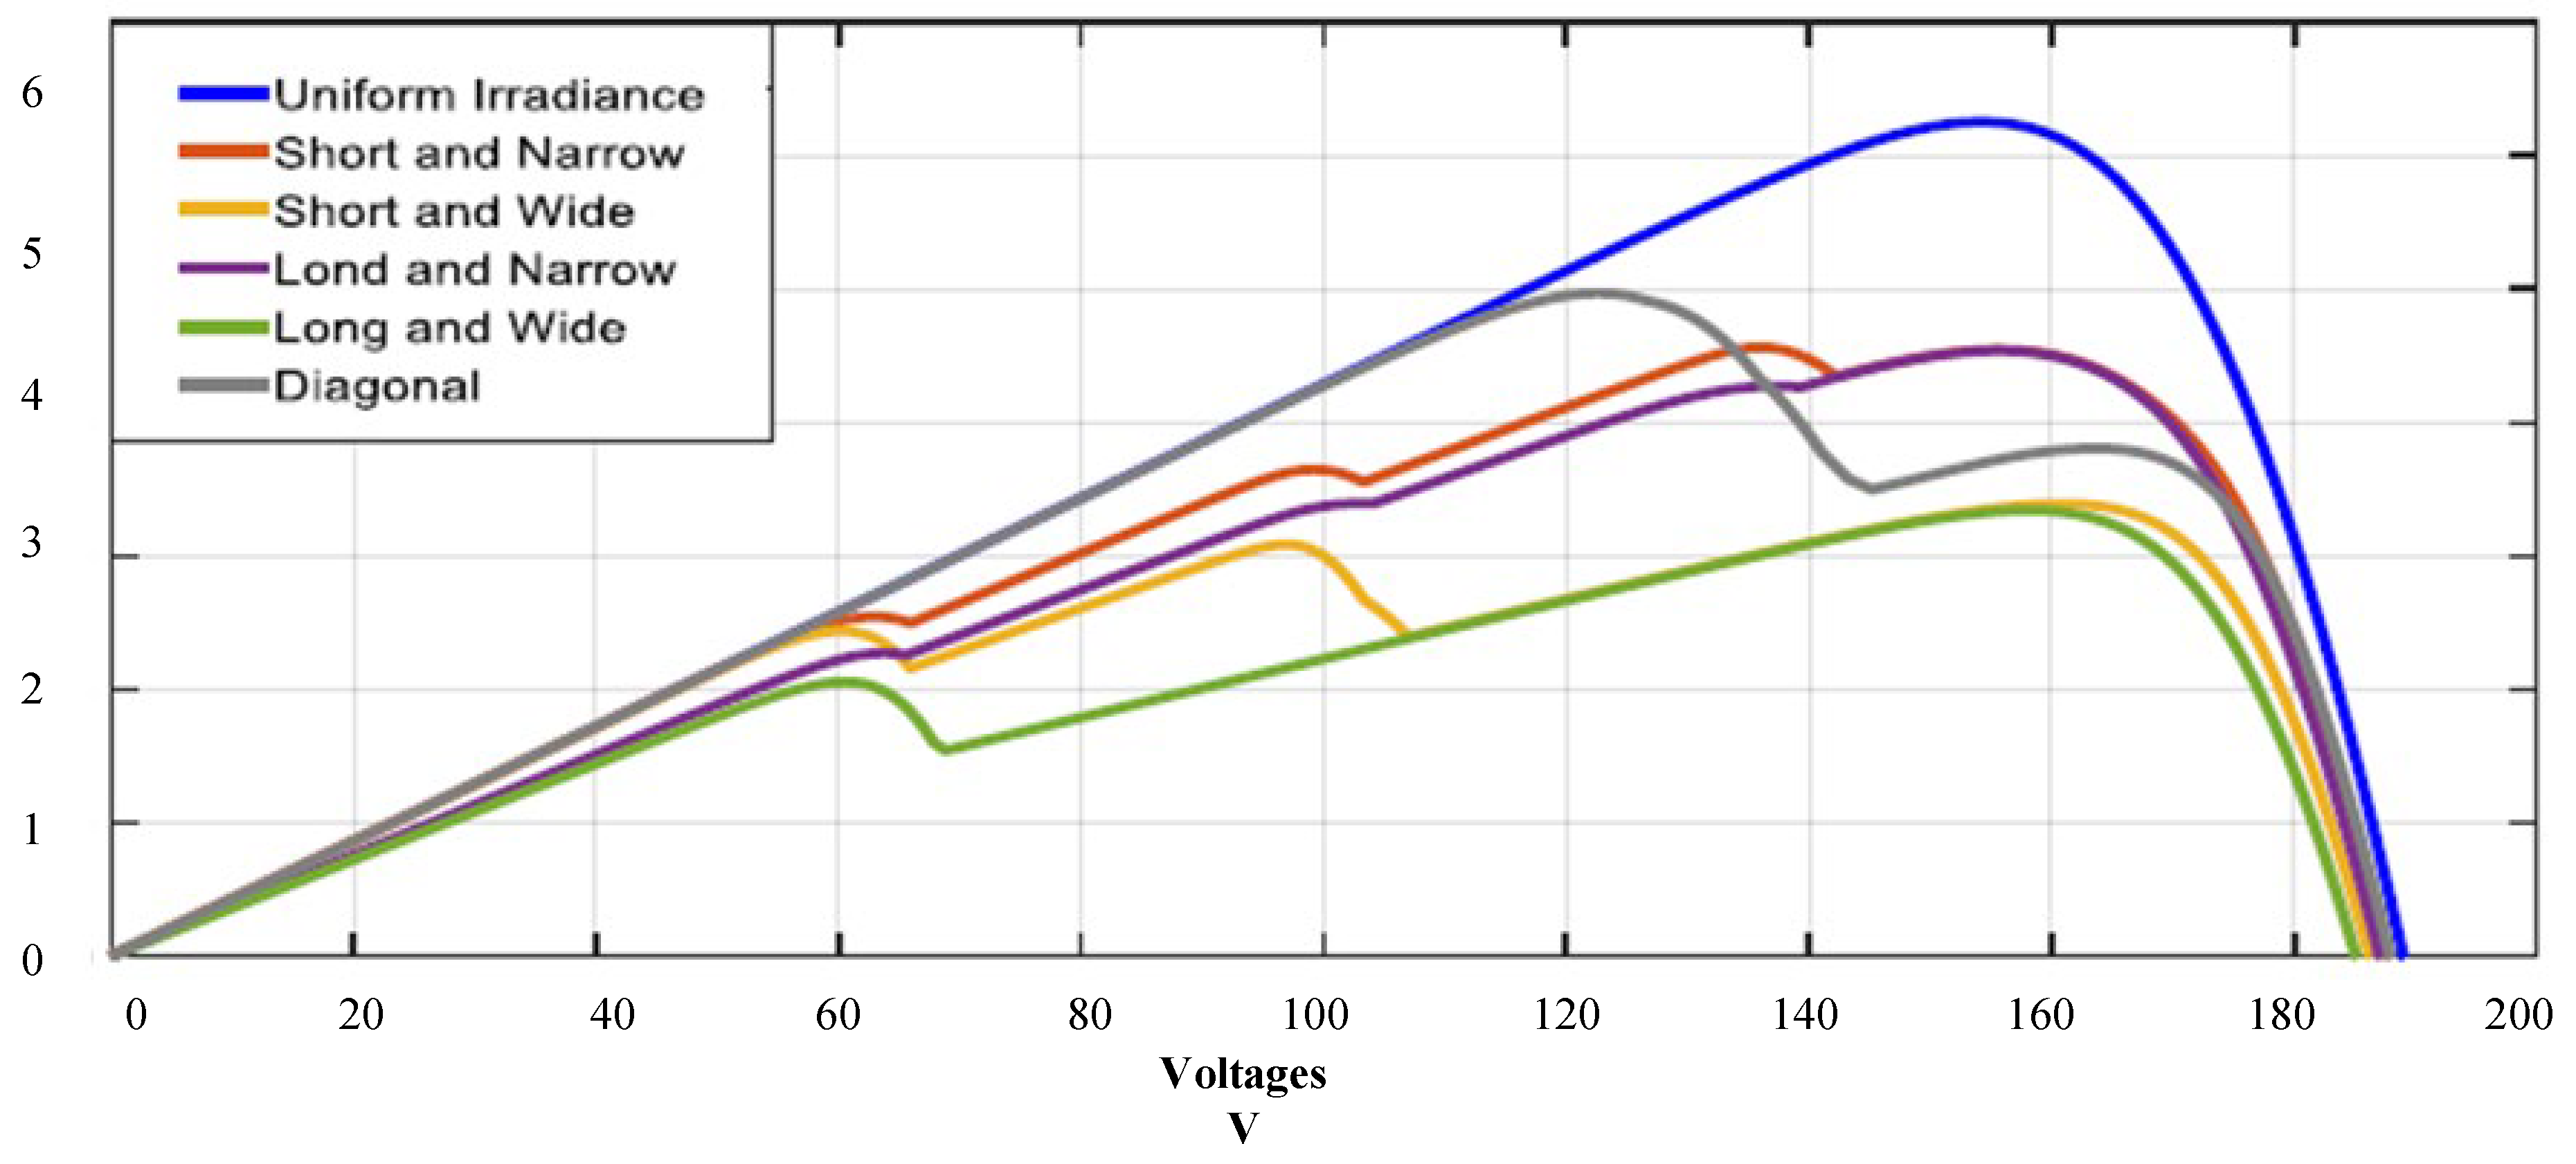
For the series photovoltaic array configuration, a thorough simulation analysis was carried out across a range of irradiance situations, such as partial shading and uniform irradiance. The short–wide, diagonal, long–wide, short–narrow, and long–narrow patterns were among the partial shading conditions that were meticulously modeled to resemble actual situations. The results of the P-V curves in
Figure 6 give an overview of the efficacy of the series photovoltaic array arrangement in various shading scenarios. According to the modeling results, with uniform irradiance, the series arrangement may produce a maximum power output of 6250.48 Watts. Yet, depending on the shading pattern, the peak power production fluctuates dramatically under partial shading situations. As illustrated in
Figure 6, the series configuration specifically produced a peak power of 5120.8 Watts under diagonal shading, 4742.8 Watts under short–narrow shading, 3708.55 Watts under long–narrow shading, 3295.81 Watts under short–wide shading, and 2627.16 Watts under long–wide shading. These findings show the impact of partial shading on the performance of photovoltaic arrays and emphasize the necessity of optimum layouts to lessen these impacts.
3.2. Series–Parallel PV Array Configuration
A thorough simulation analysis was carried out for the series–parallel photovoltaic array architecture under a range of irradiance scenarios, such as partial shading conditions (PSCs) and uniform irradiance. Carefully modeled to resemble real-world situations, the PSCs featured short–wide, diagonal, long–wide, short–narrow, and long–narrow patterns. In
Figure 7, the results of the P-V curves for each circumstance are plotted, giving an overview of the efficiency of the series–parallel setup under various shading scenarios. According to the simulation results, the series–parallel design may produce up to 6249.4 watts of electricity when exposed to uniform irradiance. However, depending on the shading pattern, the peak power production fluctuates dramatically under partial shading situations. With regard to the series–parallel configuration, as illustrated in
Figure 7, the maximum power generated under diagonal shading was 4996.95 Watts; under short–narrow shading, it was 4683.7 Watts; under long–narrow shading, it was 3973.12 Watts; under short–wide shading, it was 3325.56 Watts; and under long–wide shading, it was 3092.7 Watts. These findings show the effects of partial shading on photovoltaic array performance and emphasize the necessity of optimum layouts to lessen these impacts. The series–parallel design is a good option for real-world applications since it performs more consistently under various shading situations.
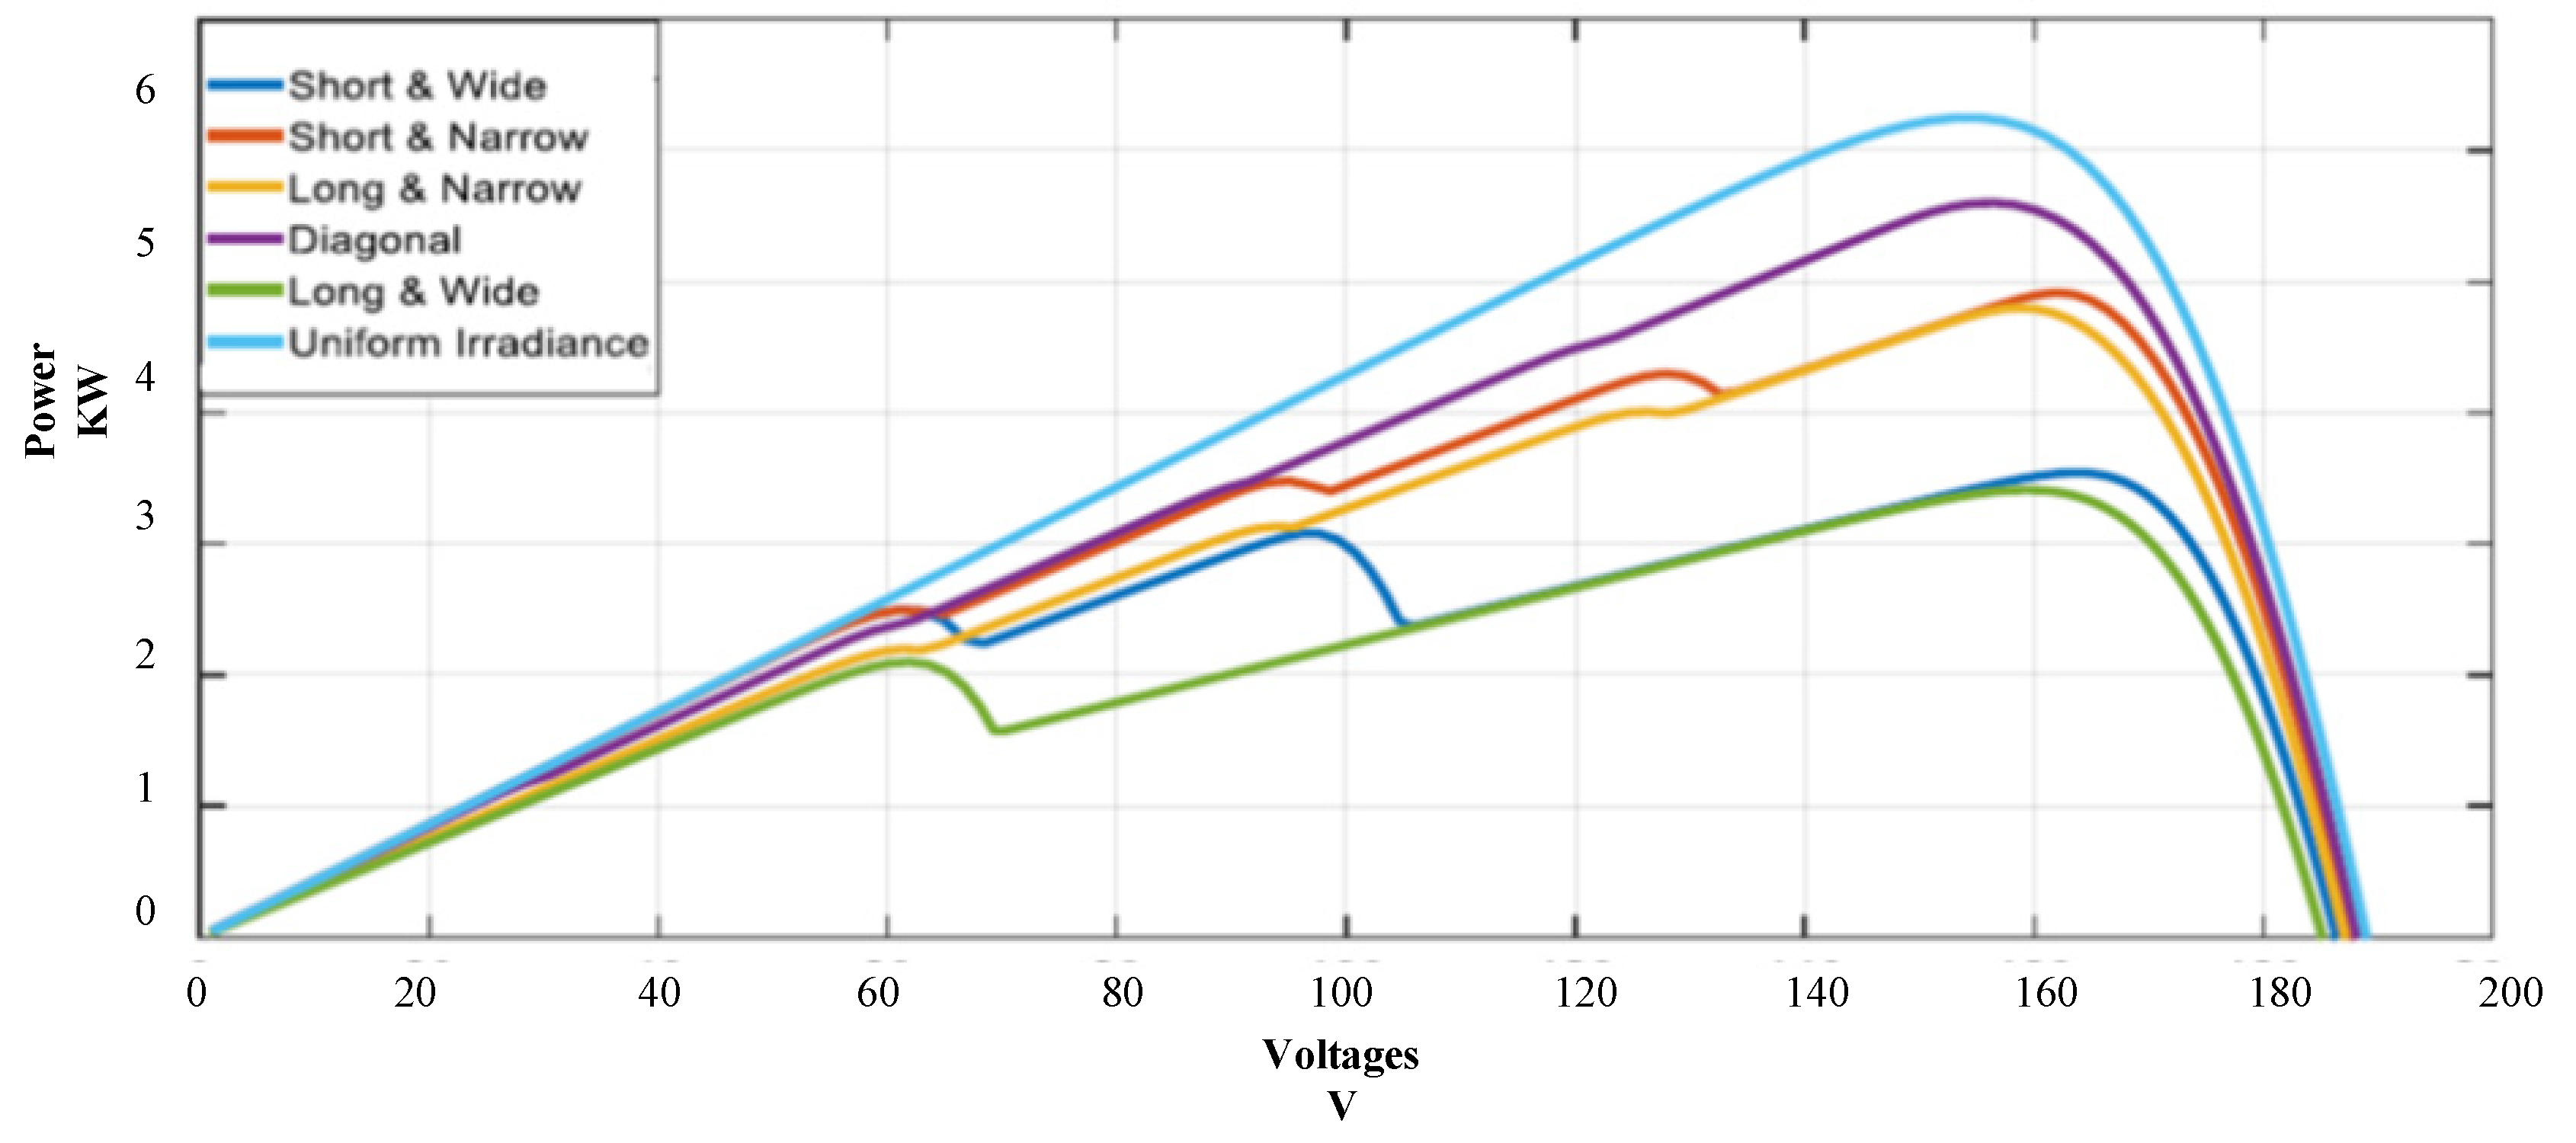
3.3. BL PV Array Configuration
A thorough simulation analysis under a range of irradiance conditions, such as uniform irradiance and partial shading conditions (PSCs), was carried out for the bridge-linked (BL) solar array structure. The PSCs included short–wide, diagonal, long–wide, short–narrow, and long–narrow patterns, which were carefully simulated to mimic real-world scenarios.
Figure 8 plots the results of all the P-V curves for each circumstance, giving an overview of the productivity of the BL setup under various shading scenarios. According to the modeling results, the BL design may produce up to 6248.9 watts of electricity when exposed to uniform irradiance. However, depending on the shading pattern, the peak power production fluctuates dramatically under partial shading situations. To be more precise,
Figure 8 illustrates that the BL configuration produces a maximum power of 4855.9 Watts under diagonal shading, 4825.22 Watts under short–narrow shading, 4637.28 Watts under long–narrow shading, 3462.38 Watts under long–wide shading, and 3336.91 Watts under short–wide shading. These findings show the impact of partial shading on the photovoltaic array performance and emphasize the necessity of optimum layouts to lessen these impacts. Because of its distinct performance under various shading conditions, the BL arrangement is appropriate for some applications, whereas partial shading is common.
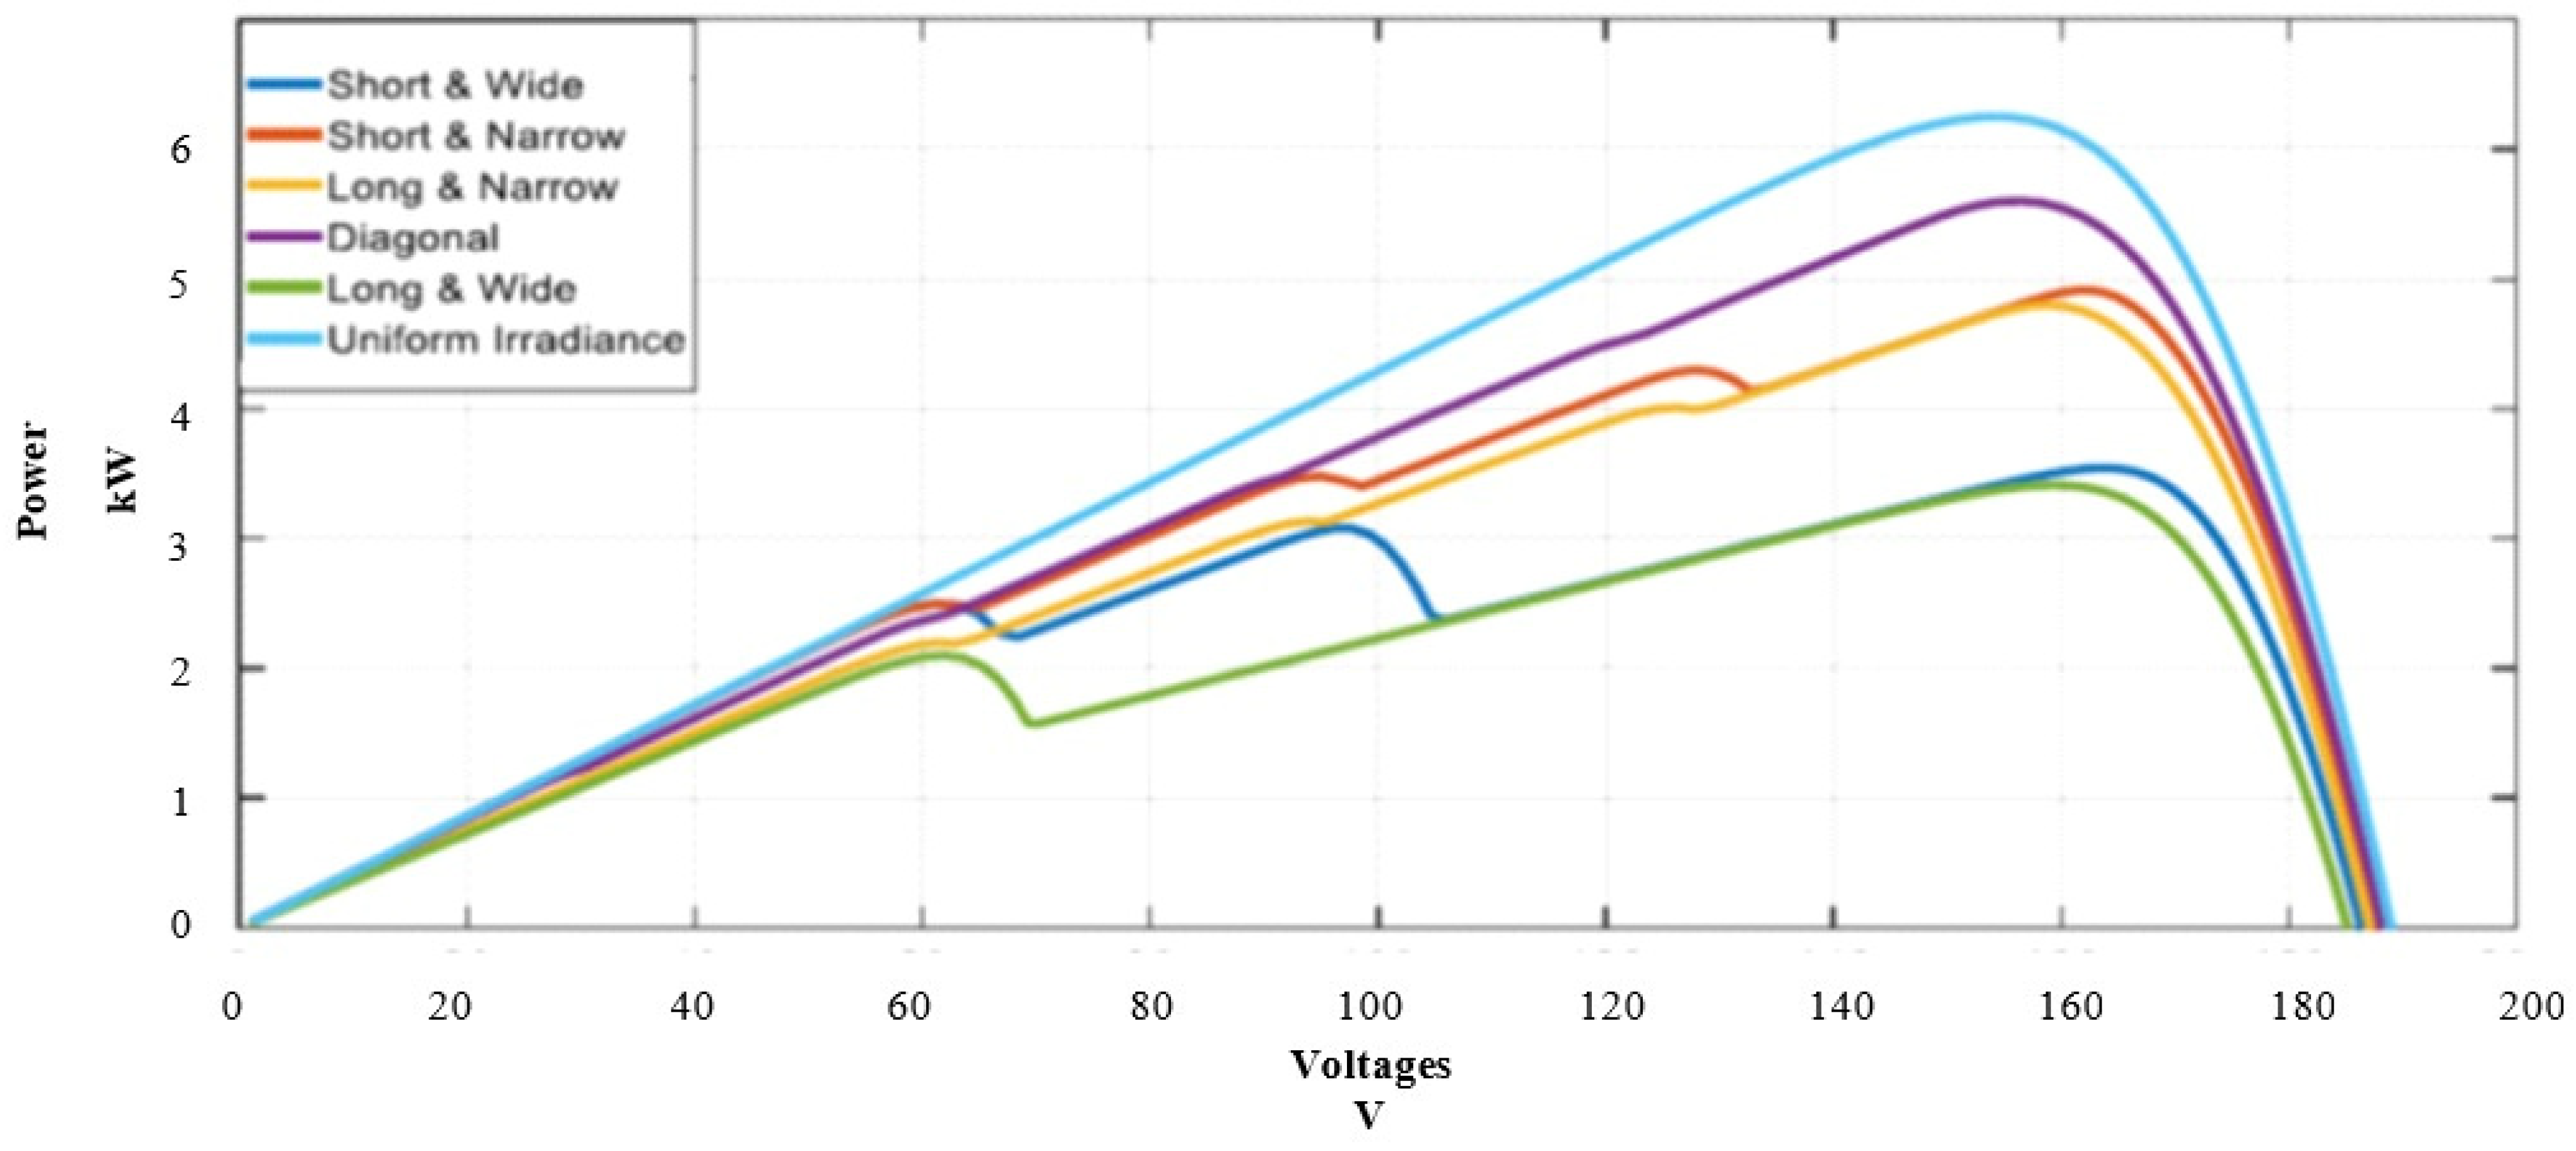
3.4. Modified BL PV Array Configuration
For the improved bridge-linked (BL) solar array configuration, a thorough simulation analysis was carried out across a range of irradiance situations, including partial shading conditions (PSCs) and uniform irradiance. The PSCs included short–wide, diagonal, long–wide, short–narrow, and long–narrow patterns, which were carefully simulated to mimic real-world scenarios. The results of these P-V curves for each condition are plotted in
Figure 9, providing a visual representation of the performance of the Modified BL configuration under different shading conditions.
Figure 9 plots the resulting P-V curves for each circumstance, giving an overview of the capability of the improved BL setup in various shading scenarios. According to the modeling results, the improved BL design may produce up to 6248.9 Watts of electricity when exposed to uniform irradiance. However, depending on the shading pattern, the peak power production fluctuates dramatically under partial shading situations. In particular,
Figure 4,
Figure 5,
Figure 6,
Figure 7 and
Figure 8 illustrate that the Modified BL configuration produces a maximum power of 5596.82 Watts under diagonal shading, which is followed by 4914.31 Watts under short–narrow shading, 4790.31 Watts under long–narrow shading, 3538.12 Watts under short–wide shading, and 3408.35 Watts under long–wide shading. These findings show the impact of partial shading on photovoltaic array performance and emphasize the necessity of optimum layouts to lessen these impacts.
Figure 9 provides a full overview of the performance of the Modified BL configuration under various shading conditions by noting and comparing the maximum power output in each shading condition. According to the results, the updated BL configuration performs better in specific shading scenarios, which makes it a viable option for real-world uses.
3.5. Comparison of PV Array Configurations
It can be observed from the P-V characteristics illustrated in
Figure 6 to 9 under uniform and PSCs that the maximum powers were achieved under the modified bridge-linked (BL) configuration. Referring to the tabulated data in
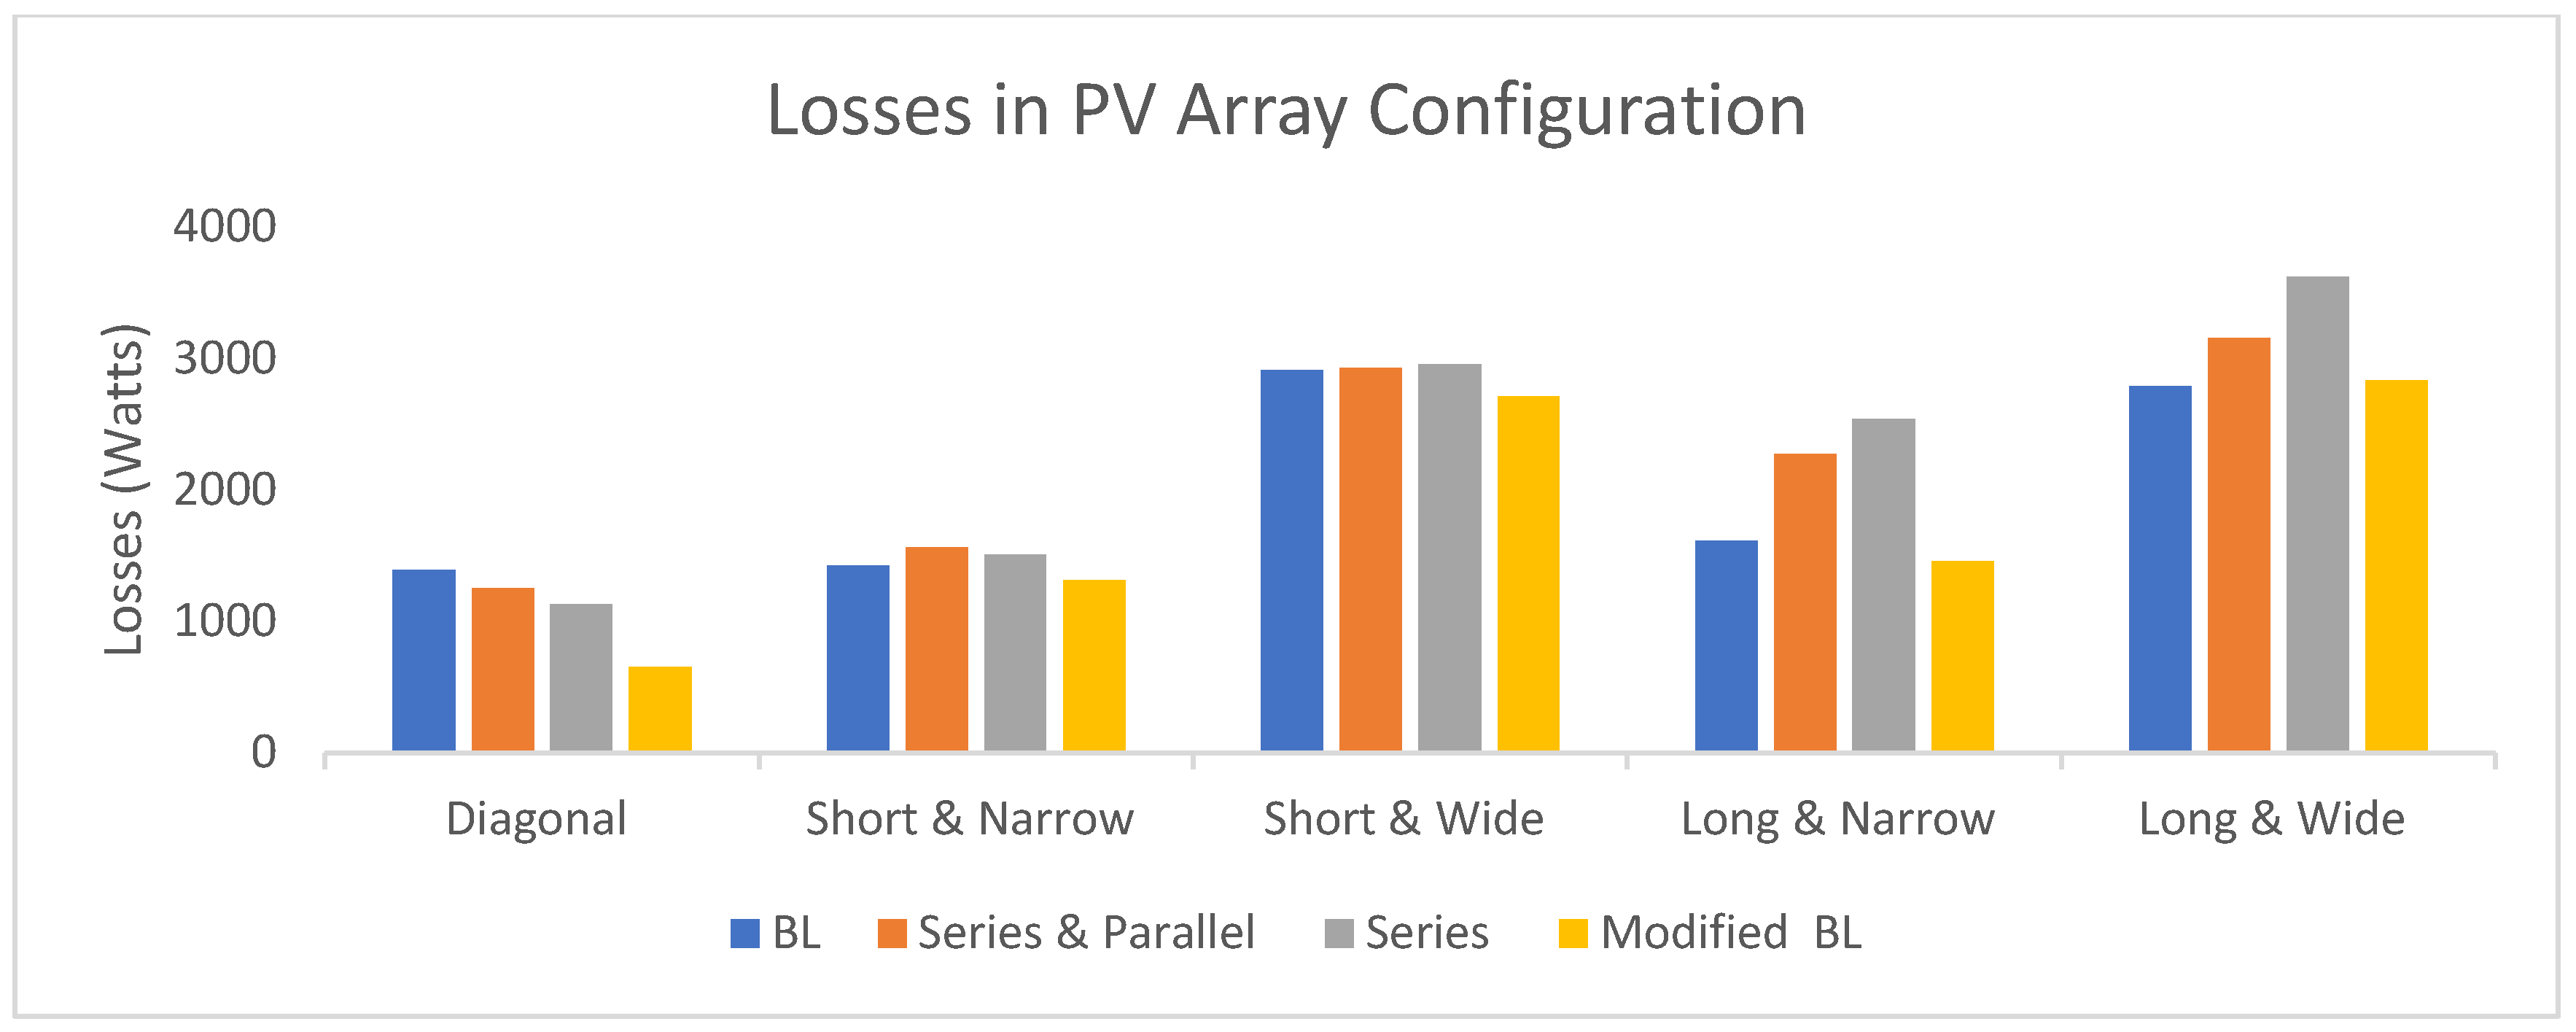
Table 2, it is evident that the modified bridge-linked (BL) configuration exhibited superior performance, yielding the lowest losses under various shading conditions, including short–wide, diagonal, long–wide, short–narrow, and long–narrow. Thus, the Modified BL arrangement is the best option due to its adaptability and versatility to different shading circumstances. A complete evaluation highlights the importance of exactly examining different array configurations under diverse shading conditions to determine the optimal setup.
3.6. Implementation of P&O Algorithm for Modified BL
The most popular MPPT technique for tracking the maximum power in a photovoltaic (PV) system is the perturb and observe (P&O) algorithm because of its simplicity and versatility. The Modified BL layout has been found to be the most efficient among other PV array arrangements. By applying the P&O algorithm to the Modified BL configuration, it can be observed that from 6 to 8 s, the irradiance was uniform at 1000 Watts per square meter. Consequently, the power output remained steady at approximately 6250 Watts.
However, between 8 and 10 s, there was a gradual decrease and subsequent increase in the irradiance. This variation caused the power output to decline and then rise accordingly, demonstrating the ability of algorithm to adapt to changing conditions. At the 12th second, a sudden drop in irradiance from 1000 Watts per square meter to 500 Watts per square meter resulted in a sharp decrease in power output from 6250 Watts to 3125 Watts. The P&O algorithm effectively tracked this abrupt change, ensuring that the system operated at its maximum potential under varying irradiance conditions. This dynamic response is illustrated in
Figure 10.
Numerous simulations were conducted to ensure the robustness and reliability of these results. These simulations comprehensively tested various scenarios to validate the performance under different conditions. A detailed comparison, presented in tabular form, provides a clear and concise overview of the efficiency metrics for each configuration. This tabular format allows for easy visualization and comparison, highlighting key performance indicators, such as power output, efficiency, and response times across different irradiance levels and partial shading scenarios.
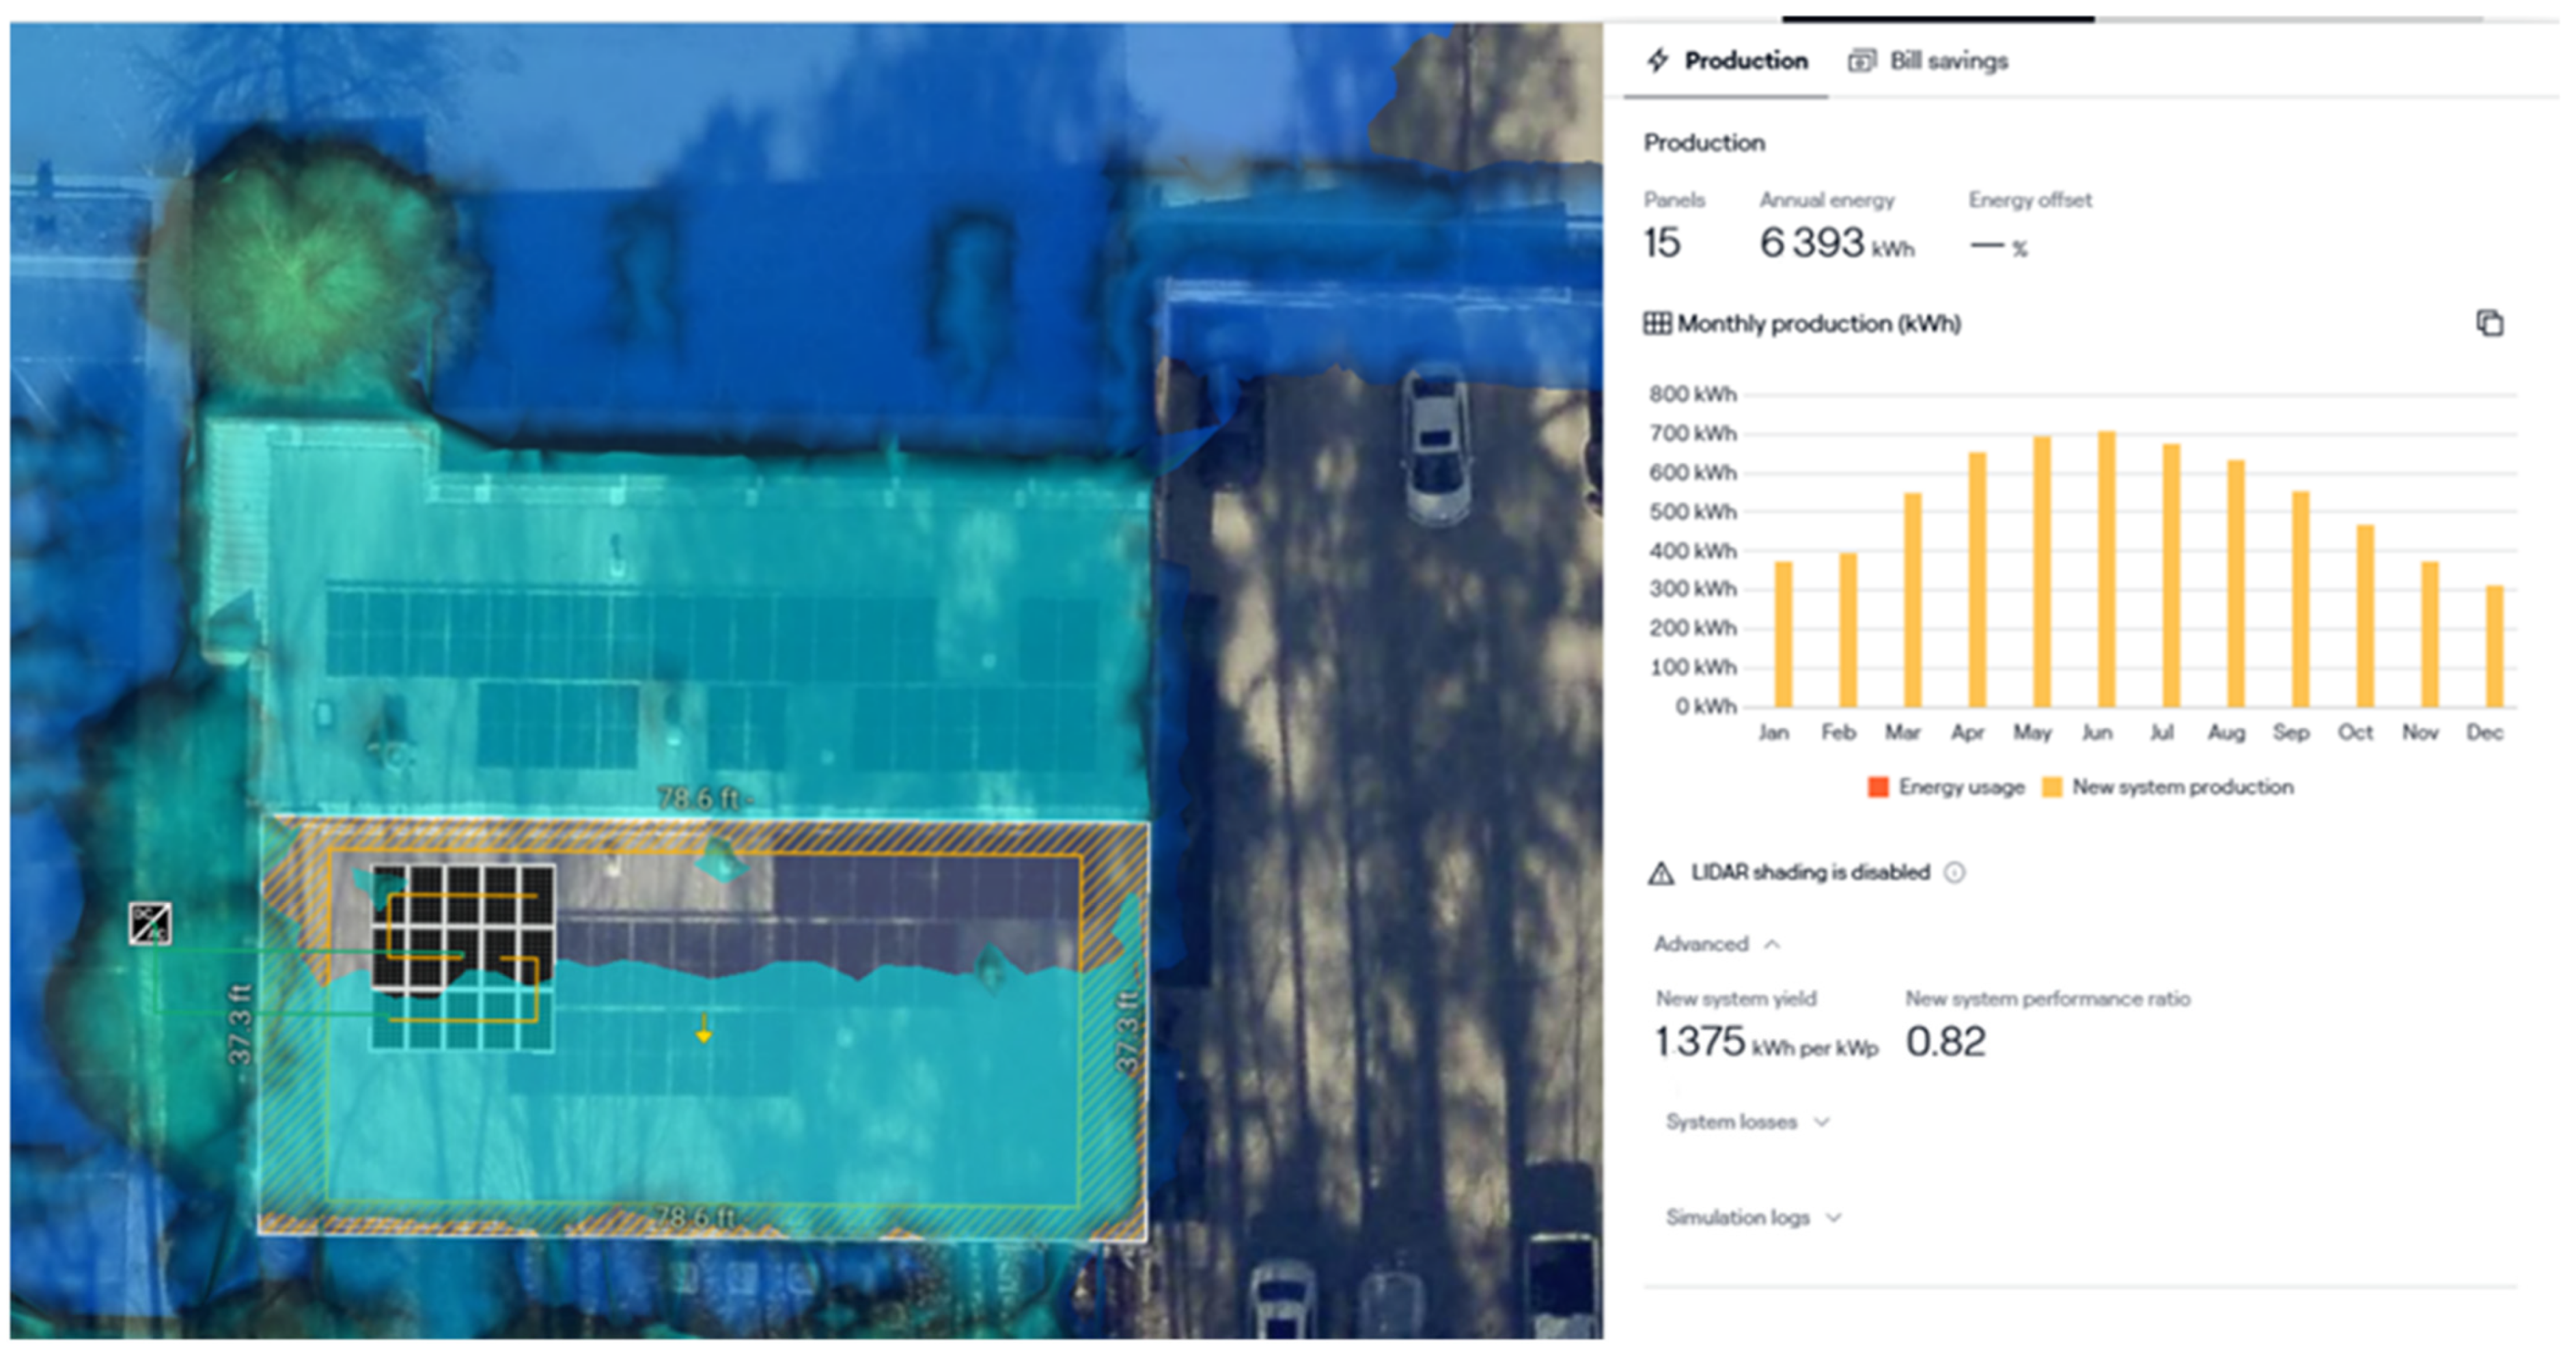
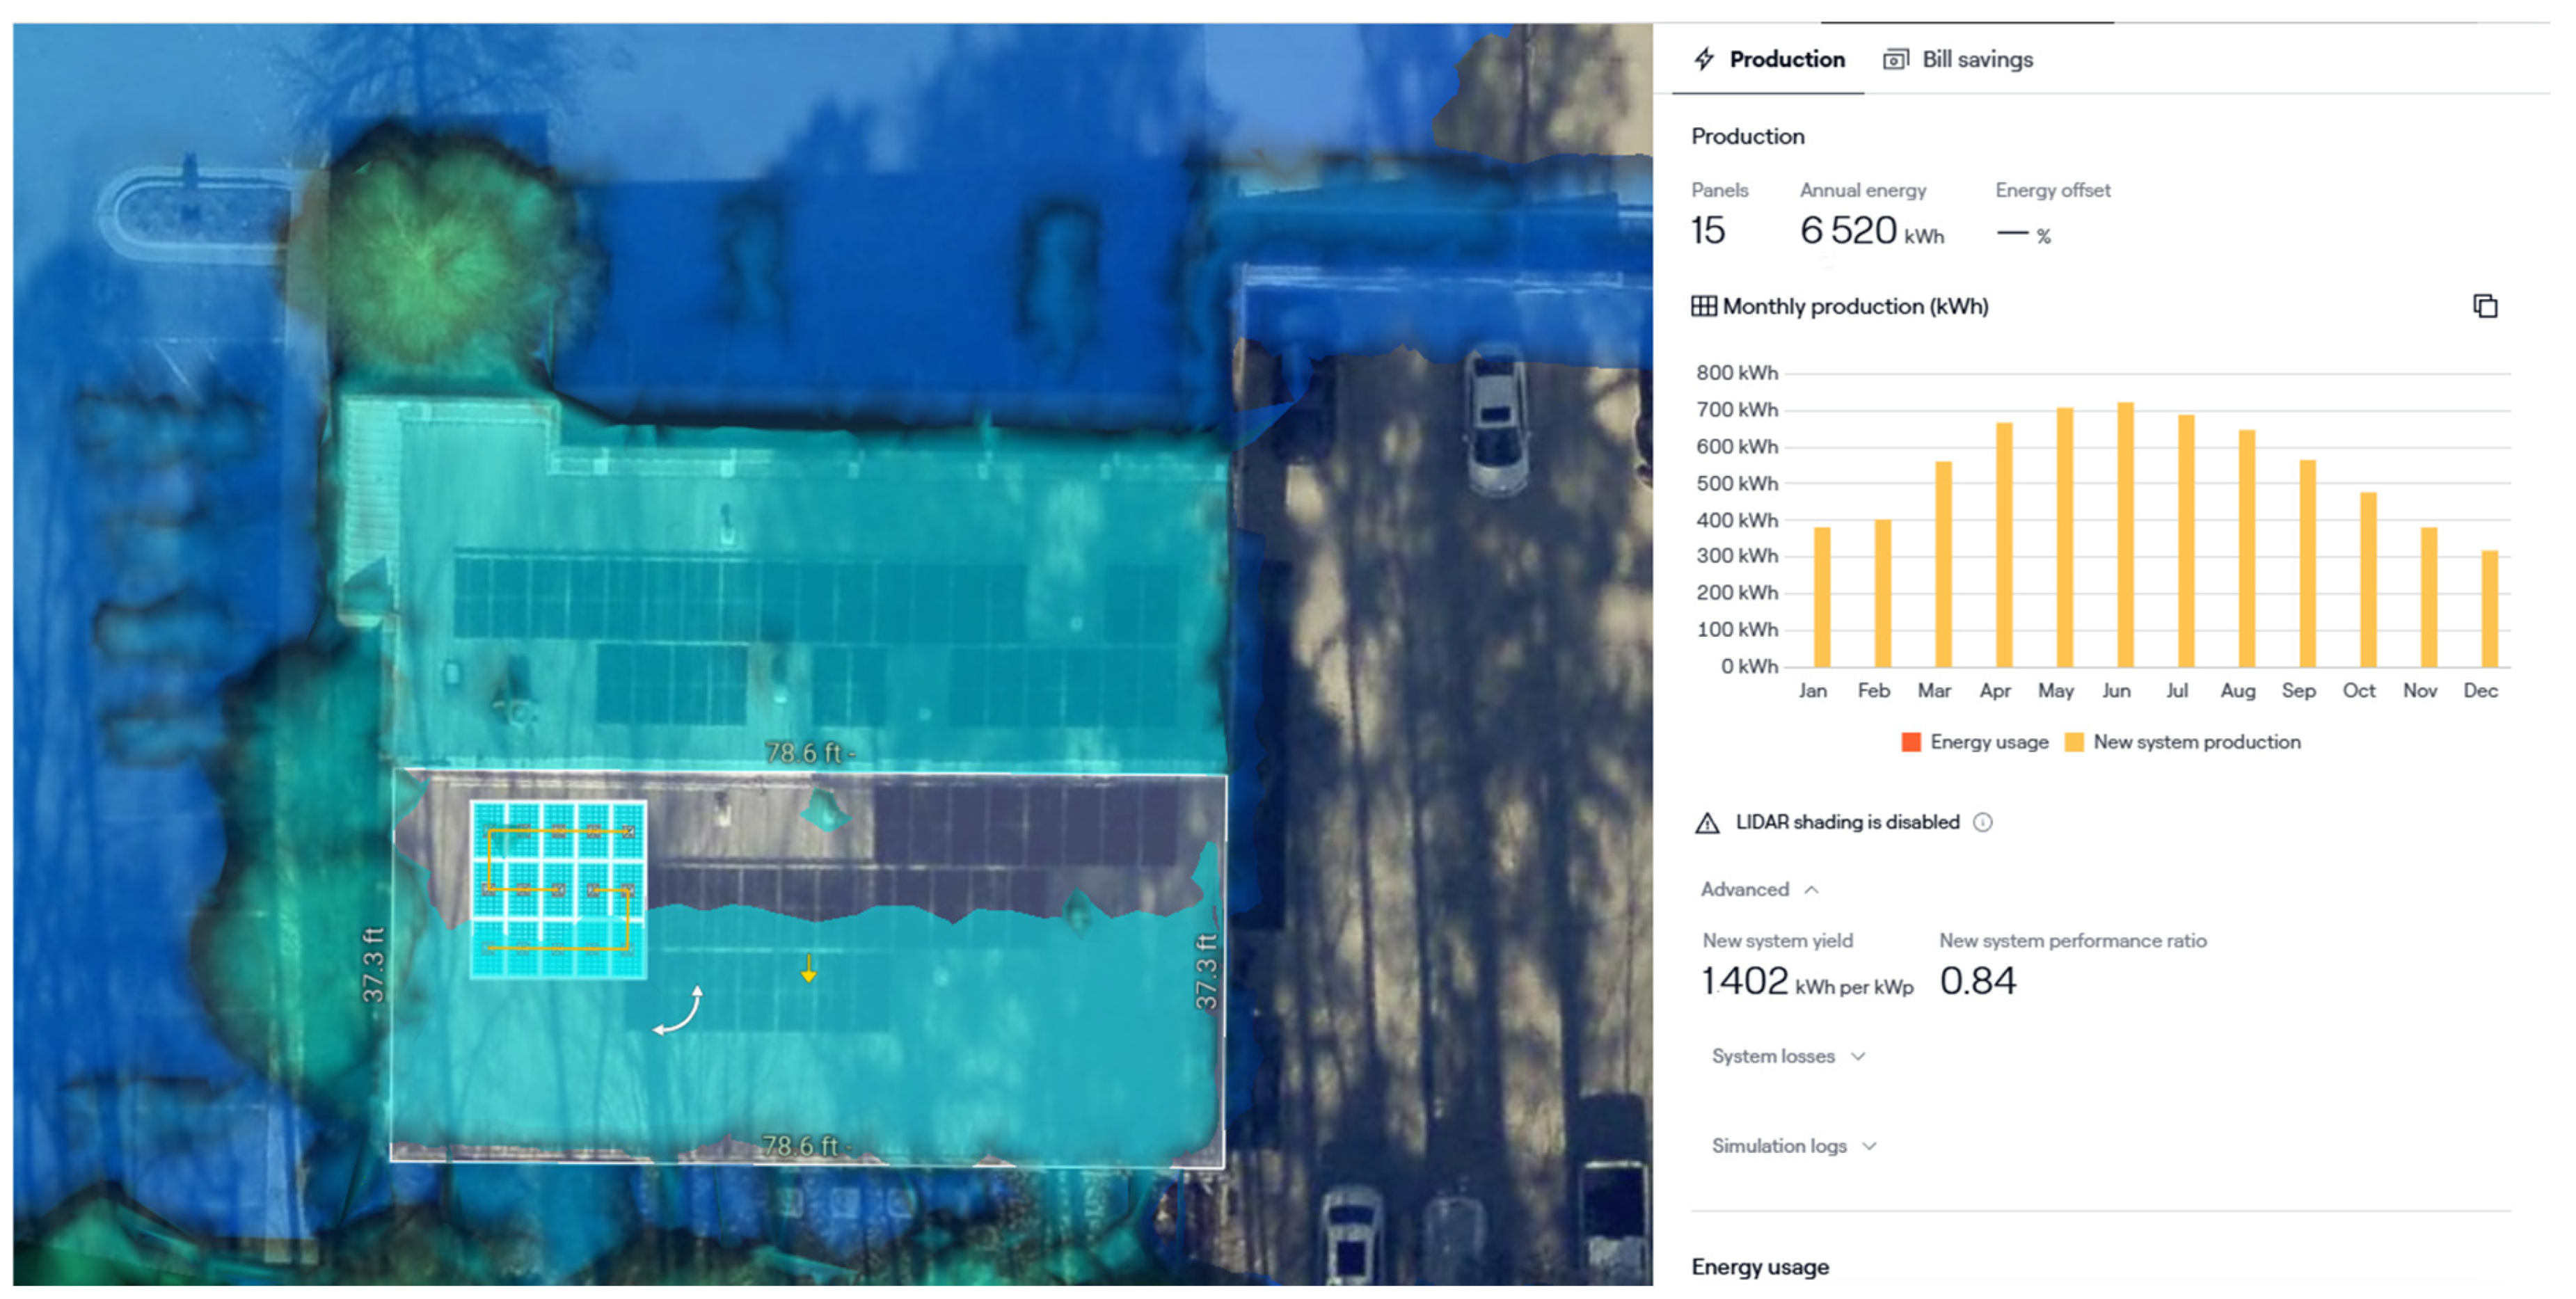
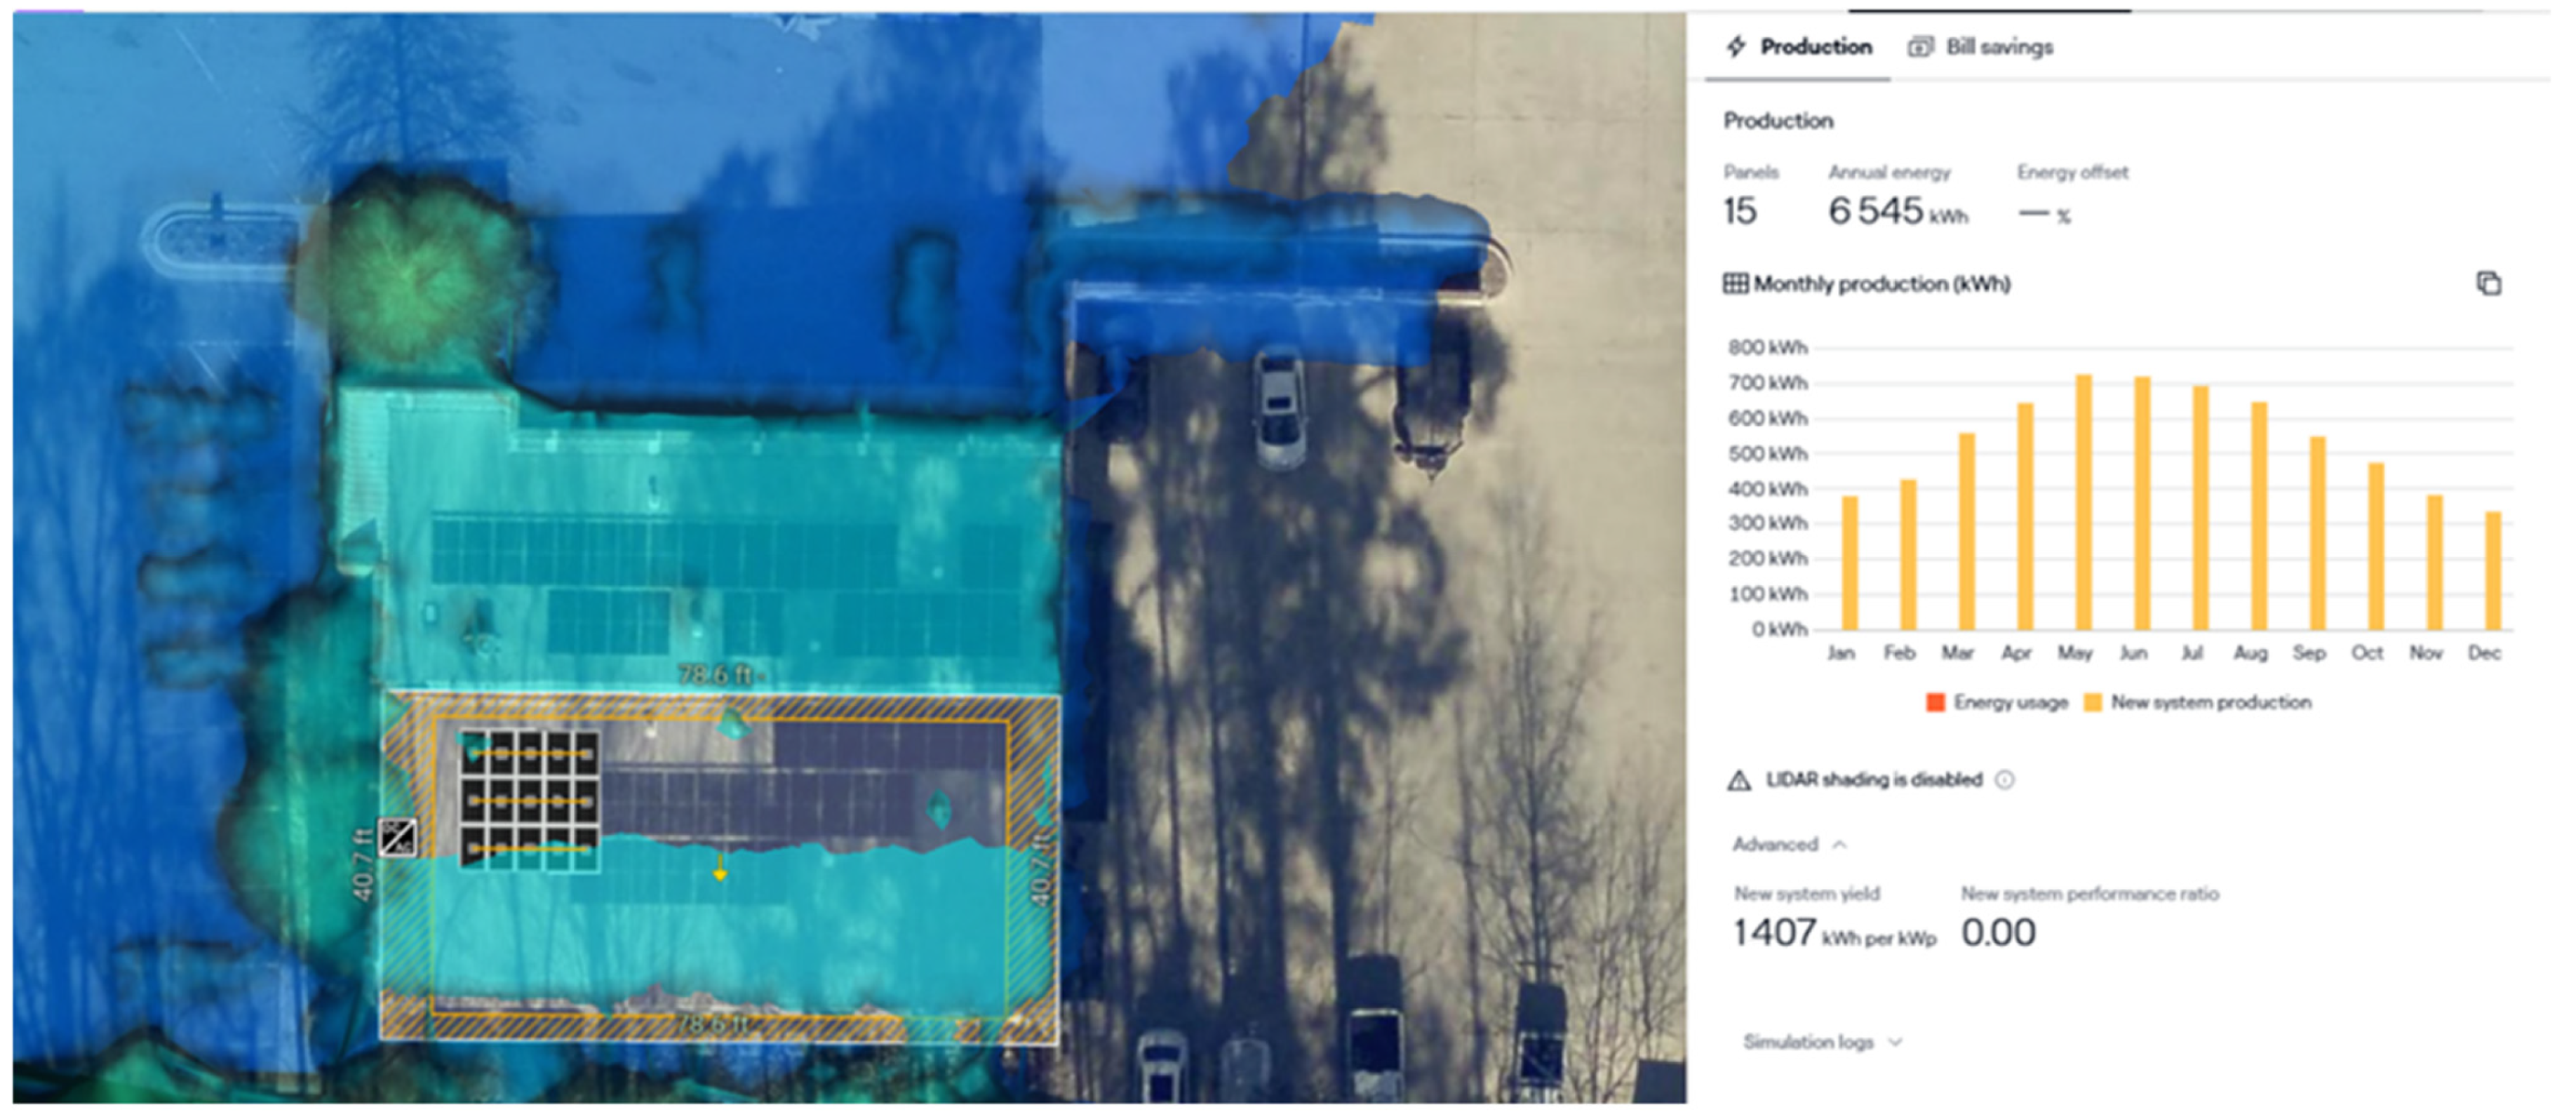
3.7. Aurora Solar Simulations
An experiment was also carried out using Aurora Solar simulations to validate the results for real-world applications. This study provides a comparison between an MPPT tracker, micro-inverters, and an MPPT tracker with panels connected using the Modified BL configuration.
Figure 11,
Figure 12 and
Figure 13 depict the simulation setups, keeping the same number and model of the panels. A comparison of an MPPT controller, micro-inverter, and MPPT controller with the Modified BL configuration has been tabulated in
Table 3. From the comparison, it can be observed that the MPPT controller with the Modified BL configuration has better production and efficiency in comparison to the other techniques.
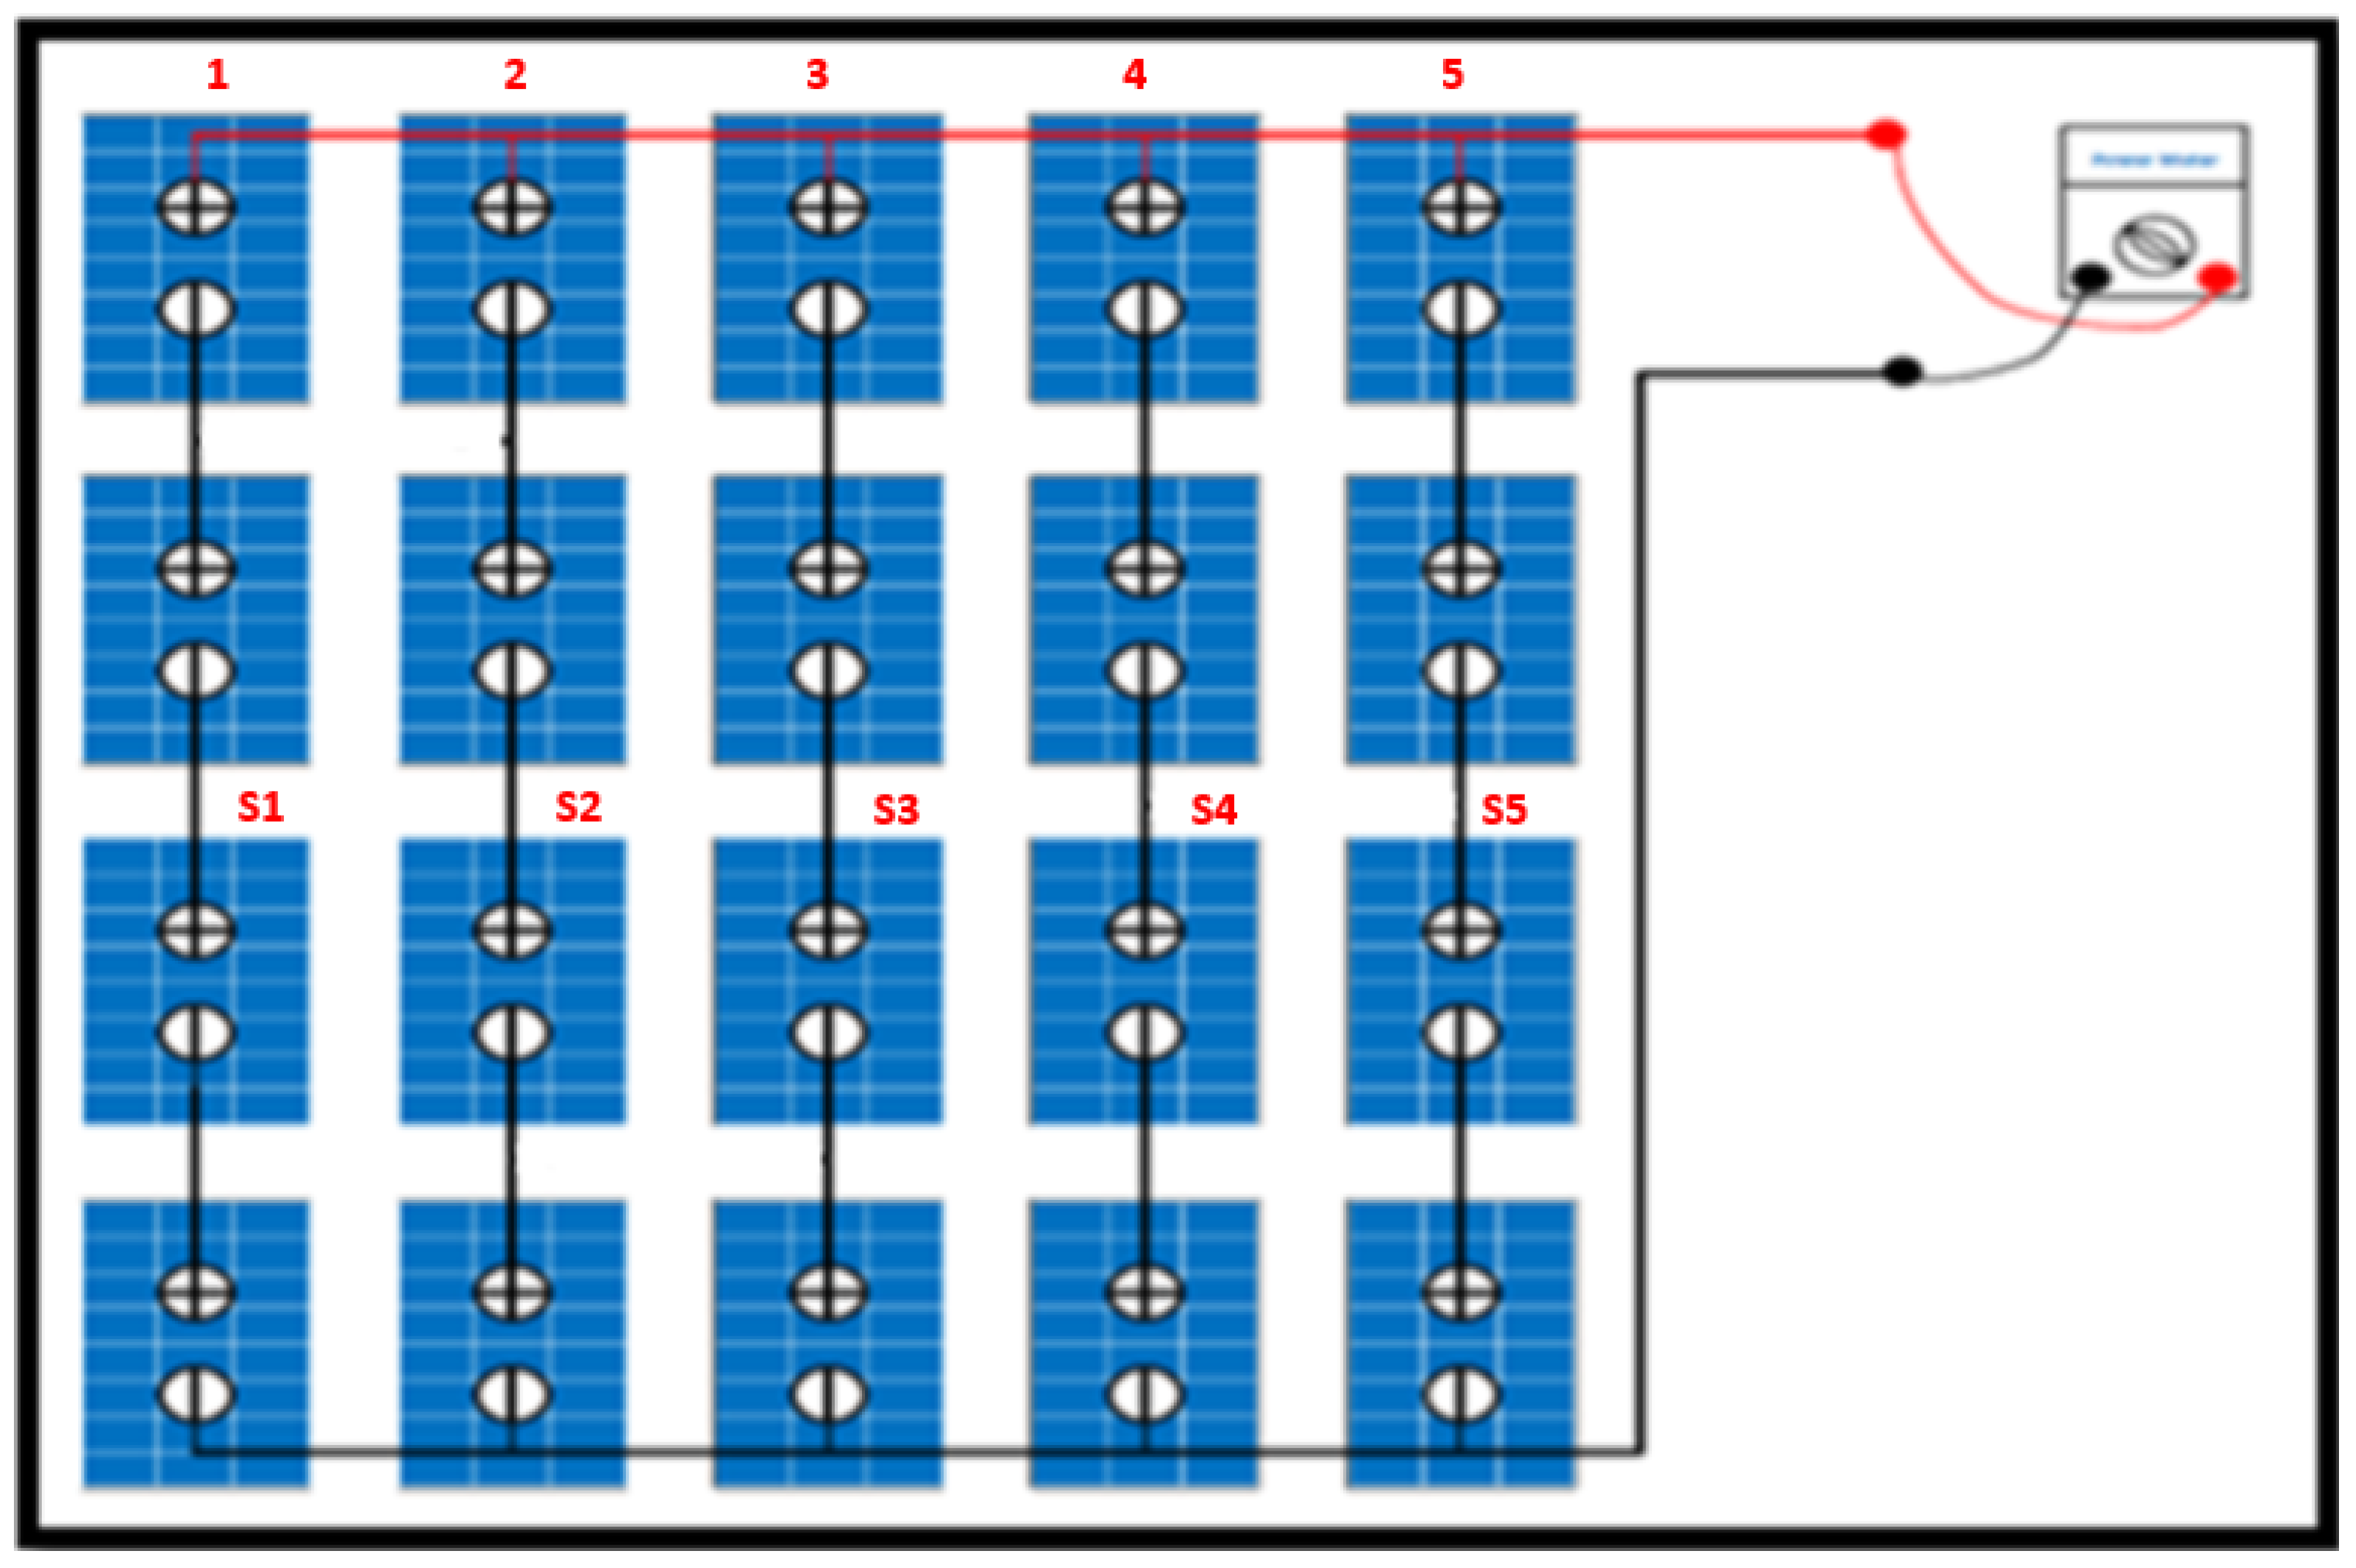
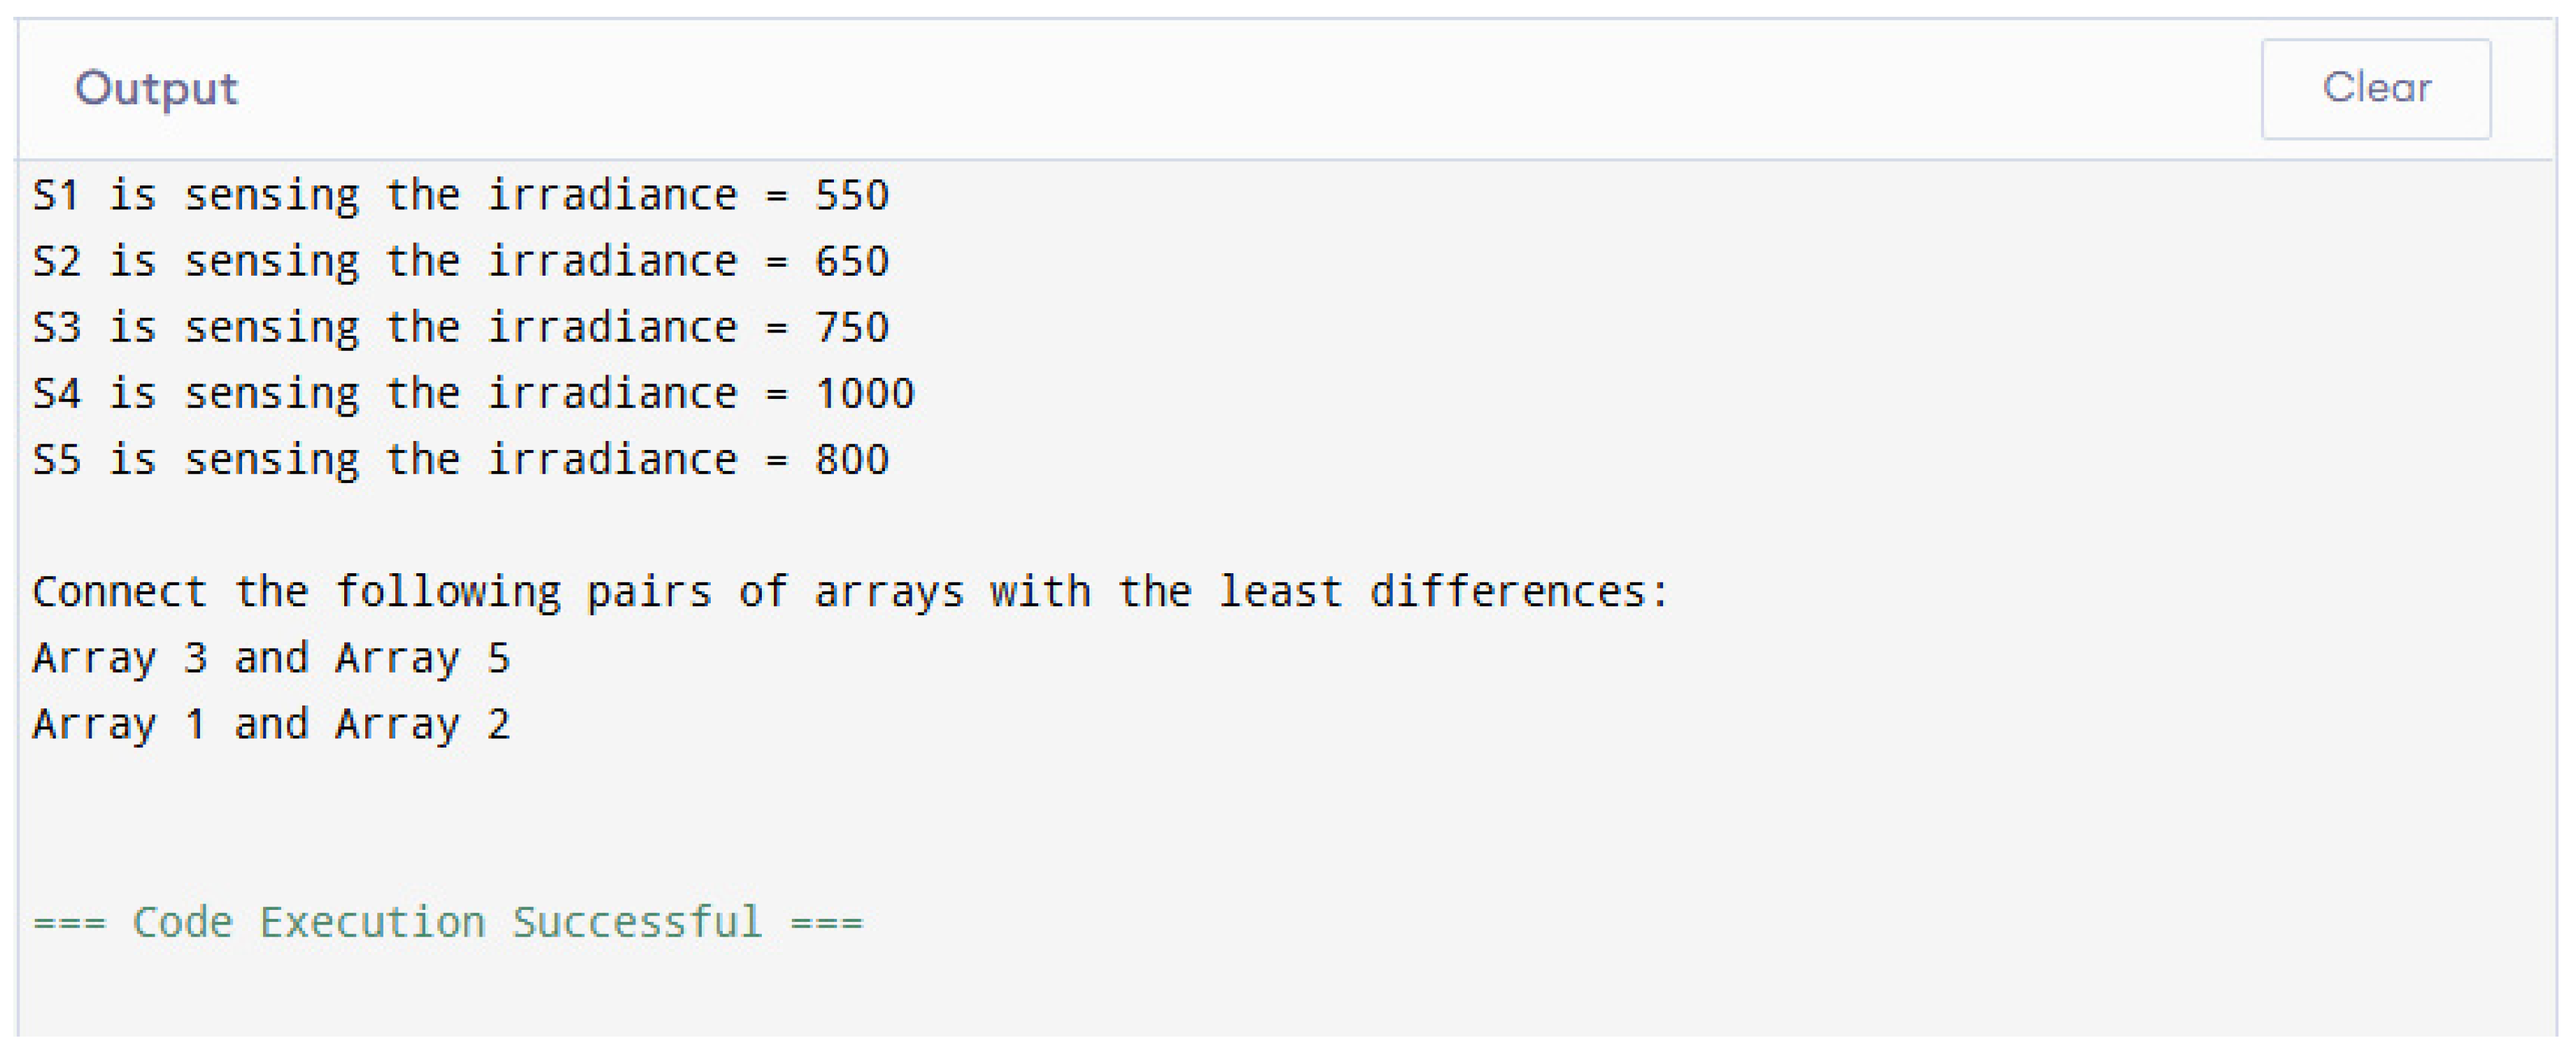
3.8. Microprocessor Control
A microprocessor was employed to compare the irradiance levels across five photovoltaic (PV) arrays (1–5), as illustrated in
Figure 14. The sensors were mounted on each PV array and named S1, S2, S3, S4, and S5 to measure the irradiance level on each PV array. The irradiance levels of each array were measured using PV-mounted sensors (S1–S5), as shown in
Figure 15. The code output revealed the interconnection pattern that minimized the irradiance differences among the arrays. However, the current study had limitations due to the control capabilities of the microprocessor. It could only compare irradiance levels and lacked the functionality to physically switch outputs and establish interconnections. This research is ongoing, aiming to address this limitation by training a machine learning tool. The intelligent network will compare the irradiance levels at the module level and dynamically configure the array with optimized and consistent irradiance across its components.
4. Discussion
The proposed Modified BL configuration serves as an alternative to traditional module interconnection schemes and is fully compatible with MPPT trackers. MPPT algorithms, such as perturb and observe, incremental conductance, and particle swarm optimization, operate by locating the true global maximum power point (GMPP) on the PV curve to achieve maximum power output. In conventional setups, bypass diodes create multiple peaks or fragments in the PV curve, complicating the identification of the GMPP. However, the Modified BL configuration minimizes the influence of bypass diodes, resulting in a smoother and less fragmented PV curve. This improved curve simplifies the MPPT process, allowing the algorithm to identify the GMPP more effectively. Additionally, the Modified BL configuration reduces overall system voltage mismatches and minimizes the risk of false tracking, enhancing the efficiency and reliability of MPPT performance.
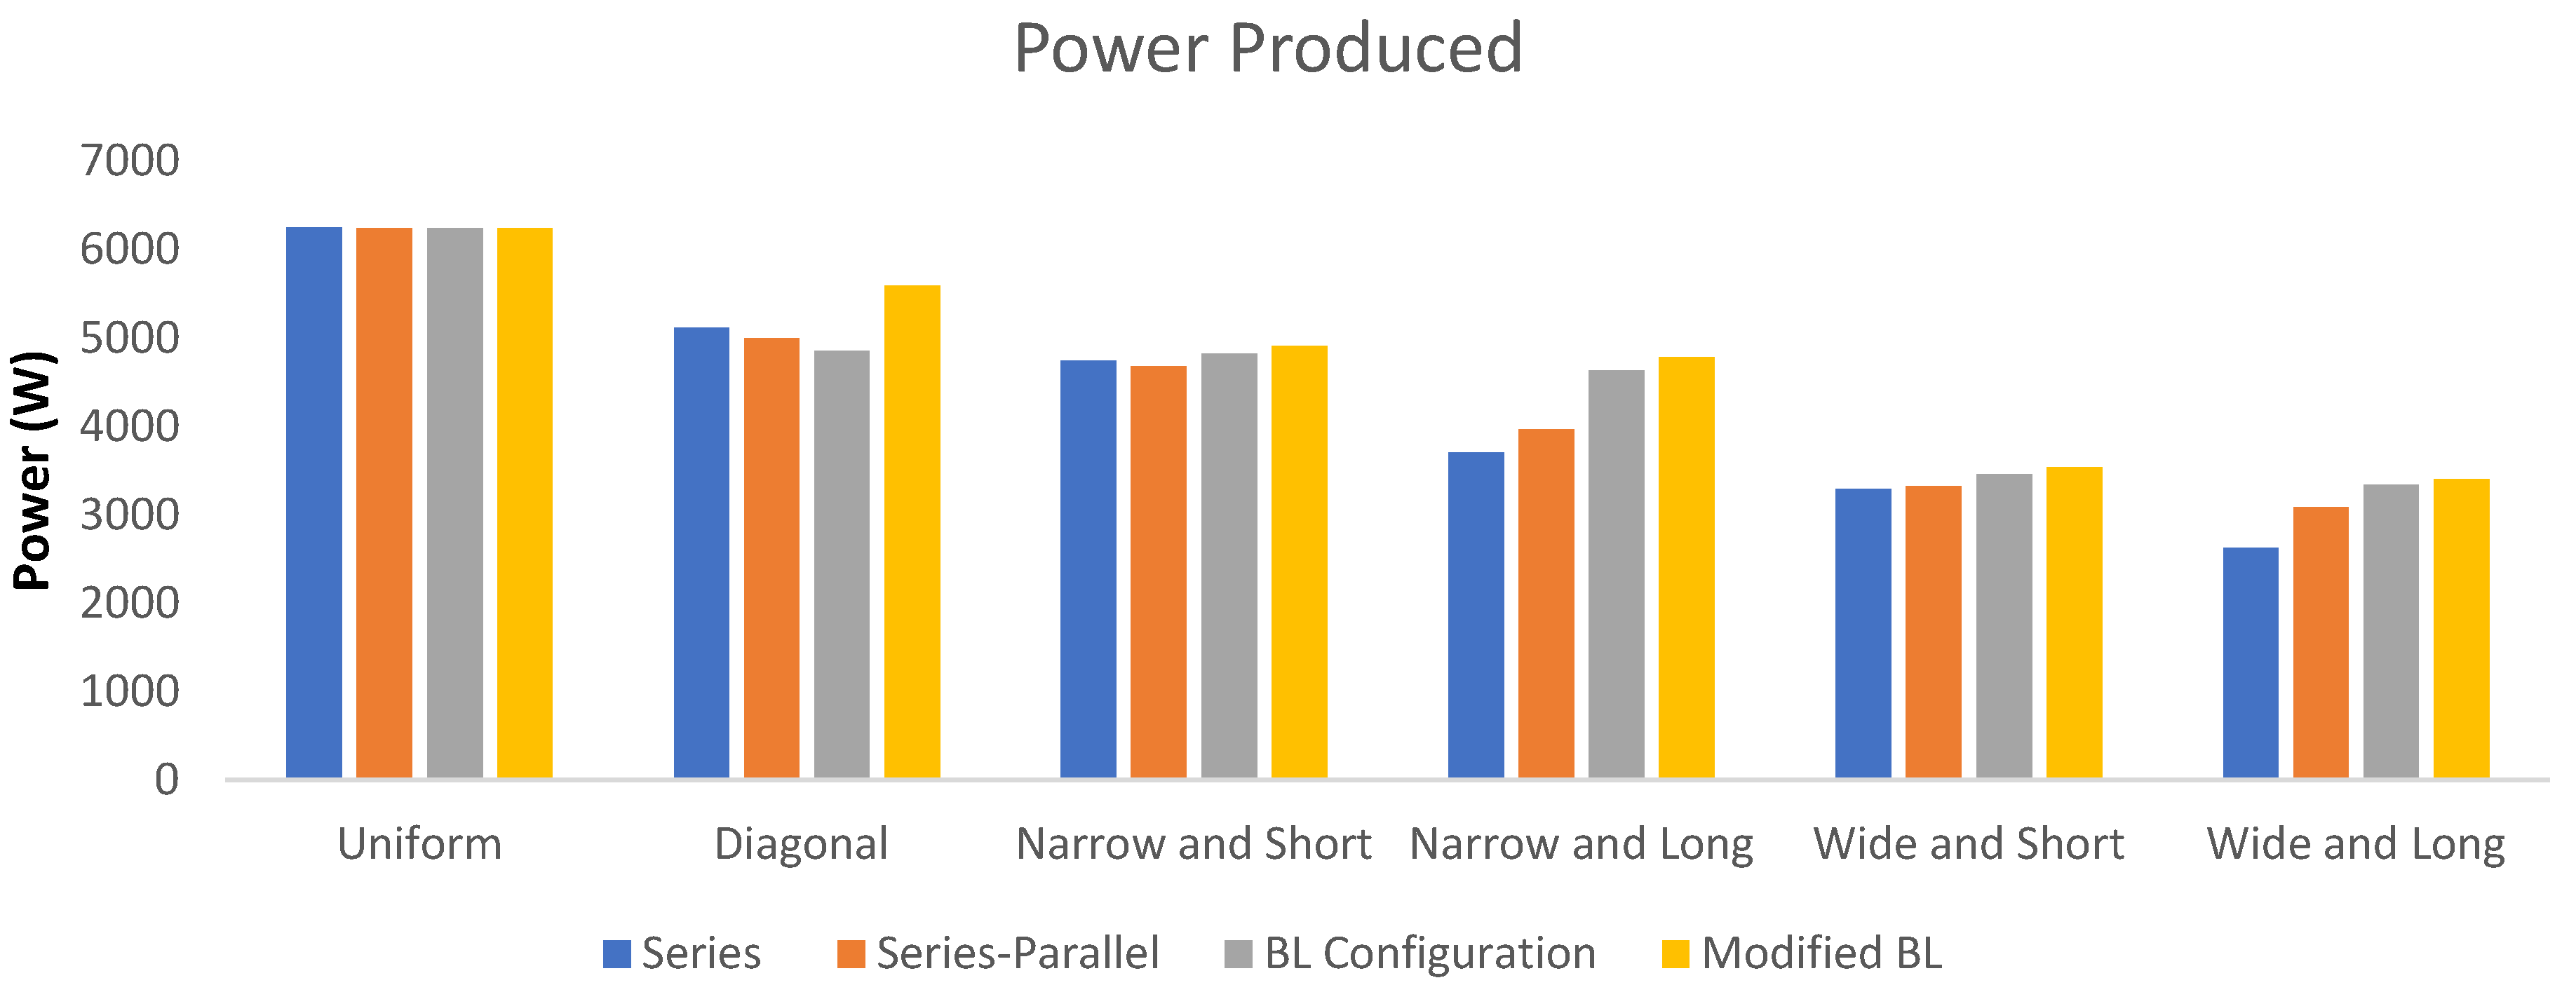
Figure 16 and
Figure 17 represent the efficiency gain in terms of power production and the minimal losses in the system.
The modified bridge-linked (BL) configuration introduces significant challenges when implemented in large photovoltaic (PV) arrays, primarily due to its sensitivity to site-specific factors like shading. Unlike standard configurations, this setup requires tailored string designs to account for unique shading profiles at each installation site, complicating installation and disrupting the uniformity, typically preferred in PV systems. Installation crews face increased complexity and a higher likelihood of errors when managing non-standardized layouts, often leading to extended project timelines. Effective implementation demands robust communication between design and installation teams, supported by detailed documentation to ensure seamless execution.
The comprehensive shading analysis using advanced simulation tools is essential before finalizing string configurations, as accurate irradiance modeling throughout the year is critical to optimize performance and minimize mismatch losses. This level of customization necessitates specialized expertise in PV system design, making it less accessible for teams. Post-installation monitoring becomes more complex due to the lack of uniform string patterns, with traditional systems often struggling to provide accurate diagnostics or pinpoint performance issues. The absence of bypass diodes further exacerbates troubleshooting difficulties, as localized shading or faults can propagate across the string, requiring more advanced diagnostic tools to identify and address issues effectively.
The use of micro-inverters is only facilitated by the bypass diodes, and it is more efficient in shady areas compared to MPPT trackers. But the proposed configuration is supported by MPPT, bypass diodes, and the interconnection scheme itself. Some of the results of the simulations using Aurora Solar, which is known for accurate production numbers aligning with real-world scenarios, clearly show that the system will perform best with MPPT and the Modified BL configuration.
5. Conclusions
In this study, a modified bridge-linked (Modified BL) configuration has been proposed to mitigate the adverse effects of partial shading conditions (PSCs) on photovoltaic (PV) arrays. In this configuration, the multiple solar modules are connected in such a way that minimizes the impact of shading across the array. Furthermore, it enhances the efficiency and stability of PV systems up to 3.5% compared to the other interconnection schemes under challenging environmental conditions. The Modified BL configuration not only supports the maximum power point tracking (MPPT) but also significantly reduces power losses due to shading by isolating shaded sections within the array. The simulation results demonstrate the importance of considering irradiance variability in PV design. This factor leads to more robust and efficient PV systems under PSCs.
This approach improves solar array technology by optimizing power output and enhance system resilience. Future work may focus on real-world implementation and testing of the Modified BL configuration under various partial shading scenarios to validate its effectiveness. Additionally, integrating this configuration into large solar farms or hybrid energy systems will provide further insights into its scalability and practical impact. Overall, the Modified BL configuration offers a promising solution to improve the reliability of PV arrays in environments with inconsistent sunlight exposure, supporting broader efforts in sustainable energy production.
Author Contributions
Conceptualization, M.A.R. and S.R.; methodology, M.A.R.; software, M.H.; validation, M.A.R., S.Z., V.K. and H.M.M.; formal analysis, S.Z.; investigation, M.H.; resources, M.R.A. and V.K.; data curation, S.Z.; writing— original draft preparation, M.A.R.; writing—review and editing, S.R. and H.M.M.; visualization, I.Z.; supervision, S.R.; project administration, S.R.; funding acquisition, M.R.A. All authors have read and agreed to the published version of the manuscript.
Funding
This research received no external funding.
Institutional Review Board Statement
Not applicable.
Informed Consent Statement
Not applicable.
Data Availability Statement
The data are contained within the article.
Acknowledgments
The authors would like to extend their sincere gratitude to the NFC Institute of Engineering and Technology (NFC IET), Multan, Pakistan, for their invaluable support and resources provided throughout this research. Their assistance and encouragement have been instrumental in the successful completion of this study.
Conflicts of Interest
The authors declare no conflicts of interest.
Abbreviations
| BL | Bridge-linked |
| FF | Fill factor |
| GMPP | Global maximum power point |
| HC | Honeycomb |
| MPPT | Maximum power point tracker |
| ML | Mismatch losses |
| Modified BL | Modified bridge-linked |
| PSCs | Partial shading conditions |
| PV Array | Photovoltaic array |
| SP | Series–parallel |
| STC | Standard temp. conditions |
| TCT | Total cross-tied |
References
- Pandian, P.; David, P.W.; Murugesan, P.; Murugesan, P. Performance Analysis of Novel Solar PV Array Configurations with Reduced Tie Interconnection to Extract Maximum Power under Partial Shading. Electr. Power Compon. Syst. 2023, 1–25. [Google Scholar] [CrossRef]
- Selvamuthukumaran, R.; Kumar, Y.S.; Gupta, R. Global Maximum Power Point Tracking of Multiple PV Modules under Partially Shaded Condition Using Stepped Comparison Search. Electr. Power Compon. Syst. 2016, 44, 1384–1395. [Google Scholar] [CrossRef]
- Vieira, R.G.; de Araújo, F.M.U.; Dhimish, M.; Guerra, M.I.S. A Comprehensive Review on Bypass Diode Application on Photovoltaic Modules. Energies 2020, 13, 2472. [Google Scholar] [CrossRef]
- Desai, A.A.; Mikkili, S. Modeling and Analysis of PV Configurations to Extract Maximum Power Under Partial Shading Conditions. CSEE J. Power Energy Syst. 2022, 8, 1670–1683. [Google Scholar] [CrossRef]
- Abdulmawjood, K.; Alsadi, S.; Refaat, S.S.; Morsi, W.G. Characteristic Study of Solar Photovoltaic Array Under Different Partial Shading Conditions. IEEE Access 2022, 10, 6856–6866. [Google Scholar] [CrossRef]
- Murkute, S.; Kulkarni, V.A. New high performance PV system architecture for mitigation of partial shading effects. Adv. Electr. Eng. Electron. Energy 2023, 5, 100189. [Google Scholar] [CrossRef]
- Pachauri, R.K.; Mahela, O.P.; Sharma, A.; Bai, J.; Chauhan, Y.K.; Khan, B.; Alhelou, H.H. Impact of Partial Shading on Various PV Array Configurations and Different Modeling Approaches: A Comprehensive Review. IEEE Access 2020, 8, 181375–181403. [Google Scholar] [CrossRef]
- El-Khozondar, H.J.; El-Khozondar, R.J.; Matter, K.; Suntio, T. A review study of photovoltaic array maximum power tracking algorithms. Renewables 2016, 3, 3. [Google Scholar] [CrossRef]
- Baimel, D.; Tapuchi, S.; Levron, Y.; Belikov, J. Improved Fractional Open Circuit Voltage MPPT Methods for PV Systems. Electronics 2019, 8, 321. [Google Scholar] [CrossRef]
- Alrubaie, A.J.; Al-Khaykan, A.; Malik, R.Q.; Talib, S.H.; Mousa, M.I.; Kadhim, A.M. Review on MPPT Techniques in Solar System. In Proceedings of the 2022 8th International Engineering Conference on Sustainable Technology and Development (IEC), Erbil, Iraq, 23–24 February 2022; pp. 123–128. [Google Scholar] [CrossRef]
- Soumana, R.A.; Saulo, M.J.; Muriithi, C.M. Comparison of MPPT Techniques on THD Current in a Grid-Connected Photovoltaic System. In Proceedings of the 2022 4th Global Power, Energy and Communication Conference (GPECOM), Nevsehir, Turkey, 14–17 June 2022; pp. 95–100. [Google Scholar] [CrossRef]
- Praveenkumar, S.; Gulakhmadov, A.; Agyekum, E.B.; TAlwan, N.; Velkin, V.I.; Sharipov, P.; Safaraliev, M.; Chen, X. Experimental Study on Performance Enhancement of a Photovoltaic Module Incorporated with CPU Heat Pipe—A 5E Analysis. Sensors 2022, 22, 6367. [Google Scholar] [CrossRef] [PubMed]
- Ram, J.P.; Babu, T.S.; Rajasekar, N. A comprehensive review on solar PV maximum power point tracking techniques. Renew. Sustain. Energy Rev. 2017, 67, 826–847. [Google Scholar] [CrossRef]
- Kumar, V.; Ghosh, S.; Naidu, N.S.; Kamal, S.; Saket, R.K.; Nagar, S.K. Load voltage-based MPPT technique for standalone PV systems using adaptive step. Int. J. Electr. Power Energy Syst. 2021, 128, 106732. [Google Scholar] [CrossRef]
- Fares, D.; Fathi, M.; Shams, I.; Mekhilef, S. A novel global MPPT technique based on squirrel search algorithm for PV module under partial shading conditions. Energy Convers. Manag. 2021, 230, 113773. [Google Scholar] [CrossRef]
- Nasir, M.; Saeed, S.; Gohar, F.; Mudassar, M.; Kamran, M. Analysis of Interconnection Schemes for PV Systems Operating under Shadow Conditions. Int. J. Renew. Energy Res. (IJRER) 2019, 9, 913–922. [Google Scholar] [CrossRef]
- Satpathy, P.R.; Jena, S.; Sharma, R. Power enhancement from partially shaded modules of solar PV arrays through various interconnections among modules. Energy 2018, 144, 839–850. [Google Scholar] [CrossRef]
- Pareek, S.; Chaturvedi, N.; Dahiya, R. Optimal interconnections to address partial shading losses in solar photovoltaic arrays. Sol. Energy 2017, 155, 537–551. [Google Scholar] [CrossRef]
- PraveenKumar, S.; Agyekum, E.B.; Qasim, M.A.; Alwan, N.T.; Velkin, V.I.; Shcheklein, S.E. Experimental assessment of thermoelectric cooling on the efficiency of PV module. Int. J. Renew. Energy Res. (IJRER) 2022, 12, 1670–1681. [Google Scholar] [CrossRef]
- Kambo, T.A.T.; Mohapatra, A.; Nayak, B.; Saiprakash, C.; Samal, S.; Samal, P. Dual Intercolumn Tied Configuration for Maximum Power Enhancement of Solar PV Array under Non-Homogenous Solar Irradiations. In Proceedings of the 2023 International Conference for Advancement in Technology (ICONAT), Goa, India, 24–26 January 2023; pp. 1–6. [Google Scholar] [CrossRef]
- Pendem, S.R.; Sudhakar, A.V.V. Enhancement of Maximum Power in T-C-T PV Array through SuDoKU-based Reconfiguration Techniques under Partial Shading Conditions. In Proceedings of the 2023 IEEE IAS Global Conference on Renewable Energy and Hydrogen Technologies (GlobConHT), Male, Maldives, 11–12 March 2023; pp. 1–7. [Google Scholar] [CrossRef]
- Jalil, M.F.; Khatoon, S.; Nasiruddin, I.; Bansal, R.C. An Improved Feasibility Analysis of Photovoltaic Array Configurations and Reconfiguration Under Partial Shading Conditions. Electr. Power Compon. Syst. 2020, 48, 1077–1089. [Google Scholar] [CrossRef]
Figure 1.
Solar photovoltaic array configurations: (a) series; (b) series–parallel; (c) TCT; (d) parallel; (e) BL.
Figure 1.
Solar photovoltaic array configurations: (a) series; (b) series–parallel; (c) TCT; (d) parallel; (e) BL.
Figure 2.
PV module equivalent circuit.
Figure 2.
PV module equivalent circuit.
Figure 3.
Irradiance on a PV array under different shading patterns.
Figure 3.
Irradiance on a PV array under different shading patterns.
Figure 4.
PV array configuration.
Figure 4.
PV array configuration.
Figure 5.
Proposed modified bridge-linked configuration.
Figure 5.
Proposed modified bridge-linked configuration.
Figure 6.
Series PV array configuration P-V curves under uniform and PSCs.
Figure 6.
Series PV array configuration P-V curves under uniform and PSCs.
Figure 7.
Series–parallel PV array configuration P-V curves under uniform and PSCs.
Figure 7.
Series–parallel PV array configuration P-V curves under uniform and PSCs.
Figure 8.
BL PV array configuration P-V curves under uniform and PSCs.
Figure 8.
BL PV array configuration P-V curves under uniform and PSCs.
Figure 9.
P-V curves of Modified BL PV array configuration under uniform and PSCs.
Figure 9.
P-V curves of Modified BL PV array configuration under uniform and PSCs.
Figure 10.
PV voltage, current, power waveforms of Modified BL array configuration under constant irradiance, sudden, and slow changing irradiance conditions.
Figure 10.
PV voltage, current, power waveforms of Modified BL array configuration under constant irradiance, sudden, and slow changing irradiance conditions.
Figure 11.
MPPT controller.
Figure 11.
MPPT controller.
Figure 12.
Micro-inverters.
Figure 12.
Micro-inverters.
Figure 13.
MPPT controller with Modified BL configuration.
Figure 13.
MPPT controller with Modified BL configuration.
Figure 14.
Array configuration of microprocessor.
Figure 14.
Array configuration of microprocessor.
Figure 15.
Code output of the microprocessor.
Figure 15.
Code output of the microprocessor.
Figure 16.
Power produced with different interconnection schemes.
Figure 16.
Power produced with different interconnection schemes.
Figure 17.
Losses with different interconnection schemes.
Figure 17.
Losses with different interconnection schemes.
Table 1.
Solar module characteristics.
Table 1.
Solar module characteristics.
| Parameters | Values |
|---|
| Voc | 44.9 V |
| Isc | 9.08 A |
| Vmp | 36.4 V |
| Imp | 8.52 A |
| Temp. Coefficient of Voc | −0.39%/°C |
| Temp. Coefficient of Isc | −0.052%/°C |
Table 2.
Losses in PV array configuration under various PSCs (Watts).
Table 2.
Losses in PV array configuration under various PSCs (Watts).
| | Diagonal | Short–Narrow | Short–Narrow | Short–Narrow | Short–Narrow |
|---|
| Modified BL | 652.08 | 1419.31 | 2710.78 | 1458.59 | 2830.55 |
| BL | 1392.97 | 1423.68 | 2911.99 | 1611.62 | 2786.52 |
| Series–Parallel | 1252.45 | 1565.7 | 2923.84 | 2276.28 | 3156.7 |
| Series | 1129.68 | 1507.68 | 2954.67 | 2541.93 | 3623.32 |
Table 3.
Comparison of MPPT controller, micro-inverter, and MPPT controller with Modified BL configuration.
Table 3.
Comparison of MPPT controller, micro-inverter, and MPPT controller with Modified BL configuration.
| Proposed Technique | Production (kWh) | Efficiency (%) |
|---|
| MPPT controller | 6393 | 94.16 |
| Micro-inverter | 6520 | 96.03 |
| MPPT controller with Modified BL configuration | 6545 | 96.40 |
| Disclaimer/Publisher’s Note: The statements, opinions and data contained in all publications are solely those of the individual author(s) and contributor(s) and not of MDPI and/or the editor(s). MDPI and/or the editor(s) disclaim responsibility for any injury to people or property resulting from any ideas, methods, instructions or products referred to in the content. |
© 2025 by the authors. Licensee MDPI, Basel, Switzerland. This article is an open access article distributed under the terms and conditions of the Creative Commons Attribution (CC BY) license (https://creativecommons.org/licenses/by/4.0/).


 ,
, 


