Abstract
Rapid human development has altered land use types, significantly impacting carbon stock, and poor land use will lead to an increase in carbon emissions and exacerbate climate change. Understanding the relationship between land use changes and carbon storage is critical for developing sustainable land management strategies that support carbon sequestration and climate change mitigation. In this study, we analyzed and processed the land use transition changes from 1990 to 2020 and calculated the corresponding carbon storage. Based on the patterns of change and influencing factors (elevation, slope, soil type, GDP, population density, etc.), we predicted the future changes in land use and carbon storage in the Yiluo River Basin under different social development scenarios. It was found that due to the severe impact of natural factors, from 1990 to 2020, the area of cultivated land and grassland decreased by 1150.04 km2 and 936.66 km2, respectively, and the area of forested land and built-up area expanded by 1087.84 km2 and 969.26 km2, respectively. Carbon stocks in the region decreased between 1990 and 2010, followed by a modest recovery from 2010 to 2020, resulting in a total reduction of approximately 2.188 × 10⁶ t. Spatially, carbon stocks diminished in the eastern part but increased in the western part. To assess the long-term sustainability implications, the study simulated four future development scenarios for human society: natural development, urban development, ecological protection, and water conservation. The results showed that in the urban expansion scenario, the proportion of construction land increased significantly, while the ecological protection scenario led to a substantial expansion of forested areas. Notably, carbon stocks showed a significant increase only under the ecological protection scenario, whereas they exhibited a declining trend in all other scenarios.
1. Introduction
The deepening of industrialization has led to the emission of large quantities of greenhouse gases (GHGs) such as CO2, triggering a series of global climate change issues that significantly impact ecosystem health and sustainable development [1,2]. Terrestrial ecosystems play a crucial role in the global carbon balance [3], absorbing CO2 and contributing significantly to the mitigation of the greenhouse effect through participation in the global carbon cycle. Rapid development of human societies has triggered continuous changes in the types of land use, and carbon stocks are closely linked to land use patterns [4,5]. Rational planning and management of land use are crucial for achieving sustainable development, especially by optimizing land use patterns to enhance carbon storage and promote the restoration of ecosystem services. This sustainable land use approach not only helps reduce greenhouse gas emissions but also strengthens the ecosystem’s ability to resist climate change, advancing global strategic goals for addressing climate change.
In land use change and simulation studies, researchers primarily utilize models like CA-Markov, SWAT, FLUS, CLUE-S, and PLUS to explore spatial patterns, temporal dynamics, and major drivers of land use transformations. Yu et al. applied the CA-Markov model to predict land use evolution trends in the Three Gorges Reservoir Area up to 2030, analyzing land use shifts using methods such as transfer matrix analysis [6]. Wang et al. predicted the spatial pattern distribution of land use in the Ji River Basin in 2022 using the CA-Markov model and analyzed the pattern of change in land use in the Ji River Basin and its driving forces [7]. Liu et al. utilized the SWAT hydrological model to examine land use changes in the Fuling River Basin from 1990 to 2010, quantifying the impact of various land use types on water and sediment dynamics within the basin [8]. Luo and Peng used the FLUS model to simulate and predict the land use pattern in central Yunnan in 2025 and discussed the problems exposed during the prediction process [9]. Hu et al. employed the FLUS and InVEST models to simulate and analyze land type changes and carbon stock values under three distinct scenarios in Pingxiang City, elucidating the connection between land use alterations and carbon stock dynamics [10]. Li et al. utilized the CLUE-S model to simulate land use change patterns under three distinct scenarios projected for 2030 in the Flexi River Basin, subsequently evaluating cultivated suitability across these scenarios [11]. Verburg and Overmars describe the functionality of the CLUE-S model and illustrate the model’s potential for scenario-based simulation of land use change trajectories with two case studies [12]. Zhou et al. utilized the PLUS model to project land use patterns for 2030 under three distinct scenarios in the Shuangliao-Dongfeng region of Jilin Province and further analyzed the optimal allocation of land space within these scenarios [13].
Recent studies on carbon stock frequently utilized simulation models including CO2FIX [14], DNDC [15], InVEST, and CENTURY [16]. Notably, the InVEST model stands out for its user-friendly interface and robust assessment accuracy. Wang et al. employed the InVEST model to conduct a quantitative analysis of carbon stock dynamics in the Sanjiang Plain spanning from 1990 to 2020, exploring spatial and temporal variations in carbon stocks [17]. Babbar et al. utilized the InVEST model to evaluate carbon sequestration under various scenarios in the Tiger Reserve, Sariska, India, and to make predictive assessments [18]. Zheng et al. employed the InVEST model to compute and analyze carbon stocks in the northern Jinbei region over the 30-year period from 1990 to 2019 [19]. However, a single model has a narrow range of applicability and limited ability to capture nonlinear relationships and dynamic changes in the system. Therefore, conclusions relying on a single model may be subject to greater uncertainty. The PLUS-InVEST model is able to simultaneously consider the interrelationships between land-use change and ecological services, providing more accurate and comprehensive prediction results. This multi-model approach is more adaptable and flexible and is able to provide robust predictions under different assumptions, which helps to minimize the bias and uncertainty that a single model may bring.
The Yiluo River is a major first-order tributary of the Yellow River and a key water conservation area within its basin [20]. In recent years, significant changes in land use patterns have occurred in the Yiluo River Basin, resulting in variations in the region’s carbon sequestration capacity. Conducting an in-depth analysis of the impact of land use changes on carbon sequestration can provide valuable insights for sustainable development planning in the area. In this study, land use, meteorological, and soil type data from 1990 to 2020 were utilized, and the PLUS-InVEST model was applied to simulate land use changes and corresponding carbon stocks under four social development scenarios for 2030 in the Yiluo River Basin. The model used 11 land-use change drivers to predict future land-use scenarios and analyzed the main drivers behind these changes. The dynamic relationship between land use changes and carbon stocks was evaluated by comparing historical data with simulation results, offering insights into how land use modifications impact carbon sequestration. Multidirectional predictions under different development scenarios help inform future development planning and ensure that land use policies align with ecological sustainability goals. The analysis provides a reference for the rational planning of land use under future social development scenarios in the Yiluo River Basin.
2. Materials and Methods
2.1. Overview of the Study Area
The Yiluo River Basin (33°39′–34°54′ N, 109°43′–113°11′ E) is situated in eastern Shaanxi and western Henan and traverses through Shangluo, Sanmenxia, Luoyang, and Zhengzhou, spanning two provinces and four cities and encompassing nineteen counties (municipalities). The Yiluo River stretches 447 km in length (Figure 1) [21]. The Yi River, originating in Luanchuan County of Henan Province, stretches 264.8 km, while the Luo River, originating in Luonan County of Shaanxi Province, spans 410.1 km. The two rivers merge at Yangcun in Yanshi City, Luoyang, before joining the Yellow River at Gongyi City. The basin falls within a warm temperate monsoon climate zone, with relatively mild temperature fluctuations and an average ranging from 7.8 °C to 13.9 °C. Rainfall distribution is highly uneven, with heavier precipitation in mountainous areas. The region’s annual rainfall ranges between 710 and 1230 mm [22]. The upstream area consists mostly of rocky mountainous terrain, while the downstream area is characterized by loess deposits and low vegetation cover.
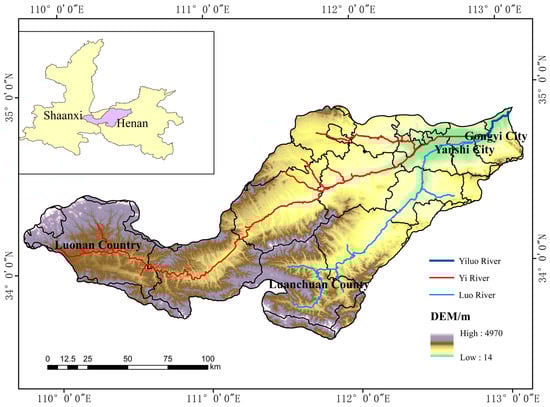
Figure 1.
Overview of the Yiluo River Basin.
2.2. Data Source
The data required for this study include land use data, natural factors such as meteorological information and river systems, and social factors like population and distance to railways (Table 1). Carbon density data were acquired from relevant studies [23,24,25] and adjusted based on formulas and the climatic information of the Yiluo River Basin.

Table 1.
Sources of data.
2.3. Research Method
2.3.1. PLUS Model
As a widely utilized method for modeling land use changes, the PLUS model is both practical and effective. It analyzes land expansion and simulates land use evolution using multi-type random seeds. The Markov chain module within the model is utilized to numerically predict land use changes, and the Kappa coefficient is calculated by comparing land use data from different years (simulation results are shown in Table 2). The PLUS model compares the simulated land use data with the actual land use data, constructs a confusion matrix, and calculates the observed and expected consistency. The Kappa coefficient was obtained using the Kappa statistical tool of the PLUS model by processing the predicted land use data and the actual land use data for 2020. The domain weights in the CARS module are determined by the human-driven conversion potential of land use types. In this study, 11 driving factors were identified, classified into two categories, natural factors and social factors, to analyze the Yiluo River Basin (Figure 2).
Table 2.
Kappa simulation effect.
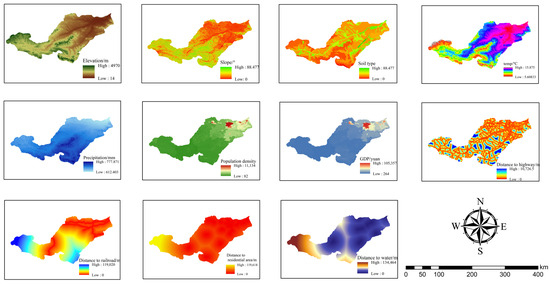
Figure 2.
Land use change drivers.
2.3.2. Land Use Scenario Settings
The study involves setting up predefined social development scenarios for the Yiluo River Basin: natural development, urban development, ecological protection, and water conservation. As per Henan Province’s “14th Five-Year Plan,” water bodies within the watershed are designated as restricted areas where conversion is prohibited. And based on this, the land use transfer cost matrix for the four scenarios is set (see Supplementary Materials). The natural development scenario is based on the land use data from 1990 to 2020 in the PLUS model, using the land use conversion probabilities during these thirty years as the baseline conversion probabilities. In the future land use simulation process, the conversion probabilities for each land type remain unchanged, maintaining the original conversion probabilities for simulation. To systematically illustrate the land use transition patterns under different development scenarios, we adjusted the baseline transition probabilities by applying scenario-based transition weightings and summarized these modifications in Table 3. This table provides a structured comparison of how land use types evolve under natural development, urban development, ecological protection, and water conservation scenarios, reflecting the varying degrees of anthropogenic influence on land conversion dynamics.
Table 3.
Adjusted land use conversion probabilities for future scenarios.
2.3.3. InVEST Model
The InVEST model was developed by the Natural Capital Project team at Stanford University, USA. It encompasses various ecosystem services, including water resources, soil erosion, carbon stocks, nitrogen and phosphorus cycling, and biodiversity. This study assesses the spatial distribution of and variations in carbon stocks by simulating different land use development scenarios, aiming to provide scientific support for sustainable watershed development. For ecosystem carbon stocks, based on the classification of specific land use in the Yiluo River Basin, the average density of each carbon pool was statistically calculated and then multiplied by the corresponding area of each category to determine the total carbon stock in the Yiluo River Basin.
Csum = ∑(Ci-above + Ci-below + Ci-soil + Ci-dead) × Ai
In the formula, i denotes the number of land use categories; Csum denotes the total ecosystem carbon stocks; Ci-above, Ci-below, Ci-soil, and Ci-dead refer to the carbon densities of above-ground biogenic carbon, below-ground biogenic carbon, soil carbon, and dead organic carbon, respectively, for the land use category i; and Ai denotes the area corresponding to the type i land use.
The carbon density coefficients are derived from adjustments based on climate information specific to the Yiluo River Basin and national carbon density data. Given the clear correlation between biological and soil carbon densities with precipitation, both temperature and precipitation factors must be considered together when correcting carbon density. Therefore, we employed the research methods proposed by Alam et al. and Chen et al. [26,27] for the adjustment, ensuring that the correction formula fully accounts for the combined effects of the climatic data of the region.
In the formula, CSP is the soil carbon density corrected for mean annual precipitation; CBP and CBT are the biogenic carbon densities corrected for mean annual precipitation and mean annual temperature, respectively; MAP is the mean annual precipitation (mm); and MAT is the mean annual air temperature (°C).
In the formula, KBP and KBT are the correction factors for the adjusted carbon densities; KB is the correction factor for biological carbon density; and KS is the correction factor for soil carbon density. C′sp and C′′sp are carbon density data for the Yiluo River Basin and the country as a whole, respectively. The results are shown in Table 4.
Table 4.
Yiluo River Basin carbon density/t·hm−2.
3. Results
3.1. Land Use Change in the Yiluo River Basin from 1990 to 2020
The raster data of land use in the Yiluo River Basin from 1990 to 2020 were processed to extract specific land use change values (Table 5). Land use transition matrices and chord diagrams for this period were generated (Figure 3). The primary land use types during this period included cultivated land, woodland, grassland, and construction land. The proportions of these land use types changed from 1990 (46.02% cultivated land, 43.50% woodland, 7.61% grassland, and 2.51% construction land) to 2020 (40.93% cultivated land, 48.31% woodland, 3.47% grassland, and 6.80% construction land). In terms of land area, cultivated land decreased from 10,399.12 km2 in 1990 to 9249.08 km2 in 2020, while woodland expanded from 9829.15 km2 to 10,916.99 km2. Grassland experienced a sharp decline from 1720.38 km2 in 1990 to 783.72 km2 in 2020. Meanwhile, construction land grew significantly from 567.02 km2 in 1990 to 1536.28 km2 in 2020. The largest increases were observed in woodland (1087.84 km2) and construction land (969.26 km2), primarily due to the conversion of cultivated land and grassland.
Table 5.
Changes in land use types from 1990 to 2020.
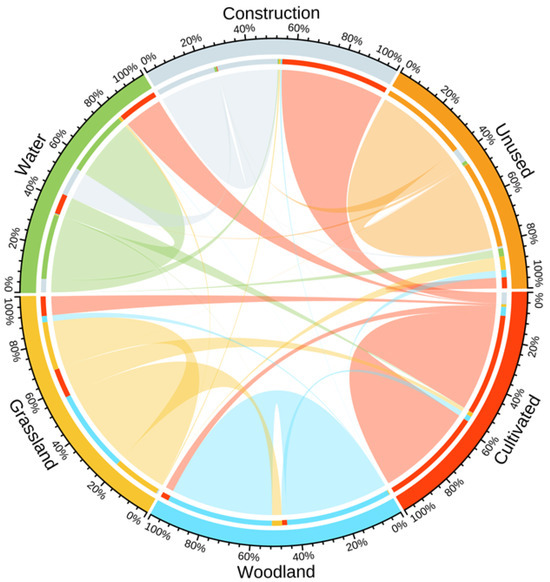
Figure 3.
Land use conversion and chord diagrams.
3.2. Land Use Change Under Different Scenarios in 2030
3.2.1. Simulation Results and Accuracy of 2020
Using the PLUS model and 11 driving factors, including elevation and slope, we forecasted the 2020 land use pattern for the Yiluo River Basin. The prediction utilized land use data from 2000 and 2010 within the basin as a training set. Figure 4 presents both the current and simulated land use for 2020. The resulting Kappa coefficient was 0.847, and the overall accuracy reached 0.907, which falls within an acceptable range. As shown in Table 2, this value, ranging between 0.8 and 1, demonstrates the effectiveness of the simulation for future land use prediction modeling in the Yiluo River Basin [28].
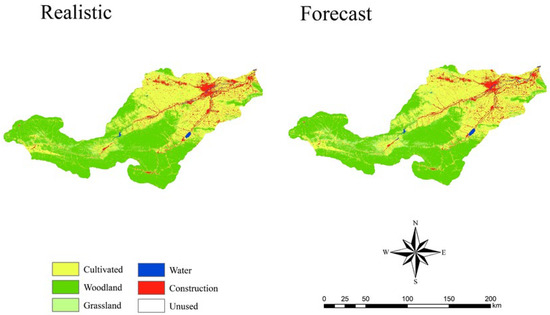
Figure 4.
Realistic and forecast land use of Yiluo River Basin in 2020.
3.2.2. Contribution of Land Use Impact Factors
By utilizing the PLUS model, we mapped the land use development potential in the Yiluo River Basin. Figure 5 illustrates the development potential and the driving factors influencing land use patterns in this basin. The study findings indicate that areas with higher development potential for cultivated land are primarily located in the central-eastern region of the Yiluo River catchment, with elevation and slope playing significant roles in the expansion of cultivated land. Similarly, regions with greater development potential for woodland are located in the western part of the basin, primarily influenced by elevation. Grassland expansion tends to occur in areas with higher elevation and lower temperatures, while population density has a minor impact on grassland expansion. Water development potential is highest near the Yiluo River system, driven by proximity to water bodies and elevation. Additionally, areas with high potential for construction land development are predominantly found in the eastern region of the basin, with elevation being the key factor driving the expansion of construction land. This study does not discuss unused land due to its limited availability and uneven distribution.

Figure 5.
Development potential and driver contributions of various land use types in the Yiluo River Basin.
3.2.3. Simulated Land Use Changes Under Various Scenarios for 2030
Figure 6 illustrates the simulated land use outcomes for 2030 across various scenarios in the Yiluo River region. Table 6 offers a summary of the land use distribution and its variations under different scenarios for 2030 within the Yiluo River region. Despite the land use distribution in the basin remaining relatively stable between 2020 and 2030, significant variations are observed under different scenarios. Across development paths—including natural development, urban development, ecological protection, and water conservation—land use types and distributions show distinct trends. In the natural development scenario, woodland, water, and construction land increase by 272.89 km2, 7.90 km2, and 306.52 km2, respectively, whereas cultivated land and grassland experienced reductions of 302.69 km2 and 283.75 km2, respectively. In the urban development scenario, woodland and construction area increased by 213.04 km2 and 388.00 km2, respectively, representing a notable increase in construction compared to the natural development scenario. In the ecological protection scenario, woodland area increased by 470.15 km2, a significantly higher rate compared to the natural development scenario. Additionally, cultivated and grassland area decreased by 251.21 km2 and 172.83 km2, respectively, with less pronounced declines compared to the natural development scenario. In the water conservation scenario, woodland, water, and construction land increased by 202.67 km2, 13.06 km2, and 306.35 km2, respectively, with woodland increasing at a lower rate compared to the natural development scenario. Furthermore, cultivated land and grassland area decreased by 6237.37 km2 and 283.85 km2, respectively, showing a significant reduction compared to natural development.
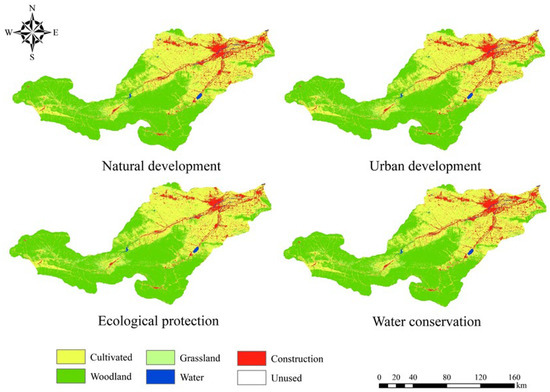
Figure 6.
Results of land use modeling under different scenarios for the Yiluo River Basin in 2030.
Table 6.
Land use area and change under different scenarios in the Yiluo River Basin in 2030 (km2).
3.3. Carbon Stock Changes in the Yiluo River Basin
3.3.1. Characterization of Carbon Stock Changes from 1990 to 2020
The carbon module of the InVEST model was employed to analyze dynamic changes in carbon stock and its spatial distribution in the Yiluo River region from 1990 to 2020. Figure 7 and Figure 8 illustrate the distribution and variations in carbon stocks over this period, while Table 7 presents the carbon storage values for different land use categories. Overall, changes in carbon storage within the Yiluo River region over 30 years were relatively minor. Between 1990 and 2000, cultivated land and grassland carbon stocks decreased by approximately 4.717 × 10⁶ t and 5.198 × 10⁶ t, respectively, while woodland and construction carbon stocks increased by about 5.505 × 10⁶ t and 2.792 × 10⁶ t, respectively, resulting in an overall decrease of 1.618×10⁶t in the total carbon stock. From 2000 to 2010, cultivated and grassland carbon stocks further declined by 9.046 × 10⁶ t and 0.984 × 10⁶ t, respectively, whereas the carbon stocks of woodland and construction areas increased by about 5.421 × 10⁶ t and 2.522 × 10⁶ t, respectively, leading to an overall decrease of 2.084 × 10⁶ t in total carbon. Subsequently, from 2010 to 2020, the carbon stock of cultivated and grassland areas declined by approximately 7.862 × 10⁶ t and 10.567 × 10⁶ t, respectively. While woodland and construction carbon stocks increased by 17.898 × 10⁶ t and 2.717 × 10⁶ t, respectively, leading to a rise of 2.187 × 10⁶ t in the overall carbon storage within the Yiluo River Basin.
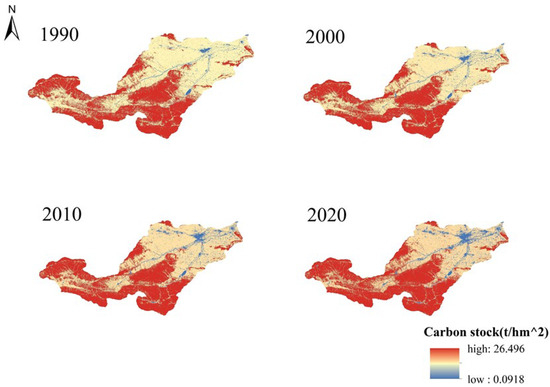
Figure 7.
Distribution of carbon stocks in the Yiluo River Basin from 1990 to 2020.
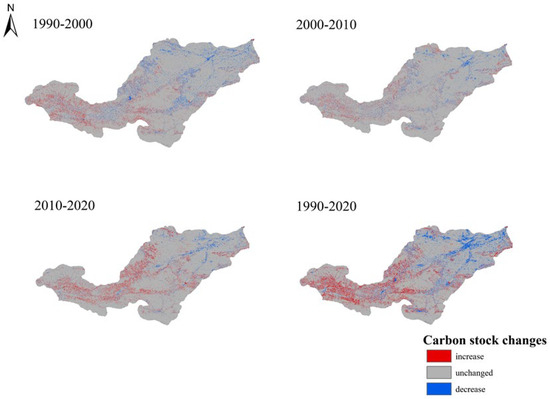
Figure 8.
Changes in carbon stocks in the Yiluo River Basin from 1990 to 2020.
Table 7.
Carbon stocks by land use type from 1990 to 2020 (106 t).
3.3.2. Characterization of Carbon Stock Changes Under Different Scenarios in 2030
Figure 9 shows the spatial distribution of carbon storage across the Yiluo River region in 2030 under different scenarios, while Figure 10 illustrates the variations in carbon storage across these scenarios in the same year. Combining the findings with Table 8, it is evident that by 2030, among the four simulated scenarios, only the carbon storage in the ecological protection scenario shows an increase, whereas the other three scenarios demonstrate varying degrees of carbon stock decline. Specifically, under the natural development scenario, the carbon stock in 2030 is projected to be 488.924 × 10⁶ t, reflecting a decrease of 0.996 × 10⁶ t compared to 2020, primarily attributable to reductions in cultivated land and grassland area. In contrast, under the urban development scenario, the carbon stock in 2030 is estimated to be 487.754 × 10⁶ t, showing a decrease of 2.165 × 10⁶ t compared to 2020, primarily resulting from the large-scale transformation of arable land and grassland into urban areas. Conversely, the carbon stock under the ecological protection scenario is anticipated to reach 494.171 × 106 t by 2030, marking an increase of 4.251 × 10⁶t from 2020, primarily driven by expanded woodland. Lastly, under the water conservation scenario, the carbon stock is projected to be 488.289 × 10⁶ t in 2030, reflecting a decrease of 1.631 × 10⁶ t from 2020, primarily due to increased land allocated for construction. These projections underscore the influence of different development strategies on carbon stock dynamics, particularly highlighting the positive impact of ecological conservation measures on carbon stock increases.

Figure 9.
Distribution of carbon stocks in the Yiluo River Basin under different scenarios in 2030.
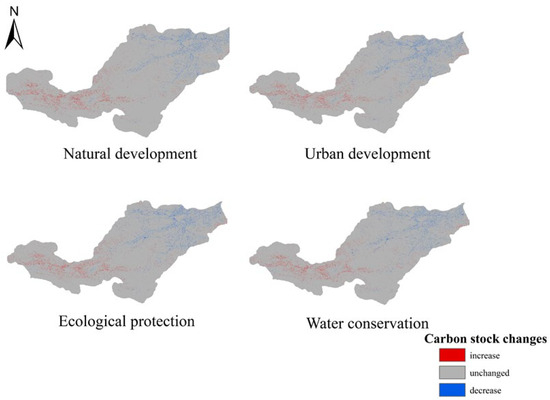
Figure 10.
Changes in carbon stocks under different scenarios in 2030.
Table 8.
Carbon stocks by land use type under different scenarios in 2030 (106 t).
4. Discussion
Between 1990 and 2020, the primary land use categories in the Yiluo River region underwent changes, including cultivated land, woodland, grassland, and construction. Overall, woodland and construction areas expanded, while cultivated land and grassland experienced a decline. From a policy and social development perspective, agricultural land use policies significantly influence regional agricultural production methods and development trajectories, thereby impacting changes in land use patterns [29]. Policies promoting farmland conversion to woodland contributed directly to woodland expansion and reduced cultivated land. The South-to-North Water Diversion Project also played a crucial role in increasing woodland in the Yiluo River region, a major factor behind the substantial rise in woodland areas [30]. Specifically, land utilization within the Yiluo River Basin is most significantly influenced by elevation, consistent with findings from Yuan et al. [31] Varied elevations and topographic features impact land development and utilization [32], with topographic relief and elevation determining land suitability and availability, thereby exerting a significant influence on the expansion of various land categories.
Over the three decades leading up to 2020, the total carbon stock in the Yiluo River Basin showed minimal variation. However, significant changes were observed across different regions of the basin. Specifically, carbon stock decreased in the eastern region and increased in the western region. Alterations in land use are recognized as a primary driver of carbon stock fluctuations in the study area [33]. In the eastern region, construction activities were concentrated, resulting in the spread of construction into nearby cultivated and grassland areas. This expansion decreased cultivated and grassland areas, reducing carbon storage capacity and leading to a decline in carbon stock. In contrast, the western region, dominated by woodland and grassland, experienced a rise in carbon stock as a result of woodland expansion, which enhanced carbon sequestration capacity.
This study simulated and analyzed land use patterns and carbon storage for 2030 in the Yiluo River region under four scenarios—natural growth, urban development, ecological conservation, and water resource management—employing the PLUS and InVEST models. The analysis of land use types and their distribution under these scenarios revealed distinct trends. In the natural growth and water conservation scenarios, similar transformations were observed in land use categories within the Yiluo River region. Carbon stock showed a declining trend compared to 2020, primarily due to the smaller watershed area, which contributes less to carbon sequestration. Moreover, the substantial increase in woodland areas under these scenarios represents an effective pathway for carbon sequestration [34], resulting in a relatively stable carbon stock level. In the urban construction scenario, rapid economic development significantly increased construction areas, leading to a greater decline in carbon stock. This decline is mainly attributed to the extensive conversion of agricultural land and grassland into construction ares, which weakens carbon sequestration capacity and reduces regional carbon stock. Under the ecological protection scenario, woodland expansion led to an increasing trend in carbon stock. This positive trend is attributed to the conversion of cultivated and grassland areas into woodland, which has a stronger carbon sequestration capacity, thereby enhancing regional carbon stock [35]. In the natural development scenario, land use changes in the basin occur relatively slowly, and carbon storage changes are mainly influenced by climate factors and natural processes. Moderate land use adjustments to maintain ecological balance contribute to the stable increase in carbon storage. In the water resource protection scenario, water conservation measures directly affect vegetation cover and soil moisture, which in turn impact carbon storage changes [36]. It is important to consider the actual conditions of the Yiluo River basin and reasonably plan the basin’s development direction without damaging ecological forests and grasslands, ensuring that development aligns with sustainability principles. In the urbanization scenario, as the urbanization process advances, land use changes have a significant impact on carbon storage. Optimizing land use during urbanization and balancing construction land with ecological protection can not only reduce carbon emissions but also enhance carbon storage, contributing to a sustainable urban growth model. In the ecological protection scenario, the basin focuses on implementing ecological restoration and protection projects, which are expected to significantly increase carbon storage. Studies have shown that ecological management has a significant effect on ecosystem restoration, further supporting the effectiveness of such measures in enhancing carbon sequestration [37]. This approach supports the sustainable management of natural resources and aligns with the national policy of promoting green development and preserving the ecological environment, ensuring long-term ecological and economic sustainability.
There are some uncertainties in the simulation process: (1) This study used only 11 driving factors, such as elevation and slope, for land use prediction, while land use changes are typically influenced by multiple factors. (2) The modeled land use in the Yiluo River Basin under four scenarios differed from actual developments. Subsequent studies can make certain improvements: (1) to combine more driving factors for analysis to make the prediction results more accurate and (2) to adjust the numerical relationship among land use categories based on a comprehensive analysis of national policies.
5. Conclusions
(1) From 1990 to 2020, the primary land use types in the Yiluo River region included cultivated land, woodland, grassland, and construction. Over this time, cultivated land and grassland areas experienced a decline, whereas woodland and construction areas saw an expansion. Land use dynamics in the Yiluo River Basin involved mutual conversions among cultivated land, woodland, grassland, and construction. Natural factors largely dictated the development potential of land utilization within the basin.
(2) In the 2030 simulation across various scenarios, the city expansion model shows a substantial growth in construction land, whereas the ecological protection scenario shows a notable increase in woodland area. All four scenarios show a consistent trend of decreasing cultivated land and grassland, along with growth in woodland and construction.
(3) From 1990 to 2020, the overall variation in carbon storage within the Yiluo River region was relatively modest, exhibiting a declining trend from 1990 to 2010 followed by an increase from 2010 to 2020. Among the four scenarios modeled for 2030, only the ecological protection scenario demonstrates an increase in carbon stocks, while the other three scenarios show decreases.
(4) Land type plays a crucial role in shaping the distribution of carbon storage within the Yiluo River region, exhibiting notable variations across different areas of the basin. The transition of cultivated land and grassland to construction areas in the eastern part of the Yiluo River leads to a reduction in carbon stock, while their conversion to woodland areas in the western part enhances carbon stock.
Supplementary Materials
The following supporting information can be downloaded at: https://www.mdpi.com/article/10.3390/su17031233/s1, Tables S1–S4 represent the land use transition cost matrices set for the simulation of four development scenarios.
Author Contributions
N.Z. contributed to the conceptualization, validation, review and editing, and oversight of the study. F.G. is responsible for the preparation of methods, software, and original drafts. C.S. and Z.Y. are responsible for data validation and preparation of field surveys. L.Q., B.L., and M.Z. were formally analyzed and visualized. All authors have read and agreed to the published version of the manuscript.
Funding
This study was financially supported by the National Natural Science Foundation of China (51809086), the Henan Provincial Science and Technology Research Project (222102320144), and the Young Backbone Teacher Project of Henan University of Science and Technology (13450005).
Institutional Review Board Statement
Not applicable.
Informed Consent Statement
Not applicable.
Data Availability Statement
The original contributions presented in this study are included in the article/Supplementary Material. Further inquiries can be directed to the corresponding authors.
Conflicts of Interest
Author Binglei Liu was employed by the company Luoyang Water Resources Surveying & Designing Co., Ltd. The remaining authors declare that the research was conducted in the absence of any commercial or financial relationships that could be construed as a potential conflict of interest.
References
- Sarkodie, S.A.; Owusu, P.A.; Leirvik, T. Global effect of urban sprawl, industrialization, trade and economic development on carbon dioxide emissions. Environ. Res. Lett. 2020, 15, 034049. [Google Scholar] [CrossRef]
- Sokolov, Y.I. Risks of Global Climate Change. Issues Risk Anal. 2021, 18, 32–45. [Google Scholar] [CrossRef]
- Houghton, R.A.; House, J.I.; Pongratz, J.; van der Werf, G.R.; DeFries, R.S.; Hansen, M.C.; le Quéré, C.; Ramankutty, N. Carbon emissions from land use and land-cover change. Biogeosciences 2012, 9, 5125–5142. [Google Scholar] [CrossRef]
- Chen, N.; Xin, C.; Tang, D.; Zhang, L.; Xin, S. Multi-scenario land use optimization and carbon stock assessment in Northwest China. Environ. Sci. 2023, 44, 4655–4665, (In Chinese with English Abstract). [Google Scholar]
- Zhou, T.; Shi, P. Indirect effects of land use change on soil carbon stock changes in China. Adv. Earth Sci. 2006, 44, 138–143, (In Chinese with English Abstract). [Google Scholar]
- Yu, Z.; Li, M.; Qian, Y.; Peng, R.; Yang, G. Land use change and its ecological effects in Three Gorges Reservoir Area based on CA_Markov model with multiple scenario simulation. Res. Soil Water Conserv. 2024, 31, 363–372, (In Chinese with English Abstract). [Google Scholar] [CrossRef]
- Wang, Y.; Yu, X.; He, K.; Li, Q.; Zhang, Y.; Song, S. Dynamic simulation of land use change in Jihe watershed based on CA-Markov model. Trans. Chin. Soc. Agric. 2011, 27, 330–336. [Google Scholar] [CrossRef]
- Liu, X.; Zhang, H.; Luo, Z.; Zhang, J.; An, N. Response of runoff and sediment yields to land use change in Fu River watershed based on SWAT model. Res. Soil Water Conserv. 2024, 31, 79–89+100, (In Chinese with English Abstract). [Google Scholar] [CrossRef]
- Luo, M.; Peng, S. Simulation of land use change in central Yunnan based on FLUS model. In Proceedings of the 2020 IEEE International Conference on Information Technology, Big Data and Artificial Intelligence (ICIBA), Chongqing, China, 6–8 November 2020; pp. 1375–1378. [Google Scholar]
- Hu, J.; Le, X.; Xu, Y. Estimating Terrestrial Eco-System Carbon Stock Changes Caused by Multi-Scenarios Land-Use Changes Basedon the FLUS Model-A Case Study of Pingxiang, Jiangxi. Res. Soil Water Conserv. 2024, 31, 299–309, (In Chinese with English Abstract). [Google Scholar] [CrossRef]
- Li, H.; Chen, G.; Wang, S.; Zhang, Z.; Zhang, Z.; Jin, H. Suitability Evaluation of Cultivated Land in Naoli River Basin Based on CLUE—S Scenario Simulation. Trans. Chin. Soc. Agric. Mach. 2023, 54, 329–339, (In Chinese with English Abstract). [Google Scholar]
- Verburg, P.H.; Overmars, K.P. Dynamic Simulation of Land-Use Change Trajectories with the Clue–s Model. In Modelling Land-Use Change; Springer: Dordrecht, The Netherlands, 2007; pp. 321–335. [Google Scholar] [CrossRef]
- Zhou, Y.; Qin, T.; Pei, Y.; Gao, Y.; Guan, Y.; Kou, F. Land use simulation and multi-scenario prediction based on PLUS model and ground substrate. Geol. Rev. 2023, 70, 315–318, (In Chinese with English Abstract). [Google Scholar] [CrossRef]
- Masera, O.R.; Garza-Caligaris, J.F.; Kanninen, M.; Karjalainen, T.; Liski, J.; Nabuurs, G.J.; Pussinen, A.; de Jong, B.H.J.; Mohren, G.M.J. Modeling carbon sequestration in afforestation, agroforestry and forest management projects: The CO2FIX V.2 approach. Ecol. Model. 2003, 164, 177–199. [Google Scholar] [CrossRef]
- Li, C.; Frolking, S.; Frolking, T.A. A model of nitrous oxide evolution from soil driven by rainfall events: 2. Model applications. J. Geophys. Res. Atmos. 1992, 97, 9777–9783. [Google Scholar] [CrossRef]
- Parton, W.J.; Schimel, D.S.; Cole, C.v.; Ojima, D.S. Analysis of Factors Controlling Soil Organic Matter Levels in Great Plains Grasslands. Soil Sci. Soc. Am. J. 1987, 51, 1173–1179. [Google Scholar] [CrossRef]
- Wang, H.; Zheng, W.; Gai, Z. Spatio-temporal differentiation of carbon storage in black soil region based on In VEST Model. Acta Sci. Circumstantiae 2024, 44, 473–481, (In Chinese with English Abstract). [Google Scholar] [CrossRef]
- Babbar, D.; Areendran, G.; Sahana, M.; Sarma, K.; Raj, K.; Sivadas, A. Assessment and prediction of carbon sequestration using Markov chain and InVEST model in Sariska Tiger Reserve, India. J. Clean. Prod. 2021, 278, 123333. [Google Scholar] [CrossRef]
- Zheng, J.; Cai, Y.; Guo, X.; Wei, X.; Yang, Z.; Sun, J.; Liu, Z. Study on land use change and carbon stock in northern Shanxi Province based on InVEST model. Geol. Bull. China 2024, 43, 173–180, (In Chinese with English Abstract). [Google Scholar]
- Guo, Y.; Lu, X.; Ding, S. The classification of plant functional types based on the dominant herbaceousspecies in the riparian zone ecosystems in the Yiluo River. Acta Ecol. Sin. 2012, 32, 4434–4442. [Google Scholar]
- He, M.; Ma, S. Study on Soil and Water Conservation Zoning and Layout of Measures in Yilo River Basin. Henan Water Resour. South North 2016, 9, 8–9, (In Chinese with English Abstract). [Google Scholar]
- Zhang, Y.; Wang, W. Spatial Scale Transformation of Evapotranspiration Based on Remote Sensing in Yiluo River Basin. Acta Geod. Cartogr. Sin. 2013, 42, 906–912, (In Chinese with English Abstract). [Google Scholar]
- Fang, J.; Yang, Y.; Ma, W.; Muhammat, A.; Shen, H. Carbon pools and their changes in grassland ecosystems in China. Sci. Sin. (Vitae) 2010, 40, 566–576, (In Chinese with English Abstract). [Google Scholar]
- Duan, X.; Han, M.; Kong, X.; Sun, J.; Zhang, H. Spatiotemporal Evolution and Simulation Prediction of Ecosystem Carbon Storage in the Yellow River Basin Before and After the Grain for Green Project. Environ. Sci. 2024, 45, 5943–5956, (In Chinese with English Abstract). [Google Scholar] [CrossRef]
- He, X.; Xu, Y.; Fan, X.; Geng, Q.; Tian, Z. Temporal and spatial variation and prediction of regional carbon storage in Zhongyuan Urban Agglomeration. China Environ. Sci. 2022, 42, 2965–2976, (In Chinese with English Abstract). [Google Scholar] [CrossRef]
- Alam, S.A.; Starr, M.; Clark, B.J.F. Tree biomass and soil organic carbon densities across the Sudanese woodland savannah: A regional carbon sequestration study. J. Arid Environ. 2013, 89, 67–76. [Google Scholar] [CrossRef]
- Chen, G.; Yang, Y.; Liu, L.; Li, X.; Zhao, Y.; Yuan, Y. Research Review on Total Below ground Carbon Allocation in Forest Ecosystems. J. Subtrop. Resour. Environ. 2007, 2, 34–42, (In Chinese with English Abstract). [Google Scholar] [CrossRef]
- Lin, W.; Sun, Y.; Nijhuis, S.; Wang, Z. Scenario-based flood risk assessment for urbanizing deltas using future land-use simulation (FLUS): Guangzhou Metropolitan Area as a case study. Sci. Total Environ. 2020, 739, 139899. [Google Scholar] [CrossRef]
- Uthes, S.; Fricke, K.; König, H.; Zander, P.; van Ittersum, M.; Sieber, S.; Helming, K.; Piorr, A.; Müller, K. Policy relevance of three integrated assessment tools—A comparison with specific reference to agricultural policies. Ecol. Model. 2010, 221, 2136–2152. [Google Scholar] [CrossRef]
- Wang, Y.; Zhang, Y.; Qian, X.; Yang, Y.; Cui, J.; You, J.; Bian, X. Dynamic Evolution of Eco-geologieal Pattern: Taking Danjiangyuan Area of Central Line Project of South-to-North Water Diversion. Northwestern Geol. 2023, 56, 129–140, (In Chinese with English Abstract). [Google Scholar]
- Yuan, J.; Liu, X.; Li, H.; Xing, L.; Luo, X.; Wang, R.; Wang, C.; Zhao, H. Spatial and Temporal Variability of Carbon Stocks in Different Land Use Types in the Yiluo River Basin in the Middle Part of the Yellow River from 1990 to 2050. Geoscience 2024, 38, 559–573, (In Chinese with English Abstract). [Google Scholar] [CrossRef]
- Zhang, C.; Zhang, Y. Spatio-temporal pattern of land use change in Xinjiang based on DEM. South Cent. Agric. Sci. Technol. 2024, 45, 116–121+126, (In Chinese with English Abstract). [Google Scholar]
- Naikoo, M.W.; Rihan, M.; Ishtiaque, M.; Shahfahad. Analyses of land use land cover (LULC) change and built-up expansion in the suburb of a metropolitan city: Spatio-temporal analysis of Delhi NCR using landsat datasets. J. Urban Manag. 2020, 9, 347–359. [Google Scholar] [CrossRef]
- Zeng, Q.; Sun, C. Estimation and influencing factors of carbon storage in terrestrial ecosystems in the Yellow River Basin the Yellow River Basin. Acta Ecol. Sin. 2024, 44, 5476–5493, (In Chinese with English Abstract). [Google Scholar] [CrossRef]
- Rutishauser, E.; Hérault, B.; Baraloto, C.; Blanc, L.; Descroix, L.; Sotta, E.D.; Ferreira, J.; Kanashiro, M.; Mazzei, L.; d’Oliveira, M.V.N.; et al. Rapid tree carbon stock recovery in managed Amazonian forests. Curr. Biol. 2015, 25, 2738. [Google Scholar] [CrossRef]
- Kong, R.; Zhang, Z.; Zhang, F.; Tian, J.; Zhu, B.; Zhu, M.; Wang, Y. Spatiotemporal Variation of Forest Carbon Storage in the Yangtze River Basin and Its Driving Factors Analysis. Soil Water Conserv. Res. 2020, 27, 60–66. [Google Scholar] [CrossRef]
- Junju, Z.; Yaru, Z.; Peng, H.; Xi, Z.; Wei, F.; Li, Q.; Xue, D.; Dou, J.; Shi, W.; Wei, W. Impacts of ecological restoration projects on the ecosystem carbon storage of inland river basin in arid area, China. Ecol. Indic. 2020, 118, 106803. [Google Scholar]
Disclaimer/Publisher’s Note: The statements, opinions and data contained in all publications are solely those of the individual author(s) and contributor(s) and not of MDPI and/or the editor(s). MDPI and/or the editor(s) disclaim responsibility for any injury to people or property resulting from any ideas, methods, instructions or products referred to in the content. |
© 2025 by the authors. Licensee MDPI, Basel, Switzerland. This article is an open access article distributed under the terms and conditions of the Creative Commons Attribution (CC BY) license (https://creativecommons.org/licenses/by/4.0/).