Abstract
Data scarcity and privacy concerns in various fields, including transportation, have fueled a growing interest in synthetic data generation. Synthetic datasets offer a practical solution to address data limitations, such as the underrepresentation of minority classes, while maintaining privacy when needed. Notably, recent studies have highlighted the potential of combining real and synthetic data to enhance the accuracy of demand predictions for shared transport services, thereby improving service quality and advancing sustainable transportation. This study introduces a systematic methodology for evaluating the quality of synthetic transport-related time series datasets. The framework incorporates multiple performance indicators addressing six aspects of quality: fidelity, distribution matching, diversity, coverage, and novelty. By combining distributional measures like Hellinger distance with time-series-specific metrics such as dynamic time warping and cosine similarity, the methodology ensures a comprehensive assessment. A clustering-based evaluation is also included to analyze the representation of distinct sub-groups within the data. The methodology was applied to two datasets: passenger counts on an intercity bus route and vehicle speeds along an urban road. While the synthetic speed dataset adequately captured the diversity and patterns of the real data, the passenger count dataset failed to represent key cluster-specific variations. These findings demonstrate the proposed methodology’s ability to identify both satisfactory and unsatisfactory synthetic datasets. Moreover, its sequential design enables the detection of gaps in deeper layers of similarity, going beyond basic distributional alignment. This work underscores the value of tailored evaluation frameworks for synthetic time series, advancing their utility in transportation research and practice.
1. Introduction
The scarcity of real data and the privacy constraints surrounding existing datasets present significant challenges for data scientists aiming to leverage machine learning across various domains. Synthetic data offer a compelling solution to these issues. While the concept of synthetic data is not new, advancements in generative adversarial networks (GANs) have greatly enhanced the quality and realism of synthetic data, enabling innovative applications in fields such as medicine [1], finance [2], and many others [3]. This growing potential is also gaining recognition in the transportation sector, where research is increasingly exploring the practical uses of GAN-generated synthetic data [4].
The general architecture of a GAN consists of two key components: a generator and a discriminator, as illustrated in Figure 1. The process begins with the generator network, which takes a vector of latent random variables—essentially a noise vector—as its input to produce a synthetic (fake) sample. This sample is then evaluated by the discriminator network, a binary classifier designed to estimate the probability of the sample being real or fake. Based on this evaluation, the discriminator classifies the sample and feeds the probabilities back to the generator. This feedback is used to update the generator’s parameters, enhancing its ability to produce more realistic synthetic samples over successive iterations. Over time, the generator and discriminator networks are engaged in a dynamic adversarial process. The generator strives to produce fake samples that the discriminator misclassifies as real, while the discriminator continuously improves its ability to differentiate between real and fake samples. This competition drives both networks to refine their respective performances, ultimately resulting in the generation of highly realistic synthetic data.
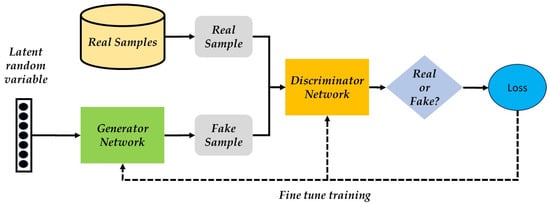
Figure 1.
Basic GAN architecture [3].
Since the introduction of GAN in 2014 [5], numerous variations of this technique have been developed to cater to specific data types requiring synthetic data generation. While GAN-based models were initially used predominantly for generating synthetic images, they are now employed to produce a wide range of alpha-numeric data formats using various GAN-based algorithms. As GAN-based synthetic data generation has advanced, its applications have become increasingly specialized. Consequently, the performance indicators (PIs) used to evaluate the quality of synthetic data vary depending on the data format. For instance, the PIs suitable for unstructured text data differ from those best suited for tabular data, such as medical records [6].
In the transportation sector, as in many other fields, data scarcity and privacy concerns are key factors driving the increasing interest in synthetic data, particularly GAN-based models [7]. These challenges are especially evident in shared transport services, ranging from public transportation to shared micro-mobility systems, which aim to reduce private vehicle usage and enhance the sustainability of the transportation system. Accurate demand prediction for these services is crucial to ensuring high service quality. However, shifts in usage patterns necessitate reliance on recent and up-to-date data, limiting the depth and richness of datasets available for prediction models. Additionally, data scarcity often leads to class imbalances and insufficient representation of certain minority classes. For instance, having only a limited number of examples of days with significantly low demand for a particular shared transport mode can pose a challenge when developing demand forecasting models [8]. Consequently, recent studies have increasingly adopted GAN-based models to enhance prediction models for shared transportation services, as discussed in the following sections.
The challenge of data sparsity in intelligent transportation systems is addressed in [4], emphasizing the value of synthetic data, particularly data generated by conditional tabular generative adversarial networks (CTGAN), a version of GAN that is especially appropriate for tabular data. Using two real-world datasets—one focused on traffic monitoring and the other on taxi rides—they demonstrated the utility of synthetic data by employing Kolmogorov–Smirnov and Pearson correlation coefficients as performance indicators (PIs). Their findings indicated satisfactory quality in the generated data.
Enhancing data regarding trips conducted by several car-related services has been dealt with in other works as well. The authors in [9] used synthetic data to improve the prediction of trips’ distance and usage time of a car-sharing service. Various methods, including CTGAN, were used for generating synthetic trips. The quality of the synthetic data in terms of its statistical similarity with the real data, i.e., its fidelity, was assessed before using it for augmenting the training dataset. Both qualitative, i.e., visual assessment of graphical representation, and descriptive statistics were applied. Given the tabular nature of the data, the similarity of the marginal distributions was assessed using Kolmogorov–Smirnov and total variation distance (for categorial variables). For numerical variables, pairwise Pearson correlations were also implemented to ensure that the relationships between various variables are maintained. Once these assessments confirmed that the synthetic dataset seemed valid, its utility was proved by comparing the prediction results with and without the synthetic data.
In the ride-hailing sector, the authors in [10] expanded on earlier work by [11] to predict ride-hailing demand. They compared Wasserstein GAN (WGAN) with traditional methods like Monte Carlo Markov chains and ride request graphs. They acknowledged the challenges in evaluating synthetic data, particularly ensuring that the spatio-temporal distribution of synthetic ride requests aligned with real data. Unlike car-sharing data, ride-hailing data was treated as a graph, where nodes represented origin/destination areas and edges represented trips. This approach leveraged the densification power law from previous research and facilitated the application of metrics suited to origin–destination (O–D) matrices.
Micromobility, particularly electric kickboards, has been the focus of two studies [8,12] proposing a novel GAN-based method, modified-CWGAN-GP, to generate synthetic time series data for predicting demand in electric kickboard sharing services. Building on earlier work [12], the researchers demonstrated that their model outperformed existing GAN-based approaches. The synthetic data quality was assessed using Pearson correlation coefficients, treating the data as tabular rather than pure time series. Using a blending ensemble regressor, the authors demonstrated that incorporating synthetic data improved the accuracy of demand predictions.
The use of smart card data for public transportation demand, another form of time series data, was explored by [13]. The researchers generated synthetic smart card data using Bayesian networks and CTGAN, evaluating the synthetic data visually by examining trip timing, travel duration, and origin–destination distributions. Their results confirmed that both methods effectively reproduced the spatio-temporal characteristics of the real data.
The authors in [7] proposed a hybrid framework for generating synthetic populations with trip chains, encompassing multiple transportation modes. This approach involved three steps: (1) generating population tabular data using CTGAN based on census data, (2) creating location sequences using RNNs trained on household travel surveys, and (3) merging these datasets using a combinatorial optimization algorithm. The synthetic data quality was evaluated using metrics like Pearson correlation, standardized root mean square error (SRMSE), and R2 scores. These metrics were applied to assess marginal distributions of trip lengths and conditional trip distances based on individual occupations, ensuring that correlations between population characteristics and trajectories were preserved.
Several insights can be drawn from the above references. First, they provide evidence of the growing use of GAN-based synthetic data generation in advancing sustainable transportation solutions. Second, evaluating the quality of synthetic data by comparing them to the real data is an essential step in all applications. Third, a large portion of the studies address problems that can be inherently expressed as time series, such as the demand for ride-hailing addresses in [10], the use of public transport addressed in [13], etc. Fourth, although the underlying data in these cases inherently exhibit time series characteristics, comparisons between synthetic and real data primarily focus on aggregate features, such as daily demand distributions. While these comparisons are crucial, their aggregate nature limits the granularity of the analysis. Notably, none of the reviewed studies employed a performance indicator (PI) that directly compares individual time series. The fifth insight that can be drawn from the above references is that the evaluation processes used in the previous recent studies encompass no explicit attention to proper representation of less common travel behavior patterns.
These insights are in line with the conclusion stated in [14] that, in contrast to tabular or image data in transportation, for which experts share some consensus regarding evaluation metrics, synthetic time series present distinct challenges that require customized evaluation approaches. Furthermore, determining what constitutes a high-quality synthetic time series dataset and identifying the most effective evaluation criteria remain unresolved issues, not only within the transportation domain but across various fields [14,15].
Since time series are fundamental for understanding patterns in many areas, a critical step in defining appropriate PIs for assessing the quality of synthetic transport-related time series involves a review of PIs employed in other domains where synthetic time series are utilized. Recent years have seen the publication of several review papers exploring performance indicators (PIs) for assessing the quality of synthetic time series. The authors in [16] reviewed the application of GAN-based models for spatio-temporal data and the methods used to evaluate their quality. They categorized data into four types: Time Series, Spatio-Temporal Events, Trajectories, and Spatio-Temporal Graphs. Their work revealed that, in works addressing time series, most evaluations employed metrics traditionally used for tabular data [17].
Two comprehensive review papers by Stenger and colleagues [15,17] focus specifically on time-series-related PIs. The authors in [17] analyzed 75 scientific articles, extracting the PIs used or proposed in each. These metrics were organized into an ontology that categorizes PIs based on specific aspects of synthetic data quality, showing the interrelationships between the categories.
The authors in [15] examined 83 evaluation measures for synthetic time series, categorizing them into eight primary aspects of quality: Fidelity, Distribution Matching, Diversity, Coverage, Novelty, Privacy, Efficiency, and Utility.
- Fidelity focuses on the resemblance of individual synthetic time series to real ones in terms of patterns, noise levels, and other features.
- Distribution Matching assesses how well the data distributions of real and synthetic datasets align.
- Diversity and Coverage ensure that the synthetic data encompass the range of variability present in the real data.
- Novelty complements these, ensuring that the synthetic data introduce new, meaningful variations rather than duplicating real data.
- Privacy evaluates the risk of exposing sensitive information, addressing a key motivation for generating synthetic data.
- Efficiency examines the resources required to generate synthetic data.
- Utility evaluates whether the synthetic data enhance the performance of the machine learning tasks for which they were created, requiring application-specific testing.
The emergence of several recent review papers focusing specifically on the evaluation of synthetic time series [15,17,18,19] highlights the importance of synthetic data in general as a remedy for data scarcity and imbalance and a catalyst for improving machine learning models. Moreover, these reviews emphasize the specific challenges that need to be addressed for ensuring the quality of such generated data by applying a bundle of techniques for comparing them to real data. The abundance of PIs for evaluating synthetic time series underscores the challenge in selecting the most suitable ones for a specific domain. This is especially true for transport-related time series, which possess unique characteristics that set them apart from typical time series in other domains, such as healthcare or finance, for example, as they often exhibit distinct daily patterns, such as morning and evening peaks.
This research aims to develop a clear and practical methodology for evaluating the quality of transport-related synthetic time series. The approach is specifically designed to address the unique characteristics of time series in the transportation domain, as quality assurance of synthetic data is crucial for enhancing machine learning-based travel behavior predictions. To the best of my knowledge, no such evaluation methodology has been published in the professional literature to date.
Of the eight key aspects of synthetic data quality outlined in [15], the first five, i.e., Fidelity, Distribution Matching, Diversity, Coverage, and Novelty, are most relevant for evaluating transport-related time series. Privacy is not a concern in this context, as time series data typically do not involve sensitive personal information. Similarly, efficiency is beyond the scope here, as the focus is on assessing the quality of the synthetic data itself rather than the process of its generation. Regarding Utility, the emphasis is placed on general evaluation measures to ensure the synthetic dataset’s versatility for various machine learning applications. PIs that serve the Utility aspect, such as those that account for improvement in prediction accuracy, are highly specific and depend on the predefined goal of the data generation process. While they highlight the synthetic data’s purpose, they do not offer a general assessment of their overall alignment with real data and need separate evaluations for each objective [19].
The contribution of this paper is threefold:
- Introducing a systematic and comprehensive evaluation framework to assess the quality of synthetic datasets for transport-related time series, addressing all pertinent quality aspects while accounting for the unique characteristics of such data.
- Showcasing the advantages of a time-series-specific clustering process and illustrating how this unsupervised method lays the foundation for evaluating the accurate representation of both dominant and minority classes within the synthetic dataset.
- Demonstrating the application of the proposed evaluation framework on two transport-related time series datasets, highlighting its effectiveness and ability to identify flaws in the synthetic data.
This paper is structured as follows. Section 2 outlines the proposed methodology for assessing the quality of synthetic transport-related time series datasets. Section 3 presents the results of applying this methodology to two case studies, and Section 4 offers a discussion along with directions for future research.
2. Methodology—The Sequential Evaluation Process
The proposed evaluation methodology is structured sequentially, beginning with high-level Performance Indicators (PIs) that examine fundamental properties and progressing to finer-grained analyses. A key prerequisite is ensuring that none of the synthetic time series are identical to any real time series, thereby addressing the Novelty category [15]. Additionally, the selection of PIs was guided by four principles: (1) addressing Stenger’s four main aspects of quality, i.e., Fidelity, Distribution Matching, Diversity, and Coverage; (2) accommodating the unique characteristics of transport-related time series; (3) enabling straightforward interpretation of the PIs; and (4) ensuring ease of implementation.
The evaluation process comprises five steps, with the first four focusing on the entire dataset as a single entity (with hourly sub-division in some cases). These steps are summarized in Figure 2. Hellinger Distance (HD) is a commonly used measure to quantify the similarity between distributions that has been shown to be consistent and easy to interpret [19]. The authors in [18] also emphasized the advantages of HD as a distance measure for time series, noting its widespread use and superior performance in statistical analysis compared to other distance measures. For ease of interpretation, the discrete version of HD is used in this paper. In this version, given two approximations to density functions, each represented by bins, and , HD between and is computed as illustrated in Equation (1):
where and are proportions of values in the ith bin in distributions and , respectively.
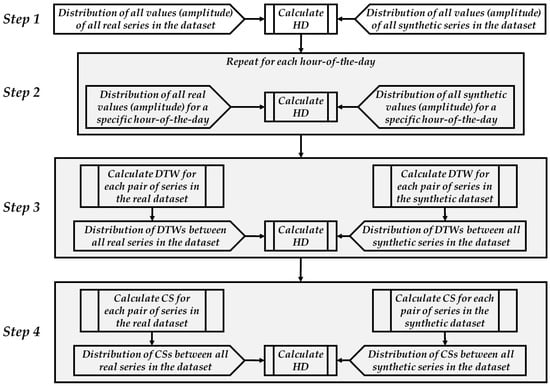
Figure 2.
The first four steps of the sequential process of evaluating the quality of synthetic data.
Each of the four steps employs HD to evaluate the similarity between real and synthetic datasets from different perspectives. The first two steps apply HD as the sole PI. HD is a suitable PI for Distribution Matching, as it is commonly used to quantify similarity between distributions [19]. Steps three and four combine two similarity measures between pairs of real and synthetic data series, i.e., Dynamic Time Warping (DTW) and Cosine Similarity (CS), with HD as a distributional measure. This combination accounts for Fidelity, as both DTW and CS address the general pattern of the time series, and, at the same time, for Diversity and Coverage, as they ensure a satisfactory distribution of DTW and CS.
2.1. Evaluation Steps Addressing the Entire Dataset as a Single Entity
- Step 1: Marginal Distribution Matching
The minimum requirement for a synthetic dataset is that the marginal distributions of its values align with those of the real data [19]. Hellinger Distance (HD) values range from 0 to 1, with lower values indicating a better similarity. Yet the specific range of values that can be interpreted as “sufficiently similar” is context dependent. To establish benchmarks, HD values were calculated based on 10-fold sampling of the real dataset (see Figure 3). If the HD between the real and synthetic data falls within the range of the 10-fold HD, the synthetic data quality is deemed to be satisfactory.
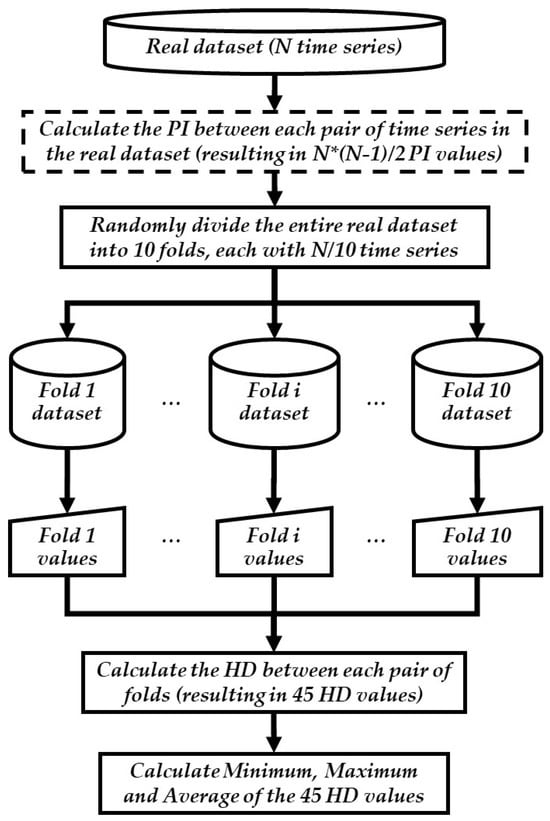
Figure 3.
The 10-fold process for calculating the HD within the real dataset (the process within the dashed rectangle is optional and executed when the values that serve as an input for the HD calculation are based on similarities between individual time series).
- Step 2: Temporal Resolution Analysis
In this step, the dataset was divided into hourly intervals, and HD was computed for each hour of the day. This step ensures that the synthetic data capture temporal variations accurately. The choice of one-hour intervals reflects common practices in transportation applications, such as hourly passenger counts or bike rental demand.
- Step 3: Pairwise Comparisons Using DTW
After assessing the quality of the synthetic data in terms of amplitude distribution, further analysis should focus on applying a PI that compares individual time series. For a dataset with M time series, this involves generating a set of M × (M − 1)/2 values, one value for each pair of time series. Regardless of the specific PI chosen for these comparisons, the resulting distribution of values reflects the diversity present in the real time series, which should similarly characterize the synthetic time series. Therefore, Hellinger Distance (HD) can also be used in this context to evaluate the quality of the synthetic time series.
Dynamic Time Warping (DTW) was used to compare individual time series, capturing both their amplitude and temporal alignment. The authors in [20] highlight the popularity of DTW in the transportation domain, attributing it to DTW’s ability to handle temporal misalignment and supporting this claim by citing a range of relevant studies. The authors in [21] examined various measures for comparing time series of travel times along a link and identified DTW as the most suitable choice, as it avoids imposing the characteristics of the time series on the comparison. Its flexibility in defining the size of the time window within which similar values are identified, as well as its ability to consider a two-sided time window (before and after each timestamp), makes it particularly well-suited for analyzing transport-related time series.
- Step 4: Feature-Based Comparison Using CS
While DTW effectively captures key aspects of the similarity between time series, addressing both amplitude and temporal dimensions, its sequential nature limits its ability to account for relationships between distinct segments of the time series. In transport-related time series, correlations between peak periods are particularly significant. For example, the amplitude of a morning peak, and sometimes a midday peak, often shows a positive correlation with the evening peak. These relationships are crucial and should be reflected in synthetic time series.
Cosine similarity (CS) is an effective PI for capturing inter-peak relationships. Implementing CS requires defining the input vector, including its dimensions and content. It is essential to limit the number of elements in the CS vector, i.e., the features of the time series, to avoid sparsity, which can hinder the identification of meaningful patterns. In transportation applications, dividing the day into time windows is a standard approach. Accordingly, a five-element vector was defined, with each element corresponding to one of the following time windows: 6:00–09:30 (morning), 9:30–12:30 (late morning), 12:30–15:30 (noon), 15:30–19:30 (evening), and 19:30–23:58 (night). Each time window should be represented by its peak characteristics, i.e., the amplitude and duration of peak values. The burst identification methodology proposed by [22] was selected to identify peak periods. This simple yet effective method captures the essence of a peak period and standardizes the definition of peaks. The identification of bursts points in a time series, as defined in [22], is given in Appendix A. The intensity of peak periods within each time interval was calculated as the integral over all bursts.
2.2. The Last Evaluation Step—Cluster-Based Analysis
After verifying that the synthetic dataset sufficiently captures the overall characteristics of the entire dataset as a single entity, it is essential to focus on specific sub-groups. Transport-related time series often include small yet significant sub-groups that exhibit distinct patterns differing from the norm. For instance, in bus passenger count data, one might, sometimes, identify a minority class of “weak” days, even when there are no obvious causes, such as holidays or severe weather conditions. Proper representation of these minority classes in the synthetic dataset is a key indicator of the Diversity of the generated data. To address this, the Detection of Outlier Time Series (DOTS) algorithm [23] was selected to cluster the real dataset. This algorithm forms the foundation for the fifth and final evaluation step, as illustrated in Figure 4.
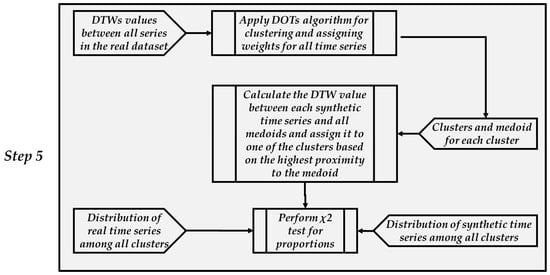
Figure 4.
Fifth step in the sequential process of evaluating the quality of synthetic data.
The implementation of the fifth step commences with applying the DOTS algorithm to the dataset of the real time series. It is a weighting clustering algorithm for which the determination of the optimal solution is guided by two measures, entropy and Dynamic Time Warping (DTW). The weighting component is intended for outlier detection, which is beyond the scope of this study as the focus here is on the clustering aspect. However, Appendix B provides an example of the algorithm’s capability to identify outlier time series within transport-related datasets, allowing their exclusion from further analysis. Equations (2)–(5) depict the objective function and constraints of the model [23].
S.T.
where
is the ith time series of the entire dataset;
n is the number of time series;
k is the number of clusters;
G is an n x k matrix and is a binary variable. If time series is assigned to cluster , then , otherwise ;
is a set of k time series representing the medoids of the k clusters;
is a set of n weights for all time series.
The regularization term is used to control the weight dispersion.
DTW was employed to calculate the distances within and between clusters. The k clusters generated by the DOTS algorithm, along with their medoids and the proportion of time series in each cluster, form the basis for identifying major and minor classes in the real dataset. To evaluate whether these classes are adequately represented in the synthetic dataset, each synthetic time series was assigned to the cluster whose medoid was closest in terms of DTW-based proximity. Subsequently, a χ2 test for proportions was performed to compare the distribution of real time series across the clusters with that of the synthetic time series. If no significant differences are observed, it can be concluded that the synthetic dataset effectively represents the characteristics of the real dataset, not only at a low resolution for the entire dataset, but also at the level of distinct classes within the data.
3. Results
This section presents the results of the evaluation process described in Section 2, applied to two real datasets: one representing vehicle speeds along an urban link and the other capturing passenger counts on an intercity bus line. To maximize the likelihood of obtaining high-quality synthetic data, the datasets were carefully selected as follows:
Speed Dataset: This dataset: this dataset consisted of 122 daily time series recorded from January 2023 to December 2023. The speed data were sourced from Bluetooth detectors installed at the entry and exit points of an urban link. These detectors, owned and operated by the municipality of Haifa, were validated upon installation to ensure the accurate measurement of vehicle speeds along the link. The data were continuously monitored to maintain reliability. Each time series corresponded to mid-week days (Monday to Wednesday) and included 540 data points, each representing a 2 min interval between 6:00 a.m. and 11:59 p.m.
Passenger Counts Dataset: Thiscounts dataset: this dataset comprised 298 daily time series recorded from January 2022 to December 2023. The data were sourced from a government open data website and were derived from smart card usage across all public transportation vehicles nationwide. Similarly to the speed dataset, these series represented mid-week days and consisted of 18 data points each, reflecting hourly passenger counts for bus line 274, which operates between Rehovot and Tel Aviv.
The synthetic data were generated using DoppelGANger [24], a technique specifically designed for generating time series data. Its implementation was carried out using the gretel_synthetics Python library.
3.1. Evaluating the Quality of Synthetic Data Based on the Entire Dataset
To calculate the Hellinger Distance (HD) between the entire real and synthetic datasets (Steps 1 and 2), the speed and passenger count values in both datasets were grouped into bins of 5 km/h and 50 passengers, respectively. The resulting value was 0.08 for both vehicle speeds and passenger counts. This low value suggests a strong similarity, requiring no additional benchmark for validation. Increasing the resolution to analyze each hour of the day separately (Step 2) required the introduction of a 10-fold sampling of the real data as a benchmark (Figure 5). Comparing the HD between real and synthetic data (blue line) with the average HD of the 10-fold samples (orange line) revealed that the HD for the synthetic data was lower than the benchmark for most hours. The sole exception occurred at 6:00 a.m., where the HD for the synthetic data aligned closely with the highest HD observed in the 10-fold samples. This phenomenon was consistently observed at 6:00 a.m. in both datasets. Additionally, Figure 5 highlights that the absolute HD values were significantly lower for the speed dataset than for passenger counts, indicating greater variability in the values constituting the passenger counts dataset compared to speed values.

Figure 5.
(a) HD for speed values, (b) HD for passenger count values.
To further support the suitability of HD as a metric for comparing the distributions of real and synthetic data, two additional performance indicators (PIs) were calculated: Pearson Correlation Coefficient (PCC) and Kullback–Leibler Divergence (KL). While these metrics have certain limitations compared to HD, i.e., PCC focuses solely on linear correlations and KL is asymmetric [17], they are still useful for validating the HD results.
PCC was computed for the hourly average speed values of the real and synthetic data, as well as for the passenger count data, using Equation (7):
where represents the average real speed or average real passenger count for the ith hour of the day and denotes the average synthetic speed or average synthetic passenger count for the same hour. The input values used for the calculation are provided in Table 1, and the resulting Pearson Correlation Coefficient (PCC) value for both speed and passenger count was 0.99. This exceptionally high value indicates a strong linear correlation between the hourly average values of the real and synthetic data in both case studies. However, it offers little additional value compared to the HD, as it is much less sensitive to the distribution of values.

Table 1.
Average hourly values of real and synthetic speed and passenger counts for computing PCC.
Next, the Kullback–Leibler Divergence (KL) between values in the real and synthetic datasets was computed. Given two approximations to density functions, each represented by bins, and , the Kullback–Leibler (KL) divergence of from is defined as:
where and are proportions of values in the ith bin in distributions and , respectively.
Similar to the HD metric, the specific range of values obtained from the KL calculation that can be interpreted as “sufficiently similar” is context dependent. Therefore, in this case, the comparison with the 10-fold sampling of the real dataset (Figure 3) was also utilized. The KL divergence for comparing the distributions of all speed values in the synthetic dataset to those in the real dataset was 0.03, while, for passenger count, it was 0.05. Both values are very low, indicating that the synthetic datasets closely resemble the real ones, aligning with the similar results observed using the HD PI. In Figure 6, where the KL values are shown for each hour of the day, the same patterns seen with the HD metric are evident. The alignment between the synthetic data distribution and the real data is lower than the average 10-fold results within the real dataset, and the diversity in passenger count values exceeds the diversity in speed values.

Figure 6.
(a) KL for speed values, (b) KL for passenger count values.
After establishing sufficient similarity between the overall distributions of the values in the real and synthetic datasets, Steps 3 and 4 focus on analyzing the distribution of distances between pairs of time series. Dynamic Time Warping (DTW) was employed to calculate the distance between each pair of time series, as described in Step 3 of Figure 2. The time window for DTW calculations was selected based on the data resolution and standard practices for handling each type of data. For the speed dataset, a 30 min window before and after each time point was applied, aligning with the common practice of using a 1 h analysis resolution in traffic engineering tasks, such as vehicle counts and traffic signal scheduling. For the passenger count data, a 1 h window before and after each time point was used, reflecting the 1 h resolution of the available passenger count data.
Although DTW is widely used for measuring similarities between time series, its critical role in the proposed methodology warranted further validation to ensure its reliability in capturing similarities specific to transport-related time series. To this end, three traffic experts assessed comparative similarities between pairs of time series, and their evaluations were compared with the quantitative DTW results. The details of this process and its findings are presented in Appendix C.
Following the calculation of DTW values for each pair of time series, the values were grouped into bins of 200 units for both the real and synthetic datasets, forming the respective DTW distributions. These distributions served as the basis for calculating HD, using the same method applied to the raw speed and passenger count values in Steps 1 and 2.
The results, presented in Figure 7, highlight several key observations. First, the average and maximum DTW values among the real data indicate a greater diversity within the speed time series compared to the passenger count time series, contrary to the earlier findings based solely on the value distributions. Furthermore, the HD between the real and synthetic datasets reflects sufficient quality for both datasets, as it falls within the range established by the HD values derived from the 10-fold subsamples of the real data.
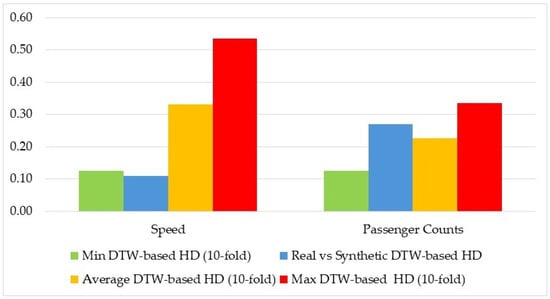
Figure 7.
HD of the distribution of DTW values.
As with the distribution of all values, the distributions of DTW-based similarities between each pair of time series were evaluated using the KL metric to validate the results obtained with the HD PI. The results, shown in Figure 8, reveal trends identical to those in Figure 7. In addition to confirming that the distribution of the DTW-based similarities among the synthetic time series aligned with that of the real time series, the relationships between the synthetic–real comparisons and the 10-fold comparisons also remained consistent. For the speed datasets, the synthetic–real similarity was very close to the minimum value observed in the 10-fold comparisons when using both the HD and the KL metric. For the passenger count, the synthetic–real comparison more closely resembled the average 10-fold comparison, a phenomenon consistent across both the HD and the KL metric.
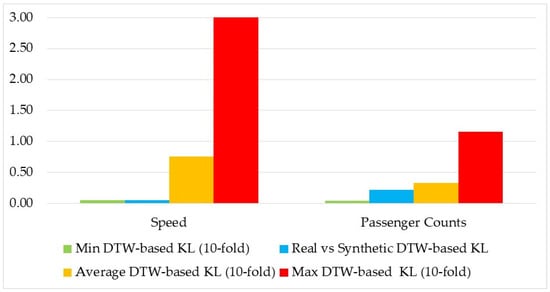
Figure 8.
KL of the distribution of the DTW values.
In Step 4, the calculated CS values between pairs of time series were grouped into bins of 0.05 units for both the real and the synthetic datasets and served as the distributions to which HD was applied. The results of the HD calculated using the CS values are presented in Figure 9. Similarly to the findings based on the DTW values, the CS-based HD between the real and the synthetic datasets indicates sufficient similarity. Likewise, as observed with the DTW results, the diversity within the real speed time series was greater than the diversity within the real passenger count time series. Once again, the KL measure was computed in the same manner as the HD metric, and the results presented in Figure 10 further support the findings illustrated in Figure 9.
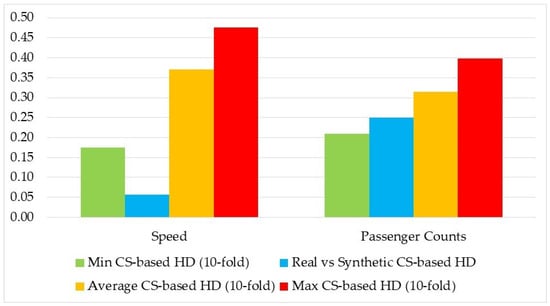
Figure 9.
HD of the distribution of CS values.
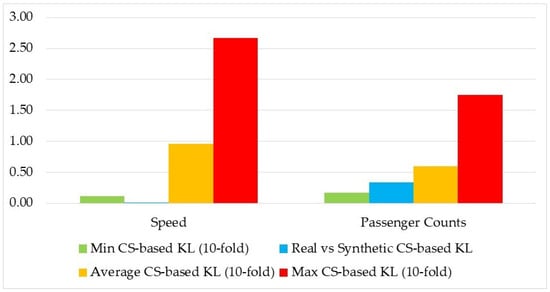
Figure 10.
KL of the distribution of CS values.
3.2. Cluster-Based Evaluation of the Synthetic Data—Selecting the Clusters Within the Real Dataset
The results of applying the DOTS algorithm to each dataset are shown in Figure 11. Determining the optimal number of clusters for evaluating alignment between the real and the synthetic data involves qualitative considerations. On one hand, increasing the number of clusters enhances the representation of diversity in the real data. On the other hand, too many clusters might result in over-segmentation, where minor variations in normal volatility are treated as distinct clusters.
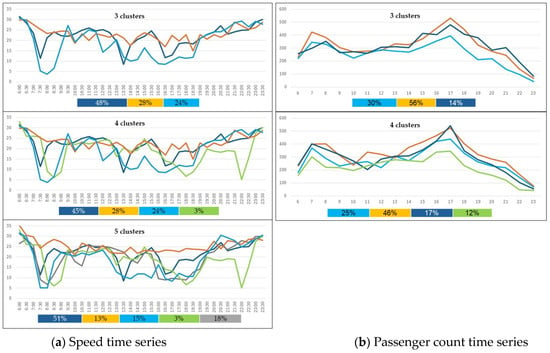
Figure 11.
The time series of the medoids of the various clusters and (in the legend) the percentage of the real time series associated with each cluster by the color.
For both datasets, the algorithm was initially run with k = 2 clusters (where k represents the number of clusters), but this configuration was found to be suboptimal. For the speed dataset, results are presented for k = 3, k = 4, and k = 5, while, for the passenger count dataset, results are shown for k = 3 and k = 4. To enable comparisons across clustering configurations within the same dataset, consistent colors were assigned to time series with similar patterns across different configurations. However, since the medoid time series were not always identical across configurations, similarly colored time series in different charts may sometimes correspond to the same dates, while, at other times, they may represent different dates with comparable patterns.
A key observation from Figure 11 is that the medoids of the passenger count clusters exhibited a higher similarity with one another compared to those of the speed clusters. This aligns with earlier findings from the DTW distributions shown in Figure 7 which indicated greater diversity within the speed dataset than the passenger count dataset.
Focusing on the speed dataset clusters (Figure 11a), the three-cluster division reflects three distinct daily patterns. The transition from three clusters to four clusters added a small cluster, marked in light green and accounting for only 3% of the time series, which was characterized by a peak in the late evening hours. This small cluster alone does not justify favoring four clusters over three. To further refine the analysis, the algorithm was applied with k = 5 clusters. The five-cluster solution revealed an additional cluster, marked in grey, which captured a unique pattern. This new cluster resembled the morning peak pattern of the light blue cluster (whose share decreased from 24% to 15%) and the non-peak midday behavior of the orange cluster (whose share decreased from 28% to 13%). Given that this new grey cluster exhibited meaningful diversity from the other clusters and that the remaining clusters (excluding the negligible light green cluster) maintained a substantial representation (at least 13%), it is concluded that the five-cluster solution is the most appropriate for the speed dataset.
For the passenger count time series (Figure 11b), the choice between three and four clusters was less clear-cut. Unlike the speed time series, all passenger count clusters were represented by medoids with two peaks, differing primarily in amplitude. In the three-cluster solution, the dark blue time series exhibited slightly lower passenger counts during the morning and evening peaks compared to the orange time series. The light blue time series reflected lower passenger counts in the afternoon and evening relative to the other two clusters.
In the four-cluster configuration, the light green medoid represented 12% of the time series, characterized by relatively low passenger counts throughout the day. However, this additional cluster resulted in three other clusters that were highly similar. Given the lack of a definitive preference between three and four clusters, both configurations were assessed for their ability to capture the diversity of the entire dataset in the synthetic time series.
3.3. Cluster-Based Evaluation of the Synthetic Data—Comparing Proportions Across Clusters
To assess how well the synthetic dataset represented each cluster identified in the real dataset, each synthetic time series was assigned to a real cluster based on its similarity with the cluster medoid, as given in Equations (8) and (9).
where
k is the number of clusters in which the real time series were divided;
is a binary variable. If the synthetic time series is assigned to cluster , then , otherwise ;
is a set of k time series representing the medoids of the k clusters.
After assigning the synthetic time series to the clusters, a χ2 test for proportions was conducted. Figure 12 illustrates the comparison of cluster proportions between the real and synthetic datasets, with the χ2 test results displayed in the top-right corner of each chart.
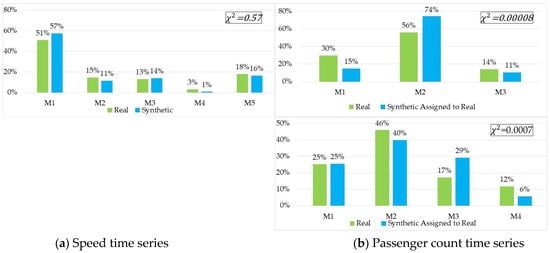
Figure 12.
Proportions of real and synthetic data in each cluster.
As anticipated, the statistical results align with the qualitative observations. For the speed time series, Figure 12a shows that the proportions of real and synthetic data closely matched, with the χ2 test confirming the existence of no significant differences. In contrast, for the passenger count time series, Figure 12b reveals clear discrepancies in the distribution of time series across clusters between the real and the synthetic datasets. This inconsistency is evident for both the three-cluster and the four-cluster configurations, with the χ2 test indicating significant differences in both cases. Consequently, it can be concluded that the synthetic dataset effectively captures the diversity within the speed time series sub-groups. However, the passenger count synthetic dataset falls short in adequately representing the distinct patterns present in the real dataset clusters.
4. Discussion and Further Research
This study introduces a sequential methodology for evaluating the quality of synthetic transport-related time series datasets, focusing on Fidelity, Distribution Matching, Diversity, Coverage, and Novelty as key aspects of synthetic data quality. Once accounted for Novelty by ensuring that none of the synthetic time series is identical to any of the real ones, the methodology combines distributional measures, i.e., Hellinger Distance (HD), with time-series-specific similarity metrics, namely Dynamic Time Warping (DTW) and Cosine Similarity (CS) that account for Fidelity. This integration allows for a comprehensive quality assessment while accounting for the unique characteristics of transport-related time series. Additionally, the clustering-based evaluation identifies and ensures the representation of less common patterns, i.e., minority classes, within the synthetic dataset, thus addressing the aspects of Diversity and Coverage.
The methodology is applied to two case studies—vehicle speeds and passenger counts. The synthetic speed dataset aligns well with the real data in terms of diversity and temporal patterns, whereas the passenger count dataset demonstrates significant shortcomings, failing to represent key variations within clusters. These findings highlight the methodology’s effectiveness in distinguishing between high-quality and suboptimal synthetic datasets. Moreover, the sequential design of the evaluation process provides deeper insights, exposing gaps in similarity that extend beyond basic distributional alignment.
Three key phenomena emerge from implementing the evaluation process on the case studies. First, the average and maximum Hellinger Distance (HD) and Kullback–Leibler (KL) values, calculated from the overall distributions of speeds and passenger counts within the real datasets (using 10-fold sampling), indicate a greater diversity in passenger count values compared to speed values (Figure 5 and Figure 6). In contrast, the opposite trend is observed when HD and KL are computed based on DTW distances between time series in the real dataset (Figure 7 and Figure 8), where the average and maximum HD and KL values are higher for speeds than for passenger counts. Although it might seem like a discrepancy, a closer look at the specific attributes of the passenger counts and of the speed values reveals the explanation for this phenomenon. Looking at the overall sample of passenger counts and speeds (regardless of the time point at which they occur), the speed values are more closely tight (coefficient of variation = 0.33) compared to passenger counts (coefficient of variation = 0.4). However, the medoids of the various clusters (Figure 11) reveal temporal stability in peak periods across the passenger count time series, while the peak periods in the speed time series exhibit multiple patterns. More specifically, with regard to passenger counts, the phenomenon is very apparent in the three-cluster division in Figure 11b. The three medoids express the morning peak at 7:00 or 8:00, while the afternoon peak occurs at 17:00. At the same time, looking at the medoids of the three-cluster division of the speed time series in Figure 11a, it is apparent that the orange medoid represents a group of time series that practically have no peaks along the day, the dark blue medoid represents a group of time series taken from days in which three distinct and relatively mild peak periods occur (one in the morning, one at noon, and one in the afternoon) and a third group, represented by the light blue medoid, for which the morning peak period is major and an additional peak period continues from noon along all hours until late afternoon.
Second, it might be intuitively expected that the relatively low diversity in the passenger count time series would facilitate the generation of a high-quality synthetic dataset. However, the results show the opposite: the higher diversity in the speed dataset is better reflected in its synthetic counterpart. Notably, the speed time series not only exhibits more versatile patterns compared to the passenger count time series, but also has a time scale with twice as many data points. This suggests that the synthetic data generation algorithm, DoppelGANger in this study, may perform more effectively with heterogeneous and highly variable real data, as the distinctions between sub-groups in the real data are more pronounced.
Last but not least, the clustering process requires human intervention and qualitative judgment. As demonstrated in the speed dataset case study, halting the clustering process when an added small and insignificant cluster appears is not always sufficient. In some cases, further increasing the number of clusters can uncover additional minority classes that warrant attention. While fully automating data-driven processes is not always feasible, it is important to note that this is the only step in the proposed evaluation process that relies on human judgment. Efforts should be directed toward identifying an appropriate automated technique to replace this manual intervention.
To conclude, this work provides a robust framework for assessing synthetic datasets, contributing to the advancement of synthetic data applications in transportation. By enabling the identification of both satisfactory and suboptimal datasets and revealing deeper layers of similarity or disparity, the proposed methodology supports more accurate forecasting, planning, and decision making for sustainable mobility systems.
The field of quality assessment for transport-related synthetic time series is still in its early stages, leaving many open questions and areas for exploration [14,15]. Four research directions emerge as prominent topics requiring further investigation.
The first consists of expanding the proposed methodology, which is suited for univariate time series, to account for multivariate time series as well. Time series reflecting traveling behavior in terms of demand or frequency of use are occasionally accompanied by additional features such as week day, weather-related data, etc. An evaluation methodology should consider the ability of the synthetic data to account for these features and the nature of relationships between them. As seen in the univariate case handled in this study, various techniques already exist; however, defining those that are most appropriate for transport-related time series is required.
The second issue concerns the relationship between PIs used to evaluate synthetic datasets and their practical utility. Specifically, which PIs are most strongly correlated with the synthetic dataset’s ability to enhance predictive or classification tasks (or other use cases of the real dataset)? A closely related question is what threshold values of these PIs are sufficient to ensure that the synthetic data provide meaningful added value for such tasks, such as improving prediction or classification outcomes. As transport-related time series often address demand for a transportation mode, a typical case study might explore the relationship between the degree of similarities between the distributions of the real and synthetic datasets, based on the HD values or a parallel statistical metric, and the reliability of the demand prediction.
The third issue pertains to improving synthetic datasets when specific deficiencies are identified. One potential approach involves leveraging the inherent randomness in synthetic data generation to regenerate or enrich the dataset iteratively. Another direction could involve refining the Generative Adversarial Network (GAN) algorithm used, particularly by tuning its hyperparameters, such as the batch size, learning rate, etc. However, in some cases, the limitations of the real dataset—such as insufficient representation of specific aspects of diversity—may hinder the generation of high-quality synthetic data. In such scenarios, the only viable solution may be to gather additional real data, if feasible.
Lastly, as research in transport-related synthetic time series progresses, we can expect to see its potential realized for specific transportation sub-domains. For instance, path following and trajectory tracking are critical for autonomous vehicles [25], and a significant challenge in this field is the limited availability of real-world datasets [26]. Given that autonomous vehicle and pedestrian trajectories are essentially time series, this sub-domain can greatly benefit from advances in the field of synthetic time series.
Funding
The generous financial support of the Israel Ministry of Innovation, Science and Technology is gratefully acknowledged.
Data Availability Statement
The data presented in this study are available on request from the corresponding author.
Conflicts of Interest
The author declares that they have no known competing financial interests or personal relationships that could have appeared to influence the work reported in this paper.
Appendix A. Identification of Burst Points in a Time Series [22]
Identification of burst points in a time series is based on the following steps:
- Calculate a set of Moving Averages, , of length for sequence .
- Set a cutoff value = .
- Define Bursts Points as | > cutoff}.
In this study, k was set to 1 for both datasets. For the speed time series, w was set to 8 (equivalent to a 15 min window, ensuring high sensitivity to short peak periods), while, for the passenger count time series, w was set to 1 (the smallest window permitted by the data resolution).
Appendix B. Demonstration of the DOTS Algorithm’s Capability to Identify Outlier Time Series Within a Dataset of Transport-Related Time Series
To demonstrate that the DOTS algorithm is a valid tool for identifying outliers in transport-related time series, eight fake time series were added to the 122 real speed-based time series in a similar manner to the one employed in [23].
Figure A1a displays four of the eight fake time series with a linear pattern, while Figure A1b shows the remaining four fake time series, each characterized by a single peak occurring during the day. The DOTS algorithm [23] was applied using five clusters, with the relatively high number of clusters intended to allow the algorithm to assign exceptional time series (but not outliers) to dedicated clusters.

Figure A1.
(a) Fake linear time series, (b) fake single-peak time series.
The weights assigned to the eight fake time series were exceptionally low compared to all 122 real time series, as clearly illustrated in Figure A2. This highlights the algorithm’s ability to identify highly extreme time series that should be excluded from the dataset.
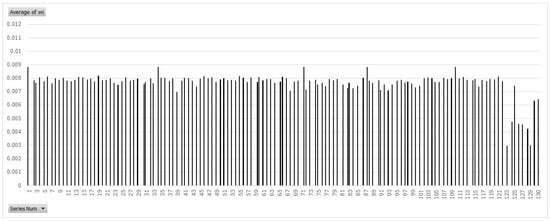
Figure A2.
Weights assigned to 130 time series by the DOT algorithm, including eight fake time series presented at the rightmost side of the chart.
Appendix C. Validation of DTW as a PI for Comparing a Pair of Transport-Related Time Series
To assess the ability of DTW to reliably reflect the similarities between two time series, parallel to the subjective perception of traffic experts, the following test was performed.
Step 1: a time series from the Speed Dataset (refer to Section 3 Results for database details), recorded on 13 November 2023, was selected as the base time series. This time series, representing a typical daily temporal speed pattern, is shown in Figure A3.
Step 2: an additional set of 24 time series, each corresponding to a different day, was extracted from the Speed Dataset. These time series exhibited DTW values with the base time series ranging from a minimum of 900 to a maximum of 3460.
Step 3: seventeen comparison cases were created, with each case consisting of the base time series from Step 1 and two distinct time series selected from the 24 time series extracted in Step 2.
Step 4: three traffic experts were tasked with visually examining the graphs of the time series in each of the 17 cases. For each case, the experts were asked to select the time series, from the two available options, that they deemed to be most similar to the base time series. The actual DTW values were concealed from the experts. All 17 comparison cases are detailed in Table A1.
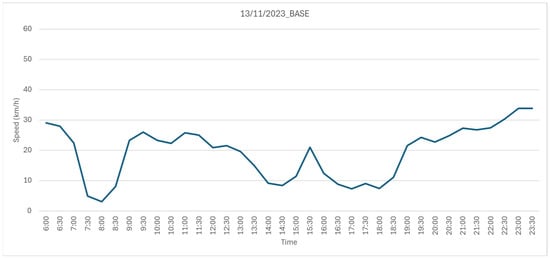
Figure A3.
Base time series.
Step 5: a human expert’s choice in a given case was considered correct if the selected time series had the lowest DTW value within the base time series. The results of the expert selections are summarized in Table A2. The findings reveal that:
- In the vast majority of the cases, each expert correctly identified the time series with the lowest DTW value (14 out of 17 correct replies for one expert and 15 of 17 for the other two).
- In 15 out of 17 cases, at least two of the three experts selected the correct time series.
- Scenario #13 proved challenging to evaluate, with all three experts incorrectly identifying the more similar time series.

Table A1.
Seventeen comparison cases. In each case, the base time series (shown in blue) was compared to two other time series: one displayed in the top chart and the other in the bottom chart. Experts were asked to determine which of the two, the top or the bottom, was more similar to the base time series.
| Case Num | Case |
|---|---|
| 1 | 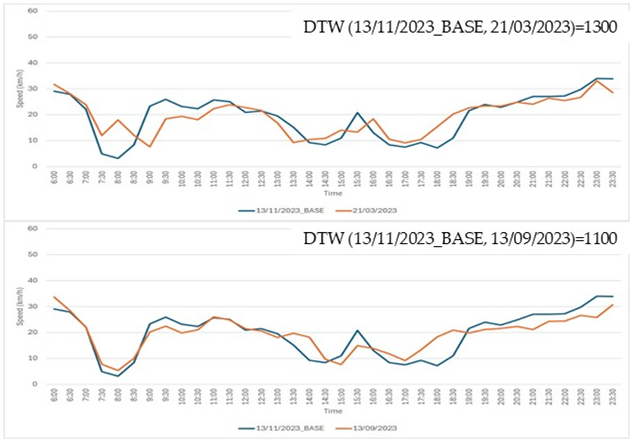 |
| 2 | 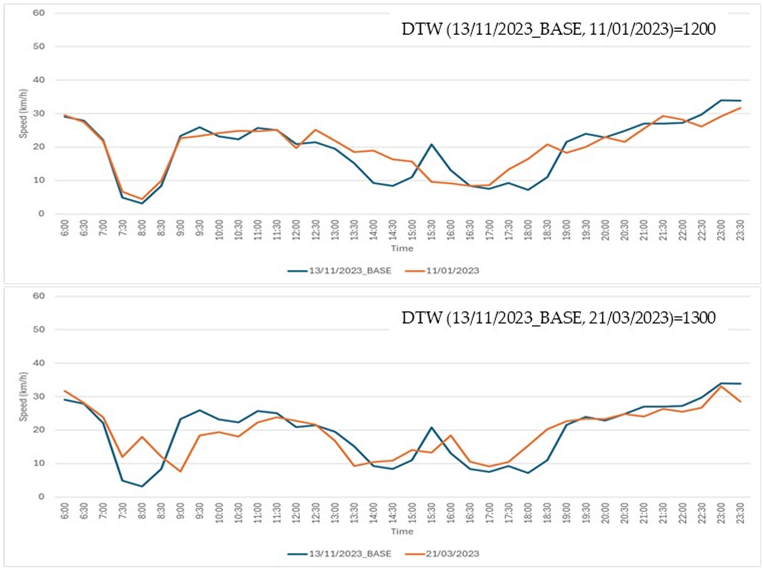 |
| 3 | 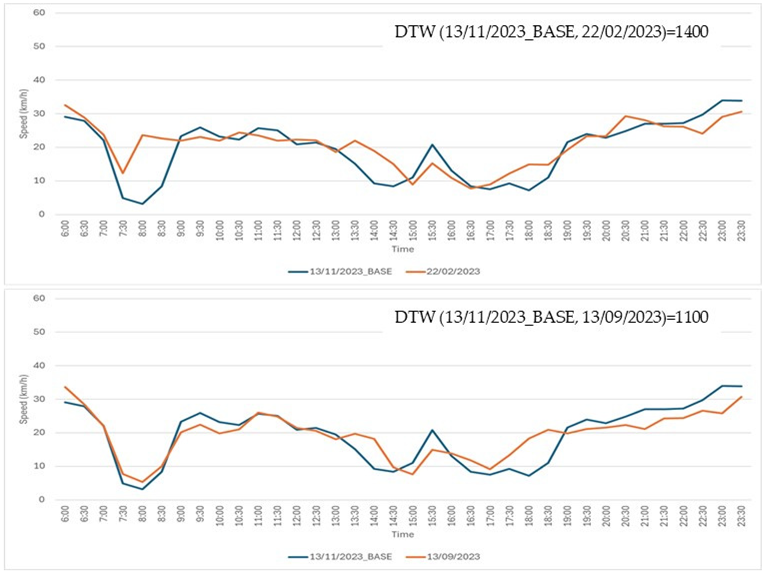 |
| 4 | 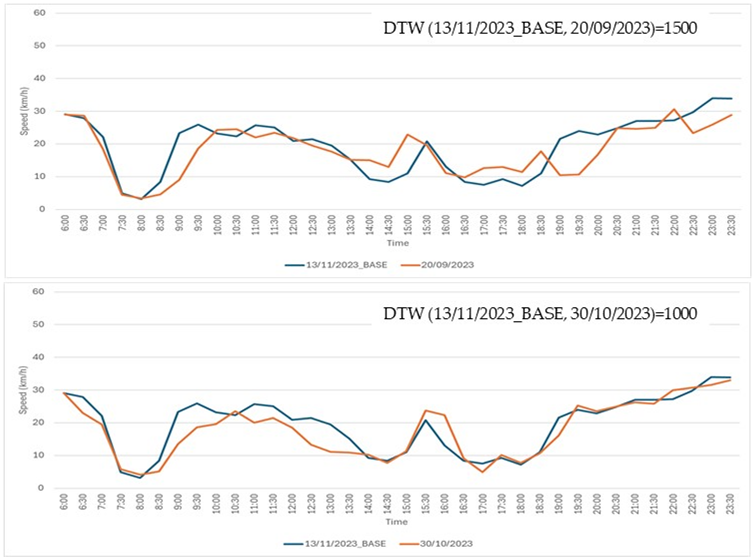 |
| 5 | 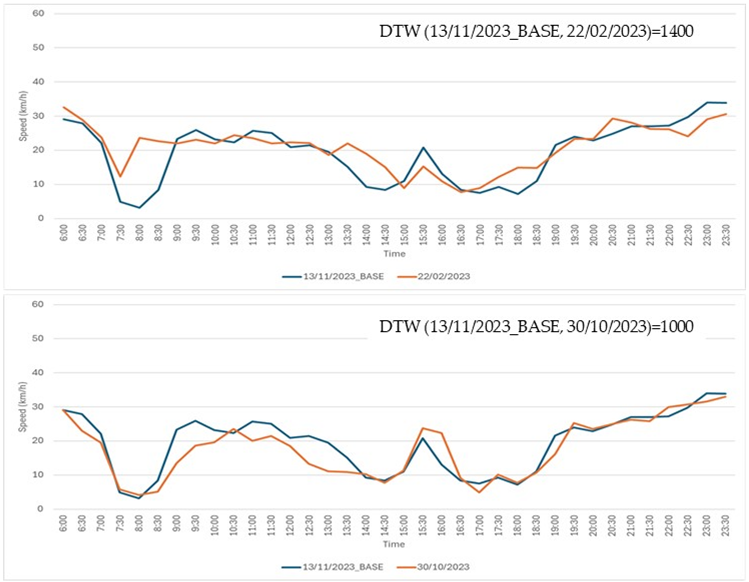 |
| 6 | 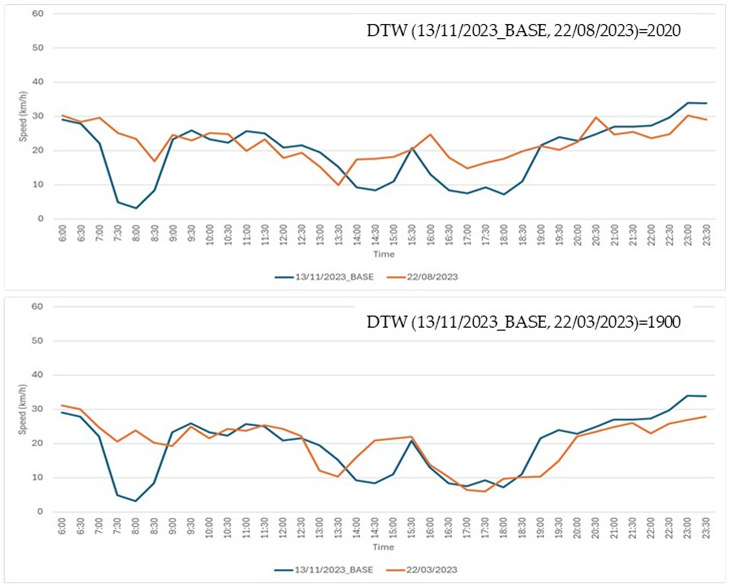 |
| 7 | 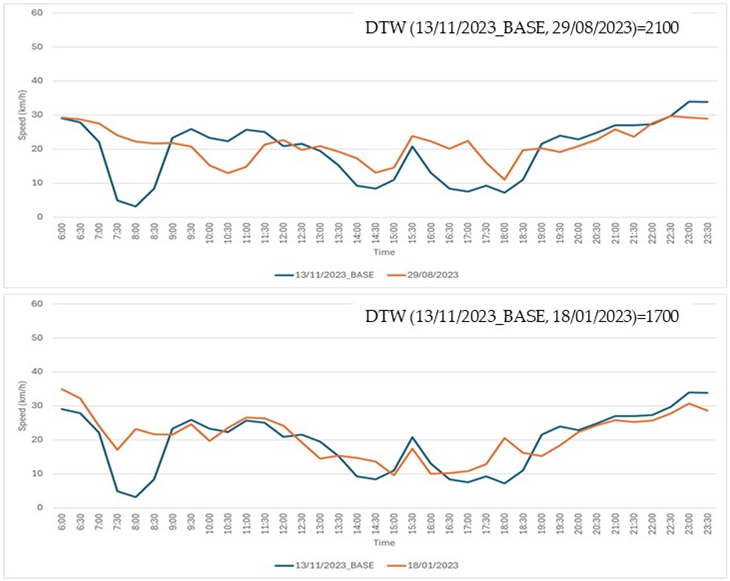 |
| 8 | 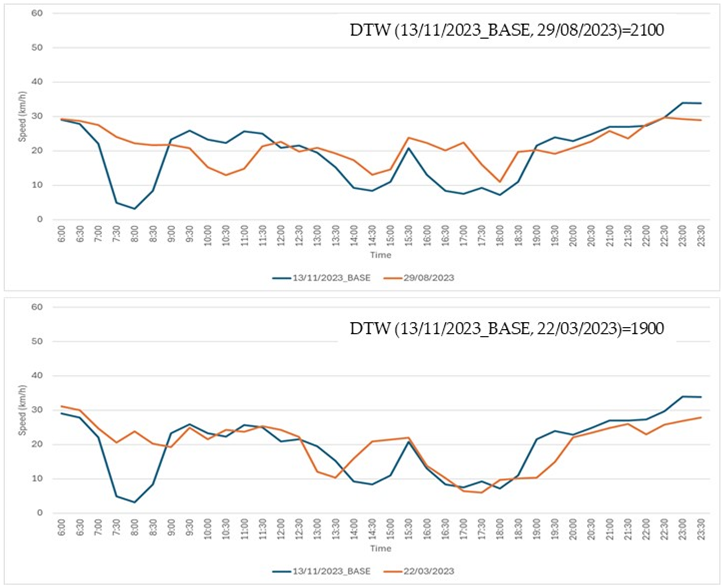 |
| 9 | 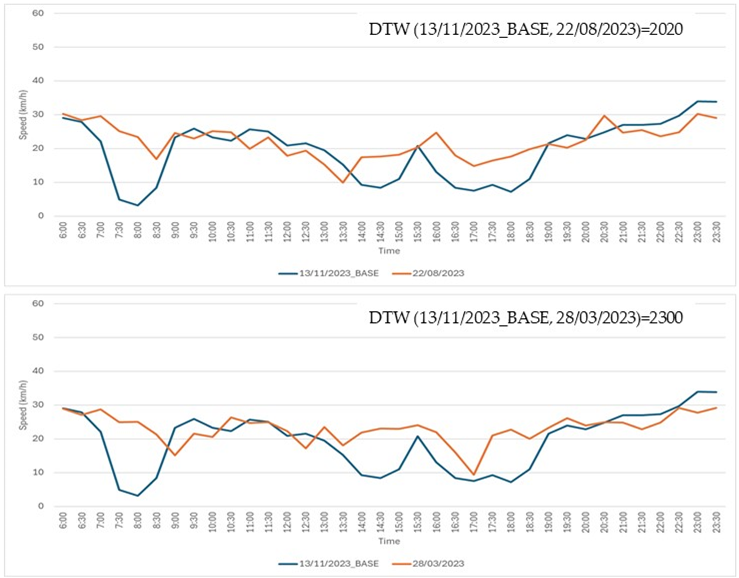 |
| 10 | 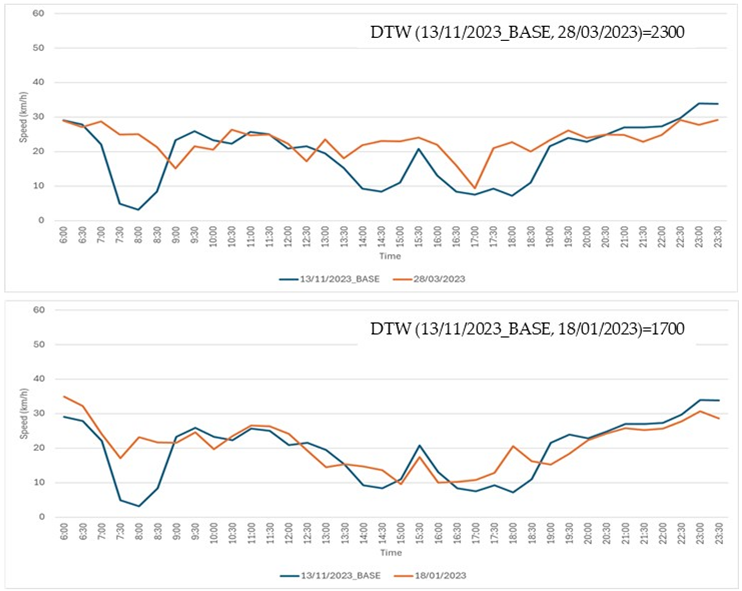 |
| 11 | 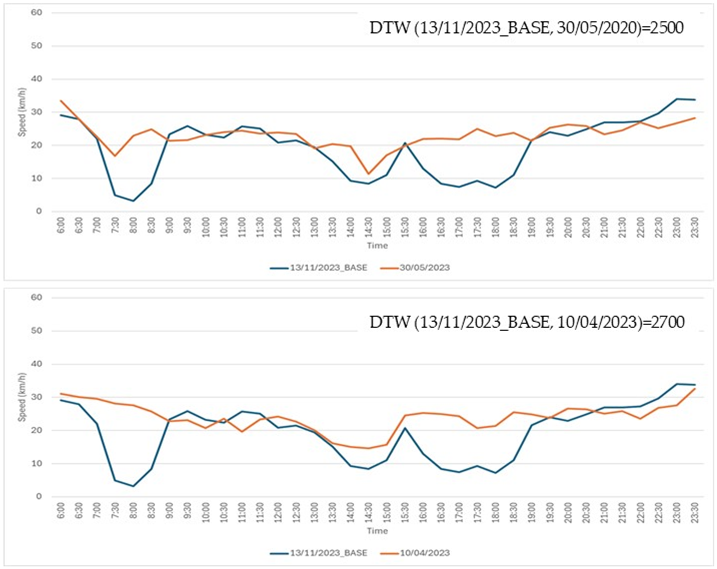 |
| 12 | 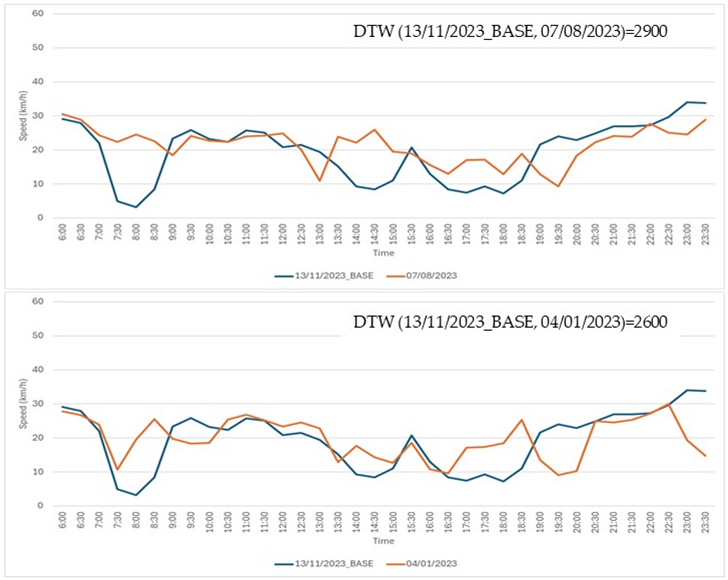 |
| 13 | 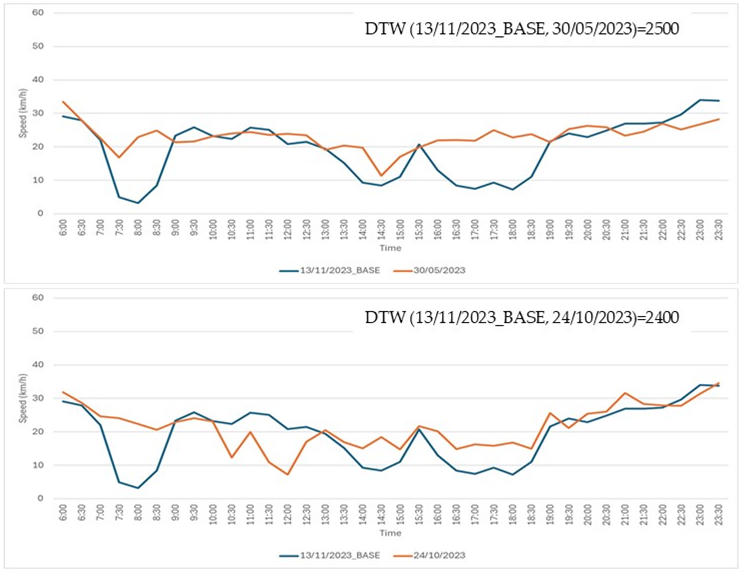 |
| 14 | 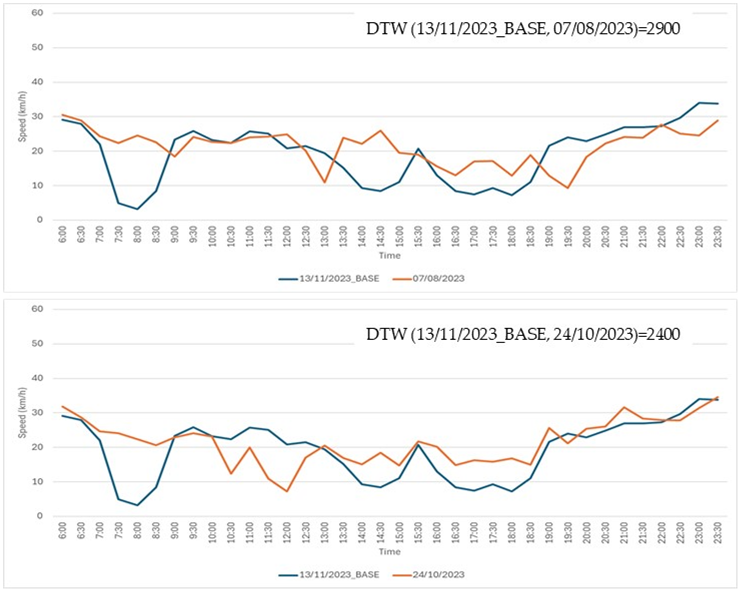 |
| 15 | 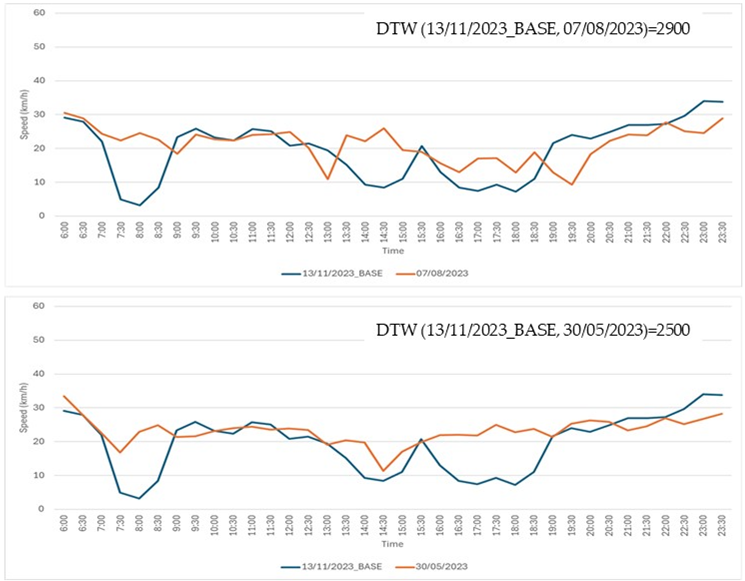 |
| 16 | 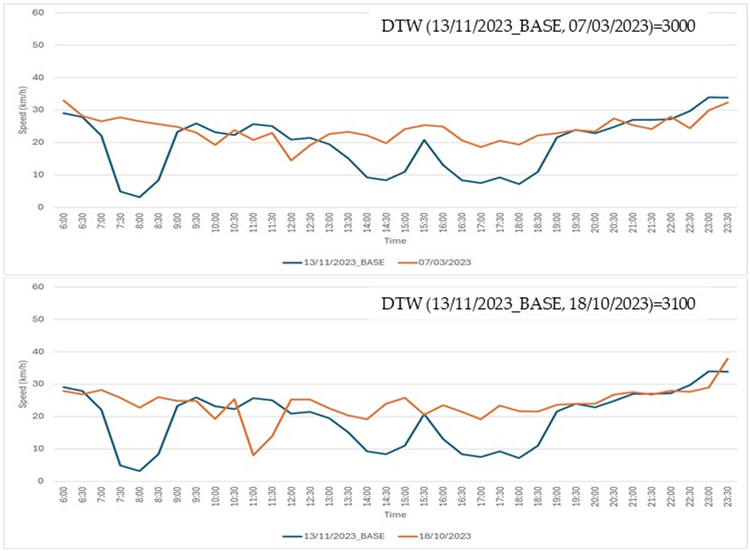 |
| 17 | 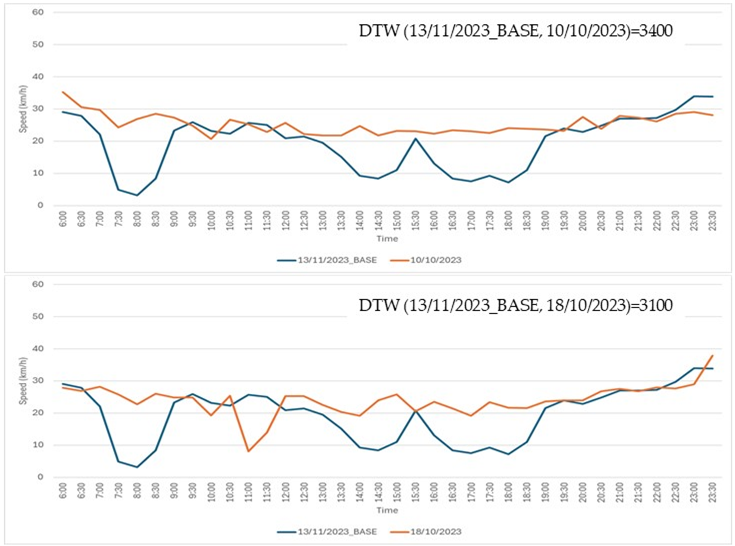 |

Table A2.
Results of human expert choices for each of the seventeen cases.
Table A2.
Results of human expert choices for each of the seventeen cases.
| Case Num | Human Expert 1 | Human Expert 2 | Human Expert 3 | Number of Correct Human Expert Choices |
|---|---|---|---|---|
| 1 | √ | √ | √ | 3 |
| 2 | √ | √ | X | 2 |
| 3 | √ | √ | √ | 3 |
| 4 | √ | √ | √ | 3 |
| 5 | √ | √ | √ | 3 |
| 6 | √ | √ | √ | 3 |
| 7 | √ | √ | √ | 3 |
| 8 | √ | √ | √ | 3 |
| 9 | √ | √ | √ | 3 |
| 10 | √ | √ | √ | 3 |
| 11 | X | √ | X | 1 |
| 12 | √ | √ | √ | 3 |
| 13 | X | X | X | 0 |
| 14 | √ | √ | √ | 3 |
| 15 | √ | √ | √ | 3 |
| 16 | √ | √ | √ | 3 |
| 17 | √ | X | √ | 2 |
| % of correct choices | 88% | 88% | 82% |
References
- Abedi, M.; Hempel, L.; Sadeghi, S.; Kirsten, T. GAN-Based Approaches for Generating Structured Data in the Medical Domain. Appl. Sci. 2022, 12, 7075. [Google Scholar] [CrossRef]
- Strelcenia, E.; Prakoonwit, S. GAN-Based Data Augmentation for Credit Card Fraud Detection. In Proceedings of the 2022 IEEE International Conference on Big Data (Big Data), Osaka, Japan, 17–20 December 2022; pp. 6812–6814. [Google Scholar]
- Dash, A.; Ye, J.; Wang, G. A Review of Generative Adversarial Networks (GANs) and Its Applications in a Wide Variety of Disciplines: From Medical to Remote Sensing. IEEE Access 2024, 12, 18330–18357. [Google Scholar] [CrossRef]
- Nigam, A.; Srivastava, S. Generating Realistic Synthetic Traffic Data Using Conditional Tabular Generative Adversarial Networks for Intelligent Transportation Systems. In Proceedings of the 2023 IEEE 26th International Conference on Intelligent Transportation Systems (ITSC), Bilbao, Spain, 24–28 September 2023; pp. 2881–2886. [Google Scholar]
- Goodfellow, I.; Pouget-Abadie, J.; Mirza, M.; Xu, B.; Warde-Farley, D.; Ozair, S.; Courville, A.; Bengio, Y. Generative adversarial nets. In Proceedings of the Advances in Neural Information Processing Systems 27, Montreal, QC, Canada, 8–13 December 2014. [Google Scholar]
- Eigenschink, P.; Reutterer, T.; Vamosi, S.; Vamosi, R.; Sun, C.; Kalcher, K. Deep Generative Models for Synthetic Data: A Survey. IEEE Access 2023, 11, 47304–47320. [Google Scholar] [CrossRef]
- Arkangil, E.; Yildirimoglu, M.; Kim, J.; Prato, C. A Deep Learning Framework to Generate Synthetic Mobility Data. In Proceedings of the 2023 8th International Conference on Models and Technologies for Intelligent Transportation Systems, MT-ITS 2023, Nice, France, 14–16 June 2023. [Google Scholar]
- Chatterjee, S.; Hazra, D.; Byun, Y.C. GAN-Based Synthetic Time-Series Data Generation for Improving Prediction of Demand for Electric Vehicles. Expert. Syst. Appl. 2025, 264, 125838. [Google Scholar] [CrossRef]
- Albrecht, T.; Keller, R.; Rebholz, D.; Röglinger, M. Fake It till You Make It: Synthetic Data for Emerging Carsharing Programs. Transp. Res. D Transp. Environ. 2024, 127, 104067. [Google Scholar] [CrossRef]
- Nookala, U.; Ding, S.; Alareqi, E.; Vankayala, S. Synthetic Ride-Requests Generation Using WGAN with Location Embeddings. In Proceedings of the 2021 Smart City Symposium Prague, SCSP 2021, Prague, Czech Republic, 27 May 2021. [Google Scholar]
- Jauhri, A.; Stocks, B.; Li, J.H.; Yamada, K.; Shen, J.P. Generating Realistic Ride-Hailing Datasets Using GANs. ACM Trans. Spat. Algorithms Syst. 2020, 6, 18. [Google Scholar] [CrossRef]
- Chatterjee, S.; Byun, Y.C. Generating Time-Series Data Using Generative Adversarial Networks for Mobility Demand Prediction. Comput. Mater. Contin. 2023, 74, 5507–5525. [Google Scholar] [CrossRef]
- Kieu, M.; Meredith, I.B.; Raith, A. Synthetic Generation of Individual Transport Data: The Case of Smart Card. In Proceedings of the International Workshop on Agent-Based Modelling of Urban Systems (ABMUS) 2022, Auckland, New Zealand, 10 May 2022. [Google Scholar]
- Lin, H.; Liu, Y.; Li, S.; Qu, X. How Generative Adversarial Networks Promote the Development of Intelligent Transportation Systems: A Survey. IEEE/CAA J. Autom. Sin. 2023, 10, 1781–1796. [Google Scholar] [CrossRef]
- Stenger, M.; Leppich, R.; Foster, I.; Kounev, S.; Bauer, A. Evaluation Is Key: A Survey on Evaluation Measures for Synthetic Time Series. J. Big Data 2024, 11, 66. [Google Scholar] [CrossRef]
- Gao, N.; Xue, H.; Shao, W.; Zhao, S.; Qin, K.K.; Prabowo, A.; Rahaman, M.S.; Salim, F.D. Generative Adversarial Networks for Spatio-Temporal Data: A Survey. ACM Trans. Intell. Syst. Technol. 2022, 13, 22. [Google Scholar] [CrossRef]
- Stenger, M.; Bauer, A.; Prantl, T.; Leppich, R.; Hudson, N.; Chard, K.; Foster, I.; Kounev, S. Thinking in Categories: A Survey on Assessing the Quality for Time Series Synthesis. J. Data Inf. Qual. 2024, 16, 14. [Google Scholar] [CrossRef]
- Paparrizos, J.; Li, H.; Yang, F.; Wu, K.; d’Hondt, J.E.; Papapetrou, O. A Survey on Time-Series Distance Measures. arXiv 2024, arXiv:2412.20574. [Google Scholar]
- Dankar, F.K.; Ibrahim, M.K.; Ismail, L. A Multi-Dimensional Evaluation of Synthetic Data Generators. IEEE Access 2022, 10, 11147–11158. [Google Scholar] [CrossRef]
- Lee, C.K.H.; Leung, E.K.H. Spatiotemporal Analysis of Bike-Share Demand Using DTW-Based Clustering and Predictive Analytics. Transp. Res. E Logist. Transp. Rev. 2023, 180, 103361. [Google Scholar] [CrossRef]
- Filipovska, M.; Mahmassani, H.S. Spatio-Temporal Characterization of Stochastic Dynamic Transportation Networks. IEEE Trans. Intell. Transp. Syst. 2023, 24, 9929–9939. [Google Scholar] [CrossRef]
- Vlachos, M.; Meek, C.; Vagena, Z.; Gunopulos, D. Identifying Similarities, Periodicities and Bursts for Online Search Queries. In Proceedings of the 2004 ACM SIGMOD International Conference on Management of Data—SIGMOD’04, Paris, France, 13–18 June 2004. [Google Scholar]
- Benkabou, S.E.; Benabdeslem, K.; Canitia, B. Unsupervised Outlier Detection for Time Series by Entropy and Dynamic Time Warping. Knowl. Inf. Syst. 2018, 54, 463–486. [Google Scholar] [CrossRef]
- Lin, Z.; Jain, A.; Wang, C.; Fanti, G.; Sekar, V. Using GANs for Sharing Networked Time Series Data Challenges, Initial Promise, and Open Questions. In Proceedings of the ACM Internet Measurement Conference, Virtual Event, 27–29 October 2020; pp. 464–483. [Google Scholar]
- Liang, Z.; Wang, Z.; Zhao, J.; Wong, P.K.; Yang, Z.; Ding, Z. Fixed-Time Prescribed Performance Path-Following Control for Autonomous Vehicle With Complete Unknown Parameters. IEEE Trans. Ind. Electron. 2023, 70, 8426–8436. [Google Scholar] [CrossRef]
- Gidado, U.M.; Chiroma, H.; Aljojo, N.; Abubakar, S.; Popoola, S.I.; Al-Garadi, M.A. A Survey on Deep Learning for Steering Angle Prediction in Autonomous Vehicles. IEEE Access 2020, 8, 163797–163817. [Google Scholar] [CrossRef]
Disclaimer/Publisher’s Note: The statements, opinions and data contained in all publications are solely those of the individual author(s) and contributor(s) and not of MDPI and/or the editor(s). MDPI and/or the editor(s) disclaim responsibility for any injury to people or property resulting from any ideas, methods, instructions or products referred to in the content. |
© 2025 by the author. Licensee MDPI, Basel, Switzerland. This article is an open access article distributed under the terms and conditions of the Creative Commons Attribution (CC BY) license (https://creativecommons.org/licenses/by/4.0/).