Article

Research on Energy Efficiency Evaluation System for Rural Houses Based on Improved Mask R-CNN Network

1
College of Landscape Architecture, Zhejiang A&F University, Hangzhou 311300, China
2
College of Mathematics and Computer Science, Zhejiang A&F University, Hangzhou 311300, China
*
Authors to whom correspondence should be addressed.
These authors contributed equally to this work.
Sustainability 2025, 17(3), 1132; https://doi.org/10.3390/su17031132
Submission received: 2 January 2025 / Revised: 16 January 2025 / Accepted: 27 January 2025 / Published: 30 January 2025

Abstract

:
This study addresses the issue of energy efficiency evaluation for rural residential buildings and proposes a method for facade recognition based on an improved Mask R-CNN network model. By introducing the Coordinate Attention (CA) mechanism module, the quality of feature extraction and detection accuracy is enhanced. Experimental results demonstrate that this method effectively recognizes and segments windows, doors, and other components on building facades, accurately extracting key information, such as their dimensions and positions. For energy consumption simulation, this study utilized the Ladybug Tool in the Grasshopper plugin, combined with actual collected facade data, to assess and simulate the energy consumption of rural residences. By setting building envelope parameters and air conditioning operating parameters, detailed calculations of energy consumption for different orientations, window-to-wall ratios, and sunshade lengths were performed. The results show that the improved Mask R-CNN network model plays a crucial role in quickly and accurately extracting building parameters, providing reliable data support for energy consumption evaluation. Finally, through case studies, specific energy-saving retrofit suggestions were proposed, offering robust technical support and practical guidance for energy optimization in rural residences.

1. Introduction

1.1. Research Background

According to the China Building Energy Efficiency Report, the total energy consumption throughout the entire lifecycle of buildings nationwide in 2021 was 1.91 billion tons of standard coal equivalent (tce), accounting for 36.3% of the national total energy consumption. Of this, energy consumption during the operational phase of rural residential buildings was 220 million tce, constituting 19% of the total energy consumption during the operational phase of buildings [1]. The building sector is one of the three major areas for energy conservation and emission reduction, and it has a greater potential for energy saving and emission reduction compared to the industrial sector [2]. Buildings in hot summer and cold winter climates face severe energy consumption challenges, especially in rural residences, where energy use accounts for as much as 25%. The climate characteristics and architectural designs in this region render traditional passive energy-saving designs less applicable. Currently, rural houses are mainly self-built, imitating urban residential designs [3], lacking regional characteristics, and failing to meet energy-saving design standards. Thus, optimizing energy-saving designs for rural homes is of significant research value.
In recent years, advances in computer vision and image processing technologies have shown great potential for using image recognition to assess building energy efficiency [4]. By delving into the appearance and structure of buildings, precise data can be obtained, providing a scientific basis for improving the energy efficiency of rural residences. This automated recognition and analysis not only enhance data acquisition efficiency but also support policy formulation and adjustments [5]. Particularly in the identification of building facade components, automation can effectively handle diverse building types and complex lighting conditions, delivering more accurate information to support energy simulation and interior design.
This study aims to develop an energy efficiency assessment system for rural residences based on image recognition technology, promoting sustainable development and intelligent construction in rural buildings and providing innovative solutions for architectural design and energy-saving strategies.

1.2. Literature Review

Since the early 20th century, architecture has continuously evolved, striving to improve design methodologies [6]. Today, computer image recognition is widely applied in intelligent algorithms, and through technological innovations, it has been integrated into fields such as image recognition and digital processing [7]. The intelligent processing technology of computer image recognition is a significant aspect of computer technology applications. It combines intelligent computing technology with modern image recognition and processing techniques, digitizing ordinary images and processing them on computers.
Currently, the difficulty in facade recognition methods and software lies in the diversity of building components and the variability of building shapes. One obstacle is the complexity of building facades, making facade diagrams difficult to parse and components challenging to detect and measure effectively. Consequently, obtaining information on components and dimensions from facade diagrams is difficult [8]. Yin et al. proposed an ALCM recognition method based on BIM systems, achieving an accuracy of 88%, which aids in the automatic conversion of graphics to BIM models [9]. Zhong et al. introduced an improved Mask R-CNN architecture for recognizing window and door elements in post-disaster rural buildings, achieving an average recognition accuracy of 80.6% [10]. Hou et al. improved the accuracy of building classification to 95% by optimizing the Mask R-CNN network, introducing a spatial attention module, and improving the RoiAlign layer [11]. Lu et al. utilized SOLOv2, incorporating BiFPN and SE modules for enhanced feature extraction, achieving an average precision of 93% for window-to-wall ratio (WWR) segmentation [12]. David et al. employed Yolov5 to develop a deep learning strategy for detecting and repairing external wall tiles, achieving an accuracy of 89.4% [13].

1.3. Research Significance and Innovation Points

Current algorithms struggle to comprehensively capture information on the windows, doors, and shading components of building facades. This study aims to extract parameter information from facade images of rural residential buildings. The key components of the research include the following: (1) Annotation and parameterization are carried out using the Labelme tool for annotation, followed by algorithmic models to extract data such as building dimensions, wall area, window area, window-to-wall ratio (WWR), and shading length (SL). (2) Neural network training is applied to rural residential facades, where the system outputs and compares training results in real time. By adjusting network weights and thresholds, performance is optimized through multiple learning iterations, refining the model to closely match the target training values. (3) Automated parameter acquisition replaces traditional manual measurement, which is prone to significant errors and inefficiencies. By leveraging digital intelligence, the system automates energy efficiency calculations, simulating energy consumption and comparing it with a consumption database for assessment. (4) The optimization of retrofit schemes is achieved by generating optimal solutions based on the comparison results, improving the efficiency of energy retrofits, and providing a scientific basis for sustainable building design.
This approach offers an efficient and accurate method for enhancing energy efficiency in rural residential buildings and optimizing retrofit strategies.

2. Materials and Methods

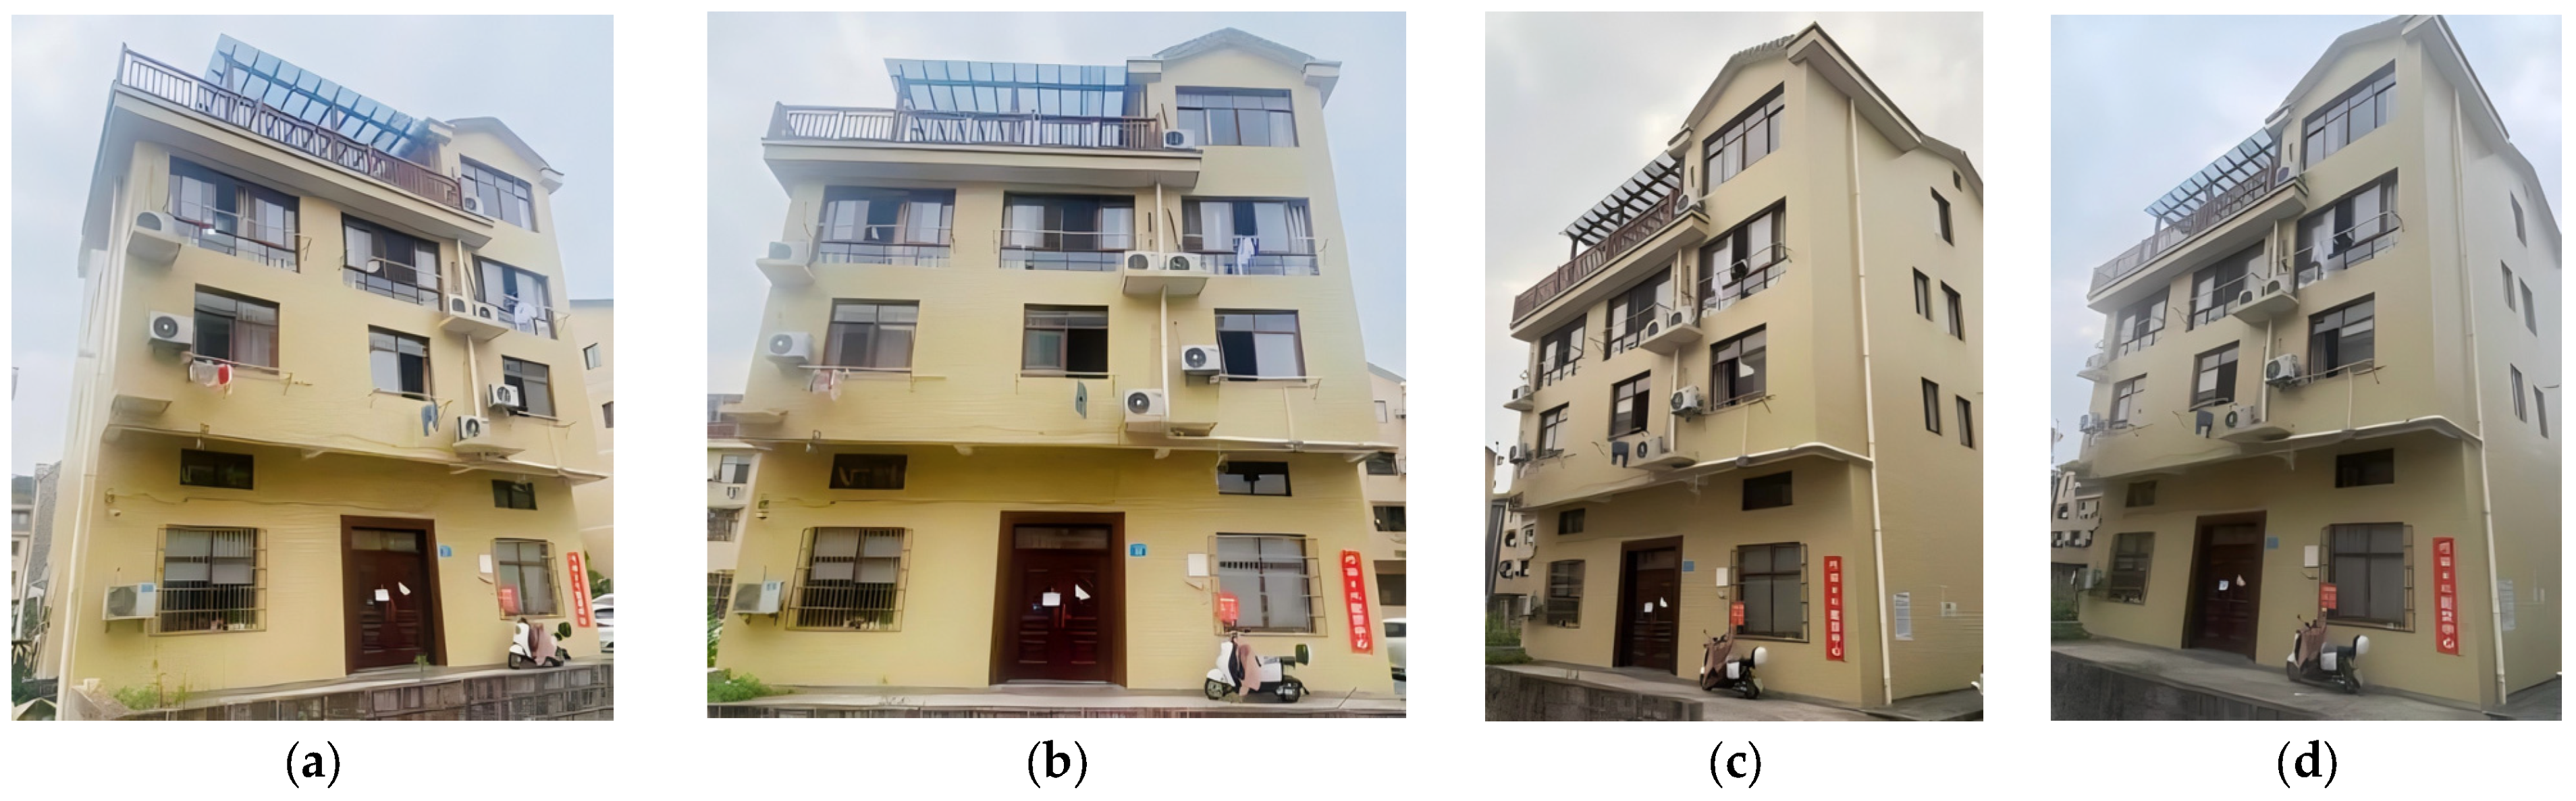
2.1. Identify Sample Data Sets

In this study, all facade images of rural residential buildings were collected from Hangzhou, Zhejiang Province, China. The RGB images of the residential facades were captured using smartphones with 50-megapixel cameras (HUAWEI P40, HUAWEI Ltd., Hangzhou China; iPhone 14, Apple Ltd., Hangzhou China). The distance between the smartphone camera and the building facade was 2–3 m, with a pixel resolution of 3072 × 4096 (3:4). During the image collection process, the facades were photographed from different angles, lighting conditions, and environments [14]. After collecting the images, the data were named based on the building orientation (BO) of the facades. A total of 2000 images were used, with each image showcasing multiple components with different functions. Facade images taken from different angles are shown in Figure 1.

2.2. Simulation Model Data

2.2.1. Construction of Rural Residential Energy Consumption Simulation Model

Building energy consumption simulation models play an important role during the design stage [15]. In this experiment, we assume the experimental residence is located in a village in Hangzhou, China, with a due south orientation at 30° N latitude and 120° E longitude. The dimensions of the residence are assumed to be 14.40 m (length) × 7.00 m (width) × 10.80 m (height), with a layout of three single rooms on the first floor. Energy consumption evaluation is conducted for a single room. To simplify the simulation and prevent differences in the impact of external environmental conditions on rooms in different locations, the middle room on the second floor is selected as the experimental room. The dimensions of the experimental room are 4.80 m (length) × 6.30 m (width) × 3.60 m (height). The geometric model for the simulation is shown in Figure 2.

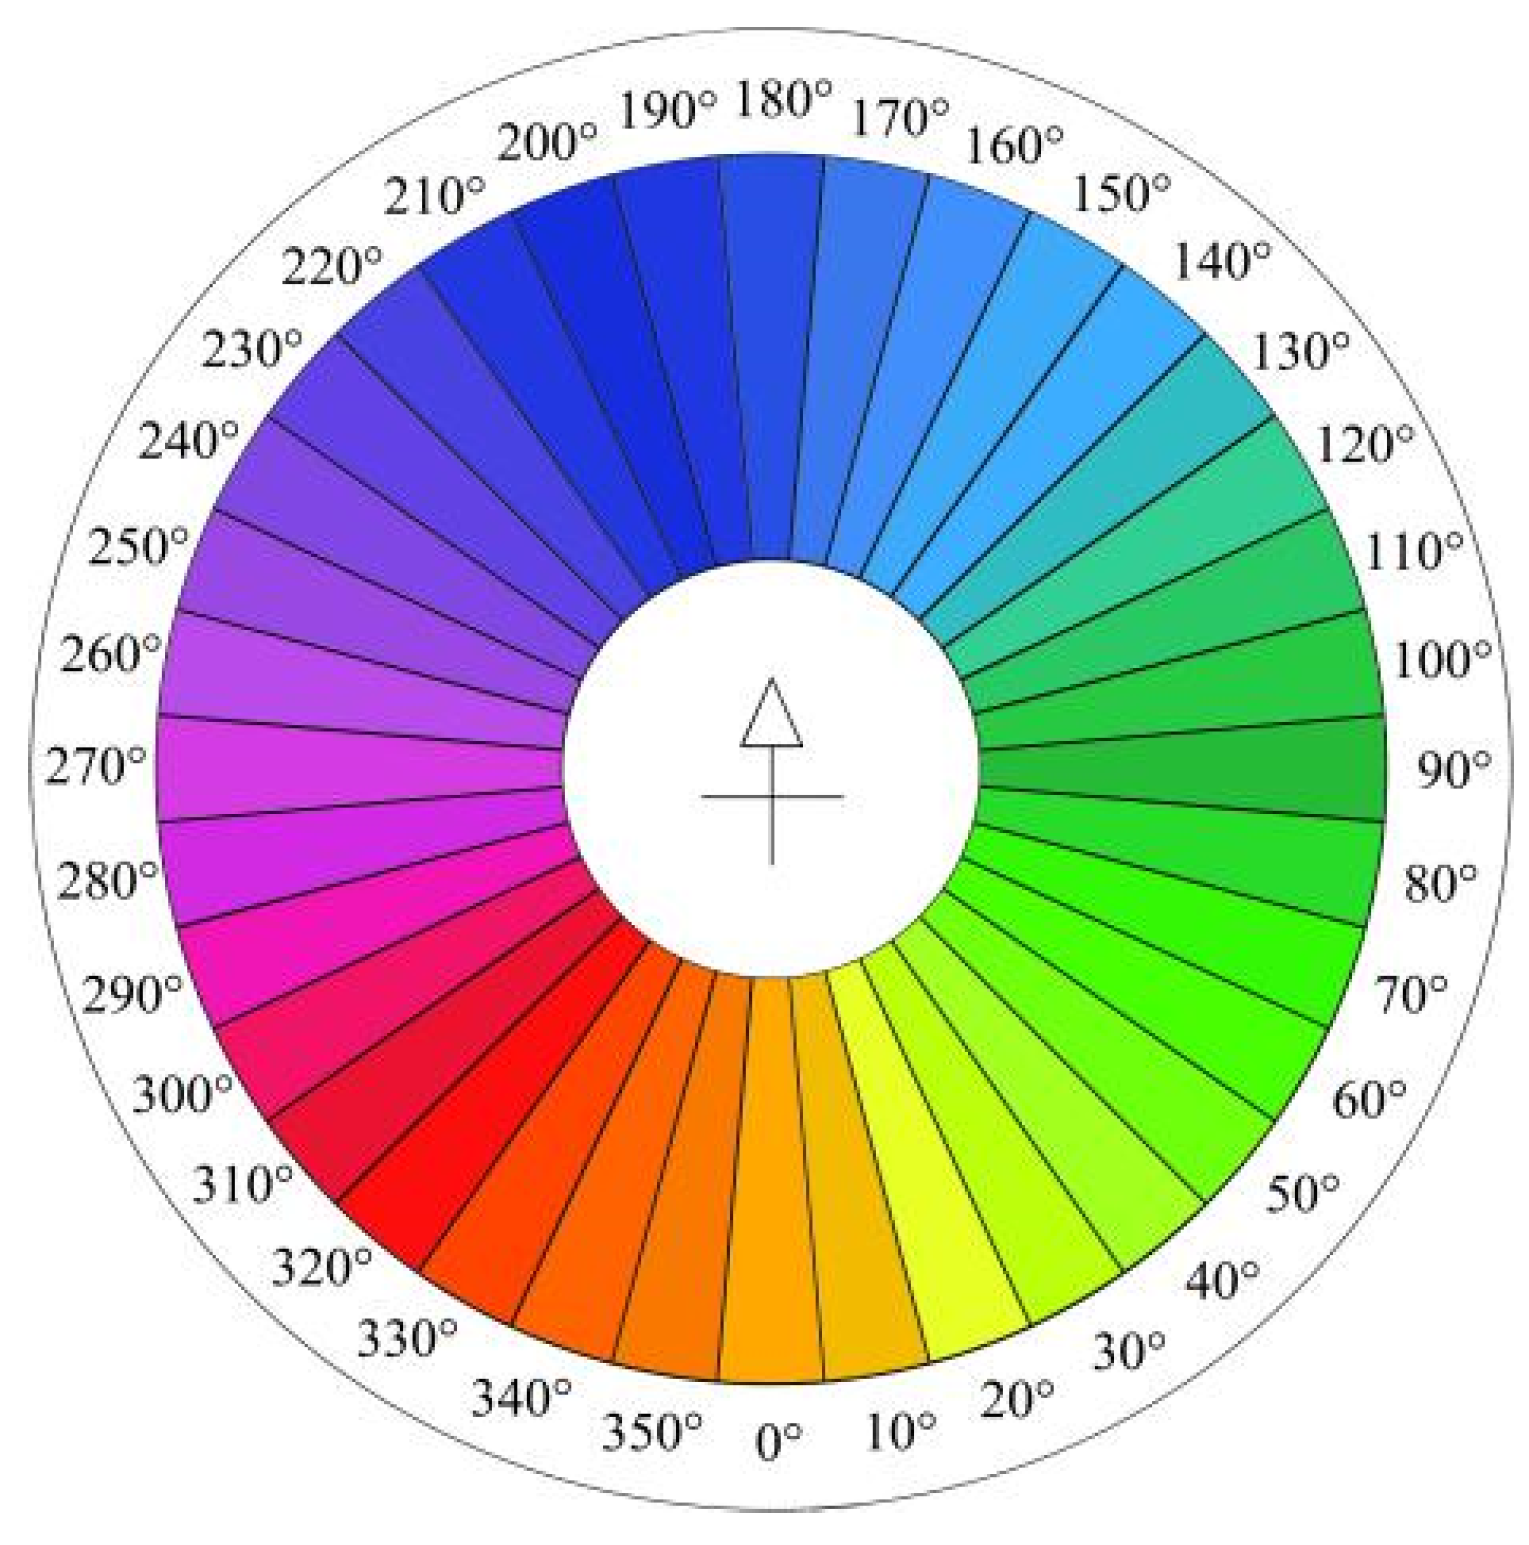
2.2.2. Building Orientation Interval Setting

To study the impact of building orientation on the indoor environment and energy costs in detail, the building model was rotated clockwise in 10° increments, creating a total of 36 orientation intervals (Figure 3). For example, the 0° interval is [355°~5°], the 10° interval is [5°~15°], and so on. To facilitate subsequent statistical analysis, each orientation interval was marked with a different color. To simplify the simulation process, the midpoint value of each orientation interval was selected as the representative parameter in the software.

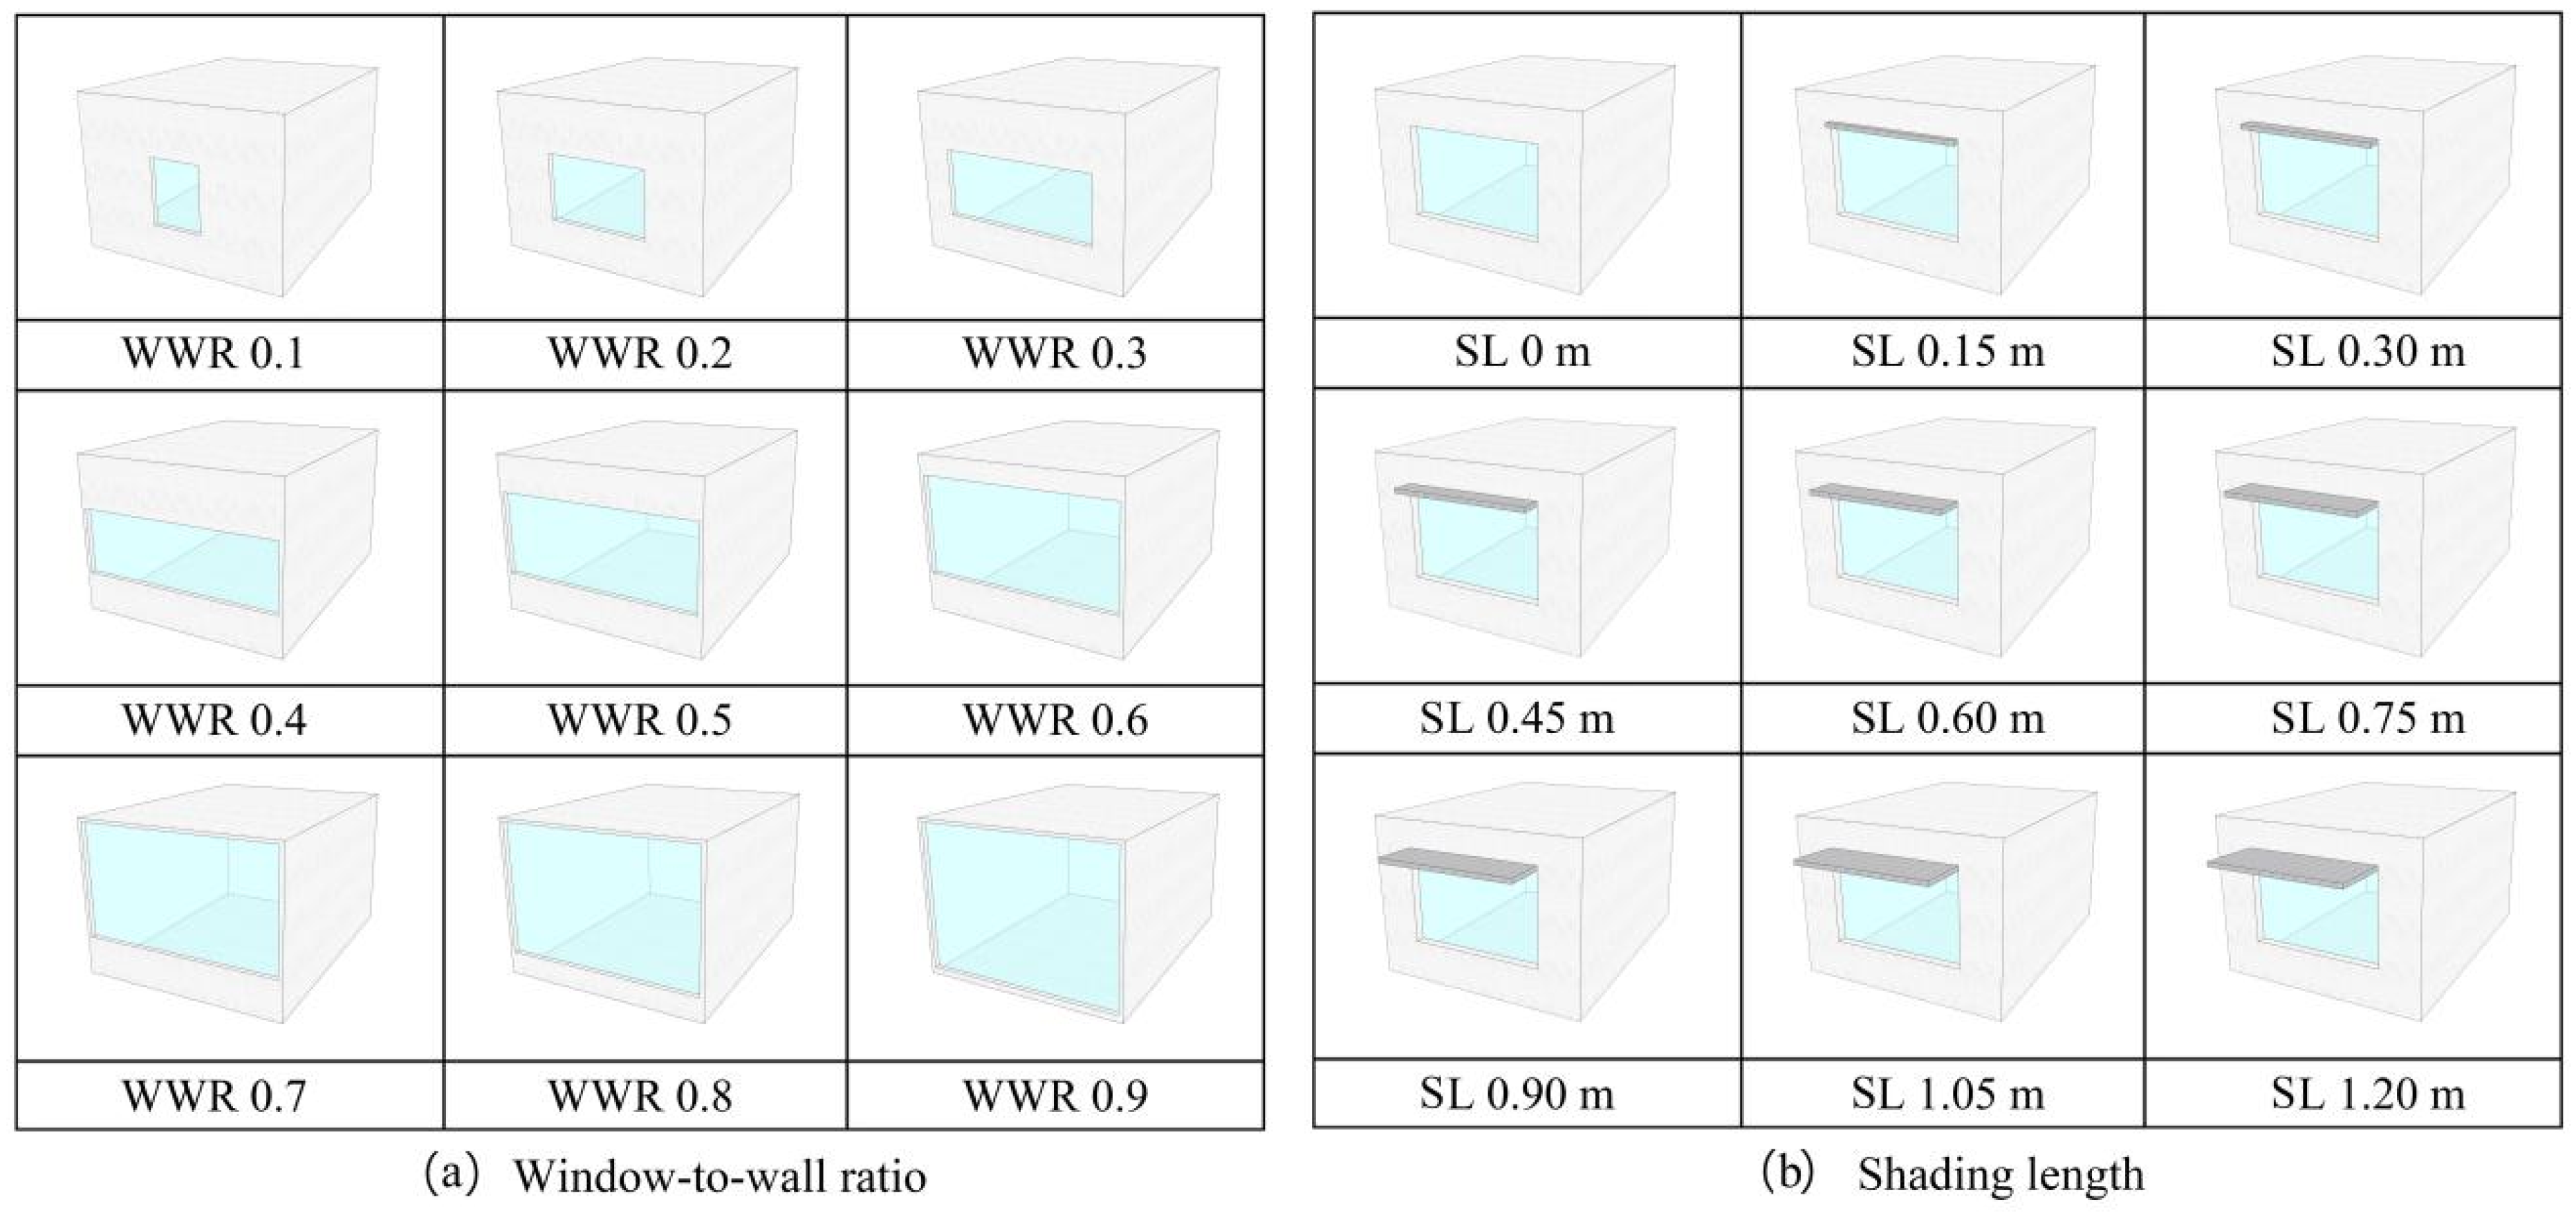
2.2.3. Building Window-to-Wall Ratio Interval Setting

The window-to-wall ratio (WWR) is defined as the ratio of the glass area (Sg) to the facade area (Sf) in Equation (1) or the percentage of the facade area that is covered by glass [16]. Since the indoor thermal environment varies with the WWR, in order to study the impact of different WWRs on the internal environment [17,18], the WWR of the front facade is divided into 10 intervals with increments of 0.1. Excluding the two extreme intervals [0–0.1] and [0.9–1], which are generally not applicable to residential buildings, the WWR range for this study is set from [0.1–0.2] to [0.8–0.9], comprising eight intervals (Figure 4). By extracting the values for each interval, 9 building models corresponding to a fixed orientation are obtained.
WWR = Sg/Sf

2.2.4. Building Visor Length Interval Setting

Exterior shading devices on buildings can prevent direct sunlight from entering indoors, reduce excessive indoor illuminance, make daylighting more uniform, and improve the indoor light environment [19]. They can also block direct sunlight during summer to reduce air conditioning energy consumption and allow more sunlight during winter to reduce heating energy consumption, thereby minimizing the building’s annual energy use. The selection of shading components and the determination of their dimensions are crucial for effective shading [20]. By studying the dimensions of shading components, appropriate shading sizes can be determined, ensuring maximum shading efficiency while minimizing material waste [21].
To study the impact of different shading lengths on the internal environment, a survey summary indicated that the shading lengths for rural residential buildings in Hangzhou range from 0 m to 1.2 m. These shading lengths were divided into 9 parameters with increments of 0.15 m (as shown in Figure 4). When setting horizontal shading outside the window, to meet the requirement of fully shading the window from direct sunlight at specific times, the projection length of the horizontal shading board can be calculated using Equations (2) and (3) [22]:
L = H × cot h × cos(γs,w)
D = H × cot h × sin(γs,w)
L is the projection length of the horizontal shading board (mm); D is the projection length of the side wing (mm); H is the height from the bottom edge of the horizontal board to the windowsill (mm); h is the solar altitude angle (°); γs,w is the difference between the solar azimuth angle and the wall azimuth angle (°), where, γs,w = AsAw; As is the solar azimuth angle (°); Aw is the wall azimuth angle (°), with due south as 0° and clockwise as positive.

2.2.5. Energy Consumption Simulation Platform

The tool used for modeling in this study, Grasshopper 2.0(GH 2.0), is a highly representative parametric design platform. It operates as a visual programming plugin under the Rhino 6 platform, abbreviated as “Rhino”. For this simulation, one of the GH plugins used is the Ladybug Tool 1.5, which is commonly employed for building performance analysis. Comprising Ladybug and Honeybee components, this tool seamlessly integrates with calculation engines such as EnergyPlus 23.2.0, enabling detailed building energy simulations. It covers aspects like thermal loads, cooling loads, ventilation, and lighting, among others, providing precise energy assessments. Ladybug Tool facilitates cross-platform data exchange and automates complex calculations through control logic settings [23]. EnergyPlus offers high flexibility, allowing users to customize building parameters and operational conditions to meet various simulation requirements. It integrates seamlessly with multiple building performance analysis tools and plugins (such as Ladybug and Honeybee), supporting efficient data exchange across platforms and enhancing the effectiveness and efficiency of building performance analysis [24].

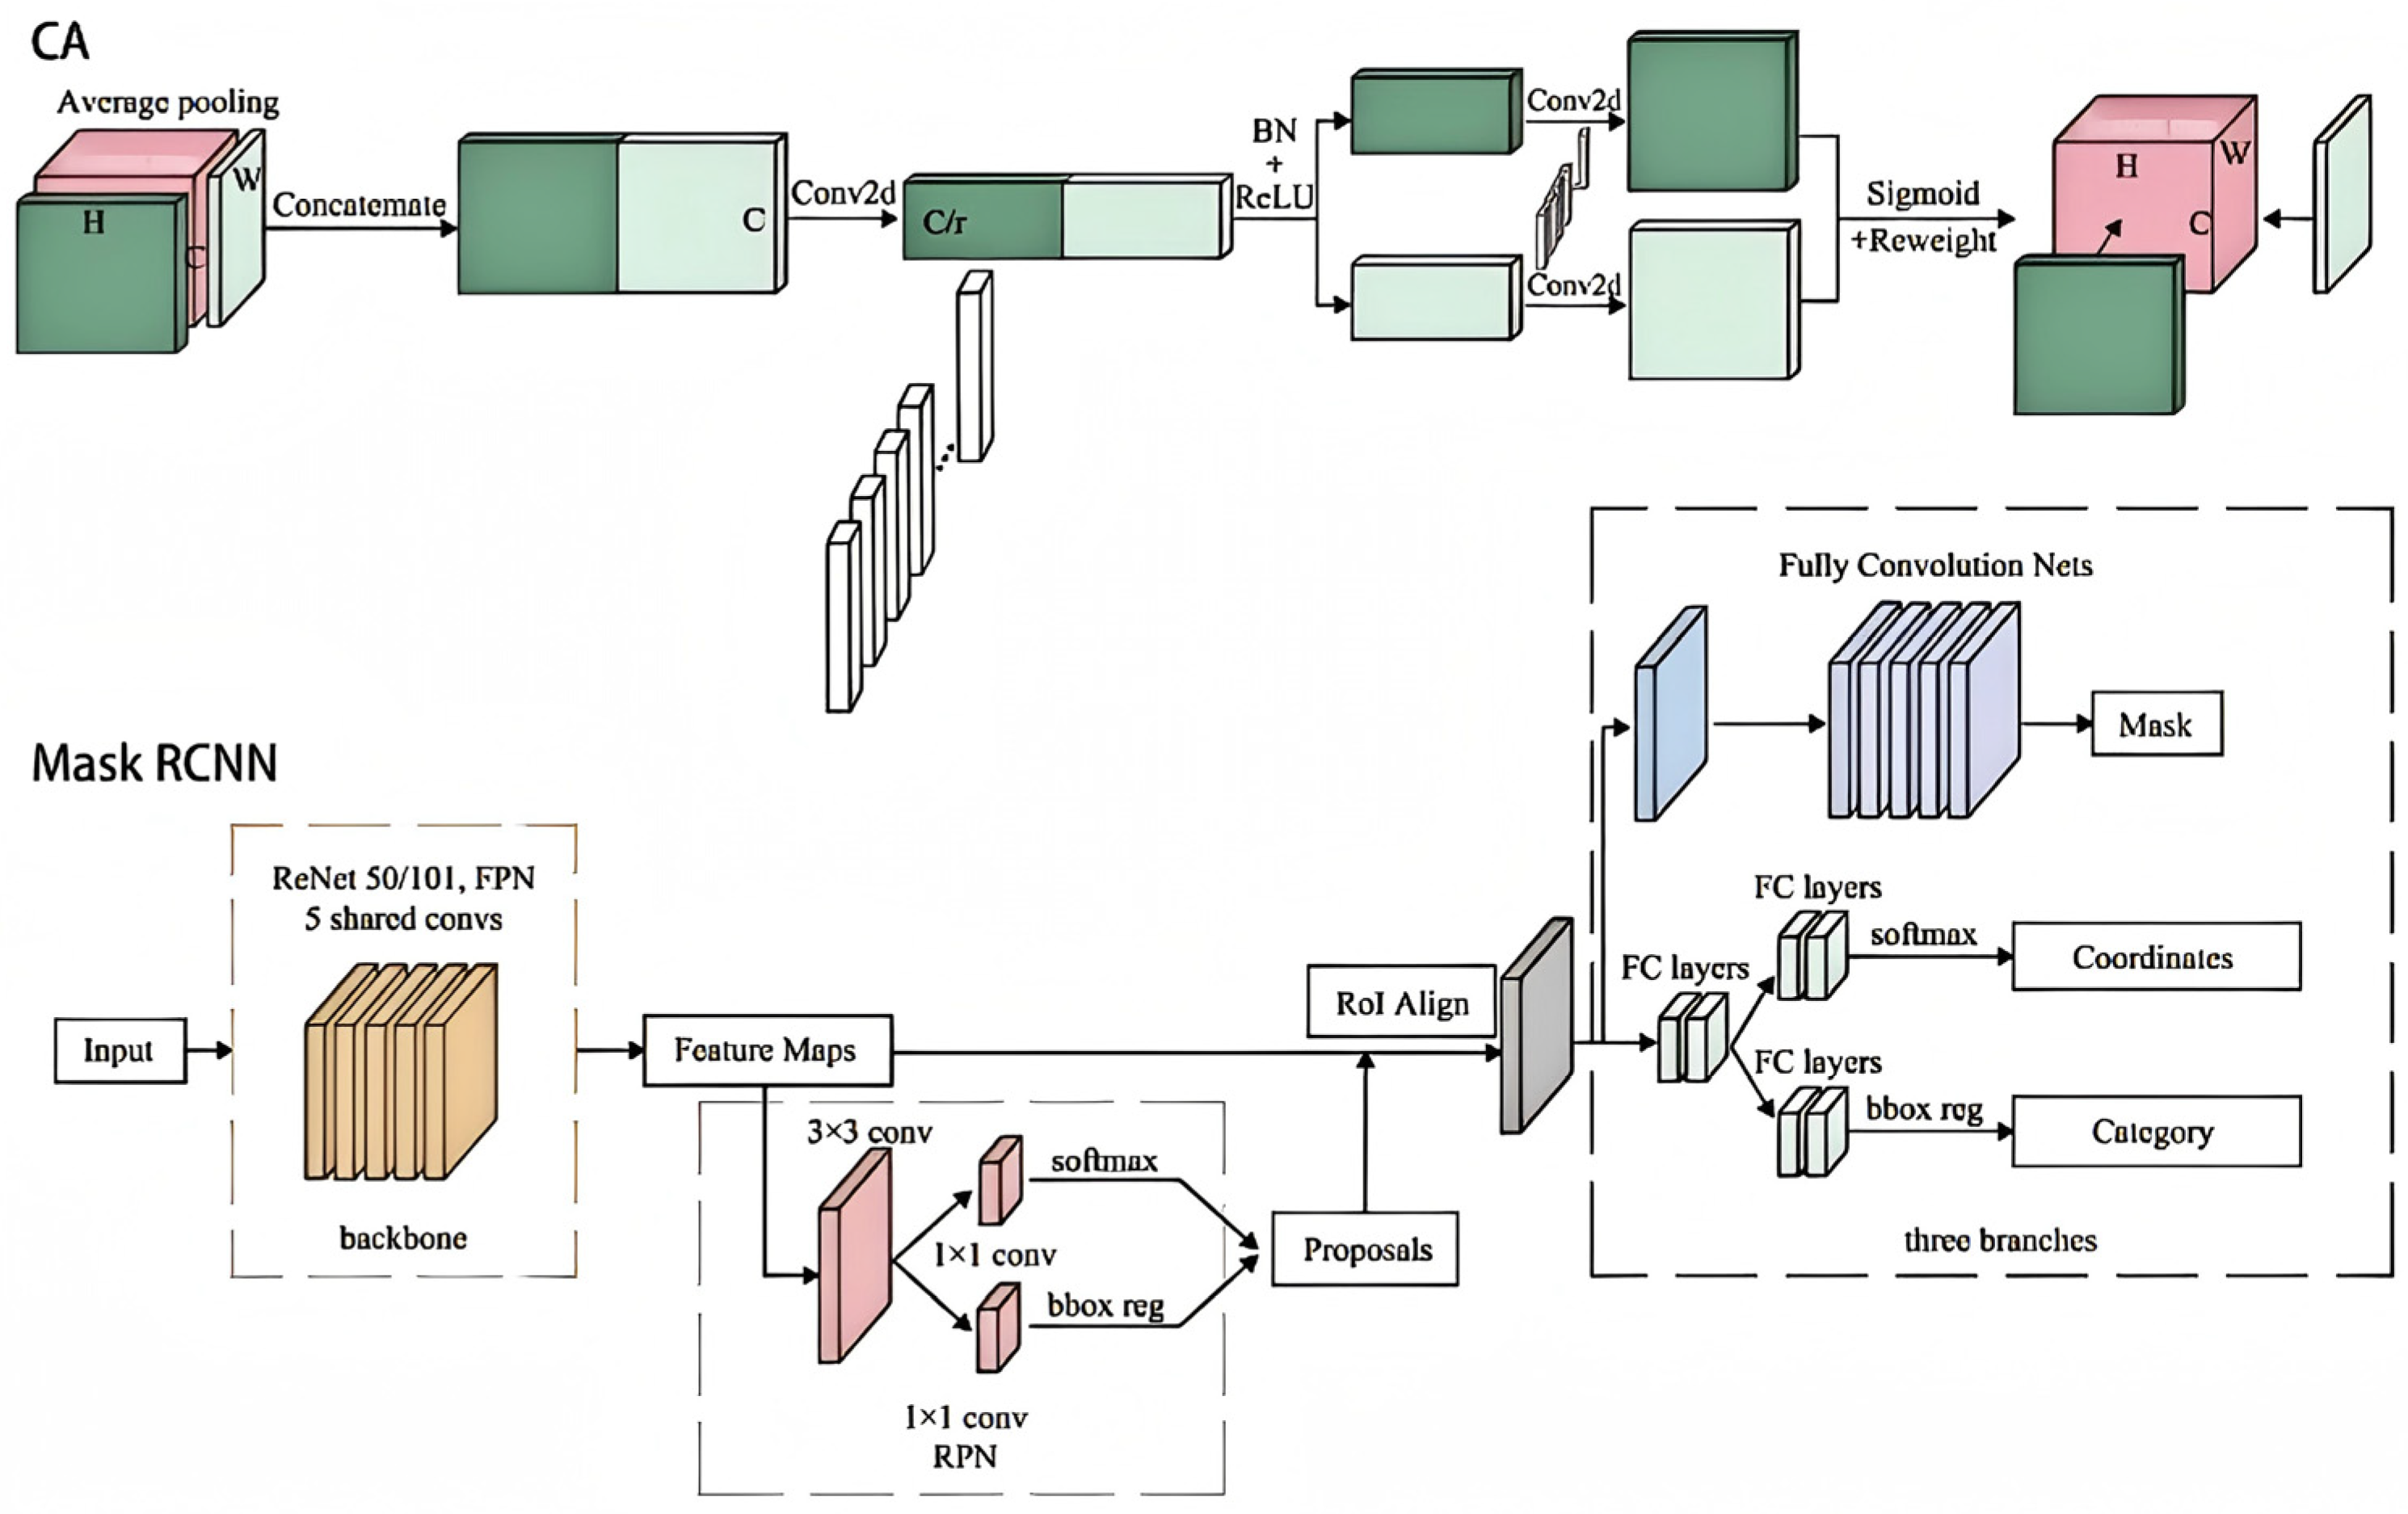
2.3. Mask R-CNN Network Combined with Attention Mechanism Module

2.3.1. Mask R-CNN Network

Mask R-CNN is a multitask algorithm used for object detection and instance segmentation, building upon Faster R-CNN by adding a mask prediction branch. Its main structure includes a backbone network, Feature Pyramid Network (FPN), Region Proposal Network (RPN), RoI Align, classifiers and bounding box regressors, and a mask segmentation module [25]. The network operates in two stages. The first stage extracts feature maps using a deep residual network and generates candidate regions via RPN. The second stage performs RoI Align and uses bilinear interpolation to obtain pixel information from feature maps, ultimately completing tasks such as object classification, bounding box regression, and mask segmentation. The network architecture is illustrated in Figure 5.
In this study, the Mask R-CNN model is used for object detection and instance segmentation of rural residential facade images. This model accurately identifies and segments windows, doors, and shading components in facade images. Initially, ResNet is employed to extract features from facade images, followed by RPN to generate candidate regions. Finally, the mask prediction module segments each candidate region to produce masks for each component. This application not only enhances the precision of detection and segmentation but also provides accurate building parameter data for subsequent energy consumption simulations.

2.3.2. Coordinate Attention (CA)

Coordinate Attention (CA) is an efficient attention mechanism that decomposes two-dimensional global pooling into two parallel one-dimensional feature encoding processes (in the x and y directions), thereby avoiding the loss of positional information [26]. CA first utilizes one-dimensional global pooling to aggregate input features vertically and horizontally, generating two direction-aware feature maps. These feature maps are then encoded into two attention maps, capturing long-range spatial dependencies along the spatial directions [27]. Finally, the attention maps are multiplied with the input feature maps to enhance the representation capability of the feature maps, thereby achieving spatial direction differentiation and generating coordinate-aware features. The structural diagram of CA is depicted in Figure 5.

2.3.3. Improved Mask R-CNN Network Model

By incorporating the CA mechanism module into the ResNet backbone network, we have developed a rural residential facade component detection model. The improved network module structure is illustrated in Figure 6. Building upon Mask R-CNN, this study introduces the CA attention mechanism module, resulting in an enhanced Mask R-CNN network model [27].
Through this enhancement, the model can more effectively extract critical features from facade images, thereby improving detection and segmentation accuracy. In practical applications, the improved model is used for detecting and segmenting various components in rural residential facades, such as windows, doors, and shading elements. This improvement significantly enhances the model’s adaptability to complex scenarios, maintaining efficient recognition and segmentation even under different lighting conditions and viewing angles.
Experimental results demonstrate that the enhanced model exhibits significant advantages in feature extraction and object detection, providing high-quality data support for energy consumption simulation and energy efficiency assessment.
The Coordinate Attention (CA) mechanism focuses on capturing long-range dependencies in spatial features, enabling more precise localization of important areas within the input image. By applying attention to both horizontal and vertical coordinates, the model enhances feature extraction without introducing excessive computational overhead. The structure of CA is depicted in Figure 6 where the attention maps are generated based on the spatial coordinates, allowing for improved object detection accuracy.

2.4. Evaluation Indexes for Model

In this experiment, average precision (AP), mean average precision (mAP), and mAP0.75 are used as the evaluation indicators [28]. AP is defined as the mean of precision under different recall rates, which is the integral of precision over recall and can be expressed as follows.
A P = 0 1 P ( R ) d R
In Equation (4), P is the precision rate, which is defined as the detection accuracy rate of all detected objects, and R is the recall rate, which is defined as the detection accuracy rate of all positive samples. They are expressed, respectively, as follows:
P = T P T P + F P
R = T P T P + F N
In Equations (5) and (6), TP represents the number of correctly identified detections of targets, FP is the number of missed detections and false detections, and FN is the number of objects detected as other kinds of objects.
The index of mAP is the average of AP, n represents the number of target types, and APi is the average accuracy of the ith target. The calculation formula is shown in Equation (7):
m AP = i = 1 n A P i n
The index of mAP0.75 is the average AP value when the Intersection over Union (IoU) threshold is 0.75, n represents the number of target types, AP0.75i is the average precision of the ith target when the IoU threshold is 0.75; its calculation formula is shown in Equation (8):
m A P 0.75 = i = 1 n A P 0.75 i n
Accuracy measures the probability that an algorithm correctly identifies an instance of each class. Accuracy is defined as dividing the number of positive class instances by the total number of instances correctly predicted by the classifier. The expression is shown in Equation (9). The threshold value in this study was set as 0.5 when computing TP and TN values.
Accuracy = T P + T N n

3. Residential Facade Recognition Experiments

3.1. Experimental Environment and Parameter Settings for the Algorithm

The algorithm is based on the mmdetection framework version 2.25.2 and Mask R-CNN, released in September 2022. The system operates on Windows 11, with a 12th Gen Intel (R) Core (TM) i9-12700H processor (Hangzhou, China) and an NVIDIA GeForce RTX 4090 graphics card (Hangzhou, China). PyCharm 2022.2 is used for image processing and data analysis.

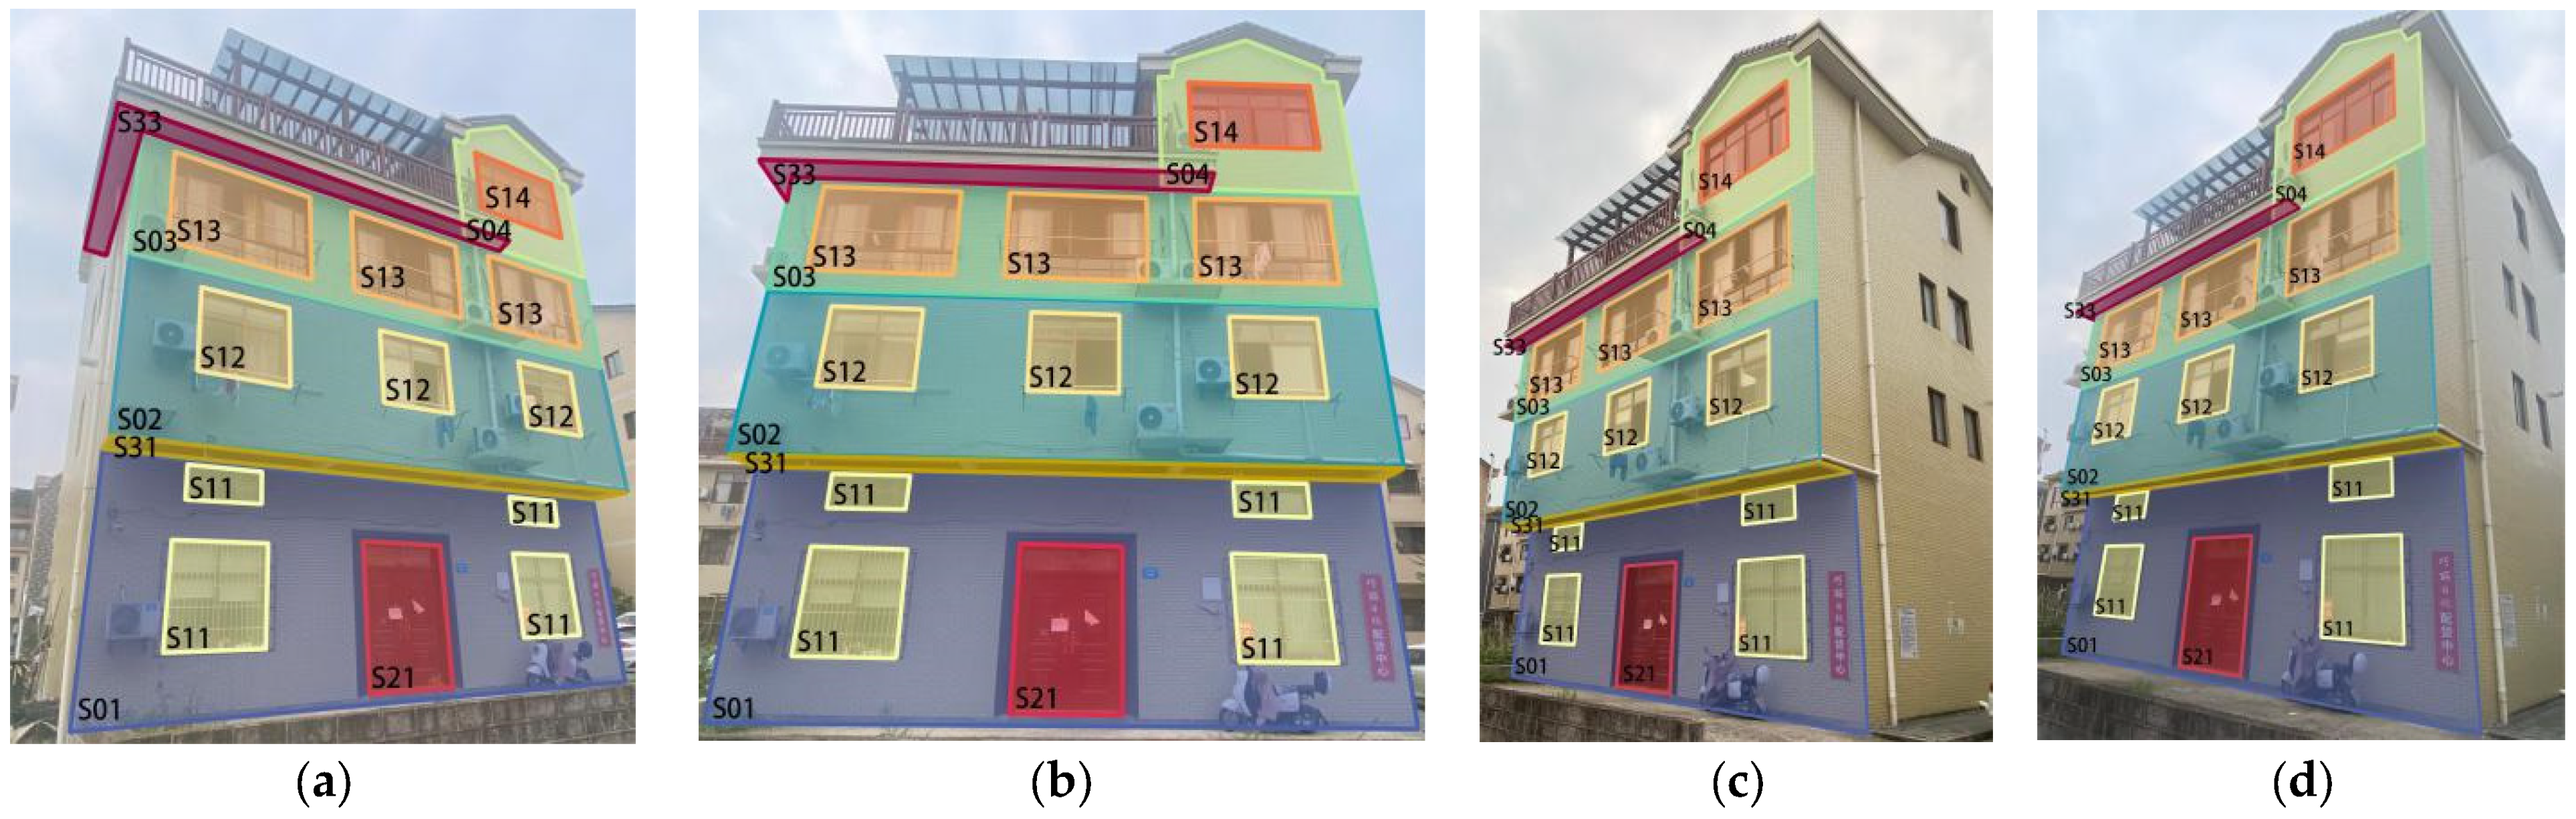
3.1.1. Image Labeling

The Labeling tool was employed to label 2000 collected plane samples, of which 1600 samples were selected as the training set and 400 samples as the validation set. The geometric polygon method was used to mark the range of each facade component. Additionally, numerical values were used to digitize the functions of each component as follows: orientation: S-South, N-North, W-West, E-East; component names: 0-wall, 1-window, 2-door, 3-sunshade component; floors: 1-first floor, 2-second floor, 3-third floor, 4-fourth floor. Based on the component type and facade orientation, corresponding numerical combinations were used to name each label. The annotation results of the sample data were exported as JSON files. Using Python 3.13.1 libraries such as numpy, os, and json, the open function was used to open the text file in write mode and traverse each shape in jsonx [‘shapes’]. For each shape, the coordinates of the points were first obtained and stored in the variable xy. Subsequently, an empty string strxy was created, and each point coordinate in xy was iterated. By using the newline character (\n), the data was written into the text file, eventually converting it into a TXT format file.

3.1.2. Image Training Parameters

Before training, the image size was normalized to 800 pixels by 500 pixels. This study investigated the application of the Mask R-CNN model with 50-layer residual network (ResNet50) and 101-layer residual network (ResNet101) backbones, as well as the improved Mask R-CNN model in building component image segmentation. To address the issue of small datasets, the Mask R-CNN model was pretrained on the COCO dataset, which accelerated the operation speed and feature learning process. In the model training, a stochastic gradient descent algorithm with a learning rate of 0.0025 and a momentum of 0.9 was used as the optimization algorithm. To improve segmentation accuracy, two images were used as a mini-batch for training on a single GPU, with parameters shown in Table 1.

3.2. Performance Comparison Between Models Established with Different CNN Networks

The introduction of the Coordinate Attention (CA) module does introduce additional computational complexity. However, we have optimized the training process by utilizing batch processing and parallel computation on GPUs, which significantly reduces training time. The model was trained on a server with an i9-14900K CPU, and the total training time for the full dataset was approximately 48 h, depending on the batch size and network architecture. This optimization ensures that the benefits of enhanced feature extraction do not come at an unreasonable computational cost.
To select a high-performance backbone network, the effectiveness of the model established by Mask R-CNN was first validated in this study. Training and testing experiments were conducted on datasets for wall dimensions, window dimensions, and sunshade lengths using Solov2, YOLOv3, Yolact, and Mask R-CNN. The average precision (AP) at each parameter level and the mean average precision (mAP) across all parameter levels are shown in Figure 7.
As can be seen from Figure 7, the performance of the model established by Mask R-CNN surpasses those built with Solov2, YOLOv3, and Yolact networks. The average precision of the model using ResNet50 as the backbone is improved by 13.03%, 9.90%, and 7.18% compared to Solov2, YOLOv3, and Yolact, respectively. With ResNet101 as the backbone, the average precision is improved by 15.09%, 12.03%, and 9.37% compared to Solov2, YOLOv3, and Yolact, respectively. This demonstrates that the ResNet backbone selected in this study has superior performance. Therefore, Mask R-CNN with ResNet was used as the base network to establish a model for detecting building parameter information.
Compared to models built with Mask R-CNN ResNet50 and Mask R-CNN ResNet101, the mAP increased from 0.882 to 0.904, an improvement of 2.36%. The results indicate that a deeper backbone network allows for more thorough training and effective improvement in evaluation metrics.
After introducing the attention mechanism into Mask R-CNN ResNet101, the performance of mAP, mAP0.75, and accuracy all improved. Specifically, after adding the CA attention mechanism to Mask R-CNN ResNet101, the mAP, mAP0.75, and accuracy reached 0.934, 0.891, and 0.944, respectively.
For the recognition of various parameter information of rural residential buildings, The accuracy rates for the recognition of building wall and window dimensions are 0.927 and 0.958, respectively, while the accuracy rate for shade length is 0.826. The reason for this is the optical lens perspective distortion; the sunshade components are in a horizontal position and cannot use a calibration plate to eliminate distortion, making their length more challenging to recognize.

3.3. Parameter Estimation

3.3.1. Estimation of Window-to-Wall Ratio

In the sample of building facade images, each component may not be a regular rectangle. Therefore, we use a pixel-based method to calculate the area. First, we connect the coordinates to form the frame of a regular or irregular shape and fill the interior of the frame with black color. Then, we use MATLAB R2024a to convert the image to a grayscale image and set a threshold to convert it to a binary image. Pixels below the threshold are set to 0, and pixels above the threshold are set to 255. Since the interior of the shape is filled with black, we use a for loop to scan and determine each pixel in the image. The number of pixels with a value of 0 represents the pixel area of the image. In this way, we can calculate the area ratio of the irregular shape in units of pixels.

3.3.2. Estimation of Sunshade Length

To accurately measure the length of sunshade components on a building facade, In this research, the checkerboard calibration board is combined with Mask R-CNN technology. First, a chessboard calibration plate of known dimensions is placed near the sunshade component, ensuring it is parallel to the building facade. High-resolution images containing both the calibration plate and the sunshade component are taken from multiple angles. Next, OpenCV 4.0 is used to identify the chessboard calibration plate in the images, extract the corner coordinates, perform camera calibration, and obtain the camera’s intrinsic and extrinsic parameters. After completing camera calibration, Mask R-CNN technology is used, such as the segmentation of the sunshade component. Mask R-CNN is a deep learning model capable of both object detection and instance segmentation. By annotating and training on the sunshade component, the model can accurately identify and segment the sunshade component’s contour in the image. Two endpoints are marked on the segmented contour of the sunshade component. Using the camera calibration parameters, the image coordinates of the endpoints are converted to real-world coordinates, and the distance between the endpoints is calculated, which is the actual length of the sunshade component. Through multiple measurements and error calibration, the accuracy and reliability of the measurement results can be optimized. By combining the chessboard calibration plate and Mask R-CNN technology, the length of sunshade components on building facades can be measured efficiently and accurately.
This study uses a Common Objects in Context (COCO) format dataset divided into a training set and a validation set. The training set contains 1600 samples, and the validation set contains 400 samples. Finally, annotation software is used to calibrate all images and generate corresponding JSON files for training and testing. The annotated data is shown in Figure 8 below.

4. Residential Energy Consumption Change Law Simulation

4.1. Parameter Setting of Rural Residential Energy Consumption Simulation

4.1.1. Parameter Setting of Building Envelope

Based on research and measurements of 300 rural residences, it was found that in areas with hot summers and cold winters, 30.0% of rural houses are two stories, and 43.7% are three stories, with system coefficients ranging from 0.40 to 0.60. This paper sets the heat transfer coefficient for external walls, roofs, and floors at 0.70, 0.25, and 0.80, respectively, according to the “Design Standards for Energy Efficiency of Residential Buildings [29]”. The building materials and construction details listed in Table 2 are based on commonly used construction methods and conditions for residential buildings in China, as well as relevant national standards.

4.1.2. Air Conditioning Parameter Settings

Using the Grasshopper plugin, simulations were conducted to calculate the annual average indoor temperature for 36 orientations, 9 window-to-wall ratio intervals, and 9 sunshade lengths in the experimental scene, with the climate data of Hangzhou used as the weather epw file (Figure 9). The upper limit of thermal comfort for humans is set between 28 °C and 29 °C, while the lower limit ranges from 5 °C to 10 °C. Hangzhou’s climate is characterized by high temperatures and humidity in summer and predominantly sunny weather in winter. Considering the actual operating conditions of air conditioners controlled by residents, the temperature standards for air conditioning in this study are set to a monthly average temperature of ≥28 °C in summer and ≤10 °C in winter.
Taking into account the air conditioning conditions and occupancy schedules of each room, the simulation parameters need to be adjusted. Since air conditioners are commonly used in bedrooms in rural residences in Hangzhou, which are typically occupied by small families of 2–3 people, the simulation settings designate the room function as a “Midrise Apartment” with a bedroom population density of 0.221.

4.1.3. Lighting Parameter Settings

To analyze room energy efficiency, artificial lighting energy consumption simulations were performed. The room’s (Useful Daylight Illuminance) UDI 300 was set as the minimum value for natural lighting. Using the Grasshopper plugin, simulations were conducted to calculate the annual average lighting energy consumption for 36 orientations, 9 window-to-wall ratio intervals, and 9 sunshade lengths in the experimental scene, with Hangzhou’s weather file selected. The room’s lighting fixtures have a fixed artificial lighting schedule from 6:00 AM to 10:00 PM. The lighting system is assumed to be continuously adjustable, with an ideal illuminance level of 500 lx on the work plane (0.9 m above the floor).
By comparing the energy consumption of all simulation scenarios, the air conditioning and lighting energy consumption data for the test room under various parameters were obtained.

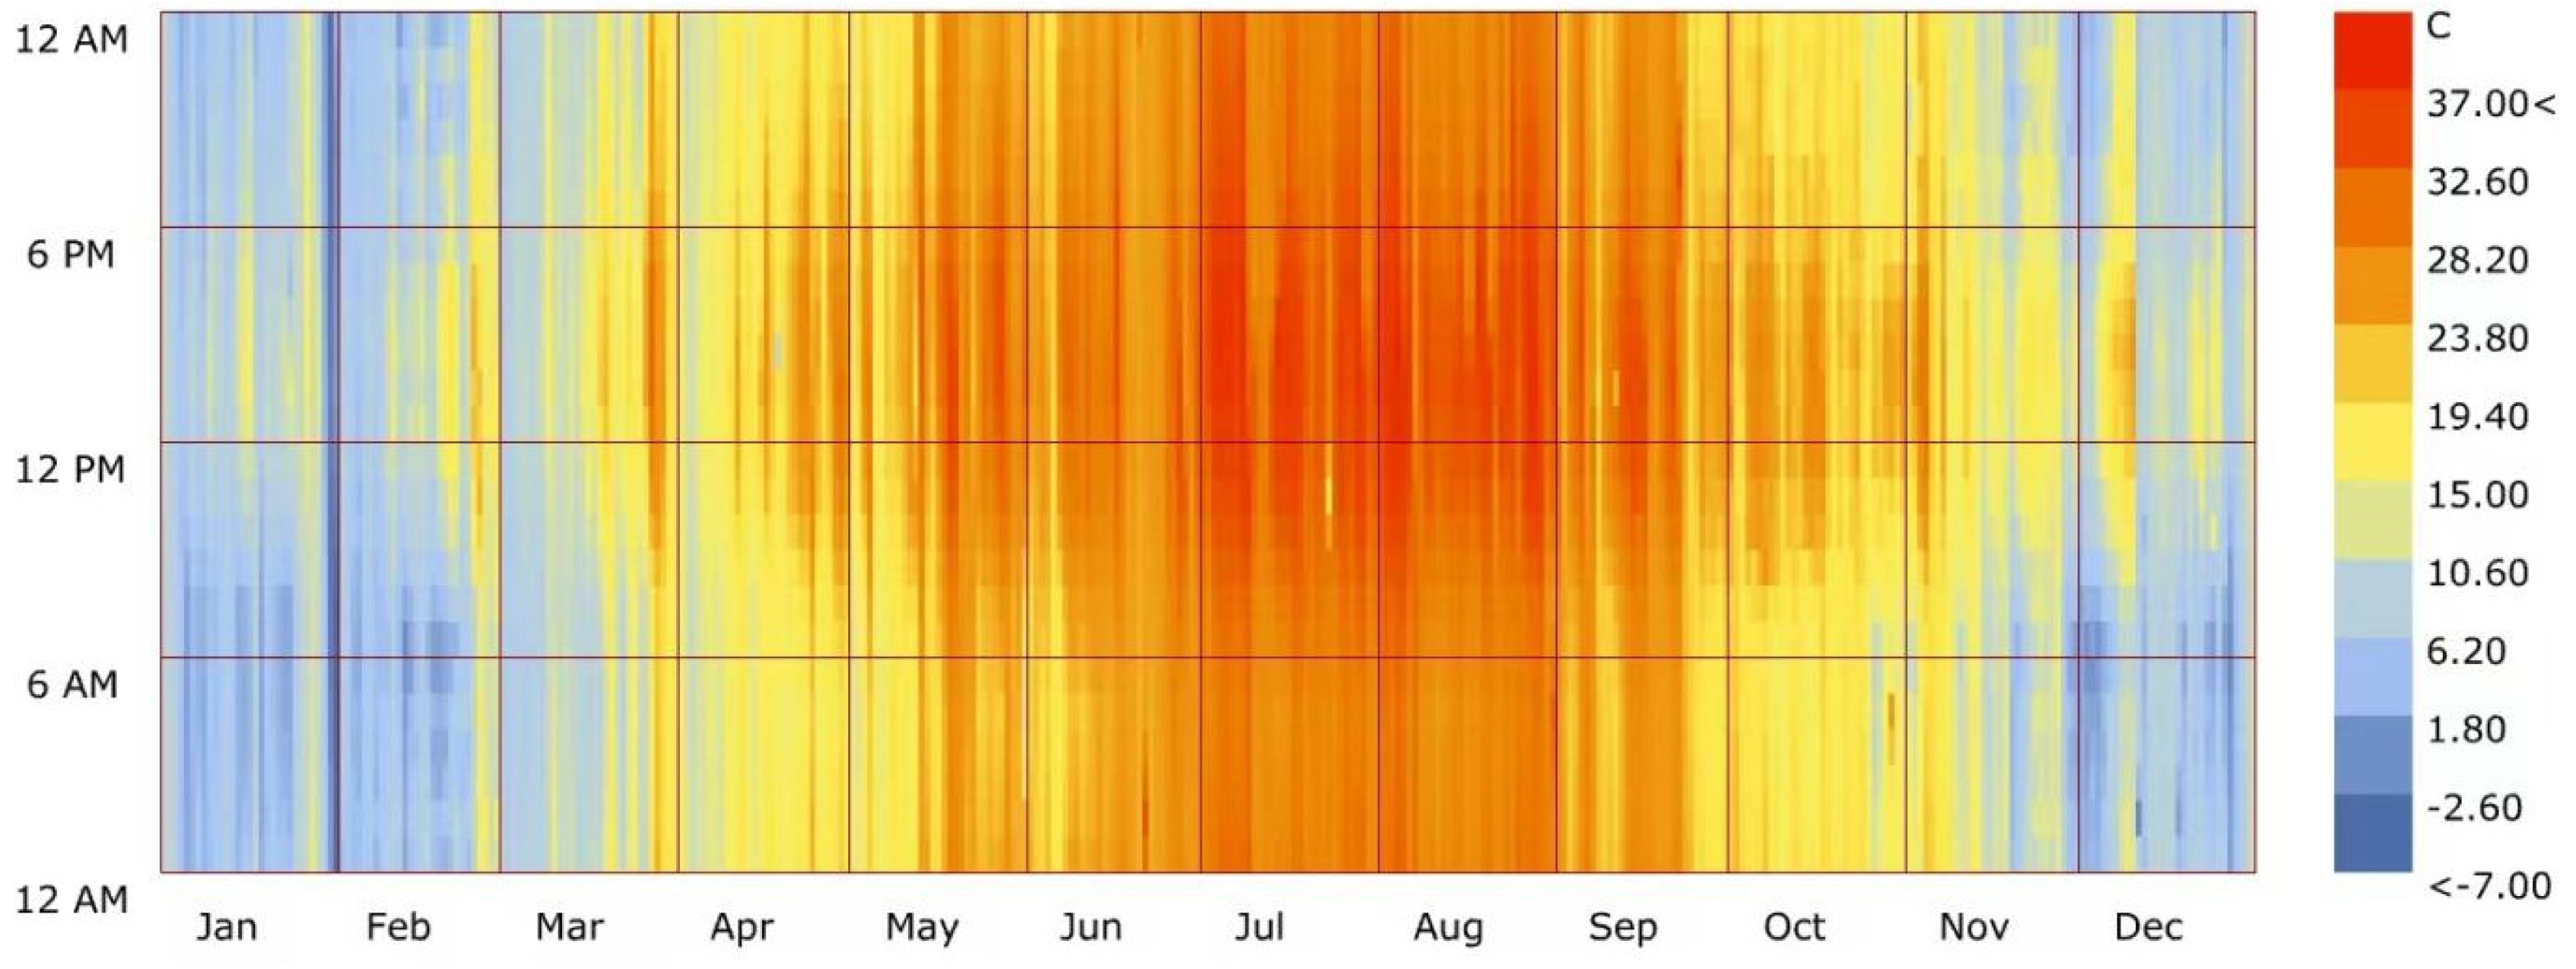
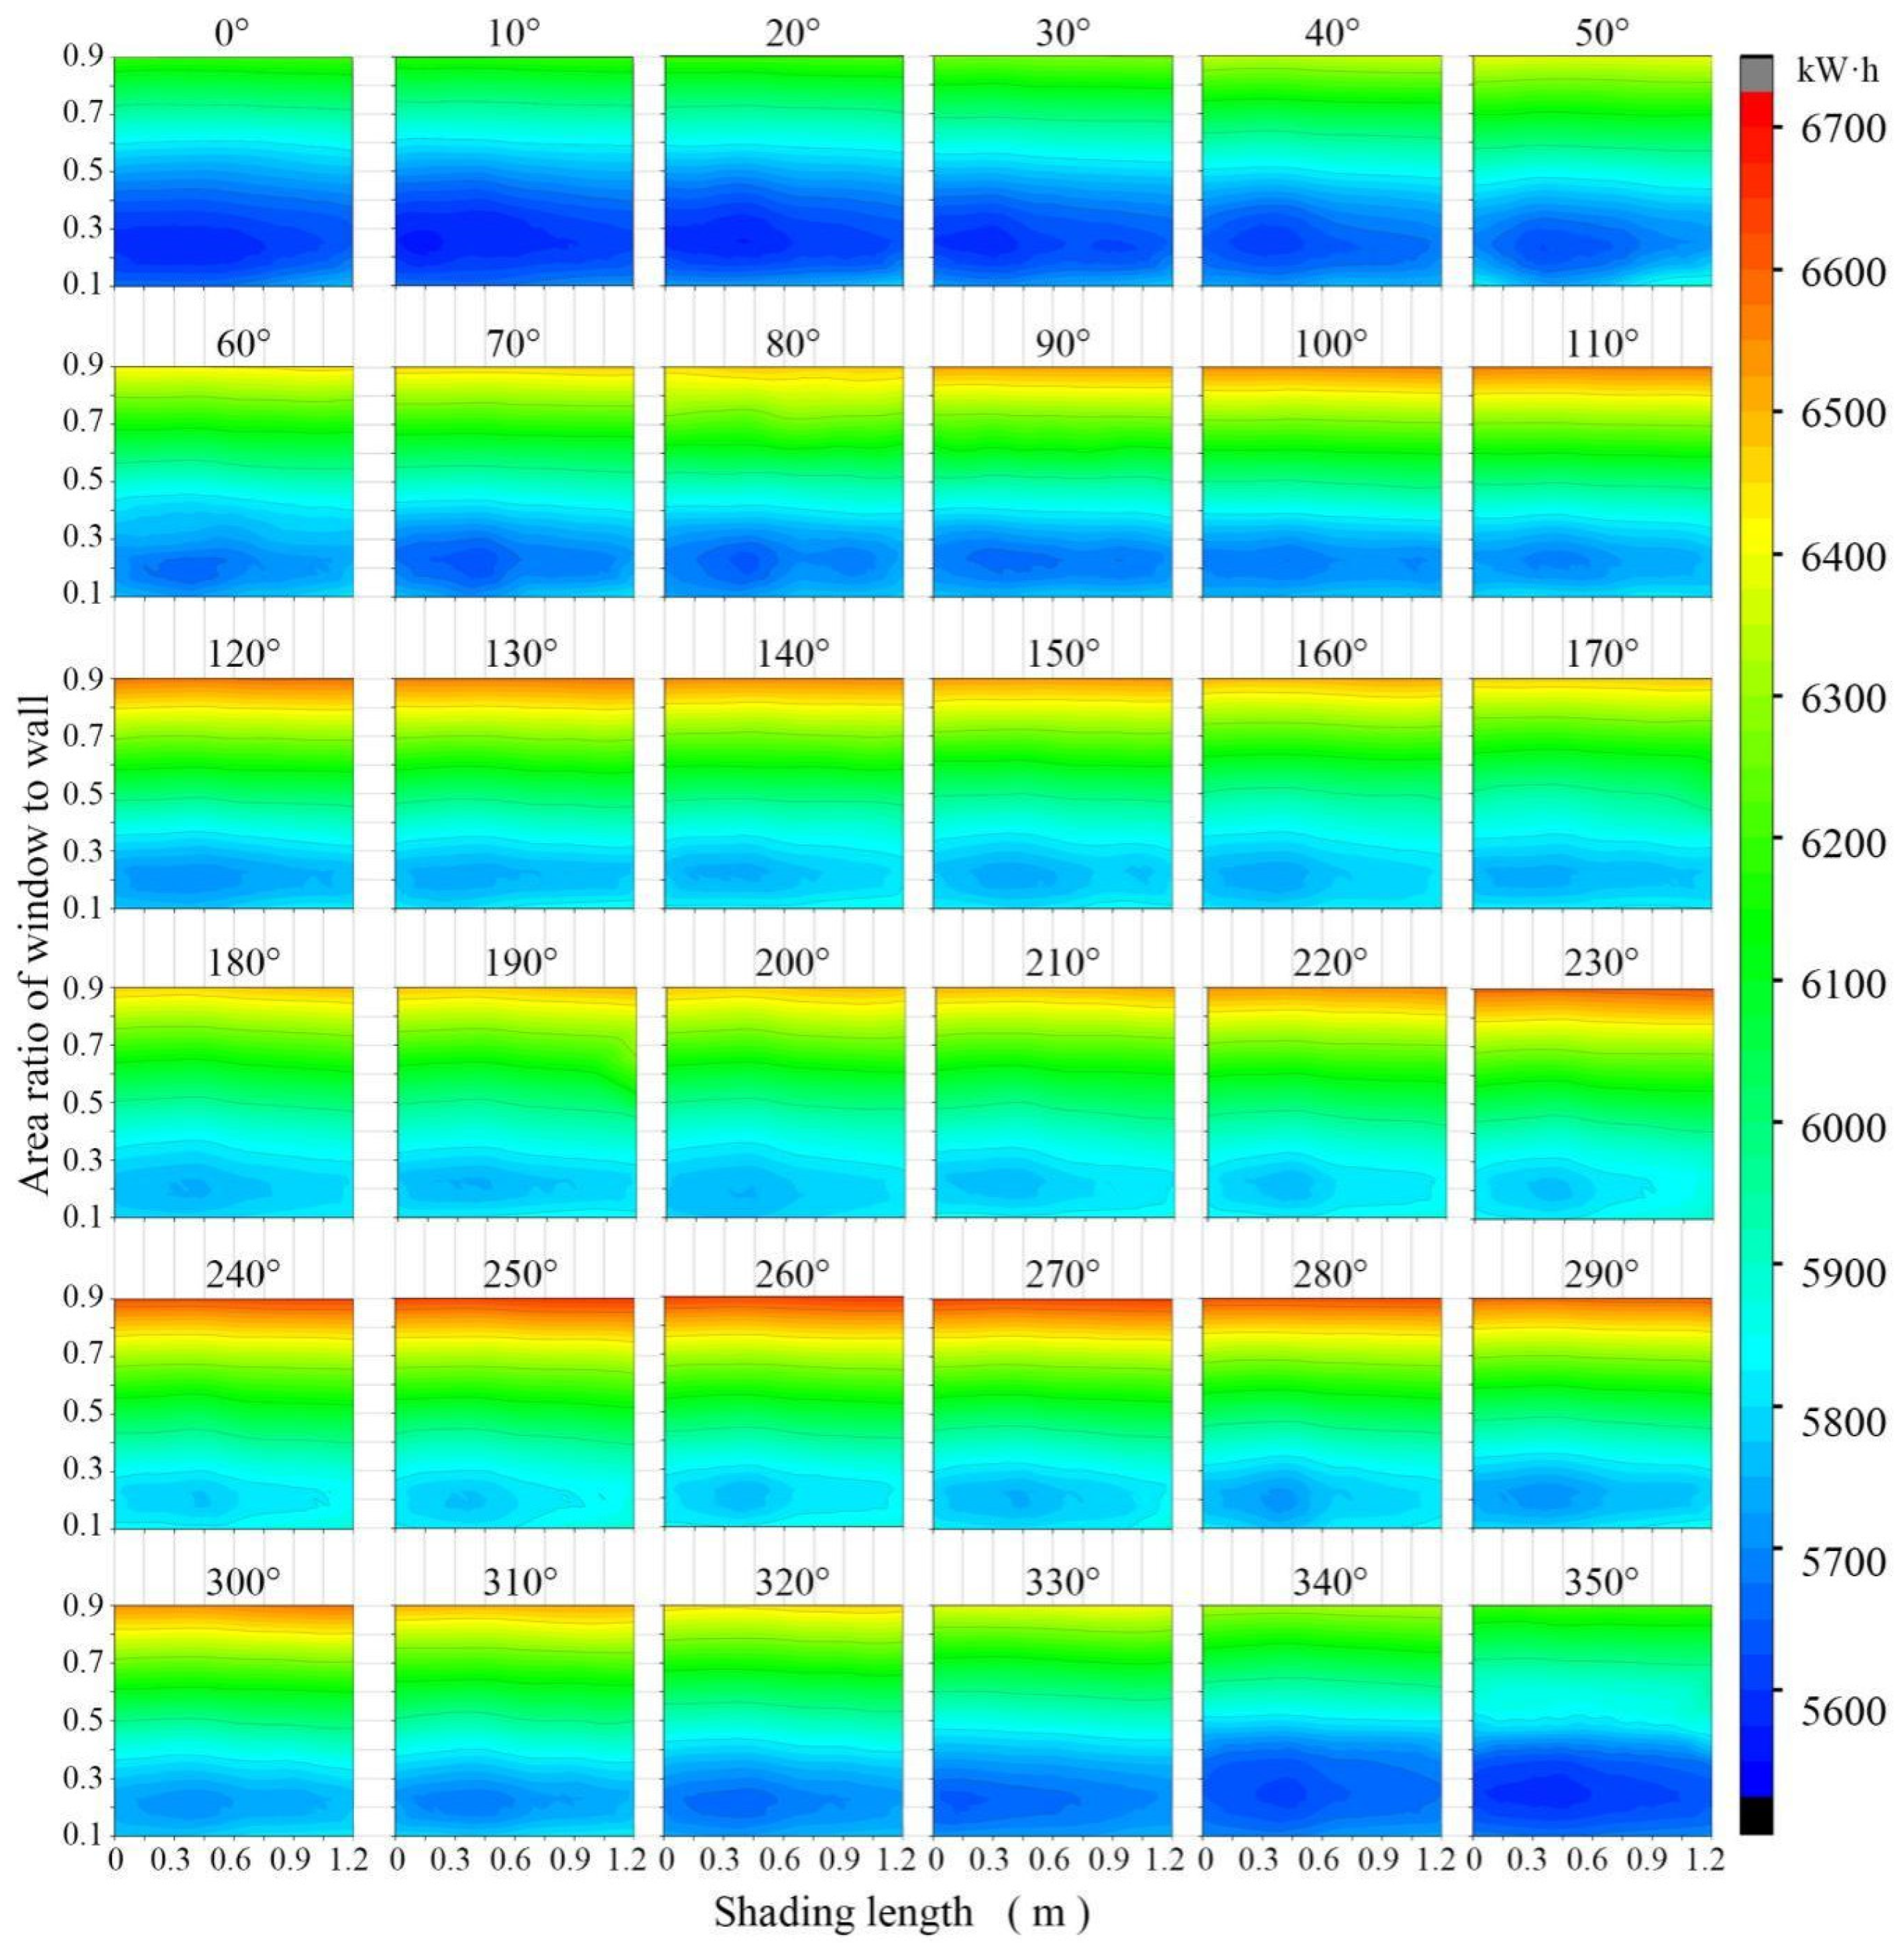
4.2. Simulation Results

The energy consumption intensity of air conditioning, cooling, heating, and lighting under each parameter is simulated and analyzed; the results indicate that the optimal ranges for WWR and SL are closely related to BO, as shown in Figure 10. When the BO is in the range of 320° to 40°, the optimal range for WWR is 0.2 to 0.3, and for SL, it is 0.45 m to 0.6 m. When the BO is in the ranges of 50° to 120° and 250° to 310°, the optimal WWR range is 0.3 to 0.4, with an optimal SL of 0.45 m. When the BO is in the range of 130° to 240°, the optimal WWR range is 0.15 to 0.3, and the optimal SL range is 0.15 m to 0.3 m. This demonstrates that different building orientations require different WWR and SL values to optimize energy consumption and enhance energy efficiency. Figure 10 shows the energy consumption intensity contour maps for various parameters.

4.3. Energy Efficiency Evaluation Model

To establish an energy efficiency evaluation model for rural residences, the detailed energy consumption database created from previous simulations is used. First, the building’s orientation (BO) is input into the model as a quantitative parameter, with WWR and SL as variable parameters for energy consumption simulation. The simulation results are then compared with the existing energy consumption database to identify reference data for similar orientations. By comparing energy consumption data under different WWR and SL parameters, the combination with the lowest energy consumption is selected as the optimal parameter. Finally, the existing energy consumption data is compared with the optimal parameters to obtain the evaluation results. This model allows for the simulation and evaluation of different design schemes, providing the optimal parameter combination as the best energy-saving retrofit suggestion for rural residences.

4.3.1. Data Reading

In Excel, WWR and SL values are stored in the corresponding BO list, with adjustments made to the energy consumption values to ensure each data row has the same number of entries. Using Python’s pandas library, the Excel file is read with the function pandas.read_excel (‘file_path.xlsx’), and the data is stored in a DataFrame. The improved Mask R-CNN is then used to identify and segment the target building, extracting the facade parameter information for the evaluation model.

4.3.2. Data Filtering

To process and filter the energy consumption data in the Excel file according to the building orientation and the requirements for WWR and SL, the pandas library is used to import and read the specified data. The data related to the building orientation is filtered first. Then, using Boolean indexing and the “&” operator, further filtering is performed to extract energy consumption data related to WWR and SL.

4.3.3. Energy Efficiency Evaluation

The current energy consumption data is compared with the lowest energy consumption value for the given orientation to calculate the energy-saving rate. This helps evaluate the potential for optimizing building energy consumption and determines the building’s energy-saving effect. Finally, the WWR and SL corresponding to the lowest energy consumption value are outputted as retrofit suggestions for energy consumption optimization. Alongside providing retrofit suggestions, the structural optimization of sunshade components, based on image recognition results, is recommended to achieve further energy consumption reduction.

5. Case Application Verification

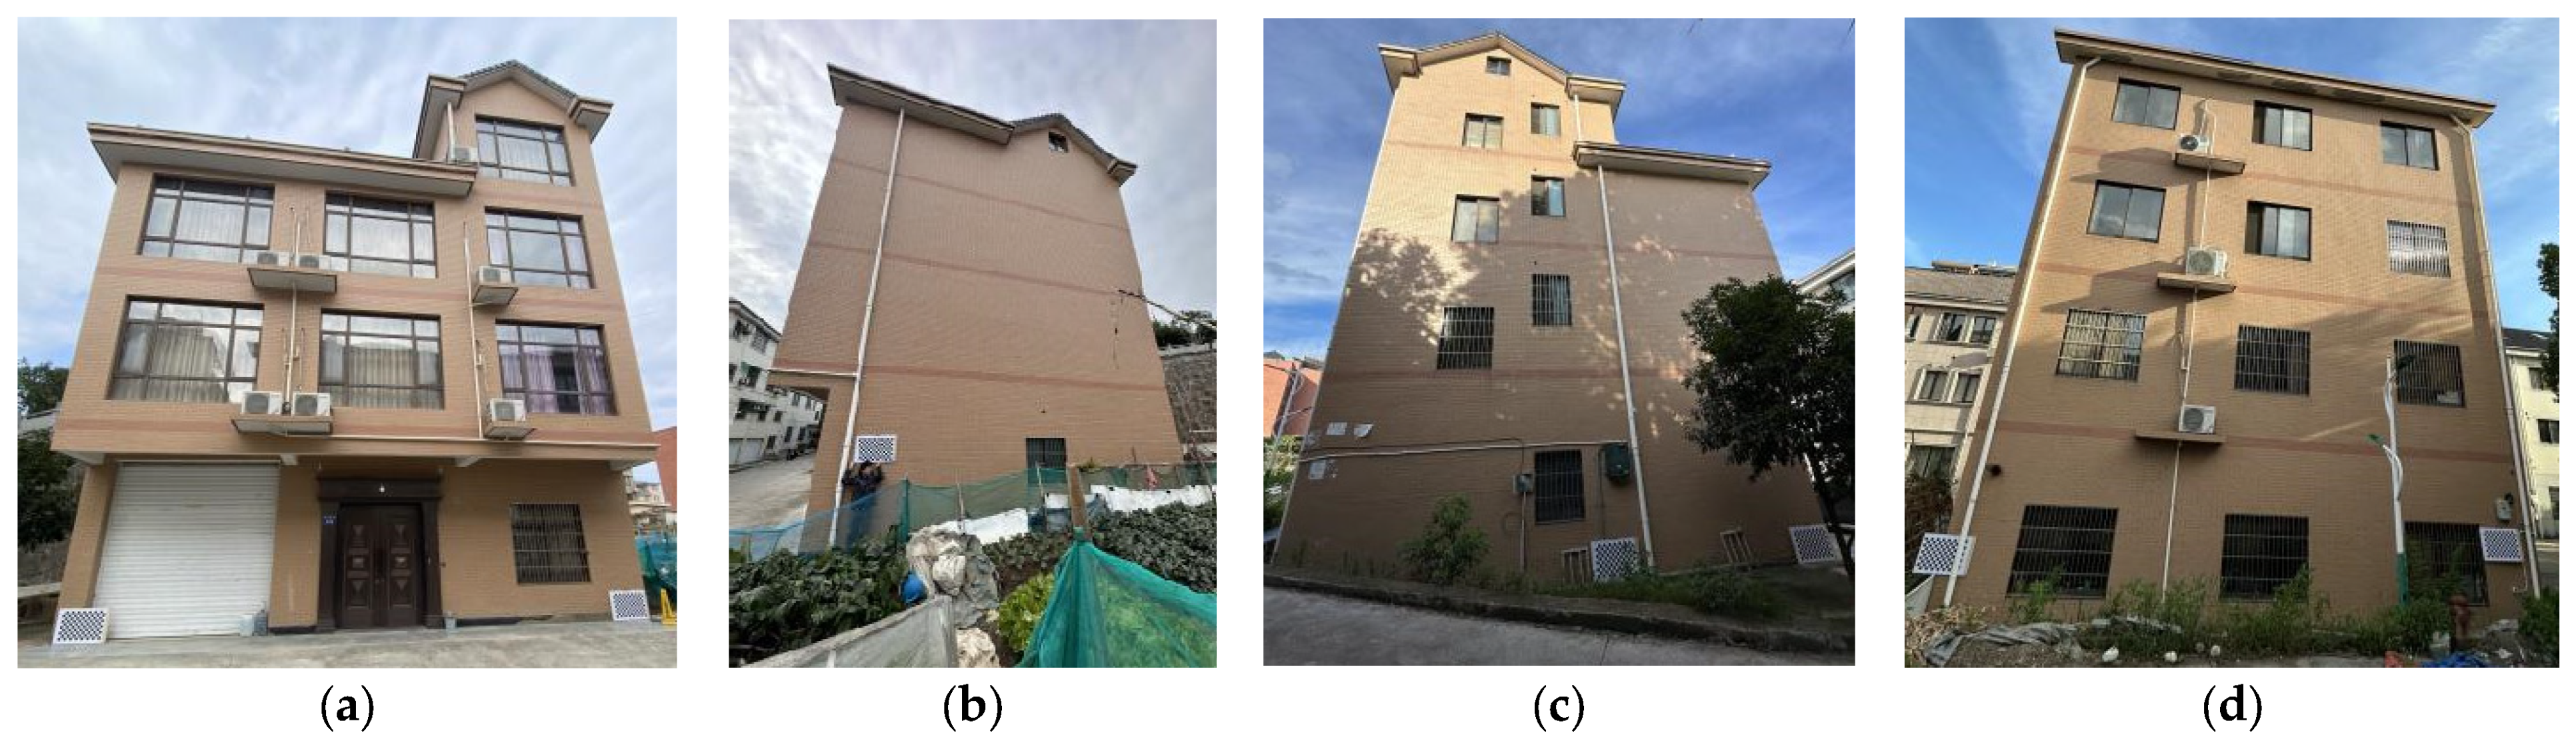
5.1. Case Introduction

The case study building is located in Pingshan Village, Lin’an District, Hangzhou, with coordinates at 30° N latitude and 120° E longitude. The building has a facade width of 12.40 m, a depth of 7.00 m, a height of 15.80 m, and an orientation 20° south by east. It is a four-story standalone residential structure (Figure 11).

5.2. Building Parameter Recognition

The original facade samples were input into the recognition model to automatically obtain the target residential parameters. Using the improved Mask R-CNN network model, various components in the facade images were detected and segmented, extracting key parameters such as windows, doors, and sunshades (Table 3) and recording their dimensions and positions (Figure 12).

5.3. Energy-Saving Retrofit Suggestions

Based on the building parameter information output by the recognition model and using the energy consumption simulation platform Grasshopper and Ladybug Tool, an energy consumption assessment of the building was conducted. The evaluation results showed that the energy consumption for the rooms on each floor of the residence was 5609 kWh, 5719 kWh, 5736 kWh, and 5633 kWh, respectively. The high energy consumption observed during summer peak periods is primarily due to the excessive window-to-wall ratio and insufficient sunshade lengths, which lead to increased solar heat gain and a higher cooling demand. These factors result in the building’s HVAC system working harder to maintain thermal comfort. The following retrofit suggestions are proposed: The potential for optimizing the energy efficiency of the first-floor room is relatively low; thus, it is recommended to maintain its current state. The second-floor room, with a significant potential for energy optimization, should have its WWR adjusted to 0.4 and external shading added, with a length set at 0.3 m. For the third-floor room, the WWR should also be adjusted to 0.4. The fourth-floor room requires the WWR to be adjusted to 0.4 and the addition of external shading, with a length set at 0.5 m. Reduce the area of south-facing windows to lower indoor temperatures during summer and enhance natural ventilation. Optimize sunshade components by installing horizontal sunshades on south-facing and west-facing windows, with lengths calculated to effectively block direct sunlight during summer peak periods.

6. Conclusions

This study presents an innovative approach to evaluating the energy efficiency of rural residential buildings by leveraging advanced image recognition technology. By integrating the improved Mask R-CNN network model with the Coordinate Attention mechanism, our method significantly enhances feature extraction quality and detection accuracy for building facade components such as windows, doors, and shading devices. The experimental results demonstrate that this approach not only accurately recognizes and segments facade components but also effectively extracts essential parameters such as dimensions and positions.
The subsequent energy consumption simulations, conducted using the Ladybug Tool within the Grasshopper plugin, underline the importance of precise parameter extraction. By simulating different building orientations, window-to-wall ratios, and sunshade lengths, the study provides detailed insights into the energy performance of rural residences. These simulations underscore the critical role of accurate data in optimizing building energy efficiency. The Mask R-CNN network developed in this study offers a significant advantage in automating the extraction of detailed building facade features. This network enhances the accuracy and efficiency of energy simulations by providing high-resolution data directly from images, which traditional methods might miss or require significant manual input to obtain. This automation and precision make the Mask R-CNN approach particularly useful in large-scale or complex projects.
Moreover, the proposed method offers substantial practical value by providing specific energy-saving retrofit suggestions based on case studies. These suggestions offer robust technical support and practical guidance for enhancing energy efficiency in rural residential buildings, contributing to sustainable development in rural areas. The integration of automated parameter acquisition with energy consumption assessment introduces a novel and efficient approach to building energy evaluations, setting a foundation for future research and applications in the field of energy optimization for rural residential buildings.
The research highlights the potential of advanced computer vision and image processing technologies in transforming the evaluation and optimization of energy efficiency in rural residential buildings. The improved Mask R-CNN network model, combined with precise energy consumption simulations, provides a comprehensive framework for accurate and reliable energy efficiency assessments, paving the way for future advancements in sustainable building practices.
Despite the promising results, there are several limitations to this study. First, the analysis only considers cooling energy consumption, excluding heating energy use, which may affect the generalizability of the findings in regions with more balanced heating and cooling demands. Additionally, the R-CNN model’s performance may vary depending on the quality and diversity of the input images, and further validation across different building types and climatic regions is needed to assess its scalability.

Author Contributions

Conceptualization, M.W. and F.C.; methodology, L.H.; software, Y.J.; validation, K.G., Y.J. and Z.S.; formal analysis, L.H.; investigation, K.G.; resources, M.W.; data curation, K.G.; writing—original draft preparation, K.G.; writing—review and editing, L.H. and Y.L.; visualization, L.H.; supervision, M.W.; project administration, M.W.; funding acquisition, L.H. All authors have read and agreed to the published version of the manuscript.

Funding

This research received no external funding.

Data Availability Statement

Date sharing is not applicable to this article as no new data were created or analyzed in this study.

Conflicts of Interest

The authors declare no conflict of interest.

Abbreviations

R-CNNRegion-based Convolutional Neural Network
CACoordinate Attention
TceTon of standard coal equivalent
WWRWindow-to-wall ratio
SLshading length
WWRWindow-to-Wall Ratio
FPNFeature Pyramid Network
RPNRegion Proposal Network
COCOCommon Objects in Context
UDIUseful Daylight Illuminance
BObuilding’s orientation
HVACHeating, Ventilation, and Air Conditioning

References

  1. China Association of Building Energy Efficiency, Chongqing University Urban-Rural Construction and Development Research Institute. Research Report on Building Energy Consumption and Carbon Emissions in China (2023). Architecture 2024, 2, 46–59. [Google Scholar]
  2. Cai, Y. Calculation and Peak Prediction of Terminal Energy Consumption and Carbon Emission of Urban Residential Buildings in Hot-Summer and Cold-Winter Zone. Master’s Thesis, Chongqing University, Chongqing, China, 2021. [Google Scholar]
  3. Wei, Y.; Jiang, L.; Xu, J. Research and Application of Low Energy Consumption Technology in Construction of Jiangnan Water Town and Village Rural Housing. Jiangsu Constr. 2021, 215, 109–111+114. [Google Scholar]
  4. Ma, X.; Li, J.; Guo, Z.; Wan, Z. Role of big data and technological advancements in monitoring and development of smart cities. Heliyon 2024, 10, e34821. [Google Scholar] [CrossRef]
  5. Du, C.; Wang, Y.; Li, B.; Xu, M.; Sadrizadeh, S. Grey image recognition-based mold growth assessment on the surface of typical building materials responding to dynamic thermal conditions. Build. Environ. 2023, 243, 110682. [Google Scholar] [CrossRef]
  6. Vasseghipanah, B.; Haghir, S. Techno-aesthetics in architectural discourses: A state of the art review. Front. Archit. Res. 2024, 13, 505–542. [Google Scholar] [CrossRef]
  7. Zhang, P.; Wang, H.; Li, X.; Nie, Z.; Ma, Z. Research on digital characterization and identification process model of functional genes for intelligent innovative design. Adv. Eng. Inform. 2023, 56, 101983. [Google Scholar] [CrossRef]
  8. Haghighatgou, N.; Daniel, S.; Badard, T. A method for automatic identification of openings in buildings facades based on mobile LiDAR point clouds for assessing impacts of floodings. Int. J. Appl. Earth Obs. Geoinf. 2022, 108, 102757. [Google Scholar] [CrossRef]
  9. Yin, M.; Tang, L.; Zhou, T.; Wen, Y.; Xu, R.; Deng, W. Automatic layer classification method-based elevation recognition in architectural drawings for reconstruction of 3D BIM models. Autom. Constr. 2020, 113, 103082. [Google Scholar] [CrossRef]
  10. Zhong, D.; He, L.; Lin, Y. An Improved Mask R-Cnn: Extraction of Door and Window Instances on Village Building Façade Images. ISPRS Ann. Photogramm. Remote Sens. Spatial Inf. Sci. 2023, X-1/W1-2023, 295–301. [Google Scholar] [CrossRef]
  11. Hou, T.; Li, J. Application of mask R-CNN for building detection in UAV remote sensing images. Heliyon 2024, 10, e38141. [Google Scholar] [CrossRef]
  12. Lu, Y.; Wei, W.; Li, P.; Zhong, T.; Nong, Y.; Shi, X. A deep learning method for building façade parsing utilizing improved SOLOv2 instance segmentation. Energy Build. 2023, 295, 113275. [Google Scholar] [CrossRef]
  13. Marín-García, D.; Bienvenido-Huertas, D.; Carretero-Ayuso, M.J.; Torre, S.D. Deep learning model for automated detection of efflorescence and its possible treatment in images of brick facades. Autom. Constr. 2023, 145, 104658. [Google Scholar] [CrossRef]
  14. Aydin, C.C. Designing building façades for the urban rebuilt environment with integration of digital close-range photogrammetry and geographical information systems. Autom. Constr. 2014, 43, 38–48. [Google Scholar] [CrossRef]
  15. Coakley, D.; Raftery, P.; Keane, M. A review of methods to match building energy simulation models to measured data. Renew. Sustain. Energy Rev. 2014, 37, 123–141. [Google Scholar] [CrossRef]
  16. Troup, L.; Phillips, R.; Eckelman, M.J.; Fannon, D. Effect of window-to-wall ratio on measured energy consumption in US office buildings. Energy Build. 2019, 203, 109434. [Google Scholar] [CrossRef]
  17. Attia, S.; Gratia, E.; De Herde, A.; Hensen, J.L.M. Simulation-based decision support tool for early stages of zero-energy building design. Energy Build. 2012, 49, 2–15. [Google Scholar] [CrossRef]
  18. Marino, C.; Nucara, A.; Pietrafesa, M. Does window-to-wall ratio have a significant effect on the energy consumption of buildings? A parametric analysis in Italian climate conditions. J. Build. Eng. 2017, 13, 169–183. [Google Scholar] [CrossRef]
  19. Li, Y.; Tao, X.; Zhang, Y.; Li, W. Combining use of natural ventilation, external shading, cool roof and thermal mass to improve indoor thermal environment: Field measurements and simulation study. J. Build. Eng. 2024, 86, 108904. [Google Scholar] [CrossRef]
  20. Lionar, R.; Kroll, D.; Soebarto, V.; Sharifi, E.; Aburas, M. A review of research on self-shading façades in warm climates. Energy Build. 2024, 314, 114203. [Google Scholar] [CrossRef]
  21. Lam, C.K.C.; Weng, J.; Liu, K.; Hang, J. The effects of shading devices on outdoor thermal and visual comfort in Southern China during summer. Build. Environ. 2023, 228, 109743. [Google Scholar] [CrossRef]
  22. Tu, F. Chinese Building Shading Technology; China Quality Inspection Press: Beijing, China, 2015. [Google Scholar]
  23. Zhang, Z.; Guo, Z.; Zheng, H.; Li, Z.; Yuan, P.F. Automated architectural spatial composition via multi-agent deep reinforcement learning for building renovation. Autom. Constr. 2024, 167, 105702. [Google Scholar] [CrossRef]
  24. Casini, M. (Ed.) Index. Construction 4.0; Woodhead Publishing: Sawston, UK, 2022; pp. 221–262. [Google Scholar] [CrossRef]
  25. He, K.; Gkioxari, G.; Dollár, P.; Girshick, R.B. Mask R-CNN. In Proceedings of the 2017 IEEE International Conference on Computer Vision (ICCV), Venice, Italy, 22–29 October 2017; pp. 2980–2988. [Google Scholar]
  26. Chu, H.; Deng, L.; Yuan, H.; Long, L.; Guo, J. A transformer and self-cascade operation-based architecture for segmenting high-resolution bridge cracks. Autom. Constr. 2024, 158, 105194. [Google Scholar] [CrossRef]
  27. Wang, B.; Wang, M.; Yang, J.; Luo, H. YOLOv5-CD: Strip steel surface defect detection method based on coordinate attention and a decoupled head. Meas. Sens. 2023, 30, 100909. [Google Scholar] [CrossRef]
  28. Tang, Y.; Chen, Y.; Sharifuzzaman, S.A.S.M.; Li, T. An automatic fine-grained violence detection system for animation based on modified faster R-CNN. Expert Syst. Appl. 2024, 237, 121691. [Google Scholar] [CrossRef]
  29. Yang, Y.; Ding, D.; Yan, X. Design Standards for Energy Efficiency of Residential Buildings. 2021. Available online: https://zjjcmspublic.oss-cn-hangzhou-zwynet-d01-a.internet.cloud.zj.gov.cn/jcms_files/jcms1/web3162/site/attach/0/33fa7399ca7c494baeff6af61a063d9a.pdf (accessed on 26 January 2025).
Figure 1. Building facade images taken from different angles and under various lighting conditions. (a) Side view image. (b) Front view image. (c) Side view image with high brightness. (d) Side view image with low brightness.
Sustainability 17 01132 g001
Figure 2. Laboratory room model.
Sustainability 17 01132 g002
Figure 3. Orientation interval diagram.
Sustainability 17 01132 g003
Figure 4. (a) Window-to-wall ratio. (b) Shading length.
Sustainability 17 01132 g004
Figure 5. CA and Mask R-CNN structure diagram.
Sustainability 17 01132 g005
Figure 6. ResNet + CA.
Sustainability 17 01132 g006
Figure 7. Experimental comparison between Mask R-CNN and common networks.
Sustainability 17 01132 g007
Figure 8. Recognition results of building facades from different angles and brightness levels. (a) Side view recognition results. (b) Front view recognition results. (c) Side view recognition results under high brightness. (d) Side view recognition results under low brightness.
Sustainability 17 01132 g008
Figure 9. Annual Meteorological Data for Hangzhou.
Sustainability 17 01132 g009
Figure 10. Contour maps of energy consumption intensity corresponding to various parameters.
Sustainability 17 01132 g010
Figure 11. (a) South elevation (b) East elevation (c) North elevation (d) West elevation.
Sustainability 17 01132 g011
Figure 12. Building facade identification results. (a) South elevation (b) East elevation (c) North elevation (d) West elevation.
Sustainability 17 01132 g012
Table 1. Experimental model parameter.
Training ParameterParameter Value
Input picture size800 × 500
Batch size2
Epochs30
OptimizerSGD
Learning rate0.0025
Weight Decay0.0001
Momentum0.9
Table 2. Materials and Structural Details of the Target Building.
ParameterDescription
Building model14.40 m (Length) × 7.00 m (Width) × 10.80 m (Height)
Exterior wallwaterproofed mortar (8.00 mm) + thermal mortar (50.00 mm) + cement brick (200.00 mm) + cement mortar (20.00 mm) + white paint (1.00 mm) (outside-in)
Floorreinforced concrete (100.00 mm) + reinforced pavement (20.00 mm)
Interior wallwhite paint (1.00 mm) + cement mortar (20.00 mm) + perforated brick (190.00 mm) + cement mortar (20.00 mm) + white paint (1.00 mm)
Windowclear single-glass window (0.6mm) (solar transmittance at normal incident = 0.84, solar reflectance at normal incidence = 0.08, visible normal incidence = 0.9, visible reflectance at normal incidence = 0.08)
Table 3. Case building elevation parameters.
Building OrientationFloorWindow-to-Wall RatioShading Length/mEnergy Intensity/kW·h
20°1F0.220.865609
2F0.5105719
3F0.510.545736
4F0.4705633
Disclaimer/Publisher’s Note: The statements, opinions and data contained in all publications are solely those of the individual author(s) and contributor(s) and not of MDPI and/or the editor(s). MDPI and/or the editor(s) disclaim responsibility for any injury to people or property resulting from any ideas, methods, instructions or products referred to in the content.

