
Assessing the Efficiency of Phragmites australis in Wastewater Treatment as a Natural Approach to Water Quality Improvement

 , , , , ,
  , ,
, ,  , ,
, ,  and
and 
Abstract
1. Introduction
2. Materials and Methods
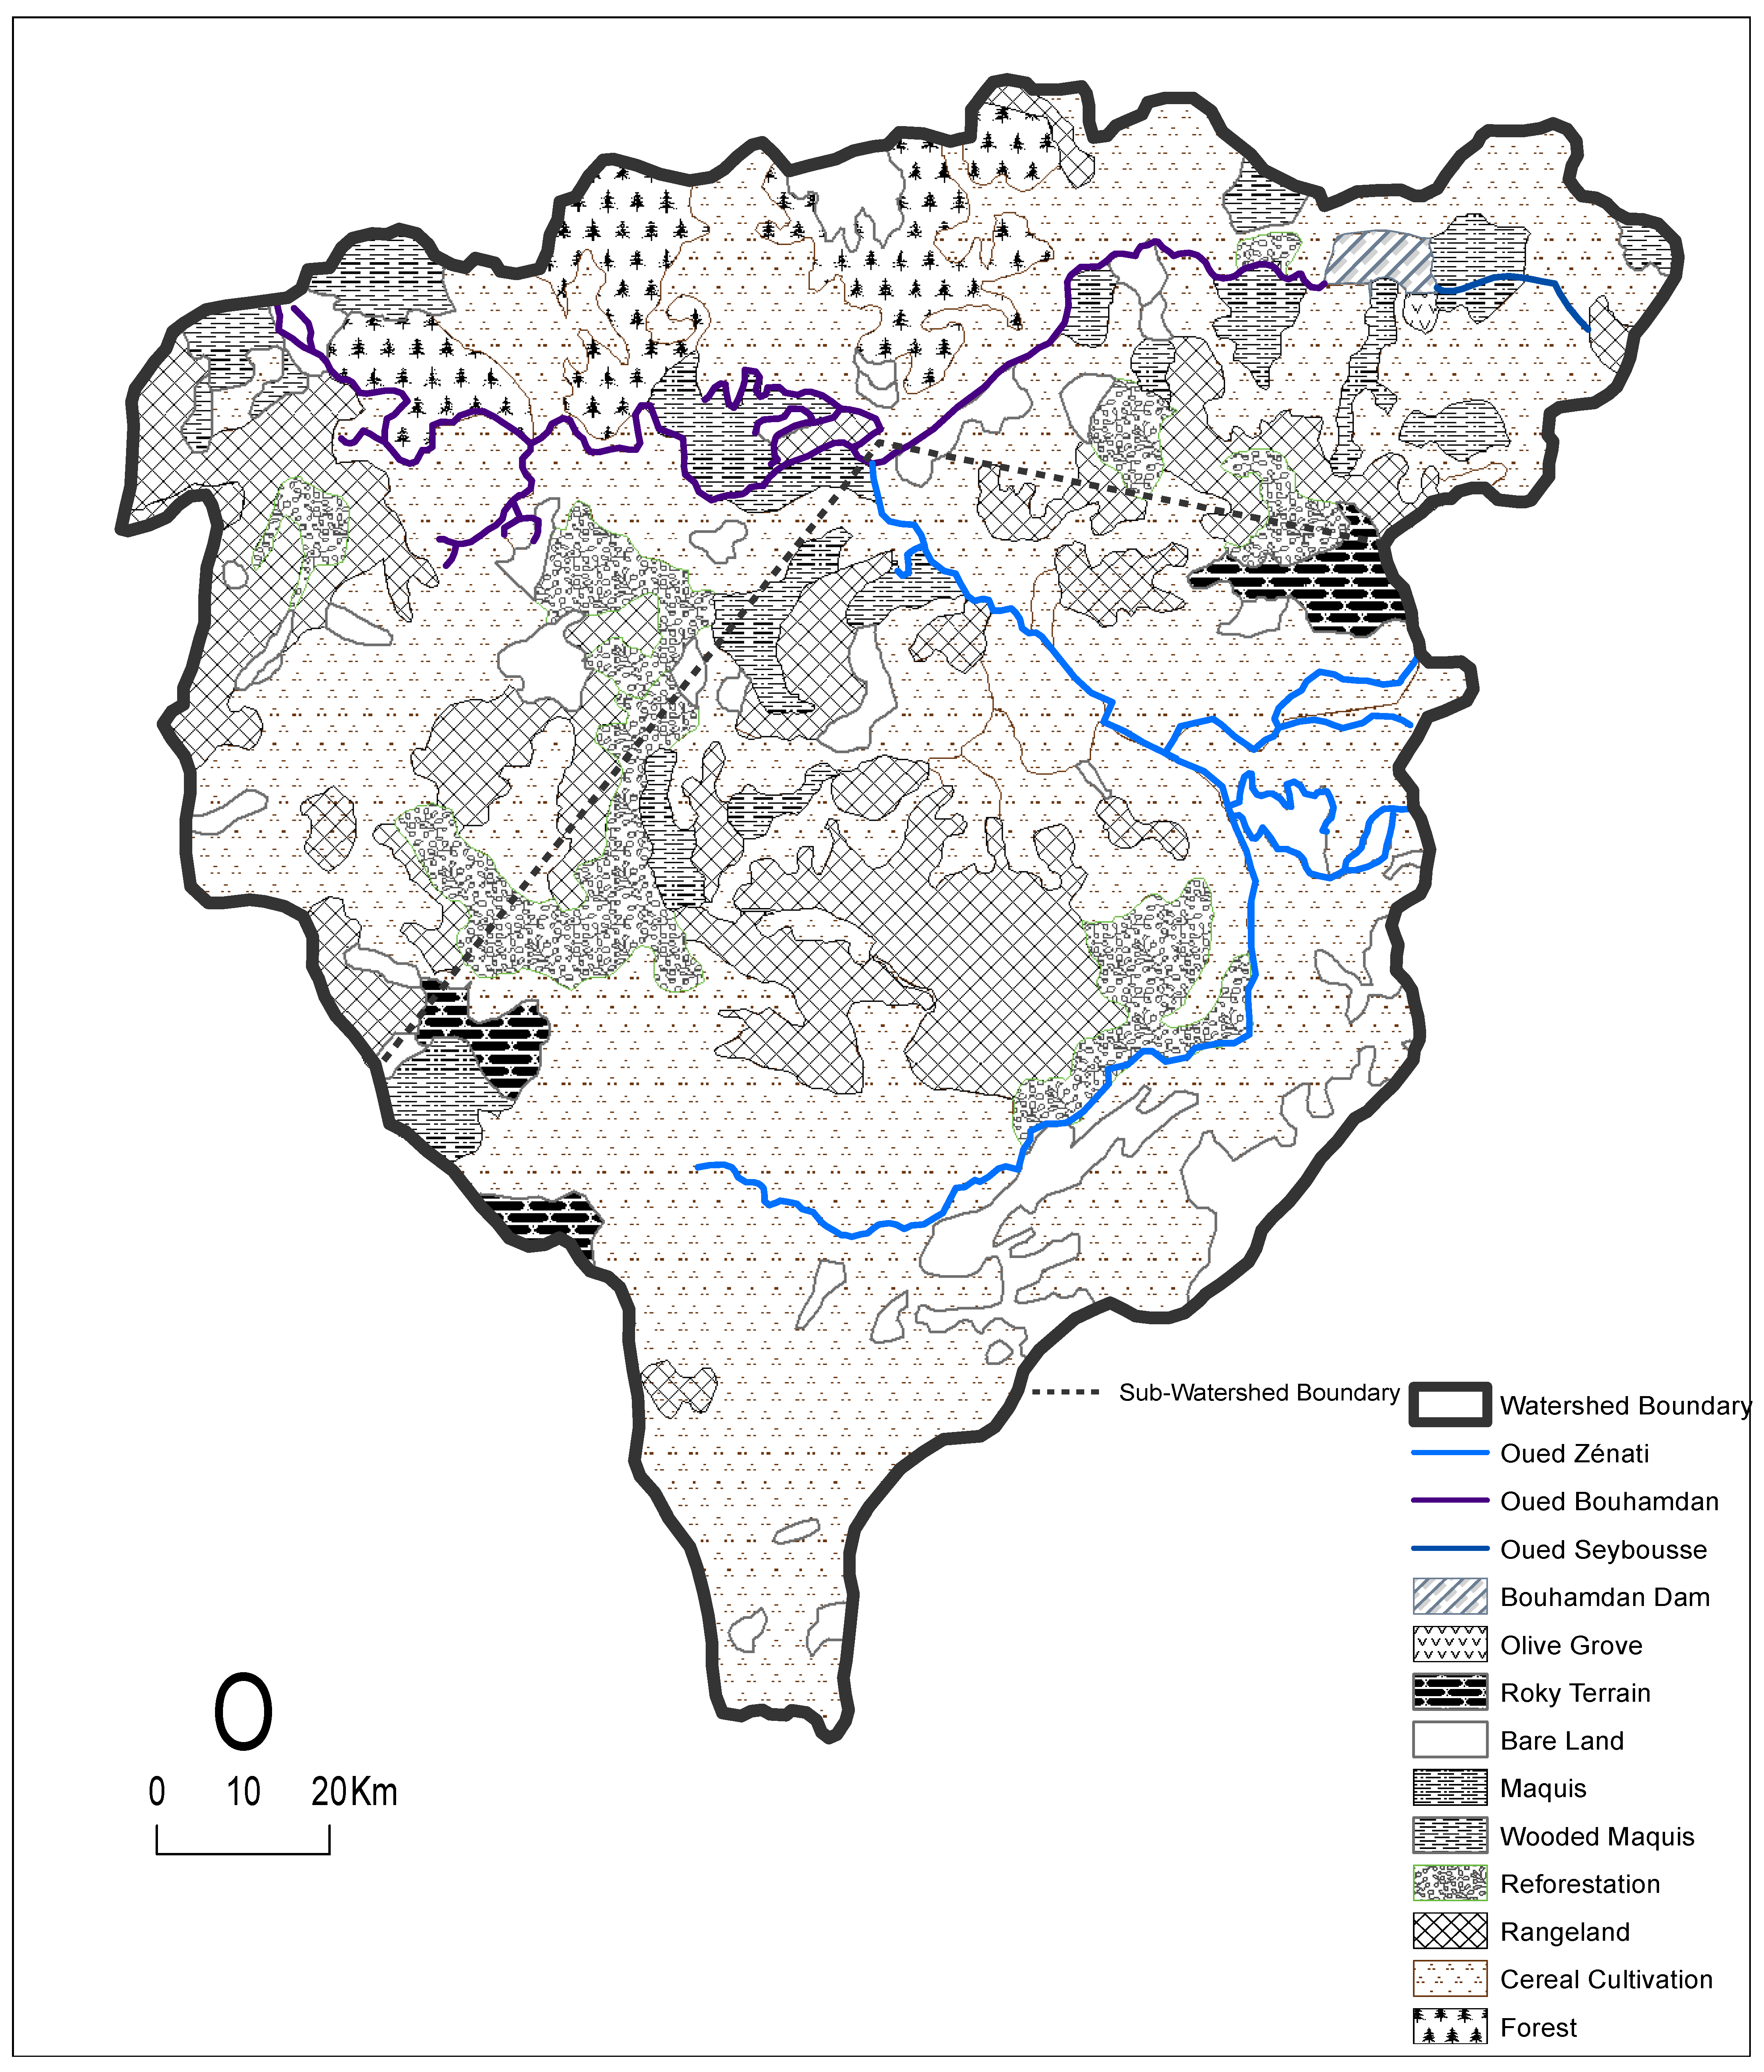
2.1. Study Site
2.2. Sampling Protocol and Analyses
2.2.1. Sample Collection Procedures
2.2.2. Analyses
2.3. Statistical Analyses
3. Results
3.1. Physicochemical Parameters (Table 1)

| Parameter | S1 (Non-Polluted) | S2 (Wastewater Discharges) | S3 (Reeds) |
|---|---|---|---|
| pH | 7.58 ± 0.31 | 7.54 ± 0.31 | 7.61 ± 0.31 |
| Temperature (°C) | 13.1 ± 4.5 | 17.1 ± 4.5 | 14.7 ± 4.5 |
| Salinity (Sal)(PSU) | 0.52 ± 0.13 | 0.65 ± 0.13 | 0.66 ± 0.13 |
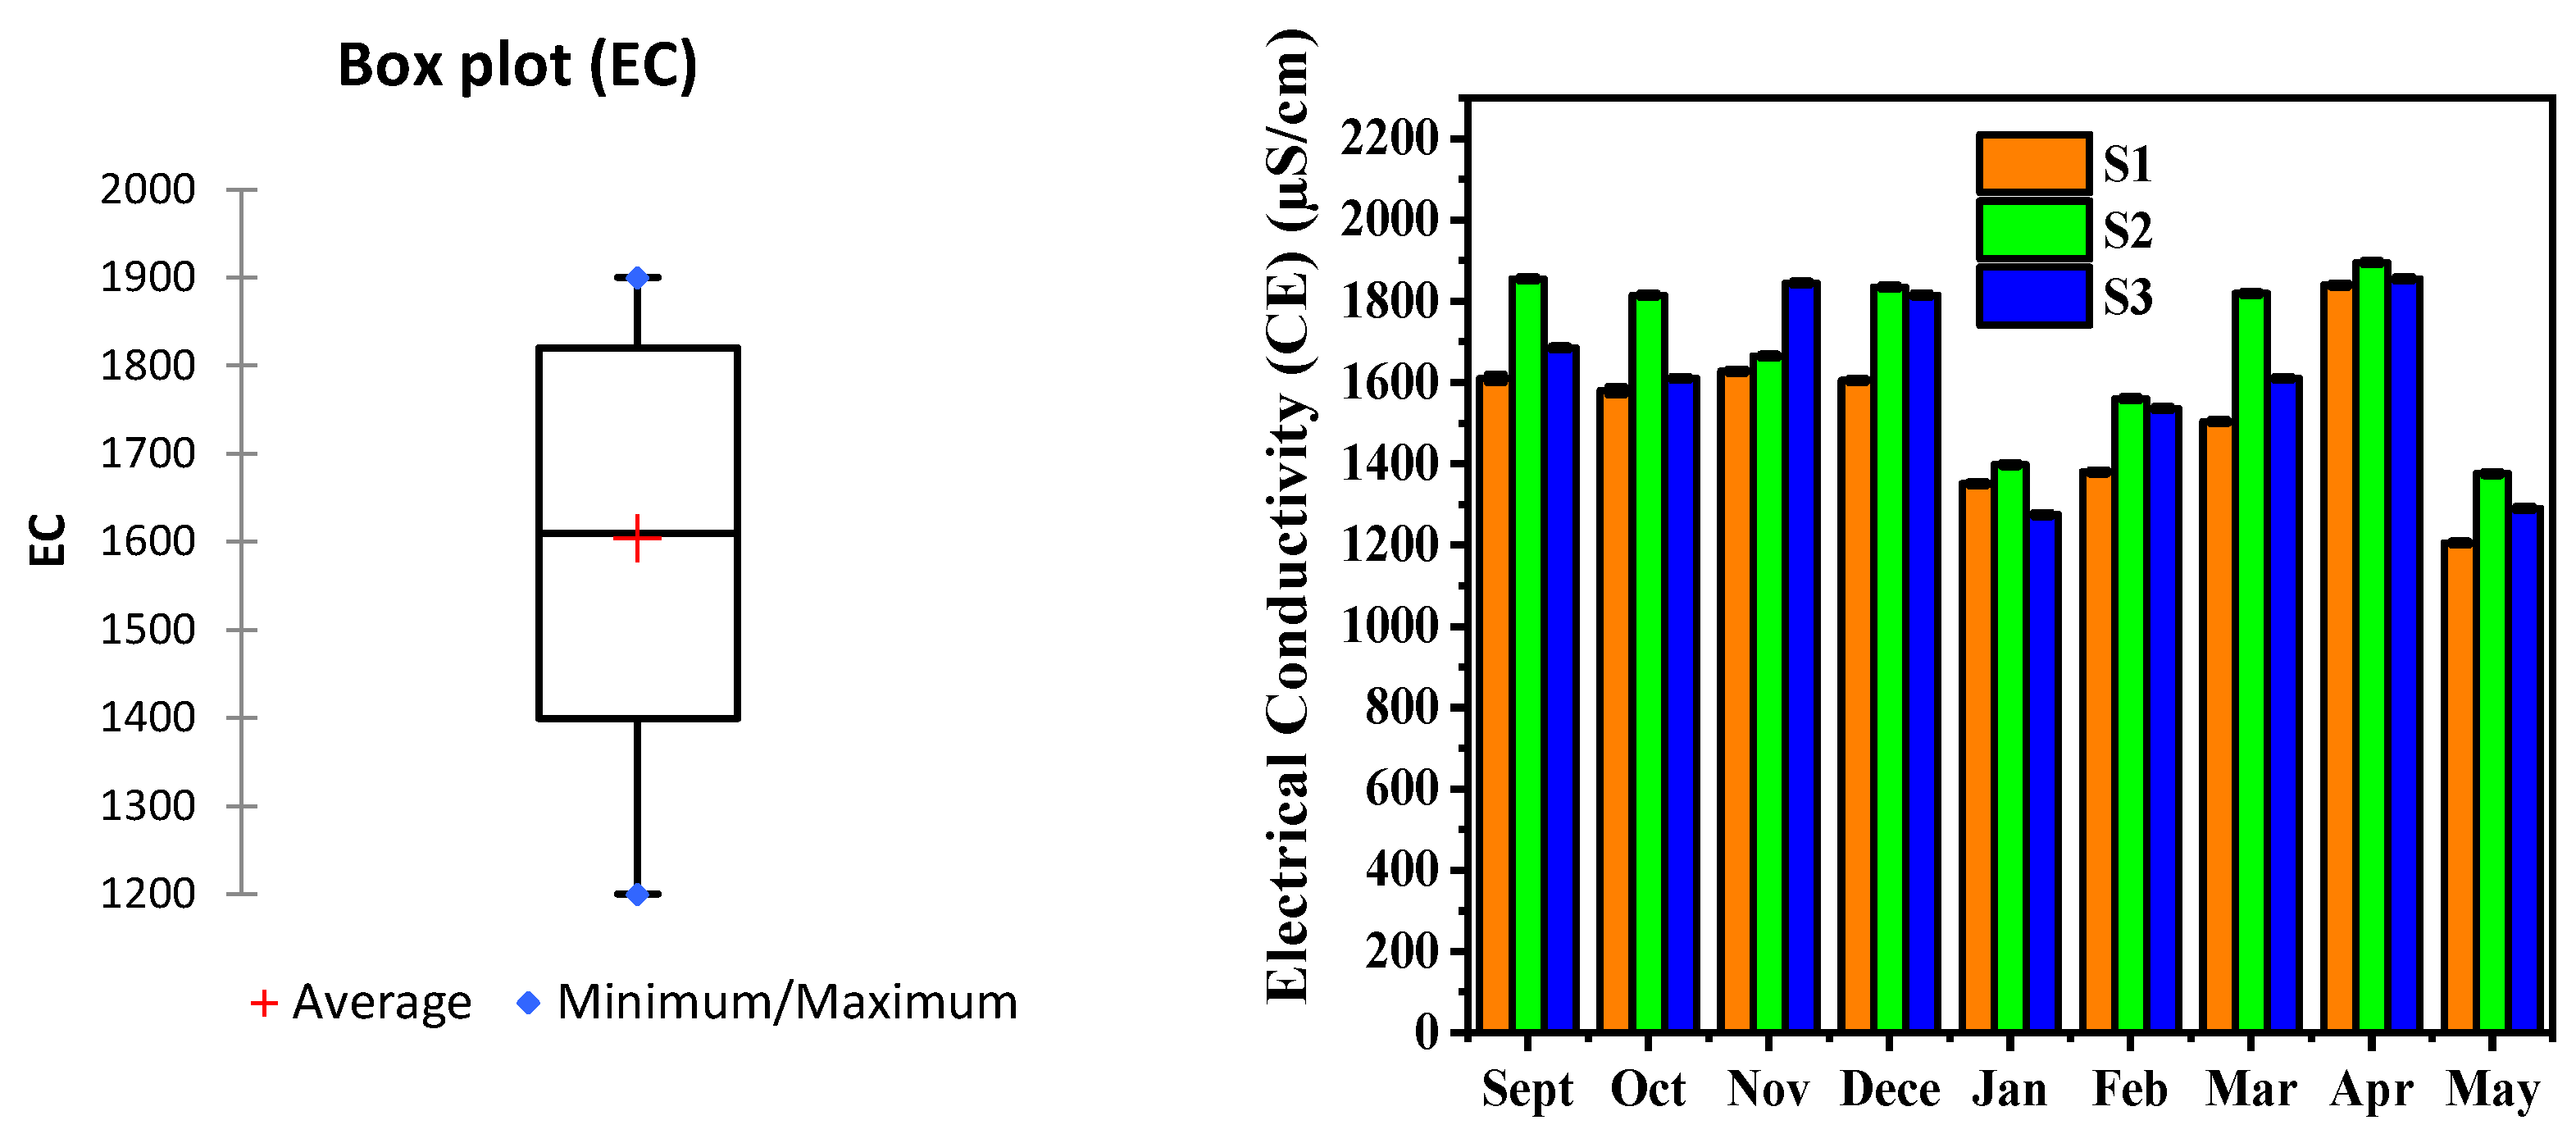
| Electrical conductivity (EC) (µS/cm) | 1513 ± 206 | 1726 ± 206 | 1632 ± 206 |
| Suspended solids (SS) (mg/L) | 181.04 ± 110.38 | 225.43 ± 110.38 | 194.25 ± 110.38 |
| Dissolved oxygen (DO) (mg/L) | 12.2 ± 5.26 | 5.7 ± 5.26 | 12.5 ± 5.26 |
| Nitrates (NO3−) (mg/L) | 3.69 ± 1.50 | 2.68 ± 1.50 | 3.17 ± 1.50 |
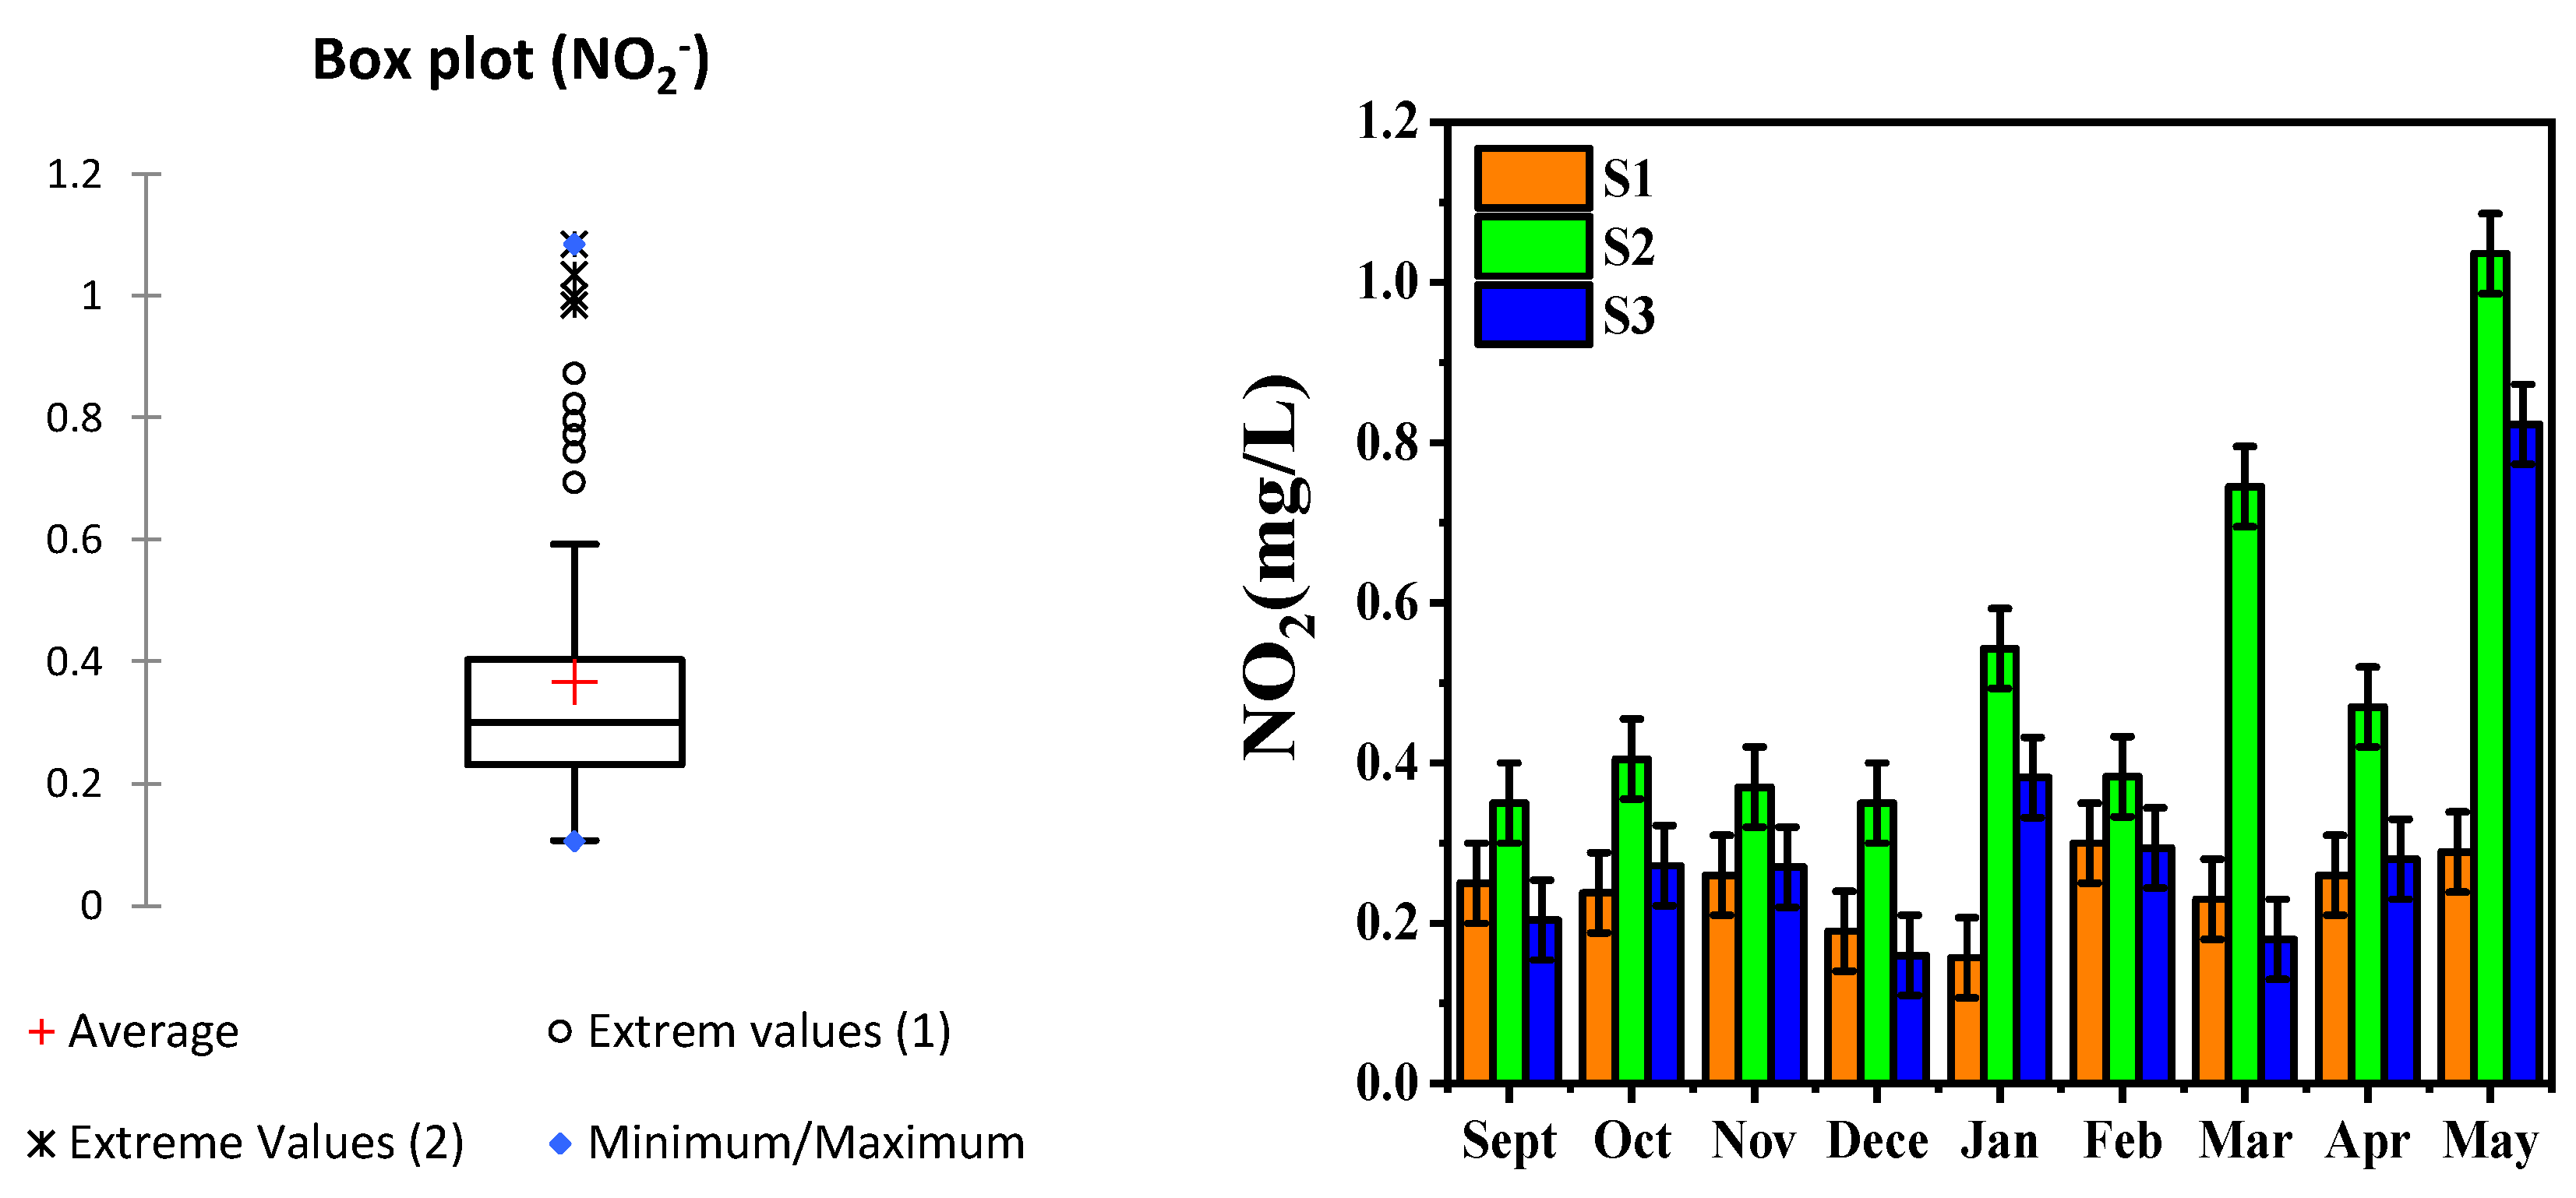
| Nitrites (NO2−) (mg/L) | 0.24 ± 0.22 | 0.47 ± 0.22 | 0.26 ± 0.22 |
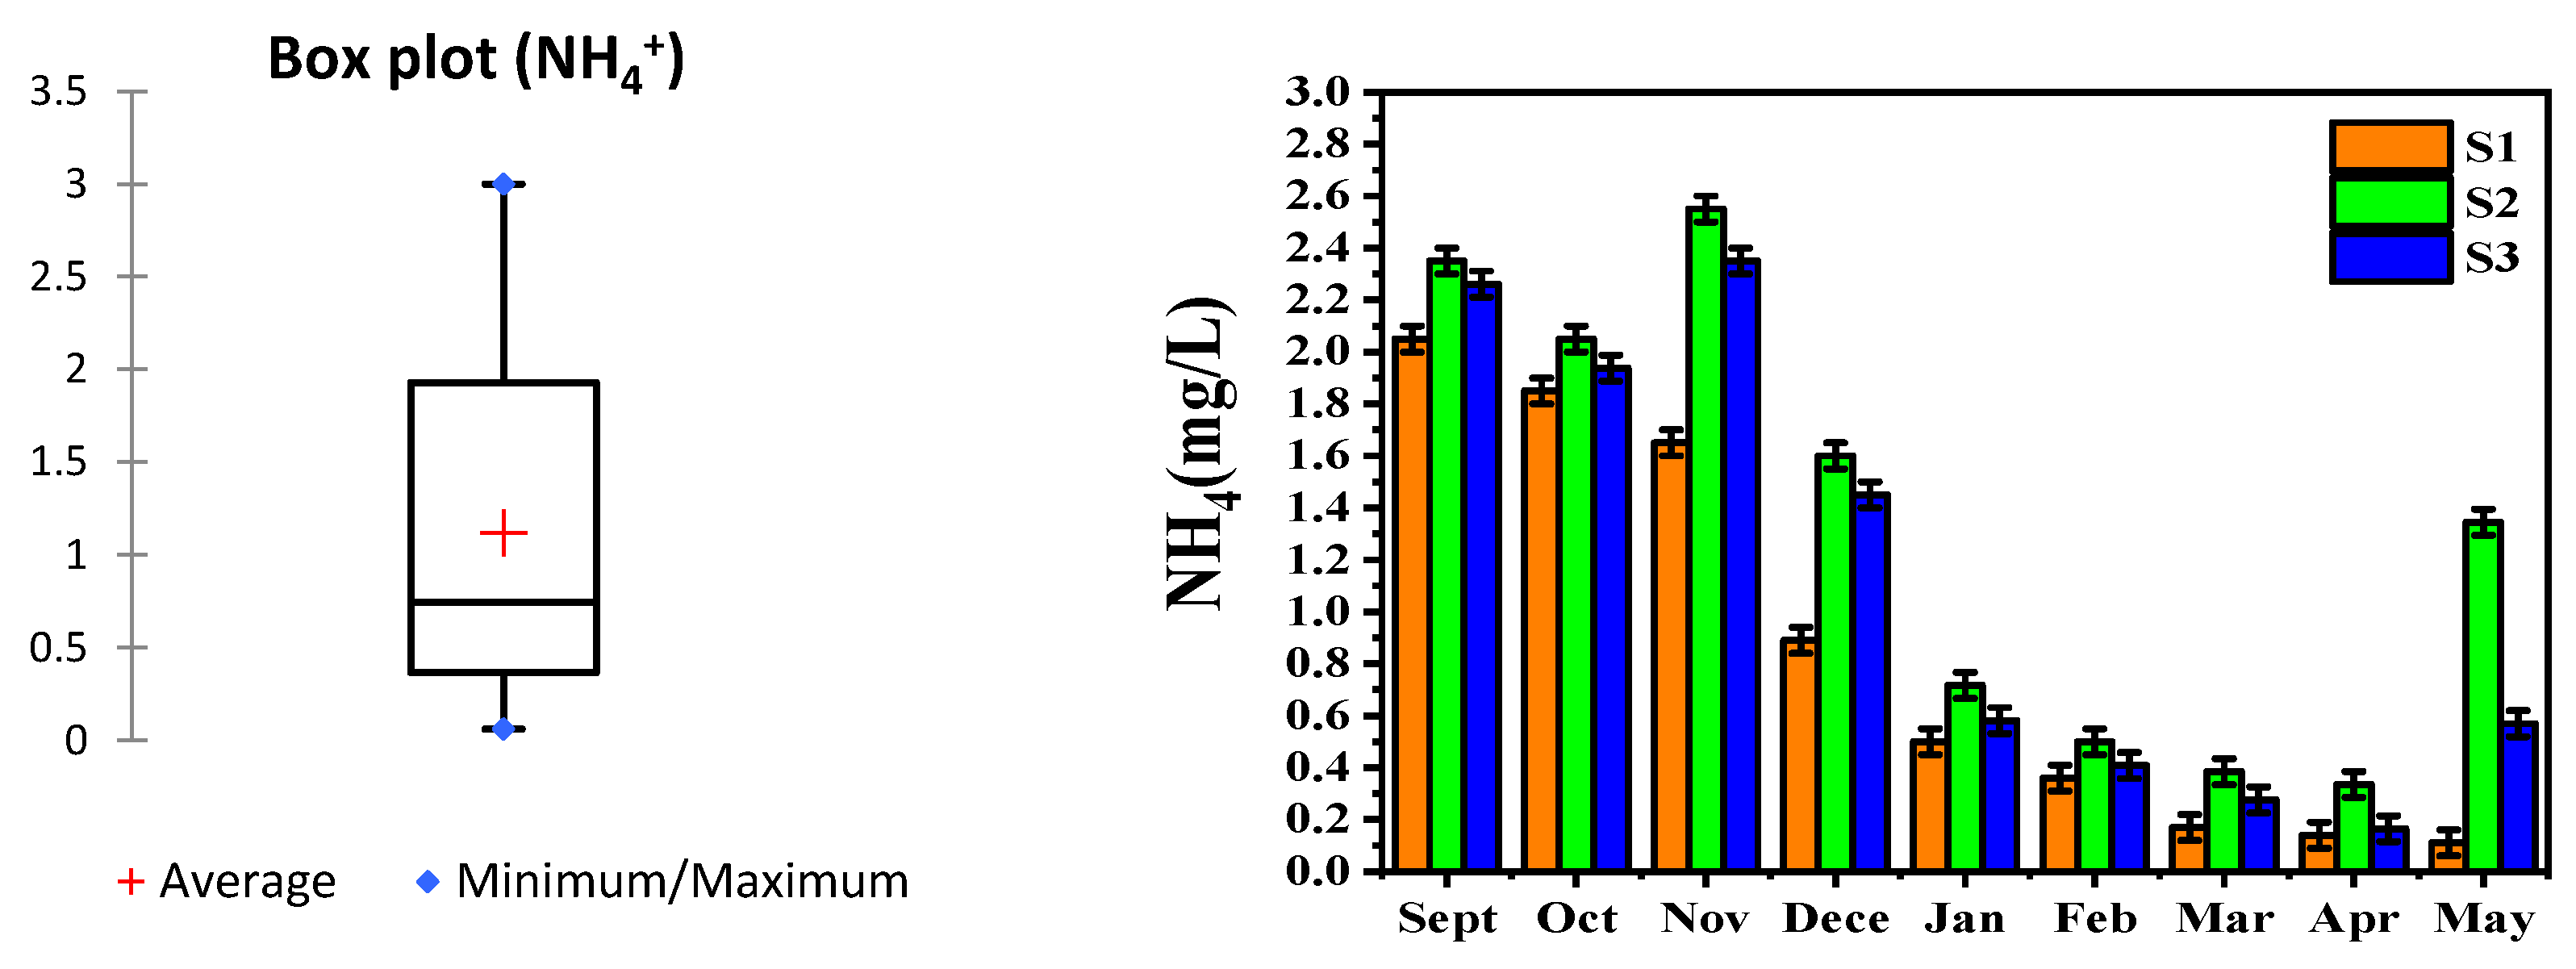
| Ammonium (NH4+) (mg/L) | 0.92 ± 0.85 | 1.47 ± 0.85 | 1.25 ± 0.85 |
| Phosphates (PO43−) (mg/L) | 0.73 ± 0.78 | 1.86 ± 0.78 | 1.11 ± 0.78 |
3.1.1. pH
3.1.2. Temperature
3.1.3. Salinity and Electrical Conductivity (Sal, EC)
3.1.4. Suspended Solids (SS)
3.1.5. Dissolved Oxygen (DO)
3.1.6. Nitrates (NO3−)
3.1.7. Nitrites (NO2−)
3.1.8. Ammonium (NH4+)
3.1.9. Phosphates (PO43−)
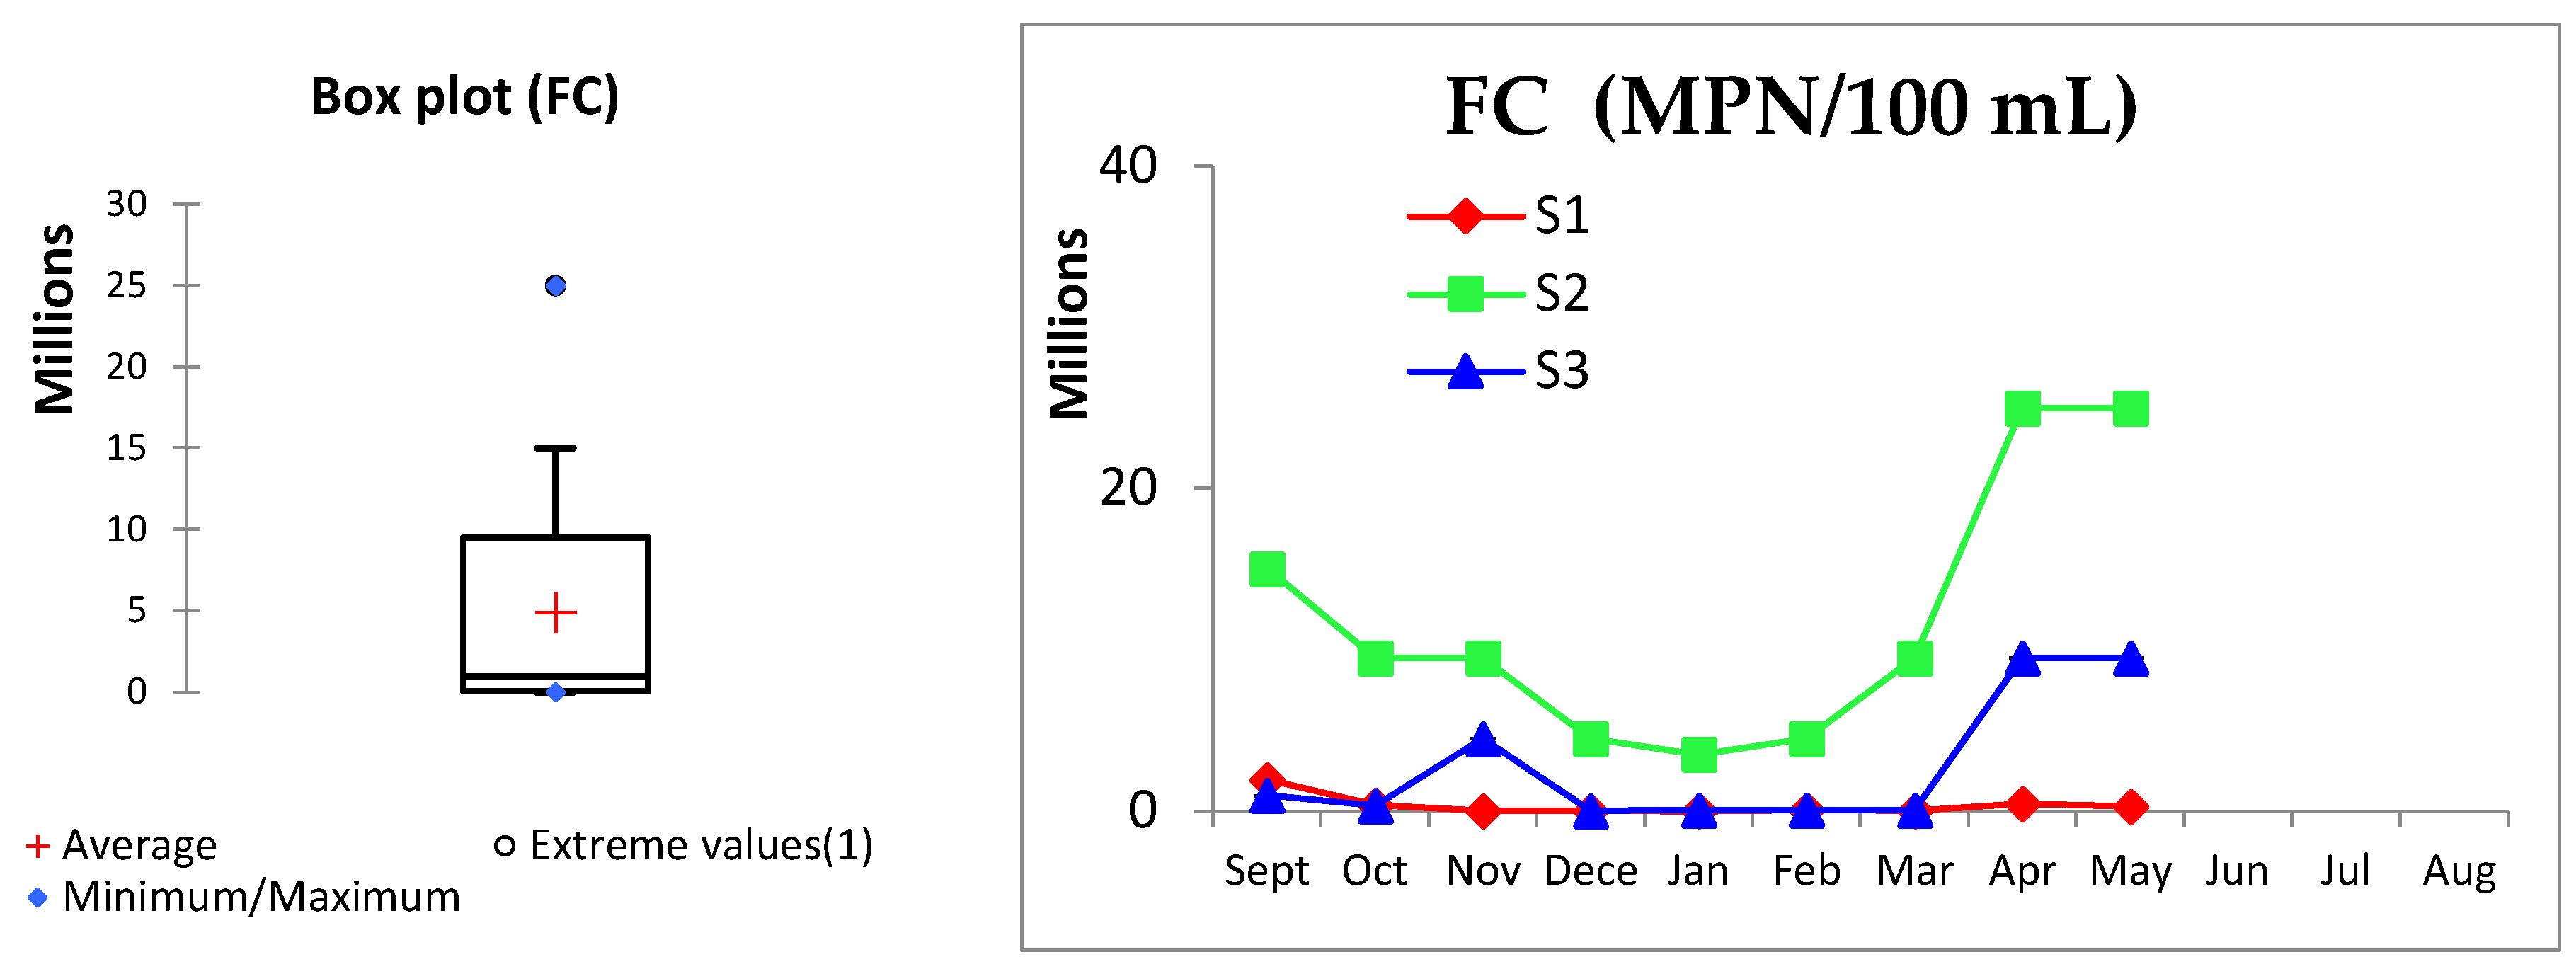
3.1.10. Microbiological Quality
3.1.11. ANOVA Analysis
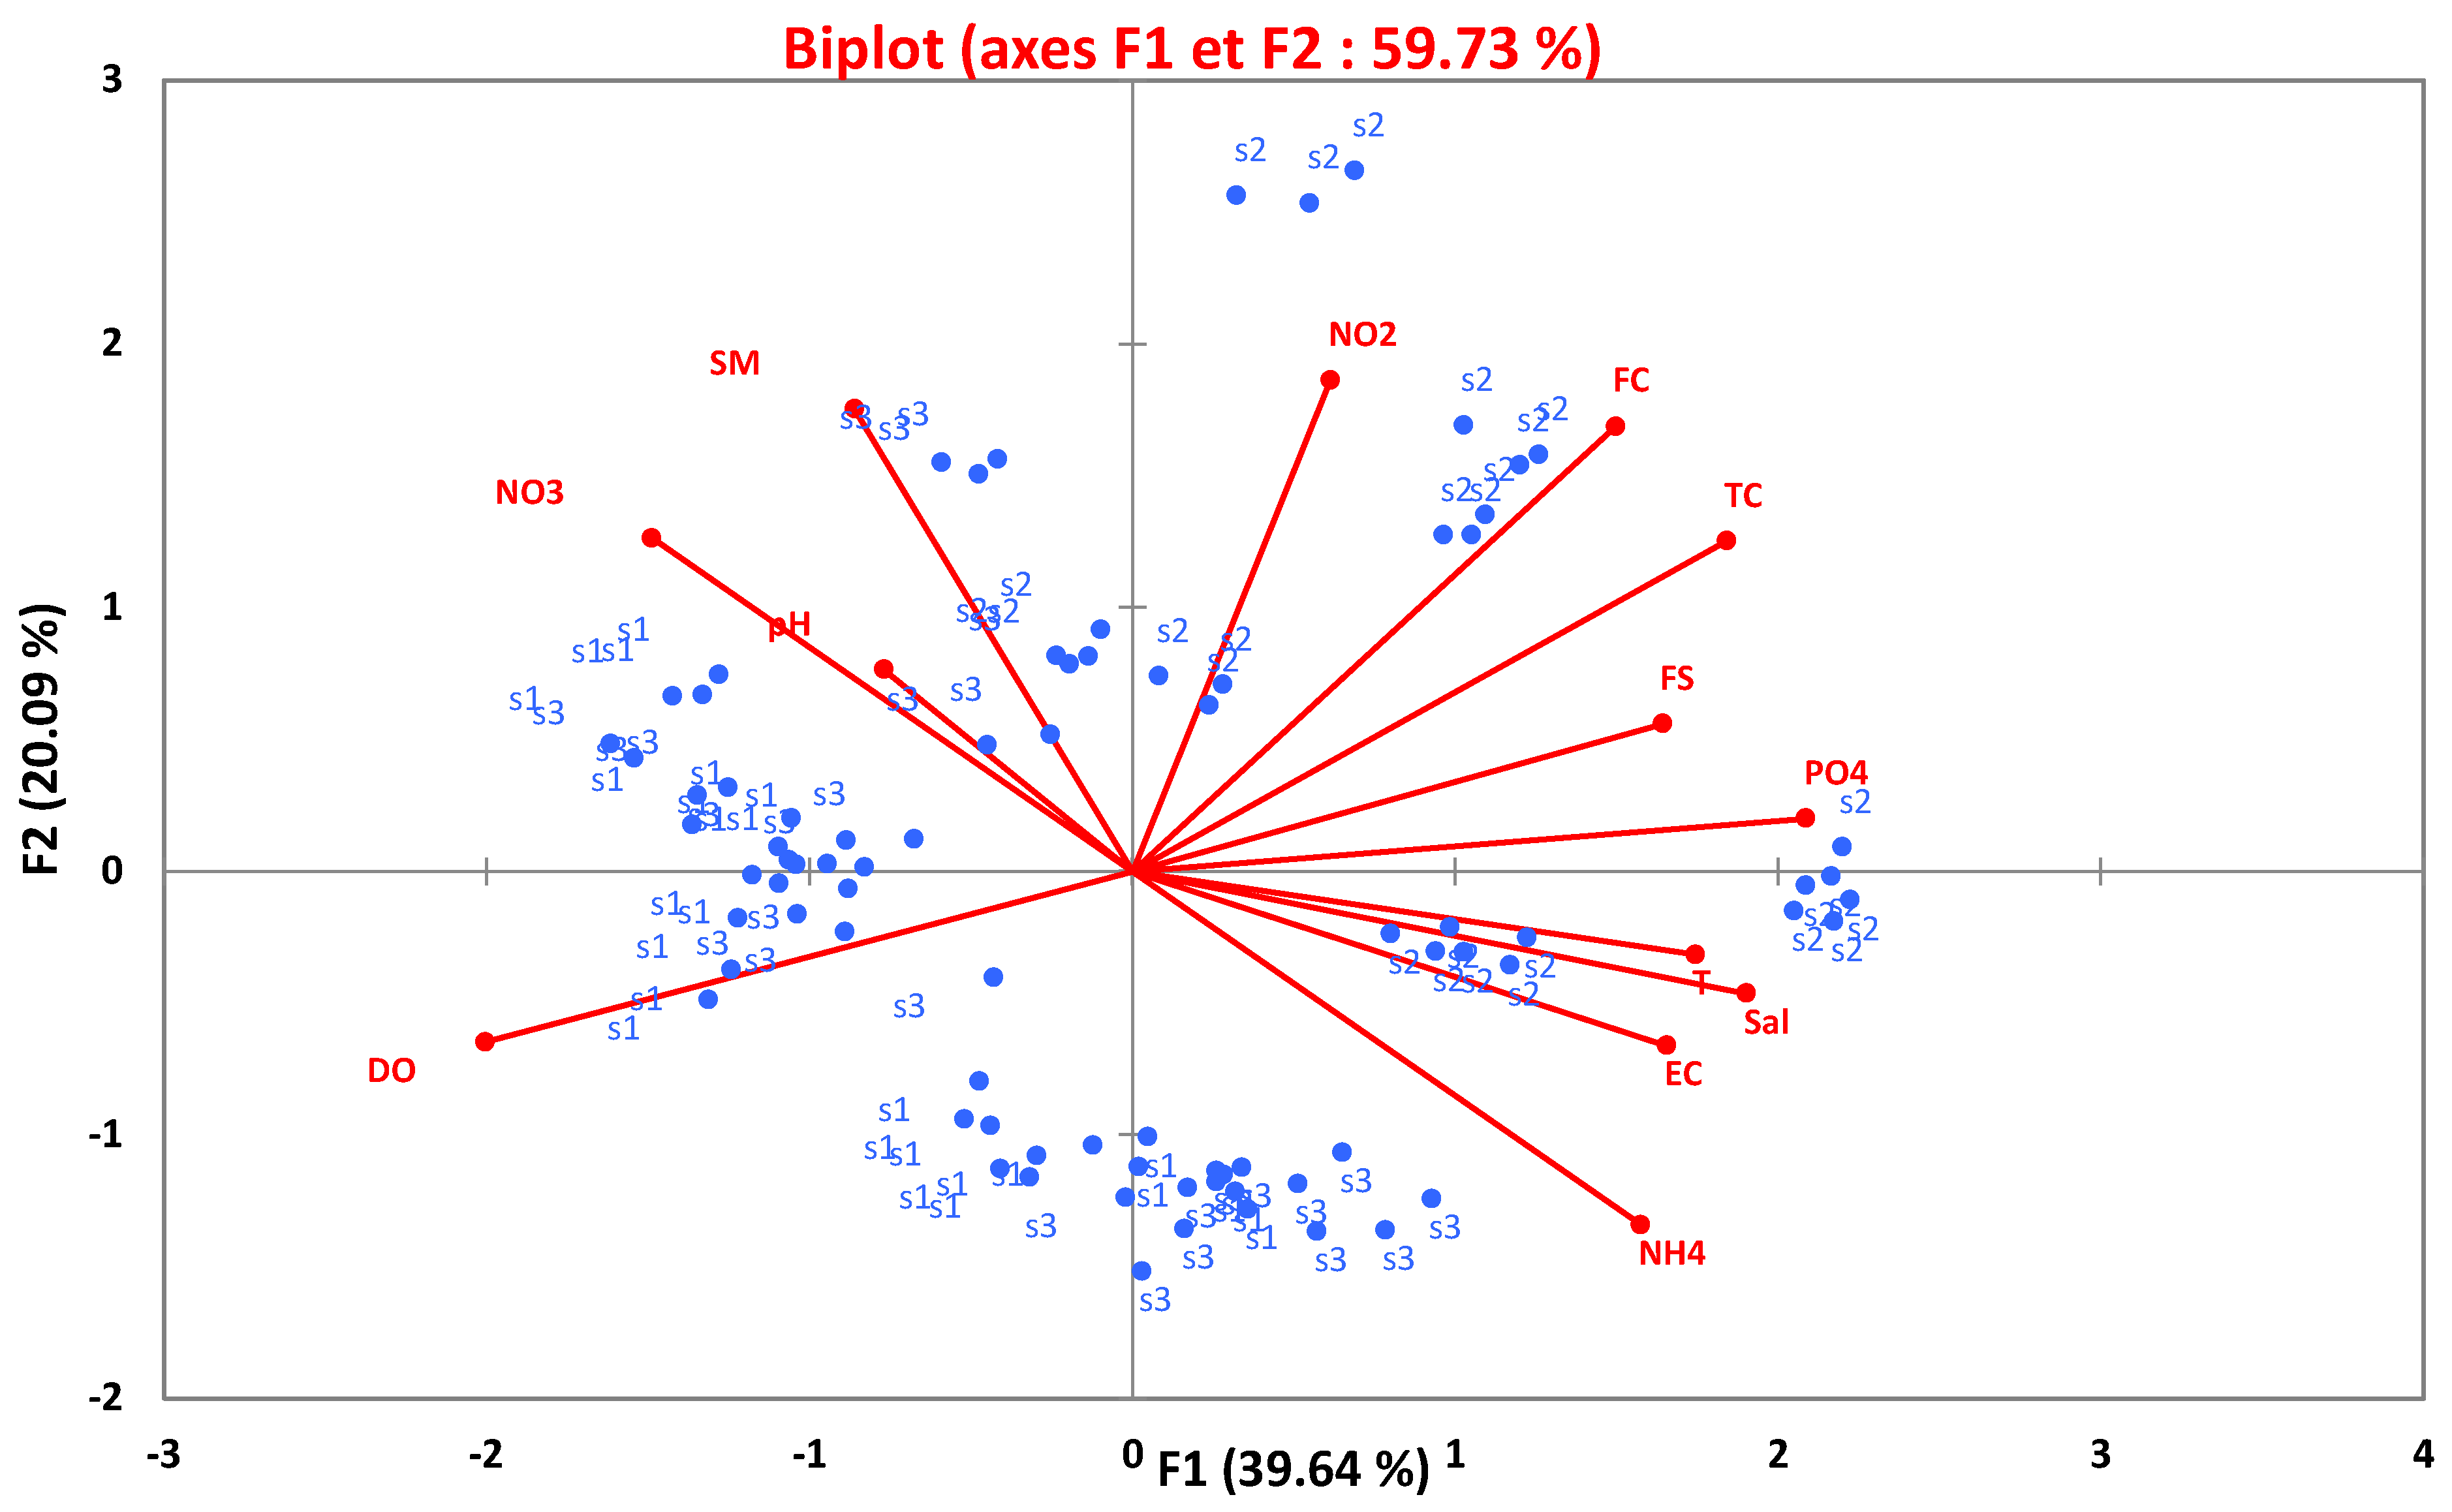
3.1.12. Principal Component Analysis (PCA)
- F1 (39.64%). The first principal axis (F1) explains 39.64% of the total variability of the data. It is strongly correlated with salinity, electrical conductivity, temperature, and phosphates. This suggests that F1 mainly represents the mineralization of the water, likely due to soil erosion, runoff, and wastewater inputs. Variables located in the positive quadrant of F1 are positively correlated with this component, signifying that they contribute to the increase in mineralization.
- F2 (20.09%). The second principal axis (F2) explains 20.09% of the total variability. It is strongly correlated with total coliforms, fecal coliforms, and fecal streptococci. This suggests that F2 mainly represents fecal contamination and the presence of organic matter in the water. Variables located in the positive quadrant of F2 are positively correlated with this component, indicating a higher fecal contamination.
- Differences between stations. The graph shows that Stations S1 (non-polluted control zone), S2 (wastewater discharge zone), and S3 (zone with reeds) cluster based on distinct trends. Station S1 is located more at the left of the graph, while Stations S2 and S3 are found at the right. This suggests that there are significant differences in water composition between stations.
- Impact of pollution. Station S1 is positioned more in the negative quadrant of F2, which is consistent with the notion that it is less impacted by fecal contamination and organic matter. Stations S2 and S3 are closer to the positive quadrant of F2, indicating a greater impact of fecal pollution.
- Seasonal influences. It is difficult to distinguish a clear separation of seasons on the graph. Observations from different seasons appear rather scattered, which might suggest that the impact of seasons on water quality is less important than the impact of stations.
- Direction and importance of variables. The red vectors indicate the direction and relative importance of each variable on the graph. Variables that are close to each other are highly correlated and evolve together, while variables that are far from each other have a weak correlation.
- Associations between variables. The graph clearly shows that salinity, electrical conductivity, temperature, and phosphates are strongly correlated. Total coliforms, fecal coliforms, and fecal streptococci are also strongly correlated.
- Important variables. The variables that mostly impact the two principal axes, F1 and F2, are salinity, electrical conductivity, phosphates, temperature, total coliforms, fecal coliforms, and fecal streptococci.
- The PCA analysis suggests that the quality of the Oued Zénati water varies considerably depending on the station. The upstream station (S1) is less impacted by fecal contamination and organic matter, while the downstream stations (S2 and S3) exhibit greater mineralization. Seasonal variations appear less pronounced than differences between stations.
- F1. The variables salinity, electrical conductivity, temperature, and phosphates are strongly correlated with F1, suggesting that this component represents the mineralization of the water.
- F2. The variables total coliforms, fecal coliforms, fecal streptococci, and ammonium are strongly correlated with F2, suggesting that this component represents fecal contamination and organic matter in the water.
4. Discussion
4.1. Context of Pollution and Study Site
4.2. Phytoremediation Mechanisms and Effectiveness
4.3. Future Applications and Recommendations
5. Conclusions
Author Contributions
Funding
Institutional Review Board Statement
Informed Consent Statement
Data Availability Statement
Acknowledgments
Conflicts of Interest
References
- UNESCO World Water Assessment Program. The United Nations World Water Development Report 2018: Nature-Based Solutions for Water; UNESCO: Paris, France, 2018; 139p. [Google Scholar]
- WHO Teamon Water, Sanitation, Hygiene and Health (WSH). Progress on Household Drinking Water, Sanitation and Hygiene 2000–2020: Five Years into the SDGs; WHO/UNICEF Joint Monitoring Programme for Water Supply, Sanitation and Hygiene (JMP): Geneva, Switzerland, 2020; 162p. [Google Scholar]
- Ben Amor, A.; Hemmami, H.; Zeghoud, S.; Ben Amor, I. Strength and limitation of nature-based solutions towards adaptation and mitigation of climate change in developing countries. In Blue-Green Infrastructure for Sustainable Urban Settlements: Implications for Developing Countries Under Climate Change; Joshi, P.K., Rao, K.S., Bhadouria, R., Tripathi, S., Singh, R., Eds.; Springer: Cham, Switzerland, 2024; pp. 3–30. [Google Scholar]
- Wang, H.; Yang, Q.; Ma, H.; Liang, J. Chemical compositions evolution of groundwater and its pollution characterization due to agricultural activities in Yinchuan plain, northwest China. Environ. Res. 2021, 200, 111449. [Google Scholar] [CrossRef] [PubMed]
- Bouchaala, L.; Charchar, N.; Gherib, A.E. Ressources hydriques: Traitement et reutilisation des eaux usees en Algerie. Alger. J. Arid Environ. 2017, 7, 84–95. [Google Scholar] [CrossRef]
- Burić, D.; Ristić, M.; Ćurčić, S. Wastewater treatment: A review of conventional and advanced methods. J. Environ. Manag. 2023, 336, 117384. [Google Scholar]
- Bouchaala, L.; Charchar, N.; Sahraoui, H.; Gherib, A. Assessment of wastewater biological treatment efficiency and mapping of WWTPs and LTPs in Algeria. J. Environ. Health Sci. Eng. 2021, 19, 1153–1169. [Google Scholar] [CrossRef]
- Baziz, D.; Maazouzi, A.; Lachache, S. Physical-chemical characterisation of the urban wastewater—Case study of the Boumerdes region, North–Algeria. J. Water Land Dev. 2022, 54, 243–250. [Google Scholar] [CrossRef]
- Moussaoui, T.; Derdour, A.; Hosni, A.; Santos, M.; Legua, P.; Pardo-Picazo, M. Assessing the quality of treated wastewater for irrigation: A case study of Ain Sefra wastewater treatment plant. Sustainability 2023, 15, 11133. [Google Scholar] [CrossRef]
- Cardiff, M.; Schachter, L.; Krause, J.; Gotkowitz, M.; Austin, B.C. Quantifying annual nitrogen loss to groundwater via edge-of-field monitoring: Method and application. Water Resour. Res. 2022, 58, e2021WR031674. [Google Scholar] [CrossRef]
- He, S.; Li, Y.; Mu, H.; Zhao, Z.; Wang, J.; Liu, S.; Sun, Z.; Zheng, M. Ammonium concentration determines differential growth of comammox and canonical ammonia-oxidizing prokaryotes in soil microcosms. ISME J. 2021, 15, 3669–3681. [Google Scholar] [CrossRef]
- Ahmed, N.K.; Lin, Q. Dissolved oxygen dynamics and its impacts on the health of aquatic ecosystems. Ecol. Process. 2021, 10, 1–13. [Google Scholar]
- Khedidja, S.; Boudoukha, A. Contribution to the assessment of water quality of some rivers of eastern Algeria: Case of Oued El Hammam (Khenchela). J. Water Land Dev. 2019, 23, 141–150. [Google Scholar]
- Ababsa, N.; Kribaa, M.; Tamrabet, L.; Addad, D.; Hallaire, V.; Ouldjaoui, A. Long-term effects of wastewater reuse on hydro physicals characteristics of grassland grown soil in semi-arid Algeria. J. King Saud Univ.-Sci. 2020, 32, 1004–1013. [Google Scholar] [CrossRef]
- Wang, W.; Wang, S.; Jiang, X.; Zheng, B.; Zhao, L.; Zhang, B.; Chen, J. Differences in fluorescence characteristics and bioavailability of water-soluble organic matter (WSOM) in sediments and suspended solids in Lihu Lake, China. Environ. Sci. Pollut. Res. 2018, 25, 12648–12662. [Google Scholar] [CrossRef] [PubMed]
- Mherzi, N.; Lamchouri, F.; Toufik, H. Assessment of the effects of seasonal changes, urban discharges and leachates on the parasitological and bacteriological qualities of soil and water from Oued Larbaâ (North-eastern, Morocco). Environ. Monit. Assess. 2021, 193, 628. [Google Scholar] [CrossRef]
- Boutin, C.; Bois, J.-S.; Bouvard, V.; Cadic, G.; Dodane, P.H.; Iwema, A.; Lapauze, P.; Lesavre, J.; Pigneur, Y.; Savoye, D.; et al. Cadre guide pour un Cahier des Clauses Techniques Particulières (CCTP) Filtres Plantés de Roseaux; Ministère de l’Agriculture, CGGAER/Pôle d’Appui Technique: Paris, France, 2007; 76p. [Google Scholar]
- Cherchar, S.; Boutin, C.; Molle, P. Les filtres plantés de roseaux pour l’épuration des eaux usées domestiques en régions méditerranéennes: Etat des lieux. Sécheresse 2005, 16, 323–330. [Google Scholar]
- Assegide, E.; Alamirew, T.; Bayabil, H.; Dile, Y.; Tessema, B.; Zeleke, G. Impacts of surface water quality in the Awash river basin, Ethiopia: A systematic review. Front. Water 2022, 3, 790900. [Google Scholar] [CrossRef]
- Shine, S.; Muhamud, S.; Adanew, S.; Demelash, A.; Abate, M. Prevalence and associated factors of diarrhea among under-five children in Debre Berhan town, Ethiopia 2018: A cross sectional study. BMC Infect. Dis. 2020, 20, 174. [Google Scholar] [CrossRef]
- Dagher, L.A.; Hassan, J.; Kharroubi, S.; Jaafar, H.; Kassem, I. Nationwide assessment of water quality in rivers across Lebanon by quantifying fecal indicators densities and profiling antibiotic resistance of Escherichia coli. Antibiotics 2021, 10, 883. [Google Scholar] [CrossRef]
- Karaca, C.; Hüner, T.; Mercimek Takci, H.A. Antibiotic susceptibility profiles of Escherichia coli strains and fecal contamination in Orontes river, Turkey. Int. J. Life Sci. Biotechnol. 2023, 6, 66–76. [Google Scholar] [CrossRef]
- Bwire, G.; Sack, D.A.; Kagirita, A.; Obala, T.; Debes, A.K.; Ram, M.; Komakech, H.; George, C.M.; Orach, C.G. The quality of drinking and domestic water from the surface water sources (lakes, rivers, irrigation canals and ponds) and springs in cholera prone communities of Uganda: An analysis of vital physicochemical parameters. BMC Pub. Health 2020, 20, 1128. [Google Scholar] [CrossRef]
- Li, Y.; Zhang, C.; Wang, X.; Liao, X.; Zhong, Q.; Zhou, T.; Gu, F.; Zou, H. Pollutant impacts on bacteria in surface water and sediment: Conventional versus emerging pollutants in Taihu Lake, China. Environ. Pollut. 2023, 323, 121334. [Google Scholar] [CrossRef]
- Brumfield, K.D.; Cotruvo, J.; Shanks, O.C.; Sivaganesan, M.; Hey, J.; Hasan, N.A.; Huq, A.; Colwell, R.R.; Leddy, M.B. Metagenomic sequencing and quantitative real-time PCR for fecal pollution assessment in an urban watershed. Front. Water 2021, 3, 626849. [Google Scholar] [CrossRef] [PubMed]
- Bayuo, J.; Rwiza, M.J.; Choi, J.W.; Njau, K.N.; Mtei, K.M. Recent and sustainable advances in phytoremediation of heavy metals from wastewater using aquatic plant species: Green approach. J. Environ. Manag. 2024, 370, 122523. [Google Scholar] [CrossRef] [PubMed]
- Hammadi, B.; Hadj Seyd, A.; Bebba, A.A. Performance assessment of nitrogen pollution purification by phytodepuration: Case of Temacine pilot station (Algeria). Int. J. Environ. Sci. Technol. 2019, 16, 6647–6656. [Google Scholar] [CrossRef]
- Benchaiba, M. Les risques d’inondations dans le bassin versant de l’oued Seybouse: Exemple du sous bassin versant de l’Oued Zenati. Master’s Thesis, Mentouri University, Constantine, Algeria, 2006. [Google Scholar]
- Zeghaba, N.; Laraba, A. The principal components analysis (PCA) to evaluate the quality of water of the Bouhamdane river, Guelma (north-east Algerian). J. Fundam. Appl. Sci. 2018, 10, 383–395. [Google Scholar]
- Rodier, J.; Legube, B.; Merlet, N. L’analyse de l’eau: Eaux Naturelles, Eaux Résiduaires, Eau de Mer, 9th ed.; Dunod: Malakoff, France, 2009; 1600p. [Google Scholar]
- ISO 9308-2:2012; Water Quality—Enumeration of Escherichia coli and Coliform Bacteria—Part 2: Most Probable Number Method. ISO: Geneva, Switzerland, 2012.
- ISO 9308-3:1998; Water Quality—Detection and Enumeration of Escherichia coli and Coliform Bacteria—Part 3: Miniaturized Method (Most Probable Number) for the Detection and Enumeration of E. coli in Surface and Waste Water. ISO: Geneva, Switzerland, 1998.
- ISO 7899-2000; Water Quality—Detection and Enumeration of Intestinal Enterococci. ISO: Geneva, Switzerland, 2000.
- Dele-Alimi, T.O.; Ogunlowo, V.; Akpabio, C.A.; Awobode, H.O.; Anumudu, C.I. Physicochemical characteristics and heavy metals levels in surface waters from Aba-lla, Ibadan, Oyo state, Nigeria. J. Appl. Sci. Environ. Manag. 2023, 27, 1779–1784. [Google Scholar] [CrossRef]
- Benmarce, K.; Zighmi, K.; Hadji, R.; Hamed, Y.; Gentilucci, M.; Barbieri, M.; Pambianchi, G. Integration of GIS and Water-Quality Index for Preliminary Assessment of Groundwater Suitability for Human Consumption and Irrigation in Semi-Arid Region. Hydrology 2024, 11, 71. [Google Scholar] [CrossRef]
- Zhu, S.; Bonacci, O.; Oskoruš, D.; Hadzima-Nyarko, M.; Wu, S. Long term variations of river temperature and the influence of air temperature and river discharge: Case study of Kupa River watershed in Croatia. J. Hydrol. Hydromech. 2019, 67, 305–313. [Google Scholar] [CrossRef]
- Elfanssi, S.; Ouazzani, N.; Latrach, L.; Hejjaj, A.; Mandi, L. Phytoremediation of domestic wastewater using a hybrid constructed wetland in mountainous rural area. Int. J. Phytoremediat. 2018, 20, 75–87. [Google Scholar] [CrossRef]
- Hoshikawa, K.; Fujihara, Y.; Siev, S.; Arai, S.; Nakamura, T.; Fujii, H.; Sok, T.; Yoshimura, C. Characterization of total suspended solid dynamics in a large shallow lake using long-term daily satellite images. Hydrol. Process. 2019, 33, 2745–2758. [Google Scholar] [CrossRef]
- Banerjee, A.; Chakrabarty, M.; Rakshit, N.; Bhowmick, A.R.; Ray, S. Environmental factors as indicators of dissolved oxygen concentration and zooplankton abundance: Deep learning versus traditional regression approach. Ecol. Indic. 2019, 100, 99–117. [Google Scholar] [CrossRef]
- Surdyk, N.; Gourcy, L.; Bault, V. Nitrate transport in the chalk vadose zone in in Picardy (France). J. Hydrol. Reg. Stud. 2021, 37, 100867. [Google Scholar] [CrossRef]
- Bujnovský, R.; Koco, Š.; Cibulka, R.; Vranovská, A.; Vrablíková, D. Nitrate concentration in leachate—Essential information for reducing nitrogen surplus and groundwater pollution from agricultural land in Slovakia. Water 2022, 14, 1043. [Google Scholar] [CrossRef]
- Yan, A.; Guo, X.; Hu, D. Reactive transport of NH4+ in the hyporheic zone from the ground water to the surface water. Water 2022, 14, 1236. [Google Scholar] [CrossRef]
- Ge, X.; Chen, X.; Liu, M.; Wang, C.; Zhang, Y.; Wang, Y.; Tran, H.-T.; Joseph, S.; Zhang, T. Toward a better understanding of phosphorus nonpoint source pollution from soil to water and the application of amendment materials: Research trends. Water 2023, 15, 1531. [Google Scholar] [CrossRef]
- Zhang, H.; Zhou, X.; Lv, X.; Xu, X.; Weng, Q.; Lei, K. Exploration of the factors that influence total phosphorus in surface water and an evaluation of surface water vulnerability based on an advanced algorithm and traditional index method. J. Environ. Manag. 2023, 342, 118155. [Google Scholar] [CrossRef]
- Hasan, M.F.; Nur-E-Alam, M.; Salam, M.A.; Rahman, H.; Paul, S.C.; Rak, A.E.; Ambade, B.; Islam, A.R.M.T. Health risk and water quality assessment of surface water in an urban river of Bangladesh. Sustainability 2020, 13, 6832. [Google Scholar] [CrossRef]
- Mamine, N.; Khaldi, F.; Grara, N. Survey of the physico-chemical and parasitological quality of the wastewaters used in irrigation (Souk Ahras, north-east of Algeria). Iran. J. Energy Environ. 2020, 11, 79–88. [Google Scholar]
- Milke, J.; Gałczyńska, M.; Wróbel, J. The importance of biological and ecological properties of Phragmites australis (Cav.) Trin. ex Steud., in phytoremendiation of aquatic ecosystems—The review. Water 2020, 12, 1770. [Google Scholar] [CrossRef]
- Kuwayama, Y.; Olmstead, S.M.; Wietelman, D.C.; Zheng, J. Trends in nutrient-related pollution as a source of potential water quality damages: A case study of Texas, USA. Sci. Total Environ. 2020, 724, 137962. [Google Scholar] [CrossRef]
- Xing, X.; Li, T.; Bi, Z.; Qi, P.; Li, Z.; Chen, Y.; Zhou, H.; Wang, H.; Xu, G.; Chen, C.; et al. Destruction of microbial stability in drinking water distribution systems by trace phosphorus polluted water source. Chemosphere 2021, 275, 130032. [Google Scholar] [CrossRef]
- Mamine, N.; Grara, N.; Khaldi, F. The use of macrophyte Typha latifolia filters in the treatment of wastewaters of Medjerda River, in Souk-Ahras city (north-east Algeria). Stud. Univ. Vasile Goldiş Ser. Ştiinţele Vieţii 2019, 29, 70–81. [Google Scholar]
- Elsayed, S.; Hussein, H.; Moghanm, F.S.; Khedher, K.M.; Eid, E.M.; Gad, M. Application of Irrigation Water Quality Indices and Multivariate Statistical Techniques for Surface Water Quality Assessments in the Northern Nile Delta, Egypt. Water 2020, 12, 3300. [Google Scholar] [CrossRef]
- Gad, M.; Elsayed, S.; Moghanm, F.S.; Almarshadi, M.H.; Alshammari, A.S.; Khedher, K.M.; Eid, E.M.; Hussein, H. Combining water quality indices and multivariate modeling to assess surface water quality in the northern Nile delta, Egypt. Water 2020, 12, 2142. [Google Scholar] [CrossRef]
- Adesakin, T.; Oyewale, A.; Bayero, U.; Mohammed, A.; Aduwo, I.; Ahmed, P.; Abubakar, N.; Barje, I. Assessment of bacteriological quality and physico-chemical parameters of domestic water sources in Samaru community, Zaria, Northwest Nigeria. Heliyon 2020, 6, e04773. [Google Scholar] [CrossRef]
- Wu, J.; Zhang, Y.; Wang, J.; Zheng, X.; Chen, Y. Municipal wastewater reclamation and reuse using membrane-based technologies: A review. Desalin. Water Treat. 2021, 224, 65–82. [Google Scholar] [CrossRef]
- Saba, A.O.; Yasin, I.S.M.; Azmai, M.N.A. Meta-analyses indicate that dietary probiotics significantly improve growth, immune response, and disease resistance in tilapia. Aquac. Int. 2024, 32, 4841–4867. [Google Scholar] [CrossRef]
- Hu, W.; Liang, J.; Ju, F.; Wang, Q.; Liu, R.; Bai, Y.; Liu, H.; Qu, J. Metagenomics Unravels Differential Microbiome Composition and Metabolic Potential in Rapid Sand Filters Purifying Surface Water Versus Groundwater. Environ. Sci. Technol. 2020, 54, 5197–5206. [Google Scholar] [CrossRef]
- Liu, J.; Peng, Y.; Li, C.; Gao, Z.; Chen, S. Characterization of the hydrochemistry of water resources of the Weibei Plain, Northern China, as well as an assessment of the risk of high groundwater nitrate levels to human health. Environ. Pollut. 2021, 268, 115947. [Google Scholar] [CrossRef]
- Yousefi, S.R.; Alshamsi, H.A.; Amiri, O.; Salavati-Niasari, M. Synthesis, characterization and application of Co/Co3O4 nanocomposites as an effective photocatalyst for discoloration of organic dye contaminants in wastewater and antibacterial properties. J. Mol. Liquids 2021, 337, 116405. [Google Scholar] [CrossRef]
- Peydayesh, M.; Suta, T.; Usuelli, M.; Handschin, S.; Canelli, G.; Bagnani, M.; Mezzenga, R. Sustainable removal of microplastics and natural organic matter from water by coagulation–flocculation with protein amyloid fibrils. Environ. Sci. Technol. 2021, 55, 8848–8858. [Google Scholar] [CrossRef]
- Asadollah, S.; Sharafati, A.; Motta, D.; Yaseen, Z. River water quality index prediction and uncertainty analysis: A comparative study of machine learning models. J. Environ. Chem. Eng. 2021, 9, 104599. [Google Scholar] [CrossRef]
- Fahid, M.; Arslan, M.; Shabir, G.; Younus, S.; Yasmeen, T.; Rizwan, M.; Siddique, K.; Ahmad, S.; Tahseen, R.; Iqbal, S.; et al. Phragmites australis in combination with hydrocarbons degrading bacteria is a suitable option for remediation of diesel-contaminated water in floating wetlands. Chemosphere 2020, 240, 124890. [Google Scholar] [CrossRef] [PubMed]
- García-Ávila, F.; Patiño-Chávez, J.; Zhinín-Chimbo, F.; Donoso-Moscoso, S.; Pino, L.; Avilés-Añazco, A. Performance of Phragmites australis and Cyperus papyrus in the treatment of municipal wastewater by vertical flow subsurface constructed wetlands. Int. Soil Water Conserv. Res. 2019, 7, 286–296. [Google Scholar] [CrossRef]
- Hu, X.; Xu, G.; Zhang, H.; Li, M.; Tu, Y.; Xie, X.; Zhu, Y.; Jiang, L.; Zhu, X.; Ji, X.; et al. Multifunctional β-Cyclodextrin Polymer for Simultaneous Removal of Natural Organic Matter and Organic Micropollutants and Detrimental Microorganisms from Water. ACS Appl. Mater. Interfaces 2020, 12, 12165–12175. [Google Scholar] [CrossRef]


| Parameter | S1 (Non-Polluted) | S2 (Wastewater Discharges) | S3 (Reeds) |
|---|---|---|---|
| Total coliforms (TC) (MPN/100 mL) | 7.7 × 10⁵ ± 9.9 × 10⁵ | 32 × 106 ± 18 × 106 | 16 × 106 ± 12 × 106 |
| Fecal coliforms (FC) (MPN/100 mL) | 25 × 103 ± 105 | 9.5 × 10⁵ ± 3 × 10⁵ | 1.5 × 10⁵ ± 5 × 10⁴ |
| Fecal streptococci (FS) (MPN/100 mL) | 1.5 × 10² ± 5 × 10² | 2.4 × 10⁴ ± 8 × 10² | 3 × 10³ ± 103 |
| Parameter | F | Pr > F | Significant |
|---|---|---|---|
| Temperature | 6.075 | 0.004 | Yes |
| pH | 0.877 | 0.420 | No |
| Salinity (Sal) | 13.629 | <0.0001 | Yes |
| Electrical conductivity (EC) | 4.936 | 0.010 | Yes |
| Suspended solids (SS) | 1.540 | 0.221 | No |
| Dissolved oxygen (DO) | 51.178 | <0.0001 | Yes |
| Phosphates (PO43−) | 46.067 | <0.0001 | Yes |
| Nitrites (NO2−) | 14.294 | <0.0001 | Yes |
| Nitrates (NO3−) | 3.295 | 0.042 | Yes |
| Ammonium (NH4+) | 2.112 | 0.128 | No |
| Total coliforms (TC) | 112.124 | <0.0001 | Yes |
| Fecal coliforms (FC) | 37.811 | <0.0001 | Yes |
| Fecal streptococci (FS) | 24.063 | <0.0001 | Yes |
| Variable | F1 | F2 |
|---|---|---|
| Temperature | 0.694 | −0.126 |
| pH | −0.306 | 0.305 |
| Salinity (Sal) | 0.757 | −0.185 |
| Electrical conductivity (EC) | 0.659 | −0.263 |
| Solid substances (SS) | −0.343 | 0.698 |
| Dissolved oxygen (DO) | −0.798 | −0.258 |
| Phosphate (PO43−) | 0.831 | 0.080 |
| Nitrite (NO2−) | 0.244 | 0.742 |
| Nitrate (NO3−) | −0.593 | 0.503 |
| Ammonium (NH4+) | 0.627 | −0.534 |
| Total coliforms (TC) | 0.733 | 0.499 |
| Fecal coliforms (FC) | 0.596 | 0.672 |
| Fecal streptococci (FS) | 0.654 | 0.223 |
Disclaimer/Publisher’s Note: The statements, opinions and data contained in all publications are solely those of the individual author(s) and contributor(s) and not of MDPI and/or the editor(s). MDPI and/or the editor(s) disclaim responsibility for any injury to people or property resulting from any ideas, methods, instructions or products referred to in the content. |
© 2025 by the authors. Licensee MDPI, Basel, Switzerland. This article is an open access article distributed under the terms and conditions of the Creative Commons Attribution (CC BY) license (https://creativecommons.org/licenses/by/4.0/).
Share and Cite
Bouchaala, L.; Charchar, N.; Grara, N.; Amor, I.B.; Zeghoud, S.; Hemmami, H.; Houhamdi, M.; Szparaga, A.; Murariu, O.C.; Caruso, G.; et al. Assessing the Efficiency of Phragmites australis in Wastewater Treatment as a Natural Approach to Water Quality Improvement. Sustainability 2025, 17, 1102. https://doi.org/10.3390/su17031102
Bouchaala L, Charchar N, Grara N, Amor IB, Zeghoud S, Hemmami H, Houhamdi M, Szparaga A, Murariu OC, Caruso G, et al. Assessing the Efficiency of Phragmites australis in Wastewater Treatment as a Natural Approach to Water Quality Improvement. Sustainability. 2025; 17(3):1102. https://doi.org/10.3390/su17031102
Chicago/Turabian StyleBouchaala, Laid, Nabil Charchar, Nedjoud Grara, Ilham Ben Amor, Soumeia Zeghoud, Hadia Hemmami, Moussa Houhamdi, Agnieszka Szparaga, Otilia Cristina Murariu, Gianluca Caruso, and et al. 2025. "Assessing the Efficiency of Phragmites australis in Wastewater Treatment as a Natural Approach to Water Quality Improvement" Sustainability 17, no. 3: 1102. https://doi.org/10.3390/su17031102
APA StyleBouchaala, L., Charchar, N., Grara, N., Amor, I. B., Zeghoud, S., Hemmami, H., Houhamdi, M., Szparaga, A., Murariu, O. C., Caruso, G., & Bellucci, S. (2025). Assessing the Efficiency of Phragmites australis in Wastewater Treatment as a Natural Approach to Water Quality Improvement. Sustainability, 17(3), 1102. https://doi.org/10.3390/su17031102