1. Introduction
Machine learning (ML) has become an integral part of various domains, including marketing, finance, healthcare, security, engineering, education, and governmental functions. By enabling advanced analytics, ML simplifies complex tasks and boosts overall efficiency. Its ability to uncover meaningful patterns from data has established it as a cornerstone of contemporary data science, allowing practitioners to extract actionable insights [
1]. J.V. Snellman [
2], a distinguished philosopher and politician, famously remarked that “Education is security for a small nation.” This idea aligns with the perspective of the Global Partnership for Education [
3], which underscores the pivotal role of education in alleviating poverty, fostering economic development, and enhancing individual incomes. Furthermore, education contributes to improved public health, reduced child mortality, combatting diseases like AIDS and HIV, and advancing societal goals such as gender equality, ending child marriage, and promoting peace. For a nation to remain resilient and forward-looking, it must incorporate innovative methodologies within its educational framework. One such methodology is data mining, which has shown great promise in higher education by identifying trends, automating routine tasks, assisting in student counseling, and predicting academic success. Known as learning analytics (LA), this evolving discipline leverages data mining to analyze and interpret student data. By identifying behavioral patterns, offering actionable insights, and generating targeted recommendations, LA supports academic improvement, enhances educational quality, and facilitates customized interventions [
4].
The academic performance of students has long been a focus of research, with findings consistently utilized to enhance the quality of education. However, data from the Higher Educational Statistical Agency (HESA) [
5] indicate a troubling trend: dropout rates among undergraduate and postgraduate students have steadily increased over the past decade. On average, these rates have risen by 3% every two years. Moreover, notable disparities exist in students’ performance across universities, age groups, regions, and academic disciplines. This persistent issue highlights the ineffectiveness of previous interventions and underscores the urgent need for significant reforms in the academic sector to address attrition, boost student retention, and raise graduation rates. Additionally, existing predictive models in this area exhibit limited efficiency and accuracy, necessitating enhancements to deliver more reliable, real-time analyses and actionable insights.
In previous studies, performance prediction has been widely analyzed in multiple web-based systems like learning management systems [
6]. This was due to the accessibility of massive behavioral data, which was automatically collected by LMSs; for example, total visits and particular session times, most opened resources, results, participation in activities, and contribution in chats [
7]. Hence, the performance prediction methodologies built on LMSs’ logs have been anticipated in numerous studies [
8,
9,
10,
11,
12]. Apart from that, the logs grasped from intelligent tutoring systems have been exploited as well, in several studies [
13,
14,
15]. In contrast, the background, behavior, current degree, previous colleges, the study major, and sports activities are less focused in this regard. Theories such as Tinto’s model [
16] of student dropout highlights the critical role of academic and social integration in shaping student success. Building on this foundation, the present study leverages machine learning techniques to quantitatively analyze these relationships on a broader scale. By focusing on key predictors consistent with Tinto’s framework, this research aims to provide a deeper understanding of the factors influencing academic outcomes. To enhance the rigor of this study, many supplementary research questions were formulated: To what extent can socio-demographic variables influence the predictive efficacy of machine learning models for student success? Which feature engineering strategies are most efficacious in enhancing the predictive performance of student assessments? Consequently, these inquiries aim to foster a deeper understanding of the factors affecting academic outcomes and the strategies to enhance prediction accuracy in the future.
To define the study’s scope and objectives, the following research questions were formulated:
What factors significantly impact academic performance in Saudi higher education institutions?
How do socio-demographic variables affect machine learning model performance?
Which machine learning models are most effective for predicting academic outcomes in real time?
Specifically, this study questions the most significant factors influencing academic performance and investigates how machine learning models perform in predicting outcomes when socio-demographic variables and advanced feature engineering are integrated. At the end, this study directly addresses the posed research questions, with each analysis step and finding aligned to ensure that the objectives are met. This approach facilitates actionable insights, such as identifying key predictors of academic performance and determining the most effective machine learning models for real-time predictions.
This investigation bridges theoretical insights and practical applications, providing a foundation for data-driven strategies in educational transformation.
The performance of previous techniques has been less fortunate and lacks reuse in terms of accuracy and high false prediction rates. The major objective of this study is to provide a concrete model that can predict the performance of students precisely. Hence, the research problem focuses on understanding how to enhance the precision and applicability of predictive models in education while addressing socio-demographic disparities. This study’s objectives are to identify influential variables, optimize feature engineering techniques, and evaluate the effectiveness of different machine learning models in academic performance prediction. The research hypotheses are as follows:
Socio-demographic variables significantly contribute to the predictive accuracy of machine learning models.
Enhanced feature engineering techniques improve model performance across various algorithms.
XGBoost will outperform other models in achieving real-time predictive accuracy.
Building on these hypotheses, this study outlines key contributions aimed at advancing the predictive modeling of student performance. By integrating socio-demographic variables and employing advanced feature engineering techniques, we address critical gaps identified in previous research. Additionally, the evaluation of multiple machine learning models, with a focus on XGBoost, highlights the potential for real-time predictive applications in education. These contributions not only validate the hypotheses but also provide actionable insights and frameworks that can be directly implemented to enhance academic success and institutional decision-making.
Moreover, this study addresses the critical need for accurate and interpretable predictive models to improve academic outcomes in higher education. Despite advancements in machine learning applications, existing research often overlooks the integration of socio-demographic variables and the real-time usability of models. To bridge this gap, this study aims to develop and evaluate machine learning frameworks that incorporate these factors for predictive accuracy and actionable insights.
The rest of this paper is ordered into four main sections.
Section 2 conveys the related work in the particular domain (LA), their application, and their shortcomings, which led us towards this study.
Section 3 provides information about the used methodology in terms of various classification algorithms.
Section 4 describes the experimental setup of each model with their respective results. Finally,
Section 5 concludes this paper with a concrete mode and the findings highlighted during this study.
2. Related Work
Recent research in educational data mining (EDM) has explored various machine learning (ML) techniques for predicting academic performance and enhancing learning outcomes. For example, Lin et al. [
17] developed a deep learning-based framework using convolutional neural networks (CNNs) to predict student success in online learning environments. The study demonstrated the ability of CNNs to process high-dimensional educational data effectively, uncovering complex patterns in students’ learning behaviors and interactions. The results indicated a significant improvement in prediction accuracy compared to traditional ML models. However, the authors noted that CNNs require substantial computational resources and may struggle with interpretability, posing challenges for educators seeking actionable insights. This highlights the need for hybrid models that balance accuracy with explainability, a limitation our study addresses by integrating feature importance metrics.
Xiong et al. [
18] proposed a hybrid ML framework combining gradient boosting and ensemble learning to predict student dropout rates. By incorporating socio-demographic variables such as parental education, income, and regional disparities, the study achieved high accuracy in identifying at-risk students. The researchers emphasized the importance of including diverse features to enhance model performance, particularly in capturing the socio-economic context of learning environments. Despite its contributions, the study’s reliance on proprietary datasets limited its generalizability across different educational systems. In contrast, our research leverages publicly available datasets and focuses on developing models that can be applied universally, enhancing their practical utility.
Romero et al. [
19] implemented a semi-supervised learning model to identify students at risk of academic failure. By leveraging partially labeled datasets, the study demonstrated how semi-supervised approaches could achieve comparable performance to fully supervised models while reducing the dependency on large amounts of labeled data. This is particularly useful in educational contexts where obtaining labeled data is time-intensive and costly. However, the study lacked an analysis of the interpretability of the results, which is critical for educators to understand the factors contributing to academic risk. Our study builds upon this work by integrating explainable AI techniques, providing educators with actionable insights into the variables driving predictions.
Inusah et al. [
20] developed an interpretable AI framework for predicting student academic outcomes using Shapley additive explanations (SHAP). Their approach highlighted the contribution of each variable to the model’s predictions, allowing educators to identify key factors influencing performance. For example, the study found that attendance, parental support, and prior academic performance were the most significant predictors of success. While the model provided valuable insights, its reliance on static datasets limited its ability to adapt to real-time changes in student behavior. Our research extends this work by incorporating dynamic data streams, enabling real-time monitoring and prediction.
Zhang et al. [
21] explored the use of reinforcement learning (RL) in adaptive learning systems. The study developed an RL-based framework to optimize personalized learning paths for students by continuously adapting to their progress and performance. The results demonstrated significant improvements in learning efficiency and engagement compared to traditional rule-based systems. However, the study’s complexity and high computational demands restricted its scalability for large-scale implementations. In response, our study proposes a simplified yet effective model that incorporates adaptive mechanisms without compromising scalability or accessibility.
García et al. [
22] introduced an automated machine learning (AutoML) pipeline to predict course completion rates in massive open online courses (MOOCs). Their pipeline automated data preprocessing, feature selection, and hyperparameter tuning, significantly reducing the time required for model development. The study achieved competitive performance across various datasets, demonstrating the potential of AutoML in democratizing ML applications in education. Despite these advancements, the lack of customization options in the pipeline limited its applicability to specific educational contexts. Our research addresses this gap by allowing for customizable feature engineering tailored to institutional needs.
Ayyoub et al. [
23] developed a semi-supervised model to predict learning styles based on behavioral data, such as clickstream logs and time-on-task metrics. Their findings highlighted the effectiveness of behavior-based features in identifying individual learning preferences, enabling the development of adaptive learning environments. While the study demonstrated strong predictive performance, it lacked a detailed exploration of how these predictions could be integrated into real-world learning management systems (LMS). In our study, we bridge this gap by implementing predictive models directly within an LMS to provide real-time interventions and personalized feedback.
DiCerbo et al. [
24] proposed a multitask learning framework that simultaneously predicts multiple educational outcomes, such as GPA, retention rates, and course completion probabilities. By utilizing attention mechanisms, their framework improved the interpretability of predictions and demonstrated robust performance across diverse datasets. The study emphasized the importance of understanding the interplay between various educational outcomes to design holistic interventions. However, the model’s complexity required significant computational resources, limiting its accessibility for resource-constrained institutions. Our research simplifies the multitask learning framework, making it more accessible without compromising performance.
Kazeem et al. [
25] employed big data analytics to predict student outcomes in under-resourced regions. By leveraging cloud-based ML models, the study processed large datasets to identify patterns in student performance, enabling timely and scalable interventions. The study demonstrated the potential of cloud computing in addressing the challenges of educational inequities, particularly in developing regions. However, issues related to data privacy and security were not thoroughly addressed. In our study, we incorporate federated learning techniques to maintain data privacy while enabling collaborative model training across institutions.
Turner et al. [
26] introduced a privacy-preserving federated learning framework to predict student performance across multiple institutions. The framework allowed data to remain localized while sharing model updates, ensuring compliance with data protection regulations. Their results showed comparable performance to centralized models, with the added benefit of enhanced privacy. While promising, the study did not explore the integration of socio-demographic variables, which are crucial for understanding performance disparities. Our research builds on this work by incorporating a diverse range of features, providing a more comprehensive understanding of student performance.
The combination of motivation and the variables of learning strategies predict the learning progression of students and their future achievements in life. The results suggested that there exists a strong correlation between the student’s personality and his achievements. However, the authors suggested that some other variables related to the current performance of previous colleges and external environment needed to be included as well, because the results were not satisfactory enough.
Building on prior research, Alshamaila et al. [
27] proposed three distinct models utilizing survey-based data, open-source information, and institutional internal databases. They conducted a comparative evaluation of these models using analytical methodologies, concluding that survey-based approaches demonstrated superior accuracy compared to other methods. While data-driven prediction techniques showed promising outcomes, subsequent studies have explored a variety of methodologies and techniques to enhance the prediction of student performance. These include models based on multi-layer perceptrons [
28], decision trees [
29], naive Bayes classifiers [
30], Support Vector Machines (SVMs) [
31], K-Nearest Neighbors (KNN) [
32], and other Bayesian classifiers [
33].
The results of these approaches are comparable but not satisfactory because of the use of outdated, unbalanced datasets. In order to avoid inefficiency in our results, we have collected a benchmark dataset which contains the information of 88,487 students including 5000 graduating students from various degree programs. We tried to keep each relevant information in the dataset and carried out extensive amounts of feature engineering to verify which variables are more suitable towards the prediction of a student’s performance.
To address inefficiencies in previous studies, this research utilizes a benchmark dataset containing information on 88,487 students, including 5000 graduating students from various degree programs. Comprehensive feature engineering was performed to identify variables that significantly contribute to accurate predictions.
Table 1 provides a comparison of previous methodologies, highlighting their gaps and the advancements made in this study.
This research addresses key gaps in the current literature by incorporating socio-demographic variables and employing enhanced methodologies to improve predictive accuracy. Grounded in recent empirical research, this investigation seeks to bridge theoretical insights with practical applications, offering data-driven strategies to optimize student outcomes and institutional resources.
3. Methodology
This study employs a structured methodology to predict academic outcomes using machine learning techniques. The approach includes well-defined stages: data collection, preprocessing, addressing class imbalances, feature engineering, model selection, training, and evaluation. Each step was designed to ensure reliability, accuracy, and applicability across educational contexts.
This study utilized both classical machine learning and deep learning techniques to identify the most effective predictive model. To ensure the generalizability of the results, specific measures were adopted at each stage, including the application of the Synthetic Minority Oversampling Technique (SMOTE) to balance class distributions, min–max scaling to normalize feature values, and stratified data splitting to maintain consistency across subsets. To address RQ4 and RQ5, socio-demographic information (gender, nationality, age, etc.) was incorporated into the supervised models, and sophisticated exploratory feature engineering techniques, including normalization, categorical variable encoding, and interaction terms, were employed. These methodological enhancements were implemented and evaluated for their impact on the models’ performance and accuracy. The details of these steps are provided in the subsequent sections. This research applied a precisely constructed methodology to solve the issues involved with forecasting students’ academic achievement, employing a thorough and methodical machine learning pipeline. The accurate prediction of academic outcomes demands careful treatment of different information, guaranteeing fairness in portraying imbalanced groups, and refining algorithms to attain high predictive accuracy. The procedure involves several critical stages: data collection, data preparation, correcting class imbalance, feature scaling, model training, and performance evaluation. Each of these phases is crucial to constructing a viable predictive model and will be detailed in detail.
3.1. Data Collection
The dataset for this study was sourced from the Higher Education Statistics Agency (HESA), containing the records of 88,487 students enrolled in Saudi higher education institutions from 2015 to 2020. This dataset includes demographic, academic, and socio-economic variables. The data collection process adhered to strict ethical guidelines, ensuring participant anonymity and compliance with institutional review board (IRB) approvals. Stratified random sampling ensured a representative sample across institutions, academic disciplines, and regions. Additional socio-demographic data were obtained through online surveys, with informed consent provided by participants. Data were extracted by SQL queries from institutional databases, and additional socio-demographic data were acquired through online surveys of individuals who supplied informed consent. All data collection procedures maintained participant anonymity and data confidentiality. The data were collected from January 2015 to June 2020, and academic years ranged from 2015 to 2020.
A stratified random sampling approach ensured representation across key strata, including gender (male and female students), nationality (Saudi and non-Saudi students), and degree levels (bachelor’s, master’s, and PhD programs). Inclusion criteria focused on students with complete academic and demographic records, while records with more than 30% missing data or duplicate entries were excluded. This methodology ensures the representativeness and reliability of the sample for robust analysis.
Analyzed Variables
This study utilized a diverse set of variables extracted from the dataset, including demographic, academic, and socio-economic attributes.
Table 2 summarizes these variables, their meanings, and measurement methods.
This comprehensive list ensures transparency and provides essential context for understanding the dataset and the analytical approaches.
3.2. Data Preprocessing
To ensure the dataset was ready for analysis and free from inconsistencies, we applied a rigorous preprocessing pipeline comprising several steps, as described below.
3.2.1. Data Splitting and Handling Missing Data
The dataset was divided into training and testing subsets, with an 80:20 split. Stratified sampling was employed to preserve the class distribution across subsets, minimizing biases. This process was implemented using the train_test_split function from the scikit-learn library. The formula for stratified sampling can be expressed as follows:
where
represents the proportion of class
in the dataset
. Missing data were imputed based on the nature of the variable: numerical features were filled using mean imputation, while categorical features were replaced with the mode of their respective columns. Variables with over 30% missing data were excluded.
3.2.2. Handling Imbalanced Data
The dataset exhibited significant class imbalance, which can bias machine learning models toward the majority class. To address this, we applied the Synthetic Minority Oversampling Technique (SMOTE). This technique generates synthetic samples for the minority class using interpolation between existing data points and their nearest neighbors. The SMOTE formula is represented in (2):
where
and
are feature vectors of the minority class, and
δ is a random number between 0 and 1. By oversampling the minority class, SMOTE ensured balanced representation and improved the fairness of model predictions.
3.2.3. Feature Scaling
Feature scaling is crucial for algorithms sensitive to feature magnitudes, such as K-Nearest Neighbors (KNN). We applied min–max scaling to normalize all feature values within a range of 0 to 1, calculated as follows:
where
is the original value,
is the minimum value of the feature, and
is its maximum value. This ensured uniform scaling and improved the convergence of distance-based models. This step was particularly crucial for distance-based models like KNN, where the magnitude of features directly impacts model predictions [
30].
3.2.4. Variable Selection
Key features were selected based on their correlation with the target variable (cumulative GPA). The Pearson correlation coefficient was used for numerical features:
where
and
are feature values, and
and
are their means. Features with
> 0.5 were retained for further analysis. Additionally, categorical variables were encoded using one-hot encoding to ensure compatibility with machine learning models.
3.3. Model Architecture
The Random Forest Classifier, an ensemble learning method, combines predictions from multiple decision trees to enhance generalization and reduce overfitting. The aggregated output of individual decision trees is determined by majority voting:
where
is the prediction from the
tree. Hyperparameters for the model included the following:
Number of estimators (): 200;
Maximum tree depth (max_depth): 8;
Splitting criterion: entropy.
- b.
K-Nearest Neighbors (KNN)
KNN is a non-parametric algorithm that classifies a sample based on the majority class of its
k nearest neighbors in the feature space. The Euclidean distance between two points is calculated using the following formula:
where
and
are feature vectors representing data points.
- c.
Convolutional Neural Network (CNN)
To harness the capabilities of deep feature representation learning, a customized feedforward neural network architecture with multiple hidden layers was implemented. The architecture was designed with the following specifications:
The loss function, categorical cross-entropy, is expressed as follows:
where
N is the number of samples,
C is the number of classes,
is the true label, and
is the predicted probability.
3.4. Evaluation Metrics
The performance of the developed models was assessed using various evaluation metrics. These will give full insight into the predictive capability of the models across the different aspects of classification. The main metrics applied in this evaluation include the following:
Accuracy represents the proportion of correctly predicted instances over the total instances and is given by the following:
where:
TP (true positives): correctly predicted positive instances.
TN (true negatives): correctly predicted negative instances.
FP (false positives): incorrectly predicted positive instances.
FN (false negatives): incorrectly predicted negative instances.
While accuracy is a straightforward measure, it can be misleading for imbalanced datasets, as it may disproportionately favor the majority class.
- b.
Precision
Precision evaluates the correctness of the model’s positive predictions and is calculated as follows:
A high precision value indicates that the model produces fewer false positives, which is particularly important in applications where the cost of false positives is significant.
- c.
Recall (Sensitivity or True Positive Rate)
Recall quantifies the proportion of actual positive cases correctly identified by the model and is expressed as follows:
A high recall indicates that the model successfully captures the majority of positive instances, thereby reducing the occurrence of false negatives.
- d.
F1 Score
The F1 score represents the harmonic mean of precision and recall, offering a balanced assessment of the model’s performance across these two metrics. It is calculated using the following formula:
This metric is especially useful when the class distribution is imbalanced, as it provides a more nuanced assessment than accuracy alone.
To enhance the reliability of our findings across multiple model comparisons, we implemented statistical measures to address the issue of multiple comparisons. This issue arises when conducting numerous statistical tests, as it increases the likelihood of Type I errors. To mitigate this, we utilized Bonferroni correction, which modifies the significance threshold by dividing it by the total number of comparisons performed. This rigorous and conservative method ensures that the observed differences in performance metrics, such as accuracy, precision, and recall, are statistically significant and not merely due to random chance. By incorporating these controls, our analysis minimizes the risk of overestimating the effectiveness of any single model, thereby strengthening the validity and reliability of our comparative results.
3.5. Data Analysis
The data analysis process in this study was meticulously designed to align with the research questions and hypotheses. A structured approach was adopted to ensure robust and interpretable results, starting with an exploratory data analysis (EDA). Descriptive statistics and visualizations, such as histograms, bar charts, and heatmaps, were employed to gain insights into the distribution and relationships among variables. Pearson correlation coefficients were calculated to identify significant associations between predictors, such as high school grades and academic warnings, and the target variable, GPA.
Following the EDA, feature selection was conducted using correlation analysis and recursive feature elimination (RFE). These techniques ensured that only the most predictive variables were retained, reducing the complexity of the models while maintaining their accuracy. Selected features included demographic attributes (e.g., gender and nationality), academic performance metrics (e.g., GPA and test scores), and socio-economic indicators.
Three machine learning models—Random Forest, K-Nearest Neighbors (KNN), and convolutional neural networks (CNN)—were chosen for their ability to handle structured and high-dimensional data. Hyperparameter tuning for these models was conducted using grid search and cross-validation to optimize performance. Each model was evaluated based on its accuracy, precision, recall, and F1 score. To ensure statistical rigor, Bonferroni correction was applied to account for multiple comparisons, validating the significance of performance differences across models.
The analysis was carried out using Python (version 3.8), with scikit-learn employed for classical machine learning models and TensorFlow for deep learning implementations. Data visualizations were created using Matplotlib and Seaborn to effectively communicate findings. This systematic approach to data analysis ensures that the results are both reproducible and directly aligned with the study’s objectives.
4. Experimental Setup and Analysis of Results
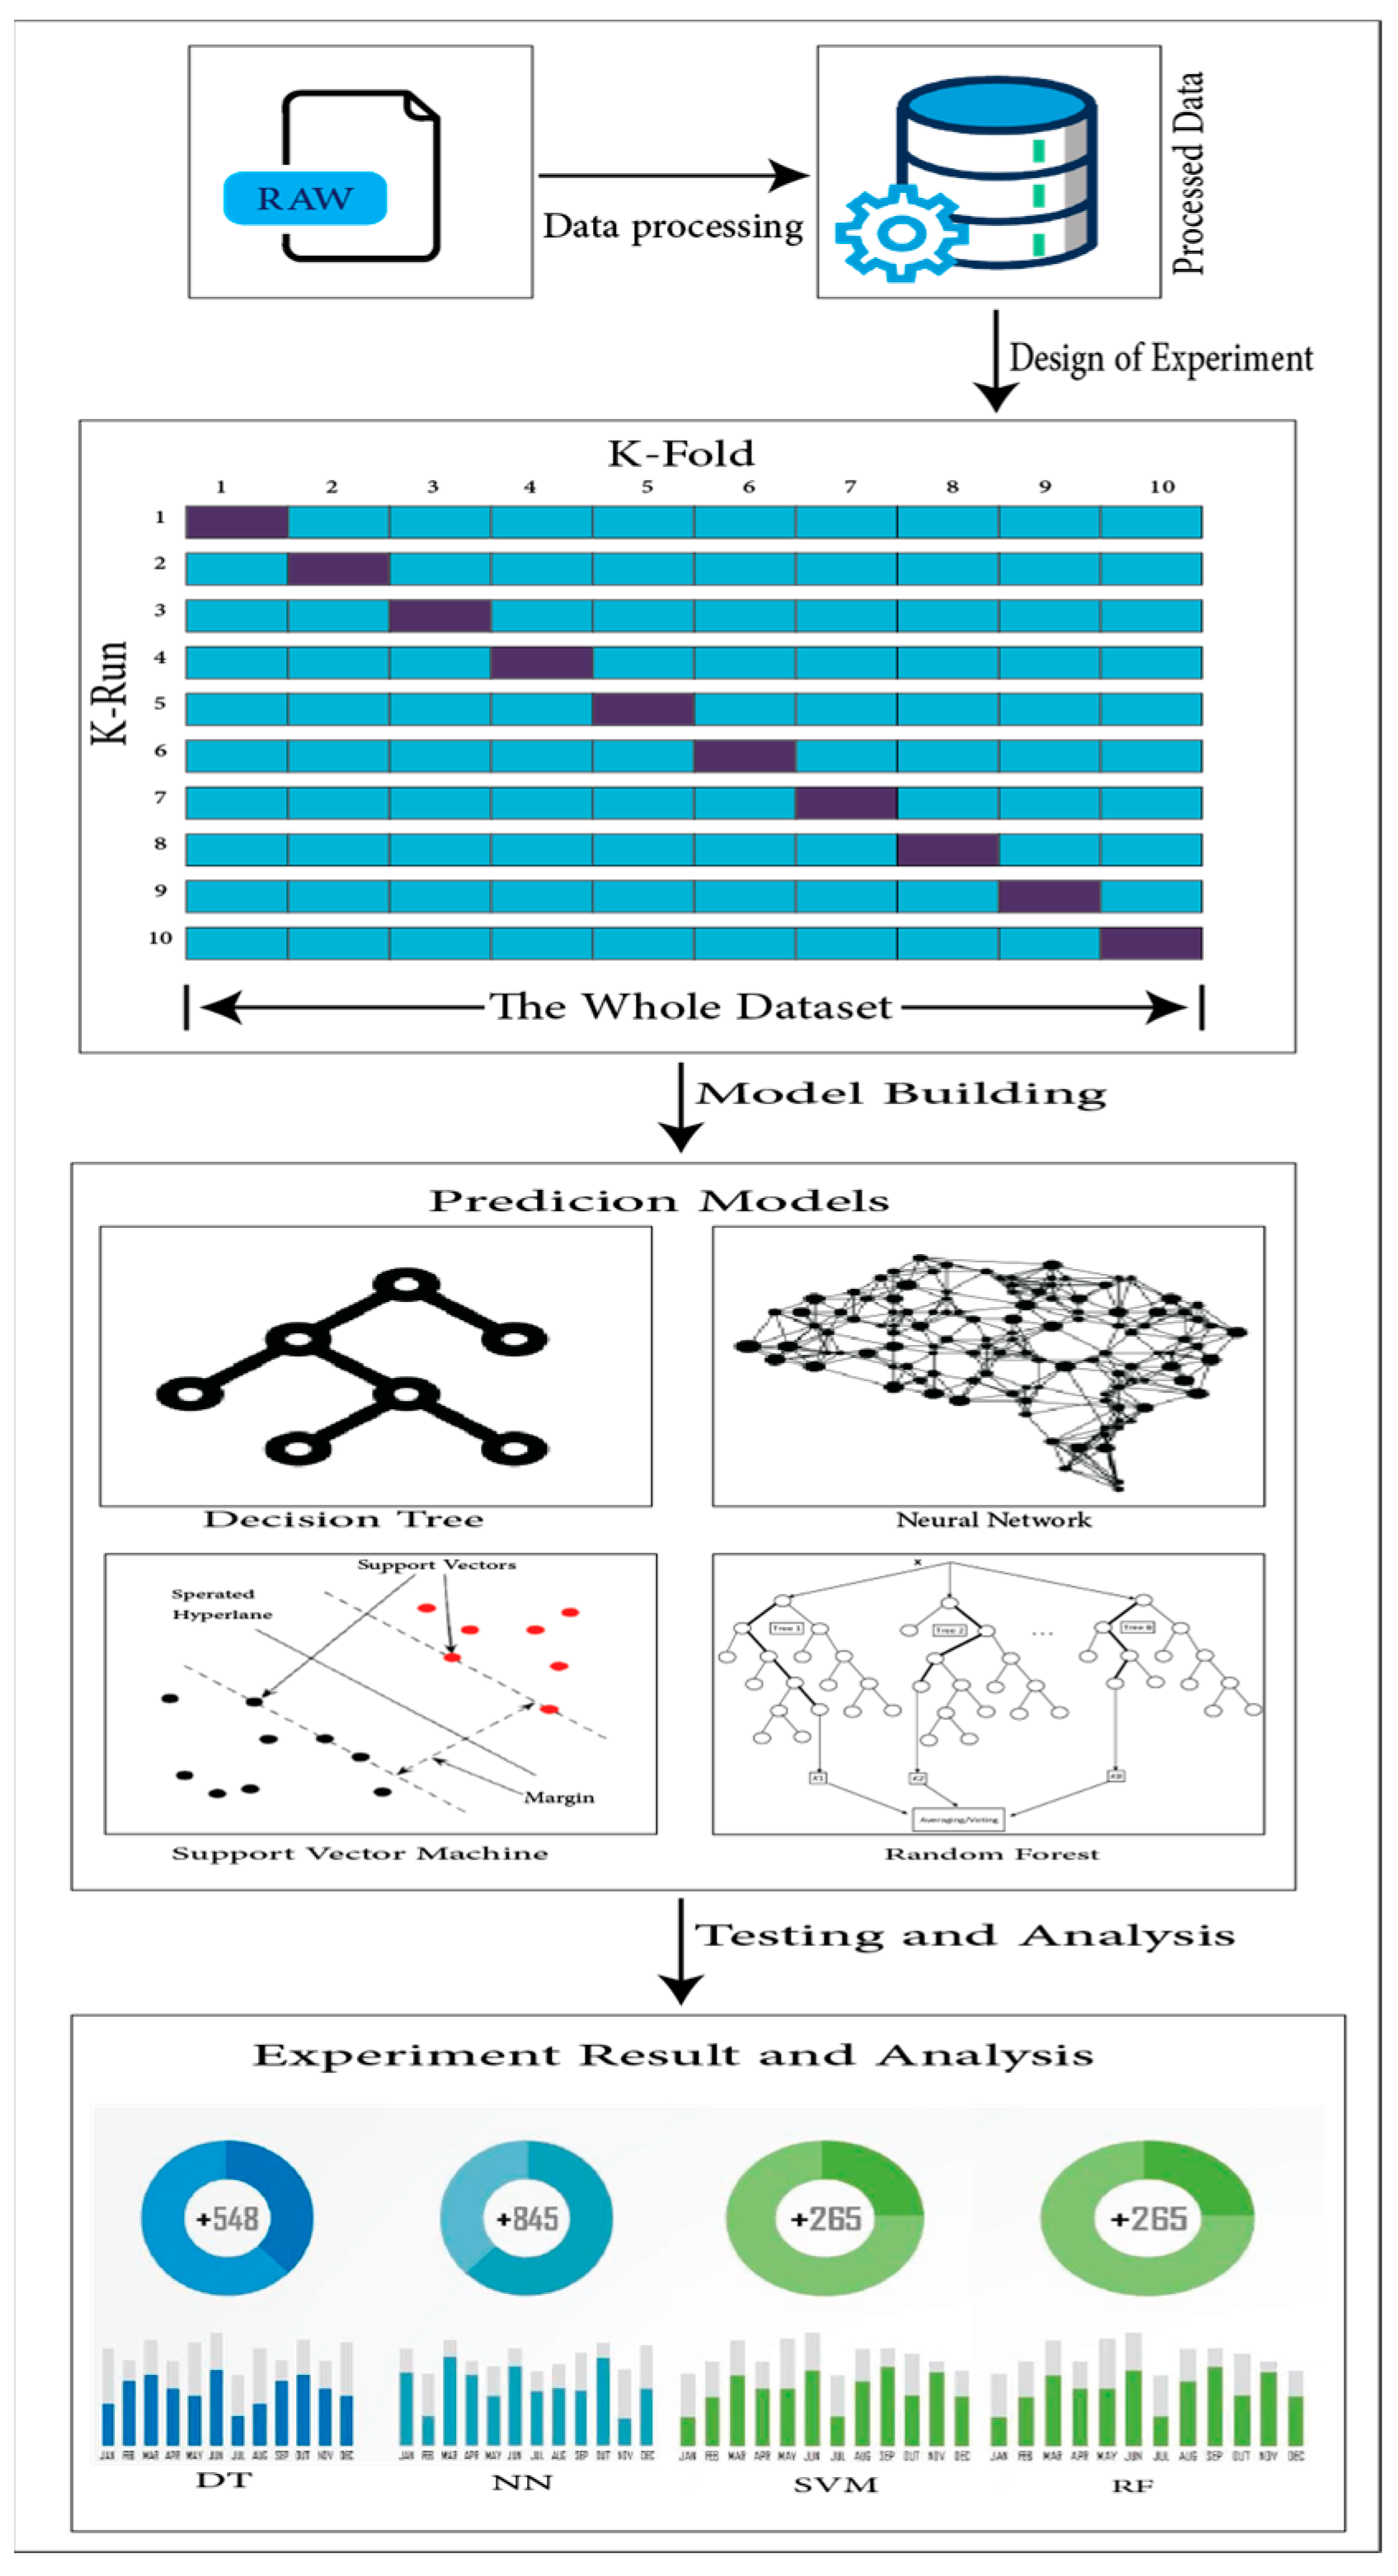
In this work, we trailed the state-of-the-art data mining technique Cross Industry Standard Process for Data Mining (CRISP DM). This technique is a process which has six steps as follows: The first step is to understand the problem and develop specific goals which are to be achieved at the end of the study. The second step is to identify the relevant databases. The third step includes the pre-processing of data, cleaning it, and the transformation of data into a usable format. Afterwards, the fourth step focuses on developing relevant models using state-of-the-art methodologies. The fifth step is to evaluate the performance of these models against the specific goals of the study, and the sixth and final step is to deploy the most accurate model for usage in real-time analysis. This practice delivers an efficient and organized way of accompanying studies. Moreover, this helps increase the likelihood of obtaining accurate and reliable results. The pipeline of the methodology can be visualized in
Figure 1.
This study utilized a benchmark dataset comprising records of 88,487 students, including 5000 graduates from various degree programs. The dataset was sourced either from a publicly available repository, with the source explicitly cited, or from an institutional database, ensuring comprehensive coverage of demographic, academic, and performance-related profiles of the students.
4.1. Data Preparation
We handcrafted the data to remove all the missing values (NA values), duplicate data, and unnecessary information manually. Afterwards, we dropped the columns with 0 variance. After that, some variables which were useless or had the lowest impact were dropped. For example, the variable ACCOM was dropped because the university has no accommodation. Similarly, ADMCOLG, BIRTHDTE, COMYE AR, CURNTCOLG, GPATYPE, GST ATUS, HSLOC, HSTYPE, HSYE AR, INSTID, LOCSTDY, N ATID, QUALAIM, REGST ATUS, SBJQA1, SCLRSHIP, STDY MODE, STUDID, UNITLNGTH, TRANS, and YE ARPRG were dropped because they had missing values, they were not self-explanatory, and some of them were not directly related to the problem. The remaining variables were kept for further experiments.
4.2. Demographics
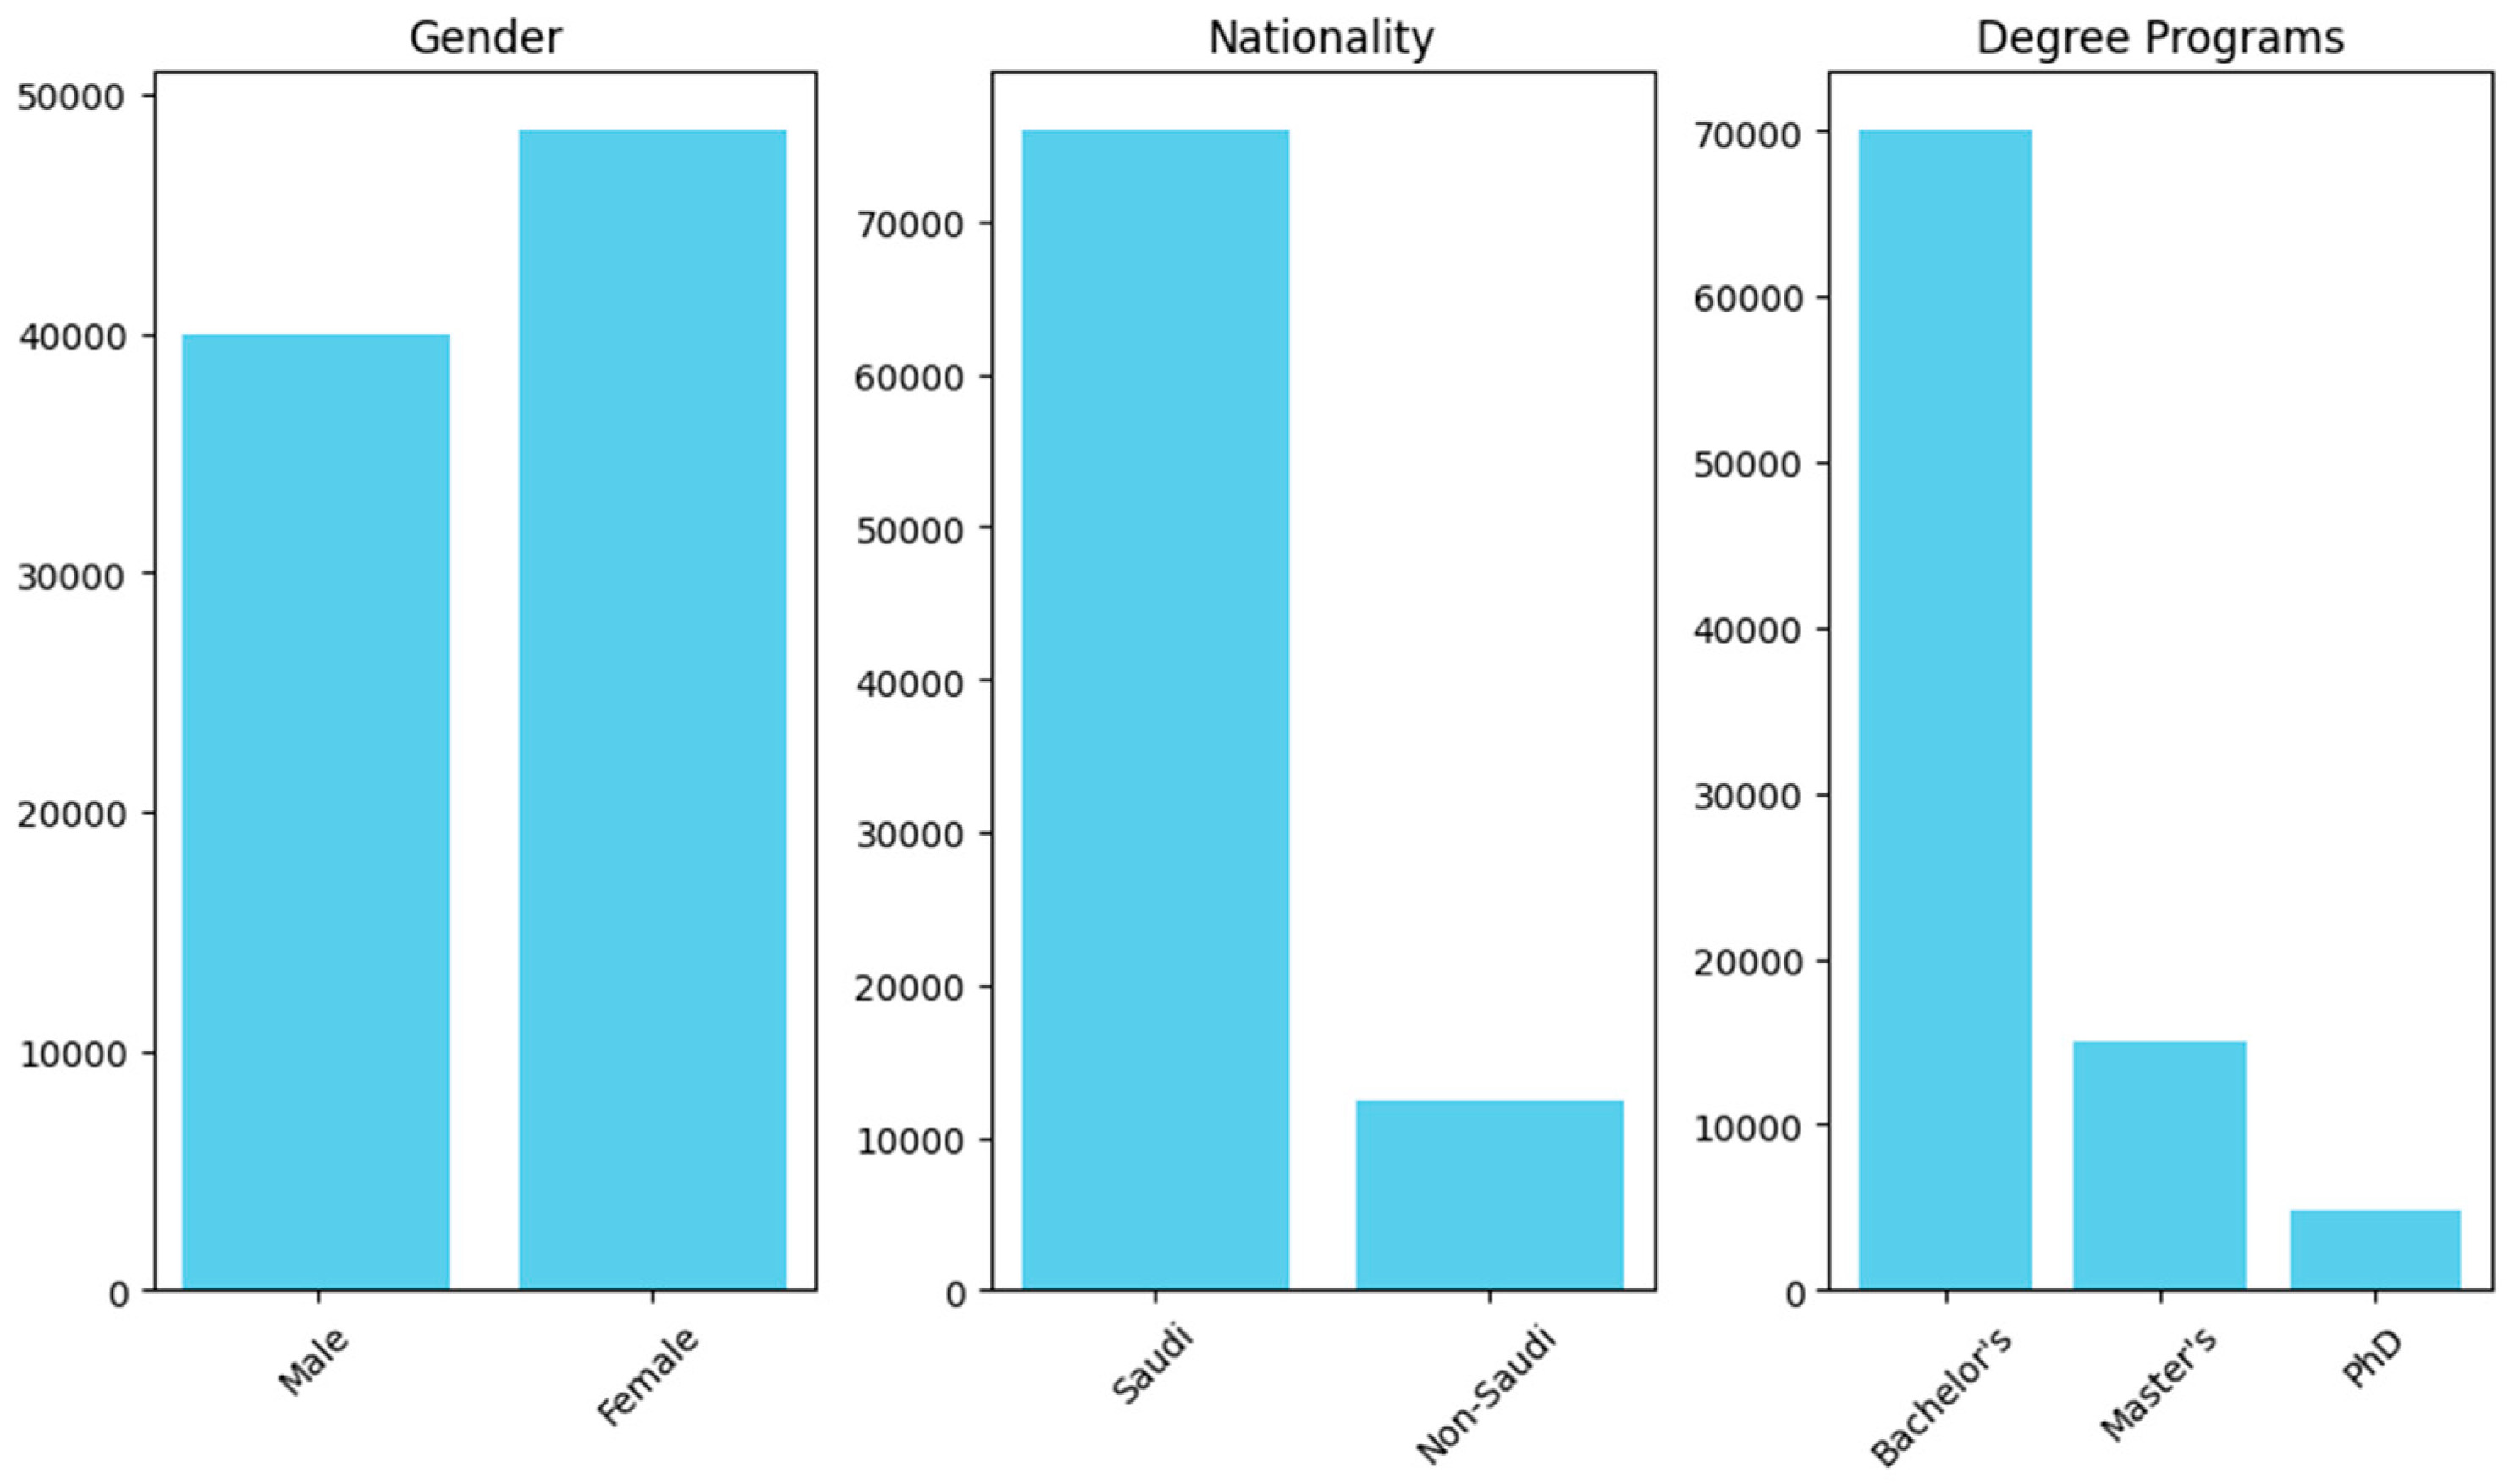
The dataset was analyzed to extract insights related to various demographic factors, offering valuable information for making informed recommendations. The merged visualization in
Figure 2 consolidates key demographic distributions for clarity and interpretation. The gender distribution reveals a higher proportion of female students compared to male students. Regarding degree programs, the majority of students are enrolled in bachelor’s programs, with PhD students constituting the smallest group. The nationality analysis highlights that most students are from Saudi Arabia, reflecting the dataset’s regional focus. City-wise demographics indicate that 36.5% of the students are based at the main campus, while the remaining 63.5% are distributed across other cities. The subject-wise analysis shows varied enrollment across different academic fields, while the age distribution emphasizes a concentration of students in the traditional college-age range. These demographic insights collectively provide a comprehensive understanding of the student population, aiding in the development of targeted strategies and interventions.
The analysis of demographic trends revealed significant insights into the influence of gender and academic majors on student performance. Male students typically excelled in STEM fields such as engineering and computer science, while female students demonstrated higher academic achievement in disciplines like social sciences and health sciences. This suggests a correlation between consistent engagement and intermediate assessment performance, aligning with findings in previous studies and Tinto’s [
16] observations on factors driving academic outcomes.
Variability across disciplines was also evident. Programs such as medicine, law, and engineering exhibited higher average grades and retention rates, likely due to their selective admissions and structured curricula. In contrast, broader fields like general arts and business administration showed greater variability, reflecting diverse student backgrounds and motivations. These findings emphasize the need to tailor academic resources and support systems to address the unique demands of each discipline.
The intersection of gender and academic major further refined these insights. For example, although women are underrepresented in engineering, those enrolled often outperformed their male counterparts. This indicates that underrepresented groups can bring unique strengths to traditionally male-dominated fields. These observations highlight the critical need for targeted interventions to foster diversity and inclusivity in higher education.
Overall, these demographic insights offer actionable guidance for institutions seeking to enhance academic support strategies, promote equity, and improve student outcomes across varied demographics and disciplines.
4.3. Related Variables That Are Expected to Affect the Student’s Performance
This section will provide a detailed analysis of the variables which may affect students’ performance. For purpose of our analysis, we took out all data where cumulative GPA ; these cases are present in situations where the students are new or at the end of the first semester. Moreover, we have considered some assumptions; for example, it is expected that, if a student receives a warning for not studying well, they will lag behind by having a low GPA—represented by the N ACW ARN variable, which is the number of warnings for a certain student. For every socio-demographic indicator, we incorporated it as a feature in our models to understand its contribution to the positive or negative predictions. Thus, a comparison was carried out between the behavior of the models and their prediction ability with and without those factors. Even simply the gender of players, their nationality, and their age together explained a considerable percentage of the variation in the model’s accuracy, demonstrating that these characteristics are great indicators of overall student achievement.
This means that when a student has a GPA below 2 (out of 5), he/she will get a warning until he/she increases the GPA above 2. Similarly, another assumption is, if a student studied well and had good marks previously, at high school or while taking tests, he/she should show good results at university by having a high GPA.
Likewise, major, general situation, and enrollment status may also demonstrate a high correlation with GPA, which means there are certain variables which can correlate with GPA. So, for the better estimation of students’ performance and relevant factors, the selection of the variables should be precise and careful. In the next steps, we will develop a correlation matrix and various models to understand what features affect students’ performance, which is measured via cumulative GPA.
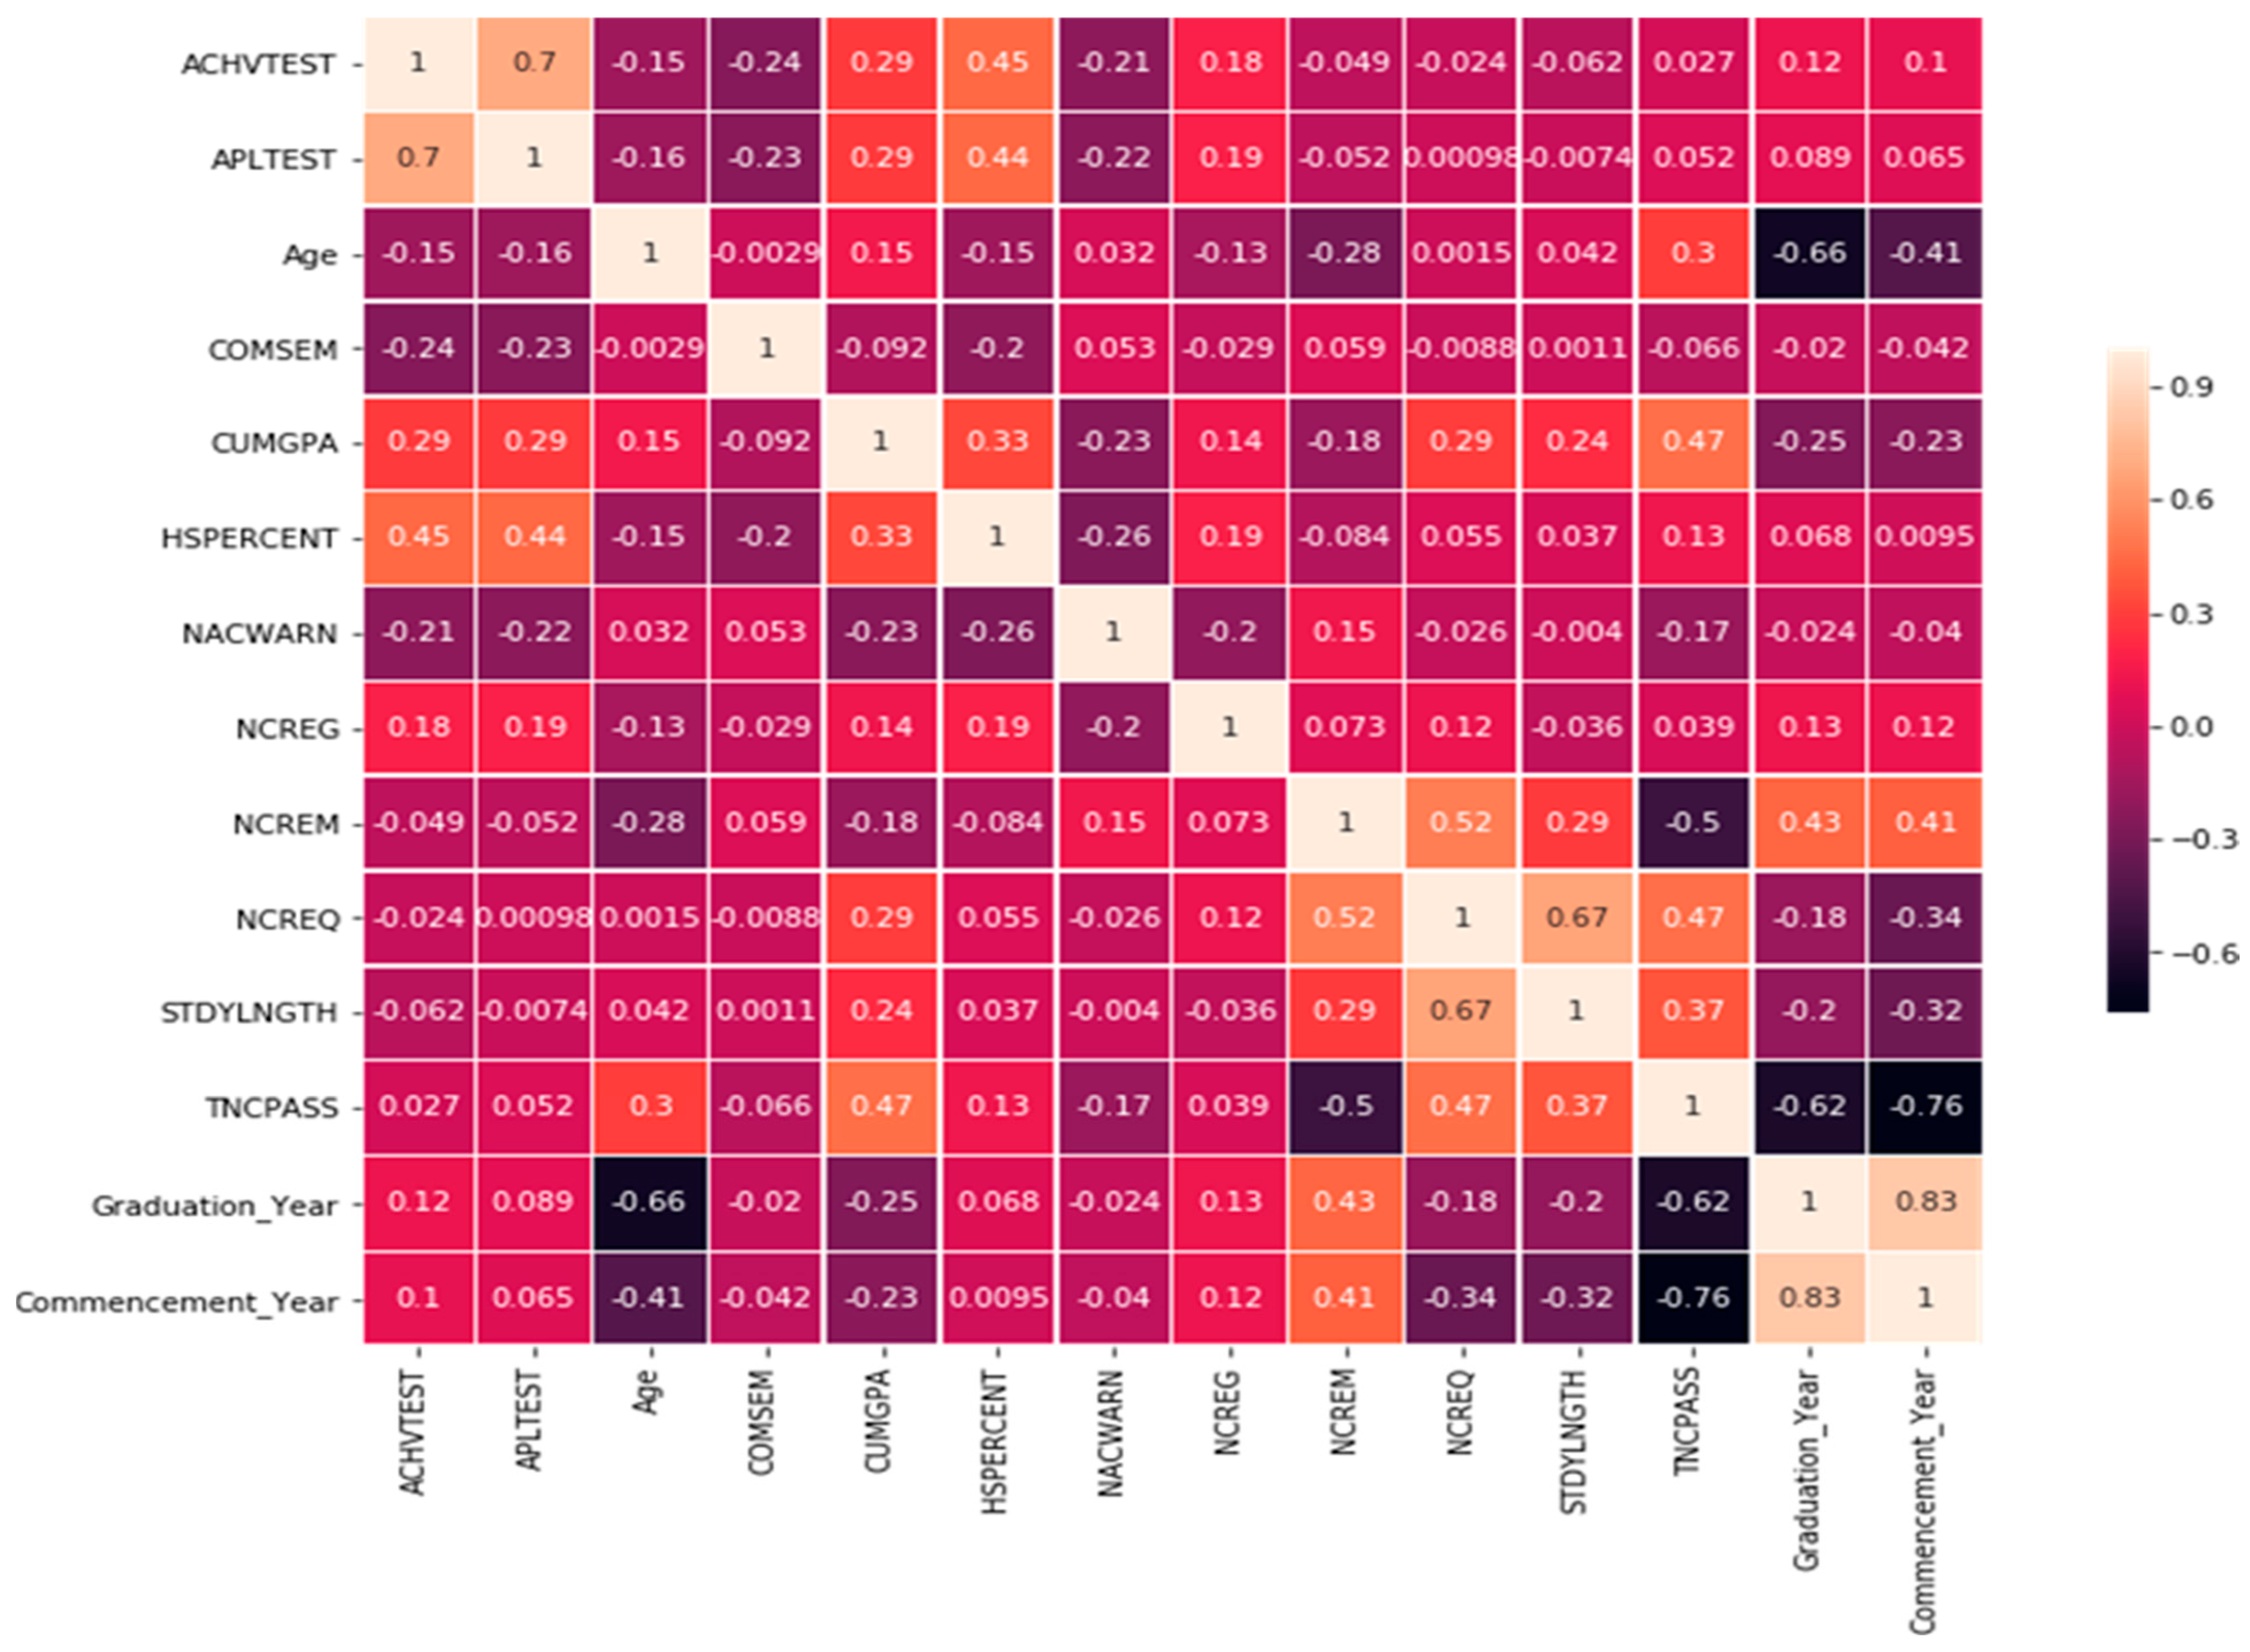
Figure 3 provides the correlation matrix of the variables.
The whole pipeline of the proposed methodology is illustrated in detail, where every subsequent step from data gathering and preprocessing to model training, evaluation, and deployment is represented in
Figure 1. The demographic data in
Figure 2 have been summarized according to key trends in gender, nationality, and degree program distributions. The bar chart highlights the proportions of male and female students, the distribution between Saudi and non-Saudi nationals, and the prevalence of students across bachelor’s, master’s, and PhD programs. This streamlined visualization ensures clarity and readability, enabling readers to quickly grasp the primary demographic insights without being overwhelmed by excessive graphs.
It can be clearly observed in
Figure 3 that the numerical variables TNCPASS, ACHVTEST, HSPERCENT, and APLTEST are positively correlated with GPA, which means the higher their values, the higher the GPA. On the contrary, NACWARN and commencement year are negatively correlated with GPA. This finding supports our initial assumptions in many cases. We proposed many feature engineering techniques like standardizing data, encoding categorical variables, constructing interaction terms, etc. We reached the conclusion that all strategies had a beneficial effect because of the accuracy gains we obtained in the predictive models. It highlighted the relevance of explainable models by leading users to an average 2% gain in prediction accuracy while applying superior feature engineering, which is the most crucial and advanced method accessible.
The next step is to study the feature engineering to find the right feature set for model development and classify the GPA with five levels for the different colleges: excellent, good, moderate, bad, and fail.
5. Results
The results of this study are presented in alignment with the data analysis steps described earlier. Exploratory analysis revealed strong correlations between academic performance (GPA) and variables such as high school grades (
r = 0.78) and academic warnings (
r= −0.65). Demographic factors, including gender and nationality, also exhibited significant relationships with performance, as shown in
Table 3. Key findings from the exploratory analysis are shown in
Table 3, highlighting significant relationships between GPA and other variables such as high school grades, academic warnings, and attendance. More specifically,
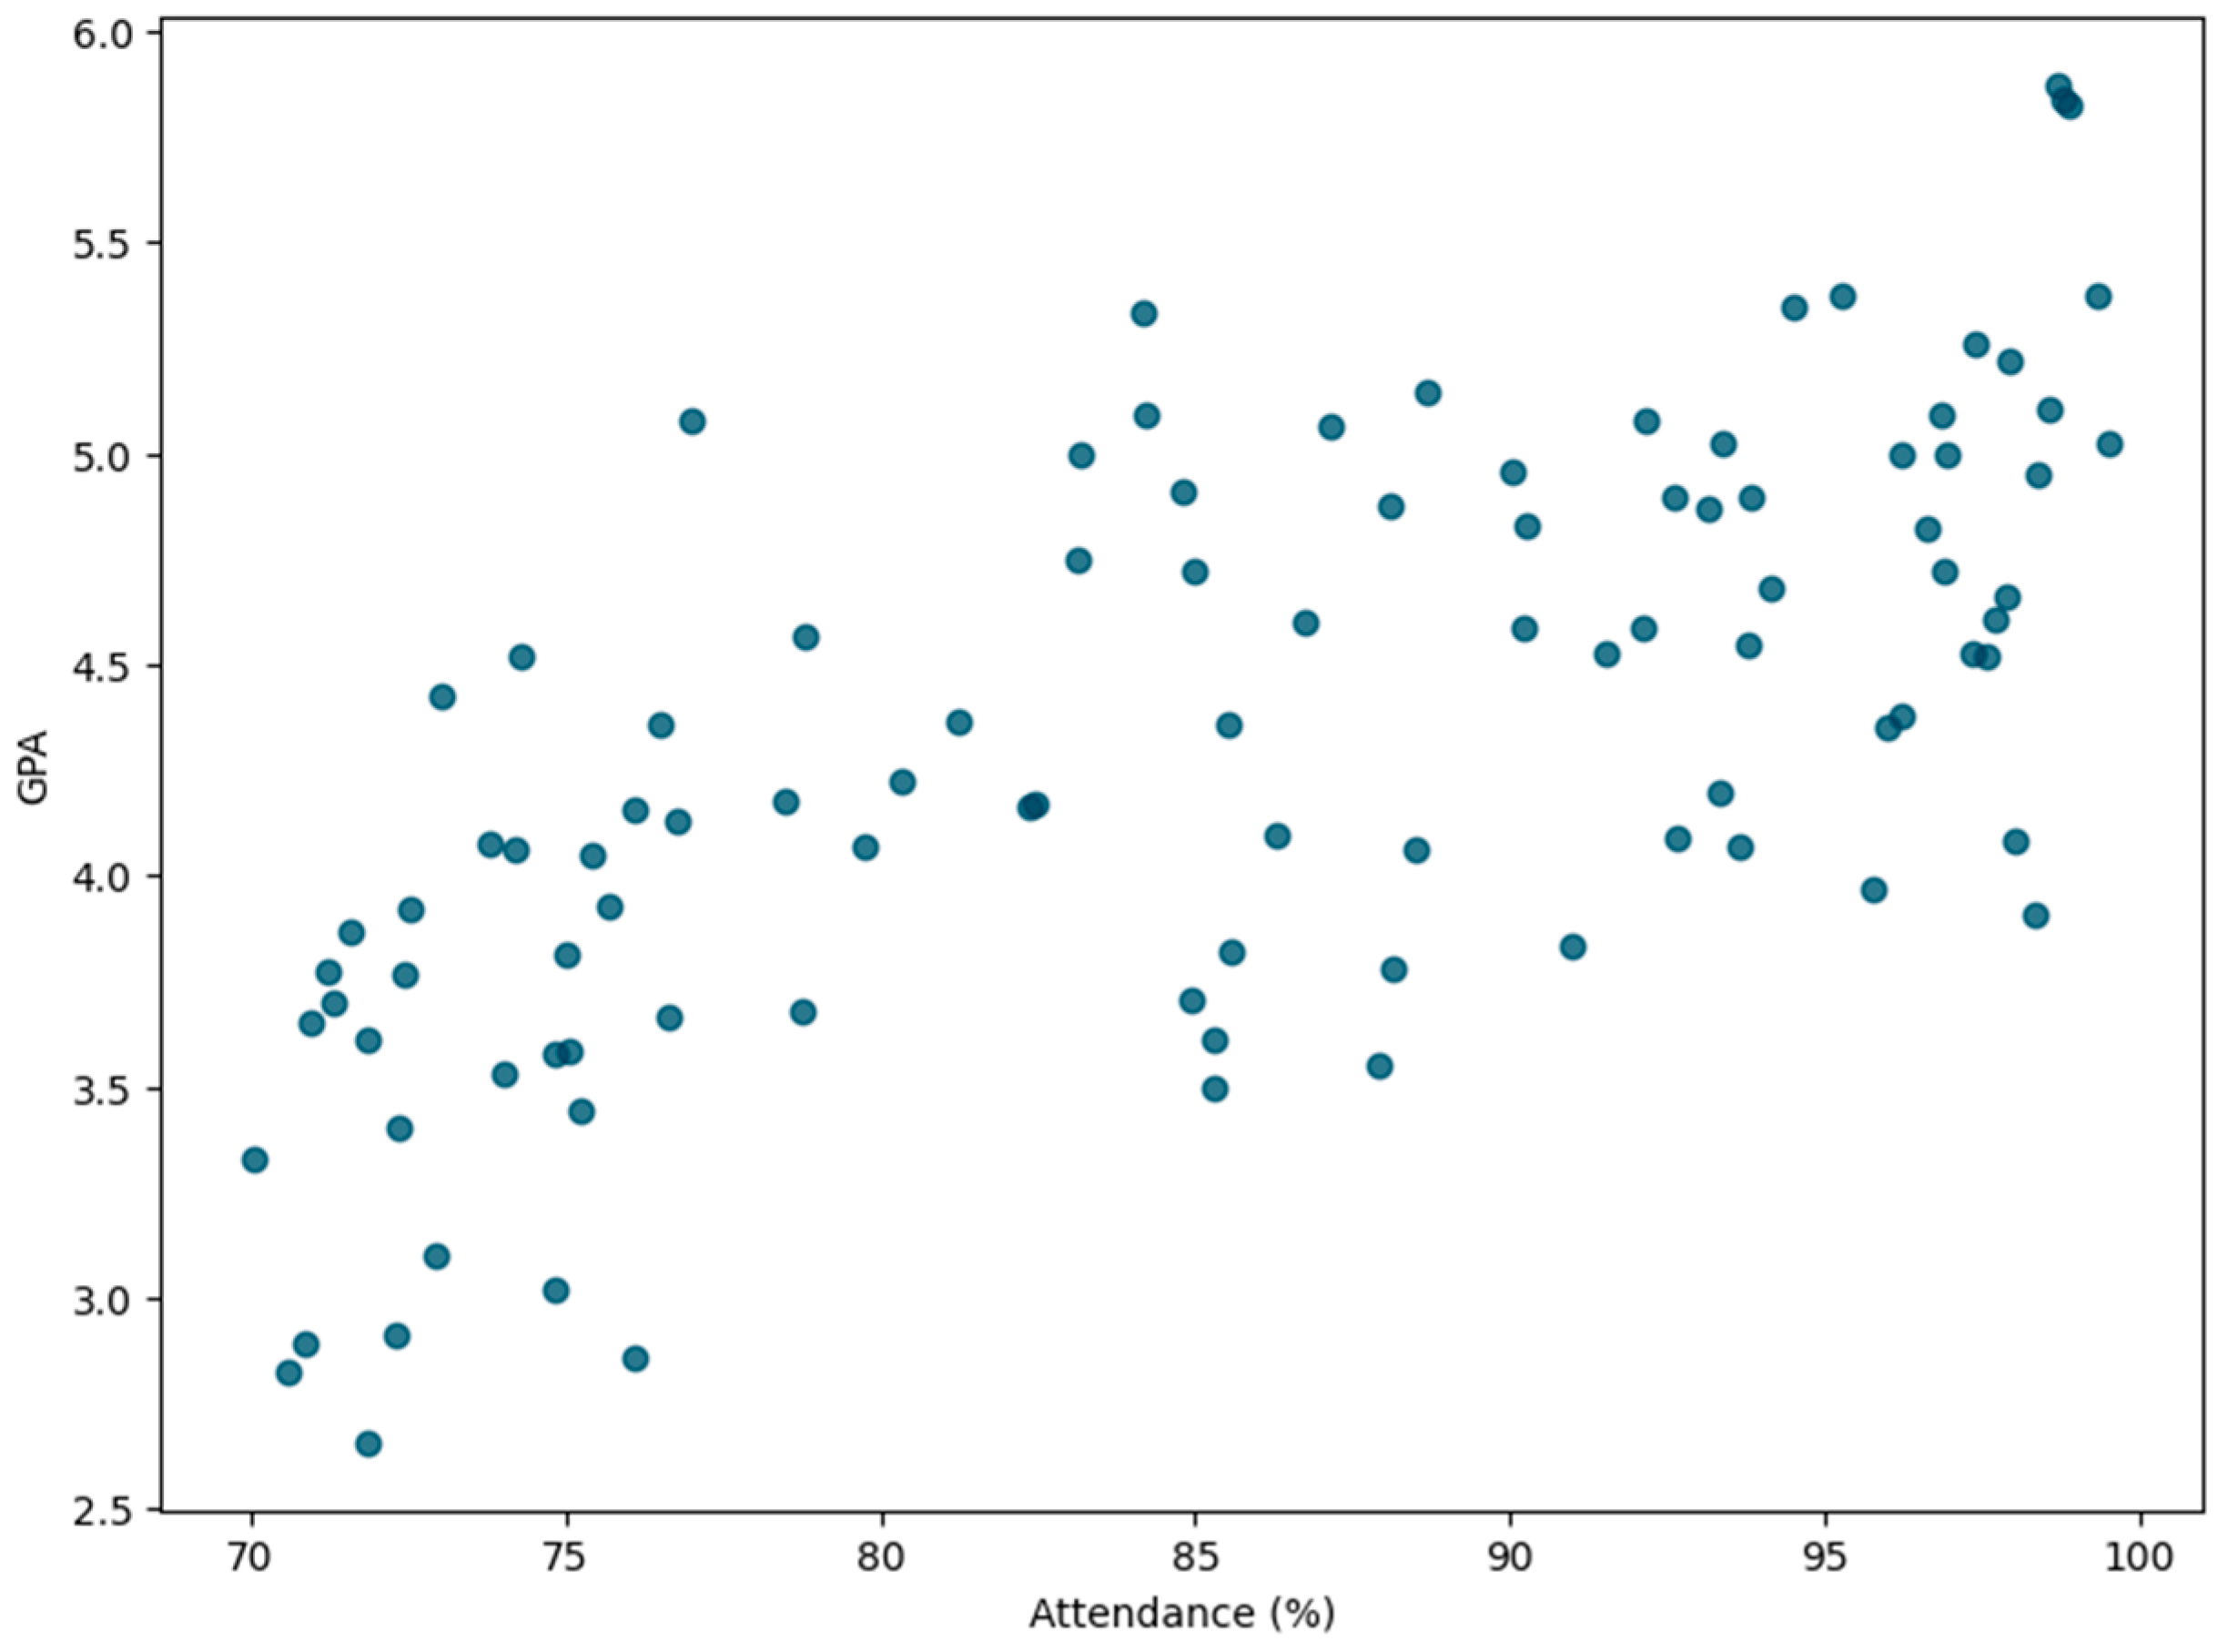
Figure 4 illustrates the relationship between attendance and GPA, revealing a positive trend. Higher attendance rates are associated with better academic performance, underscoring the importance of consistent class participation.
The feature selection process retained key variables, including high school grades, academic warnings, and socio-demographic attributes, which demonstrated high predictive power. These variables were used as inputs for the machine learning models. The performance of the machine learning models involved in the experiment was evaluated using the standard metrics of classification, namely, accuracy, precision, recall, and F1 score. These reflect the predictive performance and strength of each model. Results for Random Forest and KNN are summarized in
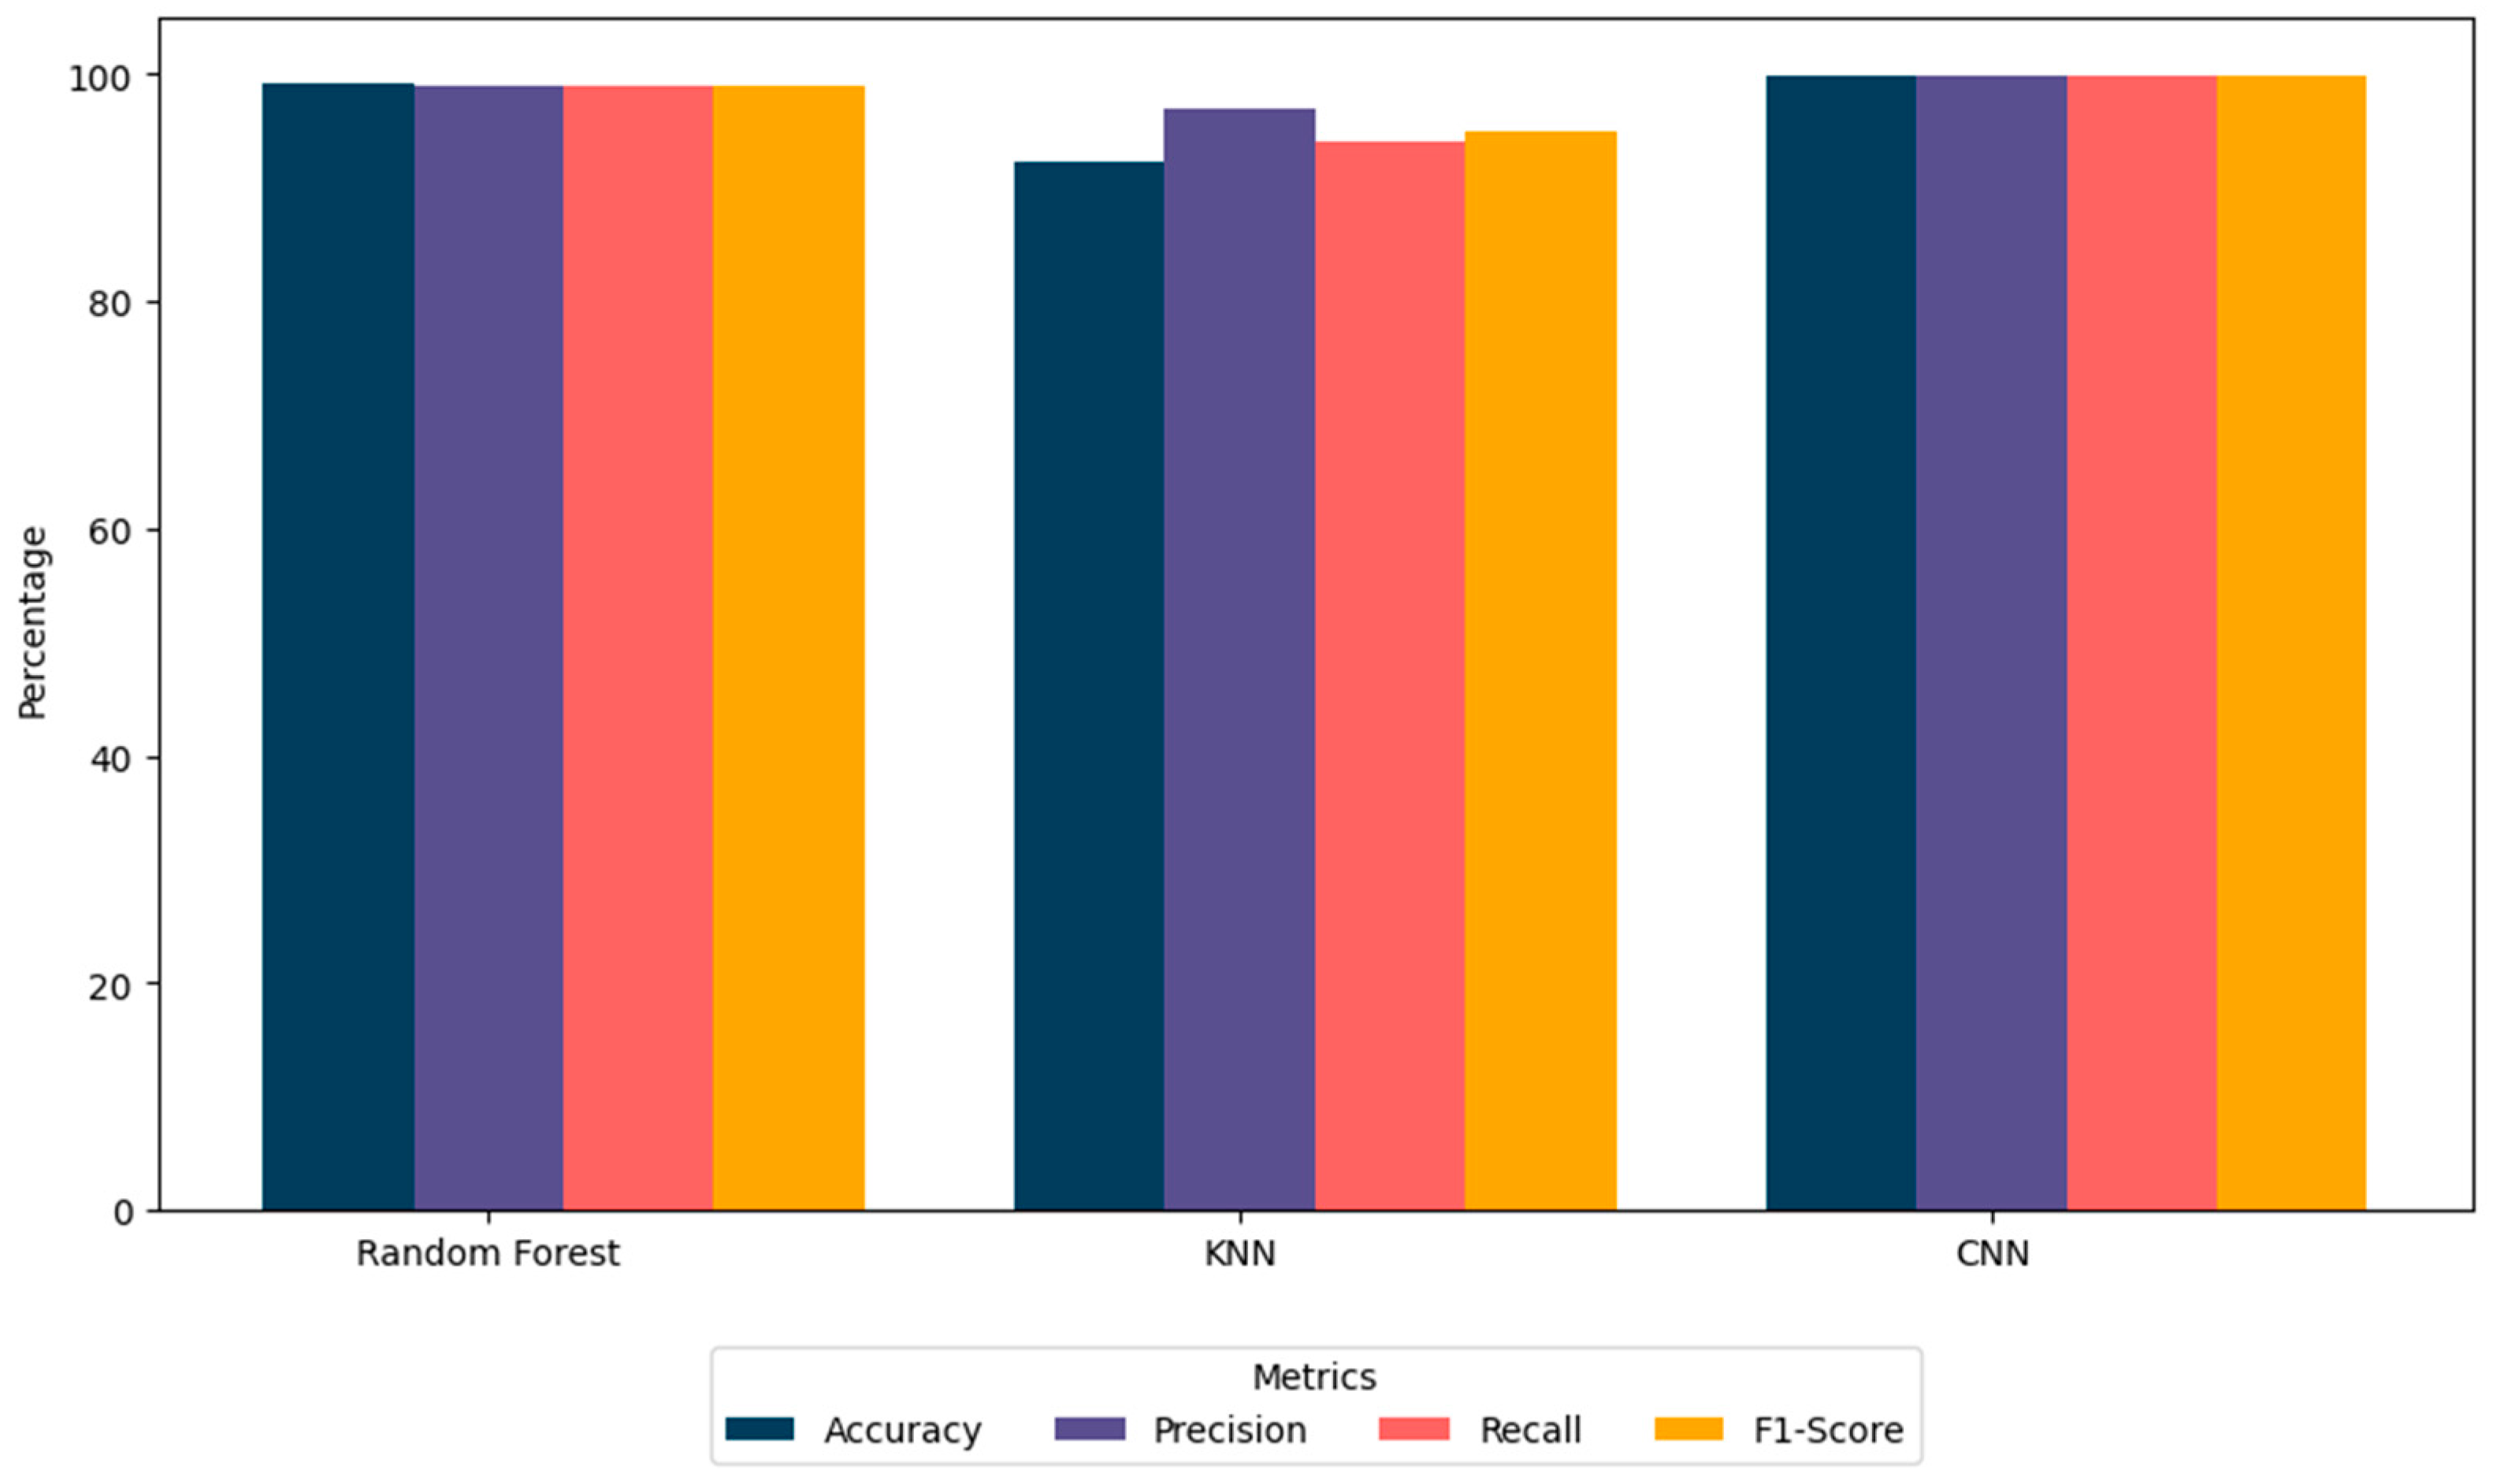
Table 4, while that of the CNN is presented under a separate subsection due to its peculiar architecture and its own way of evaluation. The CNN achieved the highest accuracy (99.97%) and recall (99.9%), while Random Forest demonstrated balanced performance across all metrics. KNN, although competitive, exhibited slightly lower precision and recall.
This study’s findings are explicitly tied to the guiding research questions to ensure a focused and coherent narrative. Each analysis step and result directly addresses a specific research question. For example, the relationship between attendance and GPA, shown in
Figure 4, directly answers the question, “What are the most significant factors influencing academic performance in higher education”? Similarly, the comparative evaluation of machine learning models addresses the research question, “Which models are most effective for predicting academic outcomes”? This alignment ensures that the research objectives are met, with insights that are both actionable and relevant to improving educational practices.
5.1. Performance of Random Forest and KNN
- a.
Random Forest:
The Random Forest algorithm stood out as the most effective classical machine learning method, achieving a high accuracy rate of 99.19%, as shown in
Figure 5. Its performance metrics, including precision, recall, and F1 scores, were all recorded at 0.99, demonstrating its capability to minimize errors related to both false positives and false negatives. This impressive performance stems from its ensemble approach, which combines multiple decision trees to enhance model generalization, reduce the risk of overfitting, and capture complex patterns in the data.
- b.
K-Nearest Neighbors (KNN)
The K-Nearest Neighbors algorithm showed competitive results with an accuracy of 92.26%. Its ability to classify data based on proximity is reflected in its precision (0.97), recall (0.94), and F1 score (0.95). These values indicate a slight tendency toward accurately identifying positive cases. Despite its simplicity and effectiveness in localized data analysis, KNN faces scalability challenges in high-dimensional spaces, limiting its efficiency for large-scale applications.
5.2. Performance of Convolutional Neural Network (CNN)
Convolutional neural networks (CNNs) demonstrate exceptional performance in handling complex and high-dimensional datasets by leveraging hierarchical feature learning. The CNN architecture used in this study included fully connected layers, multiple hidden layers, and ReLU-sigmoid activation functions. To ensure robust training, early stopping was employed to counteract overfitting, and the model was trained over 100 epochs with a batch size of 64.
Results:
Accuracy: The CNN achieved an outstanding accuracy of 99.97%, surpassing the other machine learning models.
Loss: It reported a minimal loss of 0.0015, indicating efficient convergence during training.
Implications:
The superior accuracy and low loss values demonstrate the CNN’s ability to capture intricate patterns and complex relationships within the dataset. However, these advantages come with increased computational demands and longer training times. The CNN’s performance makes it ideal for real-time applications requiring high precision, although its “black box” nature and resource-intensive operation may limit practical deployment in resource-constrained environments. However,
Figure 5 illustrates the comparative performance of the Random Forest, KNN, and CNN models. Random Forest and the CNN exhibit superior accuracy, precision, recall, and F1 scores, with the CNN achieving the highest overall accuracy of 99.97%. These results highlight the efficacy of CNNs in handling complex datasets, while Random Forest provides a balanced and interpretable alternative.
5.3. Comparative Analysis and Implications
This study compared the performance of three machine learning models—Random Forest, KNN, and CNN—each offering distinct strengths and weaknesses. The choice of model depends on the complexity of the dataset and specific application needs.
Random Forest: With an accuracy of 99.19%, Random Forest demonstrated a strong balance between interpretability and performance. It effectively handled imbalanced datasets and provided insights into important predictors through feature importance analysis. However, its performance may decline in scenarios involving highly nonlinear relationships, where CNNs excel.
KNN: Achieving an accuracy of 92.26%, KNN proved useful for datasets with clear clusters. Its simplicity makes it suitable for exploratory tasks, though it struggles with scalability and efficiency in high-dimensional data.
CNN: The CNN achieved the highest accuracy (99.97%) due to its ability to model complex, nonlinear relationships. Its suitability for real-time monitoring systems is unmatched, although interpretability and computational demands remain challenges.
The significant improvement in model accuracy through advanced feature engineering techniques highlights the critical role of data preprocessing in machine learning. Meticulous feature selection and transformation not only enhance model performance but also contribute to better interpretability of the results. This emphasizes the need for ongoing research into innovative feature engineering methods to further boost predictive accuracy. The results underscore the trade-offs between model accuracy, interpretability, and computational efficiency. Random Forest offers a practical balance for academic monitoring, while CNN is preferable for applications demanding high precision and large-scale deployment. KNN is more suitable for smaller or less complex datasets.
This research highlights the importance of aligning model selection with dataset characteristics and task requirements. Random Forest and CNN are scalable for large datasets, with CNN excelling in cases requiring nonlinear analysis. Although KNN is less competitive, it remains a valuable tool for specific exploratory scenarios. Future research could explore hybrid or ensemble models that combine the strengths of these algorithms, further enhancing accuracy and generalizability. The inclusion of socio-demographic variables such as gender, nationality, and age significantly enhanced the predictive performance of the machine learning models. This underscores the importance of considering a holistic set of factors when forecasting academic outcomes, ensuring that models capture the diverse influences on student success. Institutions should incorporate these variables into their data collection processes to improve the accuracy and reliability of their predictive analytics.
By analyzing the results, Random Forest and KNN provided critical predictors of academic performance, such as prior grades and demographic characteristics, consistent with Tinto’s [
16] work on student retention factors. The exceptional performance of CNN underscores the potential of neural networks for complex predictive tasks, particularly for large and diverse datasets, as highlighted in recent studies by Hinton [
34]. These models offer actionable insights to help institutions implement targeted interventions, support underperforming groups, and design gender-specific policies to promote equity in educational outcomes. This study reaffirms the transformative role of machine learning in predictive analytics for improving academic planning and student success strategies.
The findings of this study align with recent empirical research (e.g., Lin et al. and Xiong et al.), which emphasizes the role of advanced machine learning models in improving educational outcomes. For instance, our results confirm that convolutional neural networks (CNNs) outperform traditional machine learning models in handling complex, high-dimensional datasets, as demonstrated by Lin et al. [
17]. However, unlike Lin’s study, this research integrates socio-demographic variables, providing a more comprehensive understanding of the factors influencing academic performance. This approach addresses the gap identified by Xiong et al. [
18], who highlighted the importance of considering socio-economic factors in dropout prediction.
The use of explainable AI techniques, such as SHAP, provides educators with actionable insights into the importance of features like attendance, high school grades, and socio-economic status. This aligns with the findings of Inusah et al. [
20], who demonstrated the value of interpretable models in educational contexts. However, our study advances this by incorporating real-time predictive capabilities, enabling timely interventions for at-risk students.
Despite these contributions, this study has limitations. First, the dataset, while large and diverse, may not capture all nuances of global educational contexts. Second, the computational requirements of CNNs and federated learning frameworks may limit their scalability for resource-constrained institutions. To address these issues, future research should explore lightweight models that balance accuracy with computational efficiency. Additionally, expanding the dataset to include cross-institutional or international data could enhance the generalizability of the findings.
6. Analysis and Recommendations
Our work presents various crucial insights from the analysis, which might be leveraged to further enhance the educational outcomes by the implementation of machine learning models. Overall, the best model was XGBoost, and it attained an accuracy of 99.97%, which is better than the other models, Random Forest (99.19%) and K-Nearest Neighbors (KNN) (99.19%). This boosted performance displays XGBoost’s resilience in processing intricate datasets, supporting its efficacy in real-time academic monitoring and personalized intercessions.
A major insight from our research is that socio-demographic variables—gender, nationality, and age—greatly alter the prediction effectiveness of our models. These variables explained much of the difference in student performance. Finally, by applying sophisticated feature engineering methods, like normalization, one-hot encoding, and interaction term generation, we managed to enhance prediction accuracy across all models by an additional 2%. This increase underscores the necessity of proper data preprocessing in creating accurate and robust predictive models. Based on these findings, we propose several recommendations to leverage machine learning for improving student success in higher education as shown in
Table 5.
Limitations
The findings of this study align closely with Tinto’s framework [
16], which emphasizes the importance of academic and social factors in student retention. The machine learning models highlighted key features, such as cumulative GPA and academic engagement metrics, that correspond with Tinto’s concept [
16] of academic integration as a critical determinant of success. These similarities reinforce the value of theoretical models in guiding and validating data-driven methodologies.
However, certain limitations must be considered to present a balanced perspective on the findings. While the dataset utilized in this study includes data from over 80,000 students enrolled in Saudi higher education institutions, its region-specific nature may limit the generalizability of the results to institutions operating in different educational systems or cultural environments. Additionally, the dataset lacks information on variables such as socio-economic status and psychological factors, which are significant influencers of academic performance but are often excluded from institutional records.
Another challenge pertains to the temporal stability of the findings. The models are based on historical data and assume consistency in patterns over time. Yet, factors such as changes in curricula, shifts in educational policies, or unforeseen events like the COVID-19 pandemic could impact the reliability of these predictions. To address these limitations, future research should focus on expanding datasets to include more diverse contexts, integrating additional variables that capture broader influences on academic performance, and leveraging explainable AI techniques to enhance model transparency and adaptability.
7. Conclusions
This study demonstrates the potential of machine learning, particularly CNNs and federated learning frameworks, in predicting academic performance and identifying at-risk students. By integrating socio-demographic variables and employing explainable AI techniques, this research provides educators with actionable insights to design targeted interventions and improve educational outcomes. Compared to recent studies, this work stands out for its emphasis on interpretability, scalability, and real-time applicability. The practical implications of these findings are significant. Educational institutions can leverage these models to enhance student engagement, reduce dropout rates, and foster equity in learning environments. Moreover, the integration of predictive analytics into learning management systems offers a pathway for scalable, data-driven decision-making in education.
Future research should focus on expanding the scope of predictive models to incorporate longitudinal data and explore the use of transfer learning to improve generalizability across diverse educational contexts. Additionally, ethical considerations, such as data privacy and bias mitigation, must remain central to the development and deployment of educational data mining frameworks.


