Article

Tracking the Expansion of Sonneratia apetala and Its Impact on Local Mangroves Using Time-Series Remote Sensing Data

1
College of Geographical Science, Harbin Normal University, Harbin 150025, China
2
Guangdong Open Laboratory of Geospatial Information Technology and Application, Laboratory of Guangdong for Utilization of Remote Sensing and Geographical Information System, Guangzhou Institute of Geography, Guangdong Academy of Sciences, Guangzhou 510070, China
3
Center for Ocean Remote Sensing, Southern Marine Science and Engineering Guangdong Laboratory (Guangzhou), Guangzhou 511485, China
4
Marine Environmental Monitoring Center of Beihai, Bureau of Environmental Protection of Guangxi, Beihai 536000, China
5
Guangdong Ecological and Environmental Monitoring Center, Guangzhou 510308, China
6
School of Tourism and Culture, Guangdong Eco-Engineering Polytechnic, Guangzhou 510520, China
*
Authors to whom correspondence should be addressed.
These authors contributed equally to this work.
Sustainability 2025, 17(3), 1069; https://doi.org/10.3390/su17031069
Submission received: 11 December 2024 / Revised: 14 January 2025 / Accepted: 26 January 2025 / Published: 28 January 2025

Abstract

:
Mangroves play a crucial role in supporting the biodiversity of coastal wetlands, acting as a vital link between terrestrial and marine ecosystems. In mainland China, Sonneratia apetala, an invasive mangrove species, has recently become dominant in these environments. While it contributes to the stability of mangrove ecosystems and is widely used in coastal restoration efforts, its rapid growth poses a significant threat to the survival of native mangrove species. However, the spatiotemporal growth dynamics and landscape impacts of Sonneratia apetala remain underexplored in scholarly research. This study employs remote sensing and GIS techniques to analyze the growth patterns of Sonneratia apetala over a 14-year period along the eastern coast of the Leizhou Peninsula in China. The analysis revealed the following key findings: (1) The mangrove area expanded from 274.17 hm2 to 383.42 hm2, with an average annual growth rate of 2.84%. (2) The area of Sonneratia apetala increased from 115.15 hm2 in 2010 to 254.81 hm2 in 2023, with an average annual growth rate of 1.29%. The area of local mangrove species declined from 163.02 hm2 to 125.06 hm2 (a decrease from 22.11% to 16.96%), with an average annual growth rate of −1.66%. (3) The number of Sonneratia apetala patches increased from 139 to 324, while the area-weighted shape index rose from 3.4 to 7.81. The decline of native mangrove species, driven by the rapid spread of Sonneratia apetala, suggests that this species is encroaching on native mangrove habitats. Through geospatial analysis, this study provides valuable insights into how introduced species can reshape mangrove landscape structures and the broader implications for regional biodiversity. These findings clearly demonstrate that Sonneratia apetala is encroaching upon local mangrove habitats, highlighting the urgent need for strategic management and conservation efforts to mitigate the ecological impacts of the proliferation of this species. Furthermore, this research is important for coastal sustainability management strategies that balance ecological restoration with the preservation of native biodiversity, ensuring long-term ecosystem health and resilience.

1. Introduction

Mangrove forests are vital ecosystems that connect coastal wetlands and oceanic environments, providing essential ecological services such as coastal protection, water purification, and habitat for diverse marine and terrestrial species [1,2,3,4]. Their root systems stabilize shorelines, reduce erosion, and support biodiversity by offering breeding grounds for various fish, crustaceans, and birds [5,6,7]. Mangroves also play a critical role in addressing global environmental challenges, including sea-level rise and climate change, and have been included in the wetland classification system established by The Convention on Wetlands (CWC) [8]. In summary, these ecosystems are crucial for maintaining coastal water quality and supporting marine life. Mangrove forests cover about 1.5 × 10⁸ hm2 globally, mainly found between the Tropic of Cancer and the Tropic of Capricorn [9]. Over the past fifty years, mangroves have significantly declined due to human activities, logging, climate change, and pollution, with 35% of global mangrove forests disappearing [10]. In China, mangrove area decreased by nearly 50% from the 1950s to 2000 [11]. However, since 1995, China has recognized the importance of mangroves and implemented policies for their protection and restoration, leading to some of the largest mangrove afforestation efforts globally [12,13]. The dynamics of mangrove forests in China are complex, characterized by both destruction and restoration. Consequently, a comprehensive understanding of the dynamic evolution of mangrove forests, particularly Sonneratia apetala forests, is crucial for enhancing our knowledge of this ecosystem and developing effective management strategies.
Sonneratia apetala, native to Southeast Asia, was introduced to China in the late 1980s for mangrove restoration and coastal protection in regions like Guangdong, Guangxi, and Hainan [14]. Known for its rapid growth, high adaptability to saline conditions, and ability to stabilize coastal soil, it became a popular choice for restoration [15]. Initially, its invasive nature was not well recognized, but over time, its rapid spread raised concerns about its impact on native mangrove ecosystems [16]. Although Sonneratia apetala helps mitigate coastal erosion and provides a habitat for marine organisms, its dense growth has negative ecological effects [17]. Since 1998, it has been widely planted along China’s South Coast, covering 3800 hm2 [18]. However, its dense canopy blocks light from reaching the understory, hindering the growth of native mangrove species like Barringtonia asiatica and Avicennia marina [19]. For example, after five years, the survival rates of Lumnitzera racemosa and Avicennia marina were drastically reduced [20]. At high planting densities (2500 trees per hectare), native species struggle to survive, highlighting the significant impact of this species on native mangrove communities [21].
Many studies use remote sensing and landscape indices to analyze mangrove landscape changes and understand their growth patterns, with research conducted globally, including regions such as Europe, the United States, and China. For instance, Gao et al. [22] utilized spatial metrics to study mangrove ecosystems at high latitudes, while Buiture et al. [23] applied time-series satellite imagery in the Philippines. Chamberlain et al. [24] examined mangrove landscape and climate changes in Queensland, Australia, and Xin et al. [25] explored the impact of land use changes on mangrove wetlands in Dongzhai Harbor. Most studies in China have focused on mangroves in Hainan, Guangxi, and Guangdong [26], but many have relied on Landsat imagery, which has low resolution, leading to overestimated mangrove areas and missed smaller patches, thus impacting the accuracy of fragmentation assessments. As remote sensing technology continues to advance with broader coverage, frequent repetition, and low costs, it has become increasingly important for monitoring mangrove ecosystems [27]. Over time, improvements in spatial and spectral resolution have shifted mangrove monitoring from general dynamic assessments to more detailed population distribution studies [28]. While medium-resolution multispectral imagery is widely used for mapping mangrove distribution at regional and global scales [29], high-resolution images are now applied for species classification [30,31], and hyperspectral data are particularly effective for species identification [32]. Remote sensing enables the collection of mangrove distribution data over time, supporting dynamic monitoring [33]. With the growing availability of remote sensing data, time-series analysis has become a major focus of research [34].
Researchers have increasingly used remote sensing to study the expansion of Sonneratia apetala due to its rapid spread and ecological impact on mangrove ecosystems. Satellite imagery, such as Landsat and Sentinel-2, is commonly employed to monitor changes in mangrove cover over time, as these platforms provide valuable data on land use and vegetation distribution [35]. Time-series analysis of remote sensing data allows for the assessment of spatial and temporal dynamics of Sonneratia apetala populations, including their spread and encroachment on native mangrove species [36]. Additionally, high-resolution imagery combined with machine learning algorithms, like object-based and pixel-based classification methods, has been used to improve species identification and mapping accuracy. This approach helps distinguish Sonneratia apetala from native mangrove species and provides insights into its impact on local biodiversity and ecosystem structure. Overall, remote sensing has become a powerful tool for understanding the expansion of this species and guiding effective management and restoration strategies. However, long-term monitoring is still transitioning from sporadic to continuous time-series data, and further refinement in methods is needed, especially for studying long-term ecological changes in Sonneratia apetala species.
This study analyzes the dynamic changes in Sonneratia apetala forests along the Leizhou Peninsula’s east coast using remote sensing data. It focuses on the spatial distribution, growth, and impact of Sonneratia apetala on local mangroves. Using Landsat data, Sentinel-2 data, and XGBoost, this study classifies mangroves into Sonneratia apetala and local species. The results highlight changes in area, spatiotemporal patterns, and the ecological effects of Sonneratia apetala on local mangroves and biodiversity. These insights are important for guiding restoration, ecosystem protection, and sustainable development in the region.

2. Materials and Methods
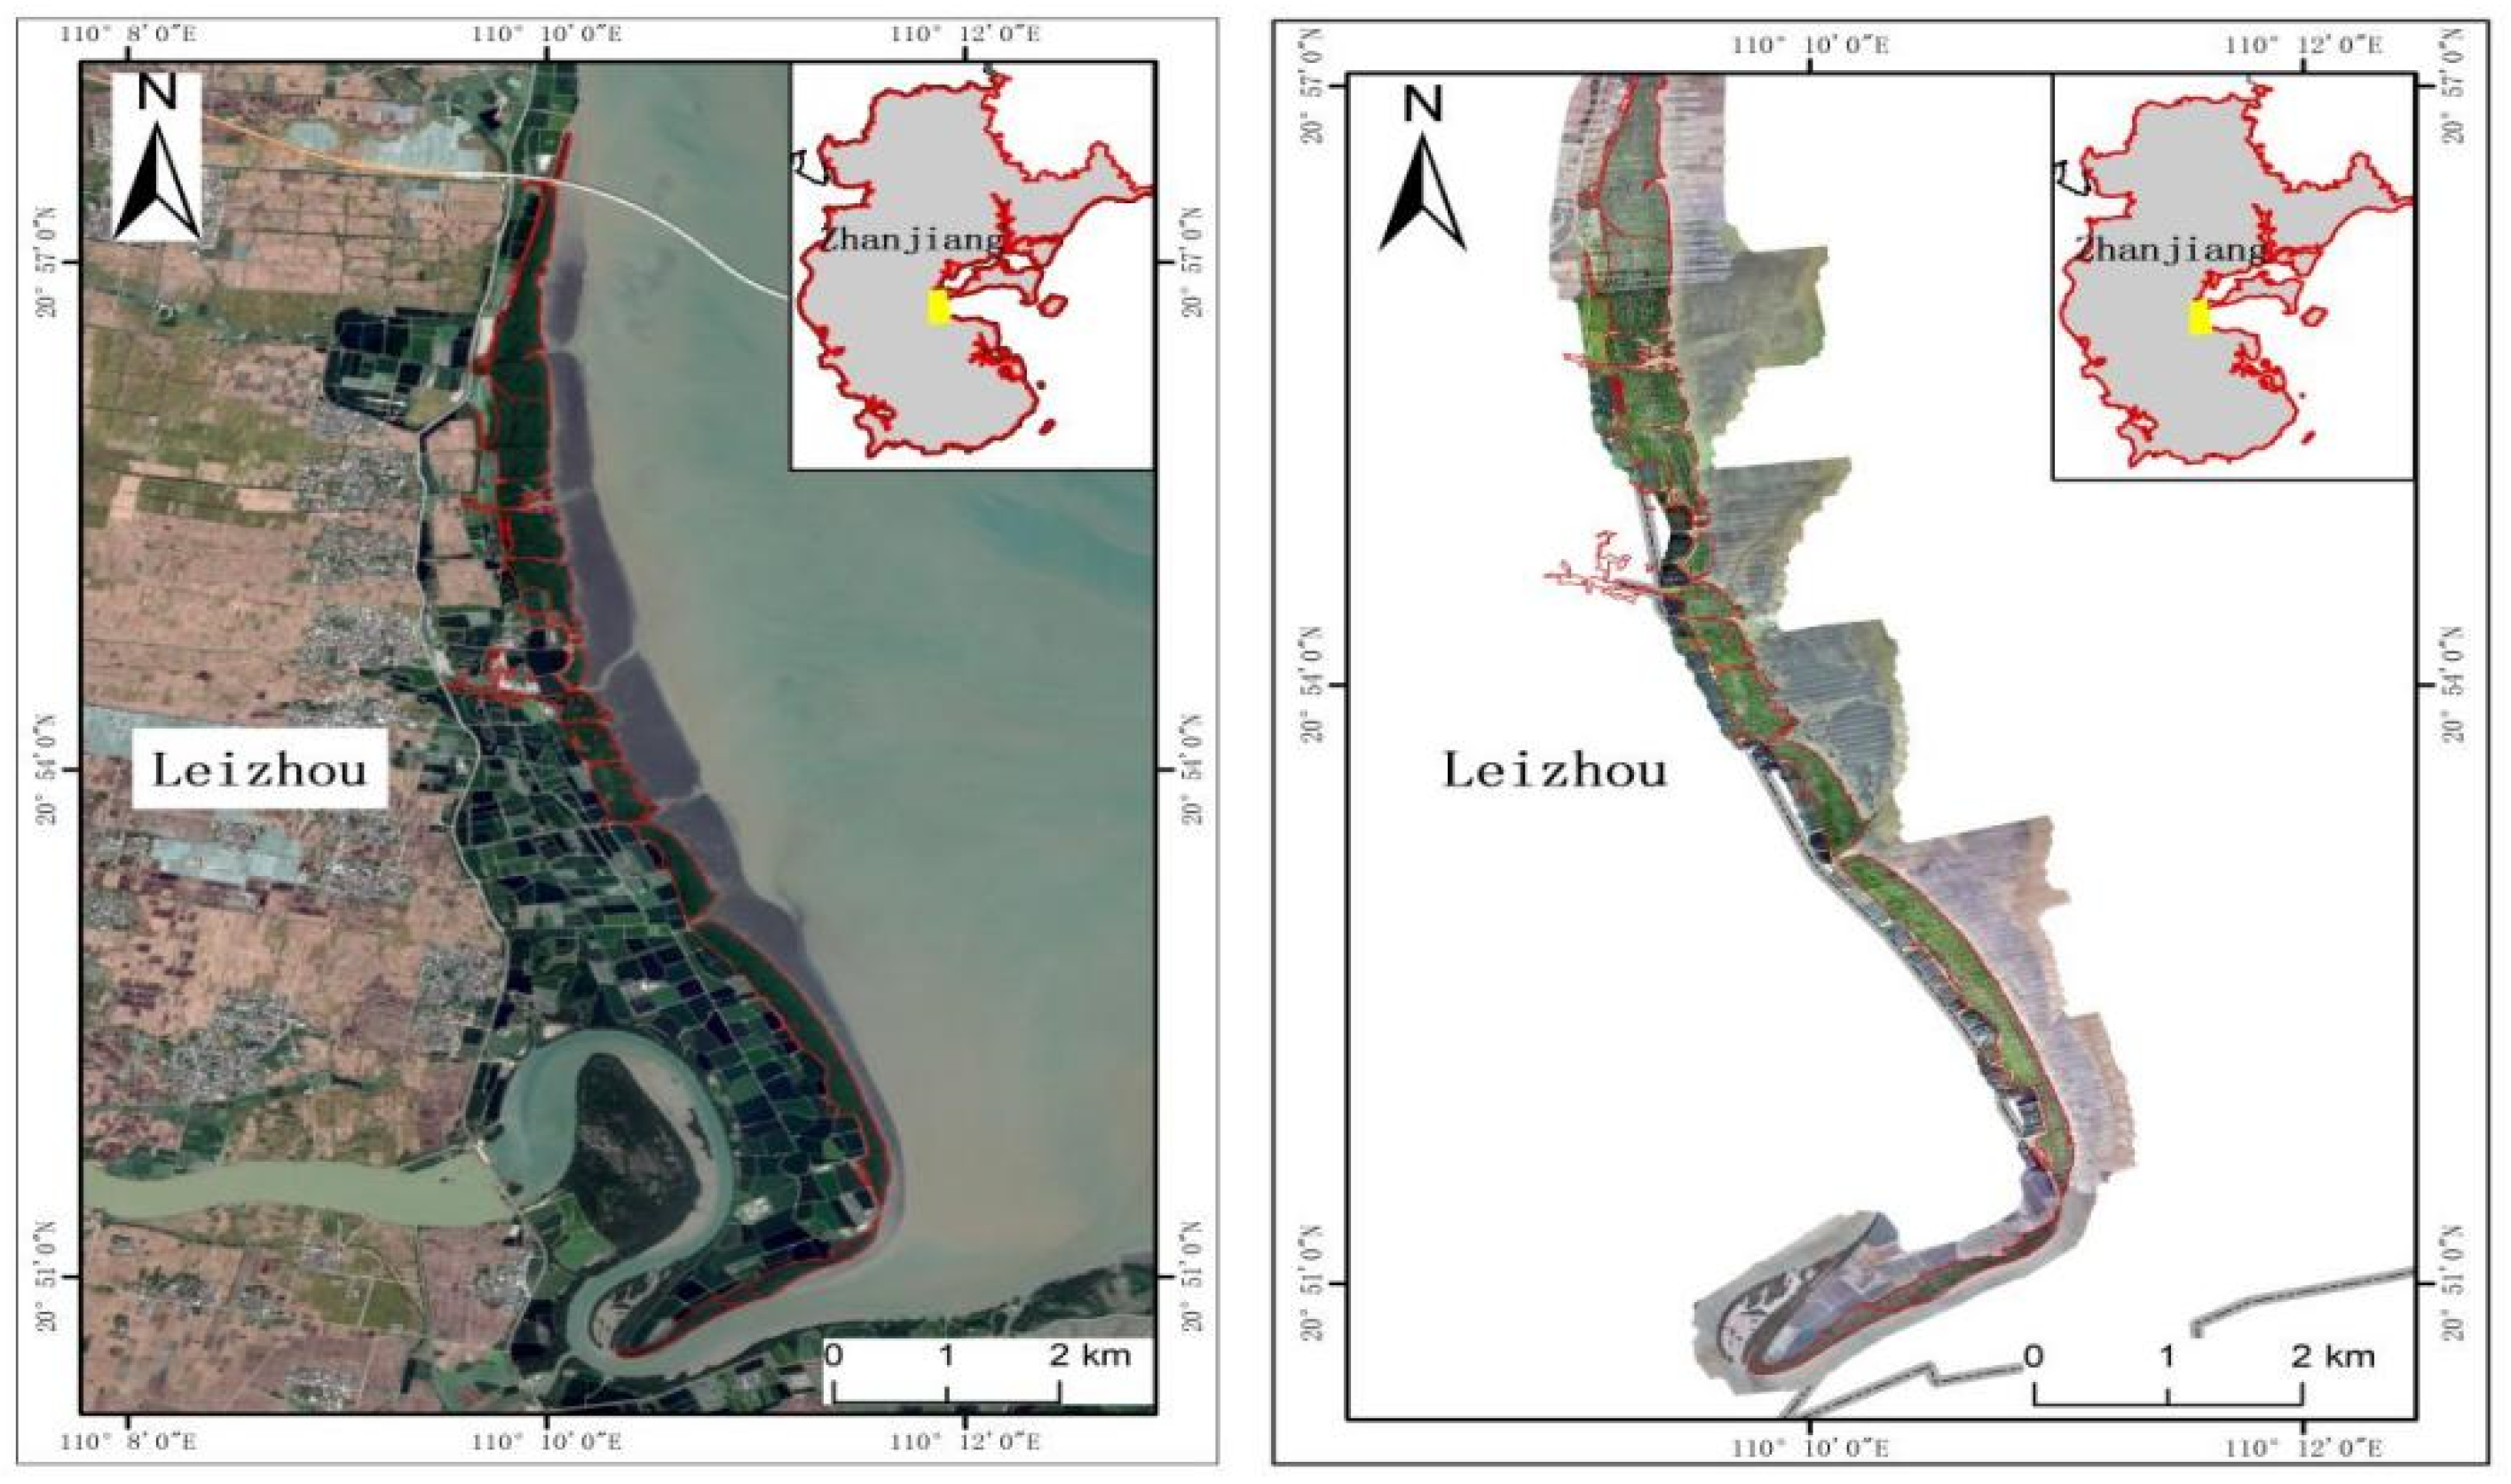
2.1. Study Area

The Leizhou Peninsula, located in the southernmost part of mainland China, is bordered by the South China Sea to the east, the Qiongzhou Strait to the south, and the Beibu Gulf to the west. The terrain is relatively gentle, rising in the northwest and sloping toward the southeast, with a maximum elevation of 1000 m. The region experiences a tropical oceanic monsoon climate characterized by distinct dry and wet seasons. Coastal areas are frequently affected by typhoons during the summer and fall. The east coast of the peninsula experiences irregular semidiurnal tides, while regular tides are observed along the west coast. Most mangrove forests on the Leizhou Peninsula are situated on the leeward sides of estuaries, bays, and islands. The region predominantly features sandy beaches, with sandy mudflats limited to estuaries and bays [37]. The mangroves on the Leizhou Peninsula are predominantly composed of artificially planted Sonneratia apetala communities, which exhibit the fastest growth rates. The artificial cultivation of Sonneratia apetala on the Leizhou Peninsula began in the late 1980s. By the early 1990s, the scale of cultivation gradually expanded. The planting of Sonneratia apetala on the Leizhou Peninsula is still ongoing to this day. Due to their relatively typical growth patterns, this region serves as an ideal study area for investigating the growth and evolution of Sonneratia apetala. The extent of the mangrove forests was determined using drone data from 2022 and field surveys (Figure 1).

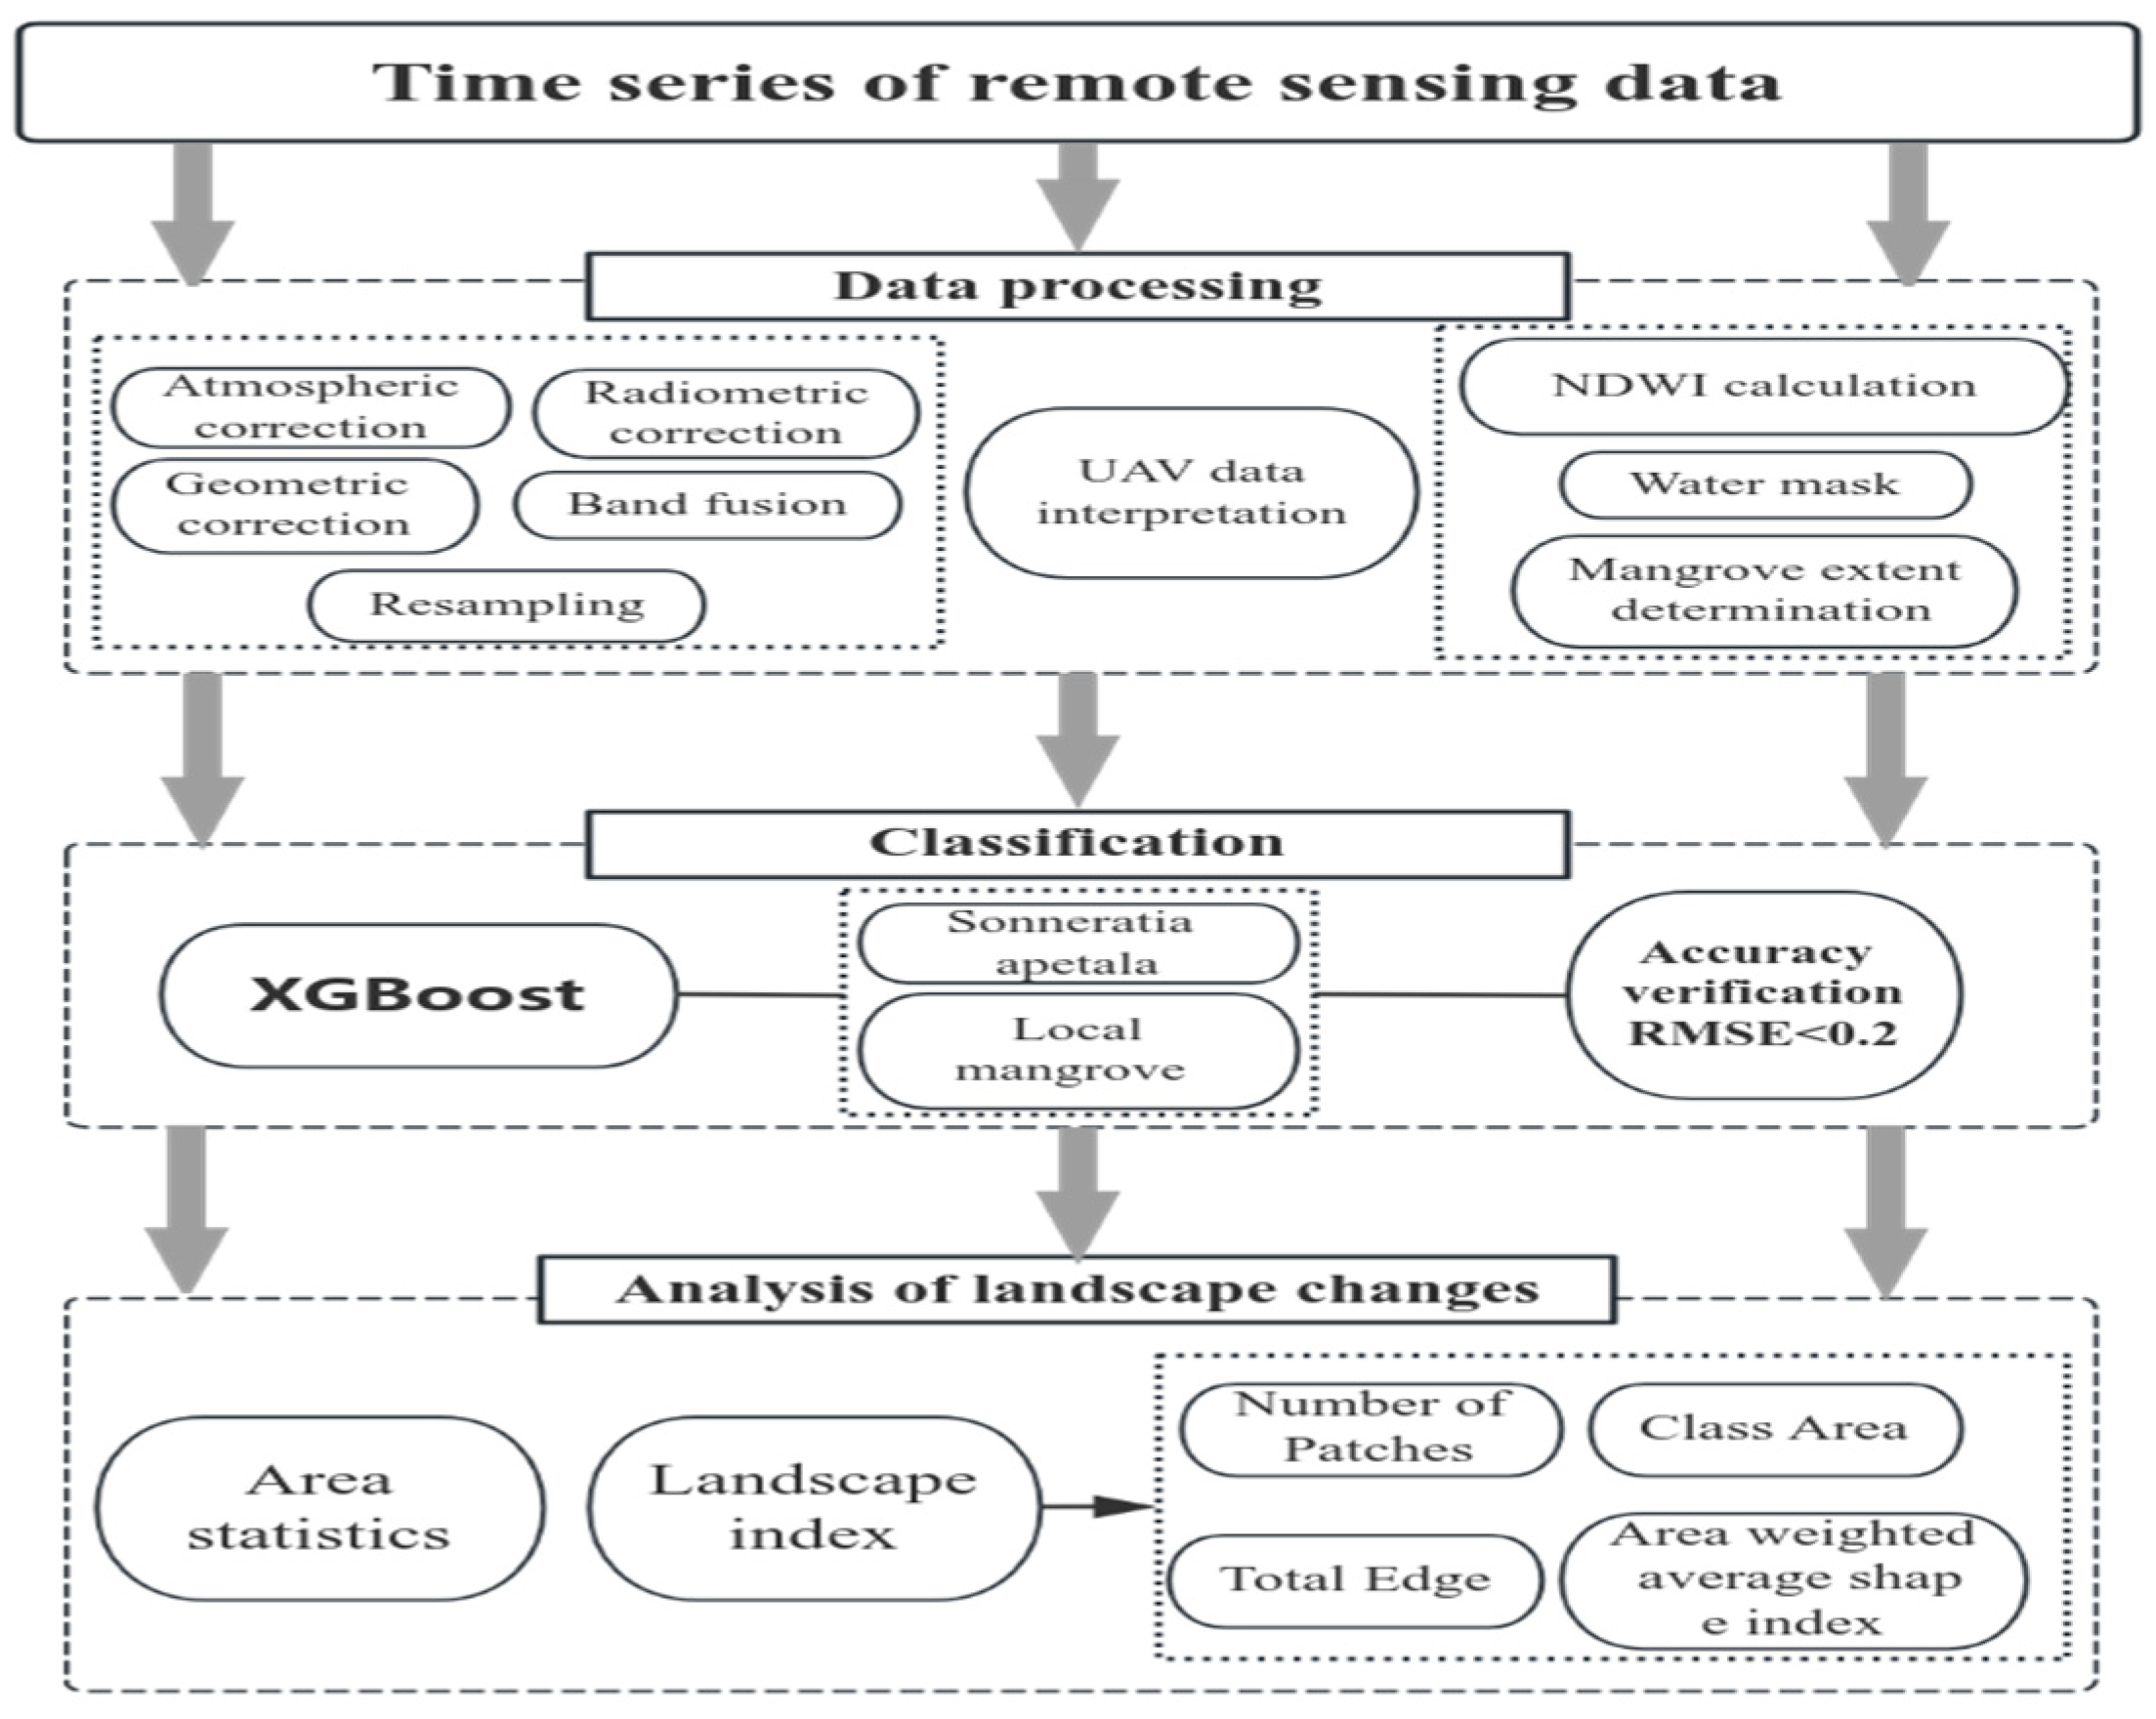
2.2. Data Sources and Preprocessing

Landsat (2010–2015) and Sentinel-2A (2016–2023) data were used to perform a classification. The Sentinel-2A imagery was obtained from the European Space Agency (ESA) website ((https://scihub.copernicus.eu/ (accessed on 2016-2023)), and the Landsat data were derived from the United States Geological Survey (USGS) Earth Explorer website (https://earthexplorer.usgs.gov/ (accessed on 2010-2015)). We used historical imagery from Google Earth (2010–2023) and UAV data from 2022 (with a spatial resolution of 0.05 m) to select samples from high-resolution imagery within the same timeframe.
All remotely sensed data were preprocessed, including geometric, radiometric, and atmospheric correction, reprojection to the WGS-84 coordinate system, layer stacking, pansharpening, and resampling of the Landsat data to 10 m resolution using bilinear interpolation. The data were then clipped to the study area.

2.3. Water Mask

The normalized difference water index (NDWI) [38] was utilized to mask water bodies. Expert knowledge and training samples were used to determine the threshold between water and vegetation. Regions with NDWI values greater than −0.2 were water bodies, and those with values smaller than −0.2 were vegetation areas (Table 1).

2.4. Methods

We used remote sensing data and Google Earth historical images from 2010 to 2023, as well as a field survey to determine the ground truth and classify the mangrove forests. The XGBoost algorithm was employed for classification. Key metrics, including the area and landscape indices of mangrove plants in different categories (number of mangrove patches, area of the patches, total edges, and the area-weighted average shape index), were calculated to analyze the growth and evolution of Sonneratia apetala. The workflow is illustrated in Figure 2.

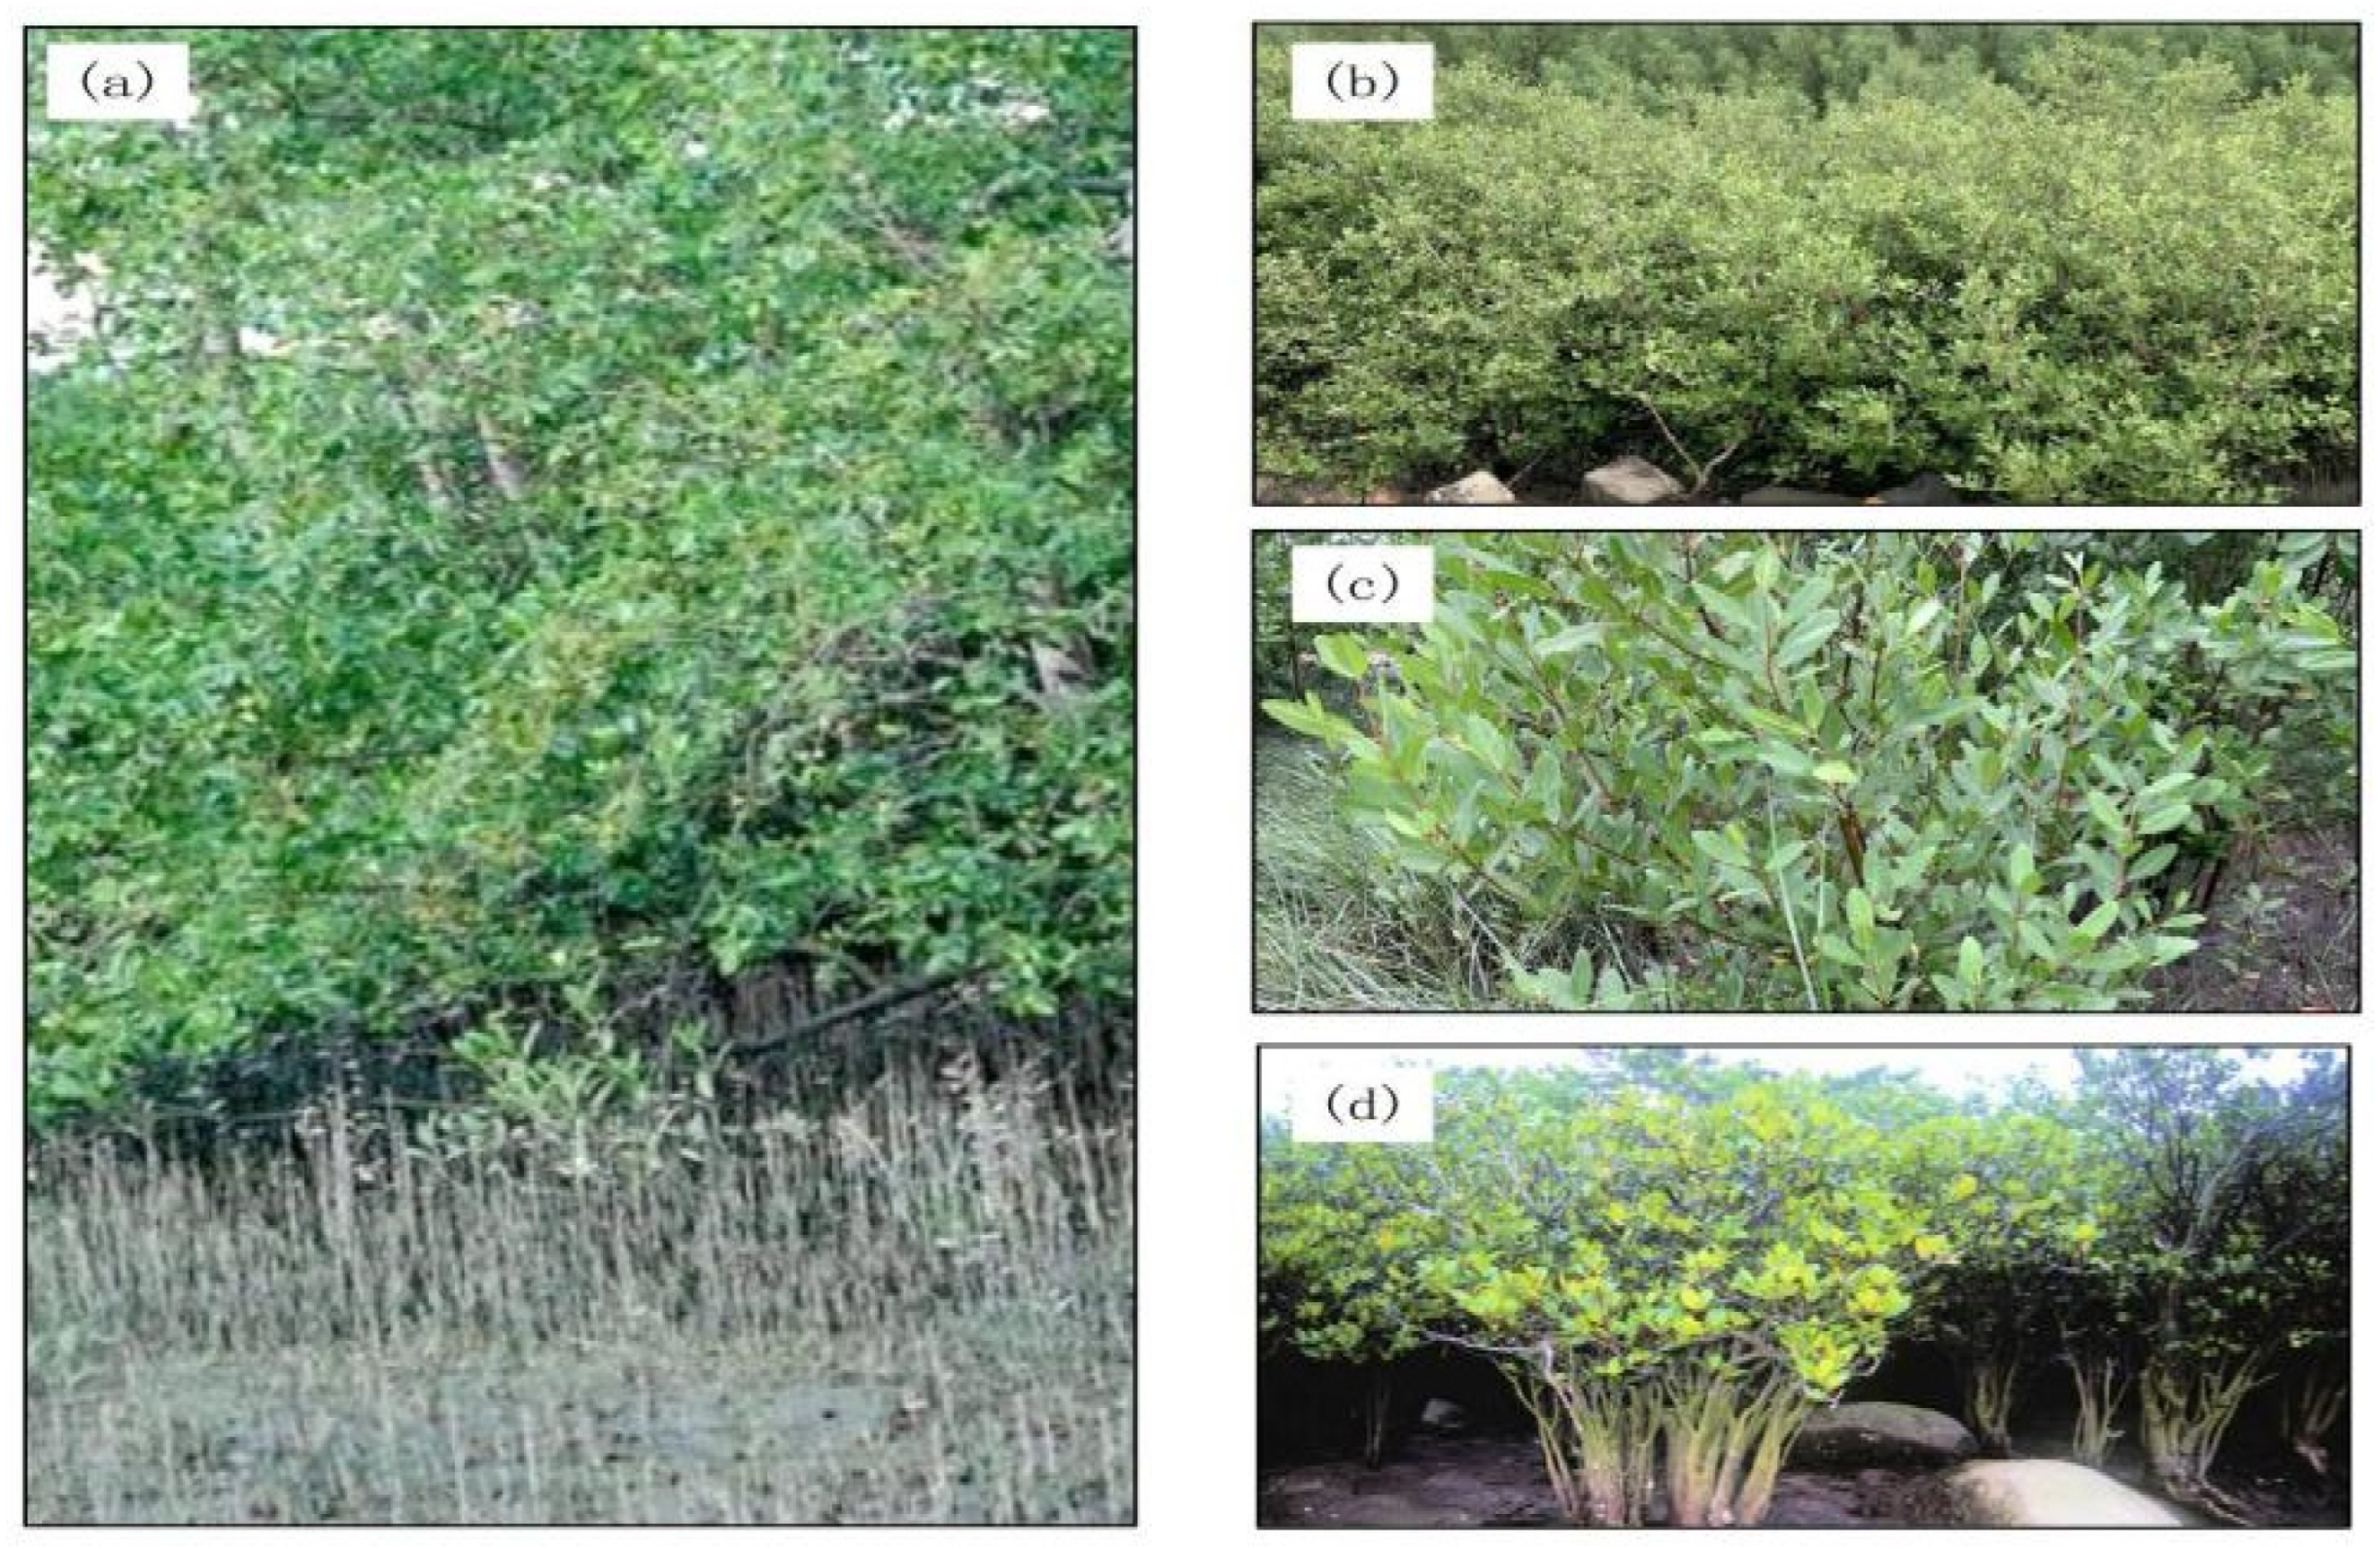
2.4.1. Classification of Mangrove Species

Mangrove Classification Rules

We performed a visual interpretation of the remote sensing images, Google Earth historical images, and drone field survey data to determine the classification rules. The mangrove forests were categorized as Sonneratia apetala and local mangrove species that included Kandelia obovata, Avicennia marina, and Aegiceras corniculatum. The local mangrove species are shown in Figure 3.

Classification

The classification method was XGBoost, a machine learning algorithm that improves performance by correcting the errors of previous models in each iteration. It can handle large-scale data and high-dimensional features and has strong generalization capabilities [39]. Mangrove forests are unique ecosystems. The accurate classification of their tree species is essential for ecological research and conservation efforts. XGBoost has a high classification performance. Thus, we chose it for this study. Python software was used to implement XGBoost to classify mangrove forests; thus, this process is not described in detail. XGBoost was applied to image classification by first vectorizing the image data. Each image was flattened into a 1D feature vector, where each pixel and additional features (e.g., color histograms, texture features) were used as inputs. The following parameters were used: objective = ’multi:softmax’, booster = ’gbtree’, eta = 0.005, max_depth = 10, n_estimators = 100, subsample = 0.4, and colsample_bytree = 0.7. Images were preprocessed by normalizing pixel values and extracting additional texture features, such as Local Binary Patterns (LBPs), to enhance the model’s performance in classifying different land cover types. After identifying various land cover types, high-resolution drone imagery from 2022 was combined with historical images from Google Earth (2010–2023). The Random Sampling tool in the Data Management module was employed to generate random points. These points were then used to select 1000 pixels from each land cover type as training samples for the remote sensing imagery.

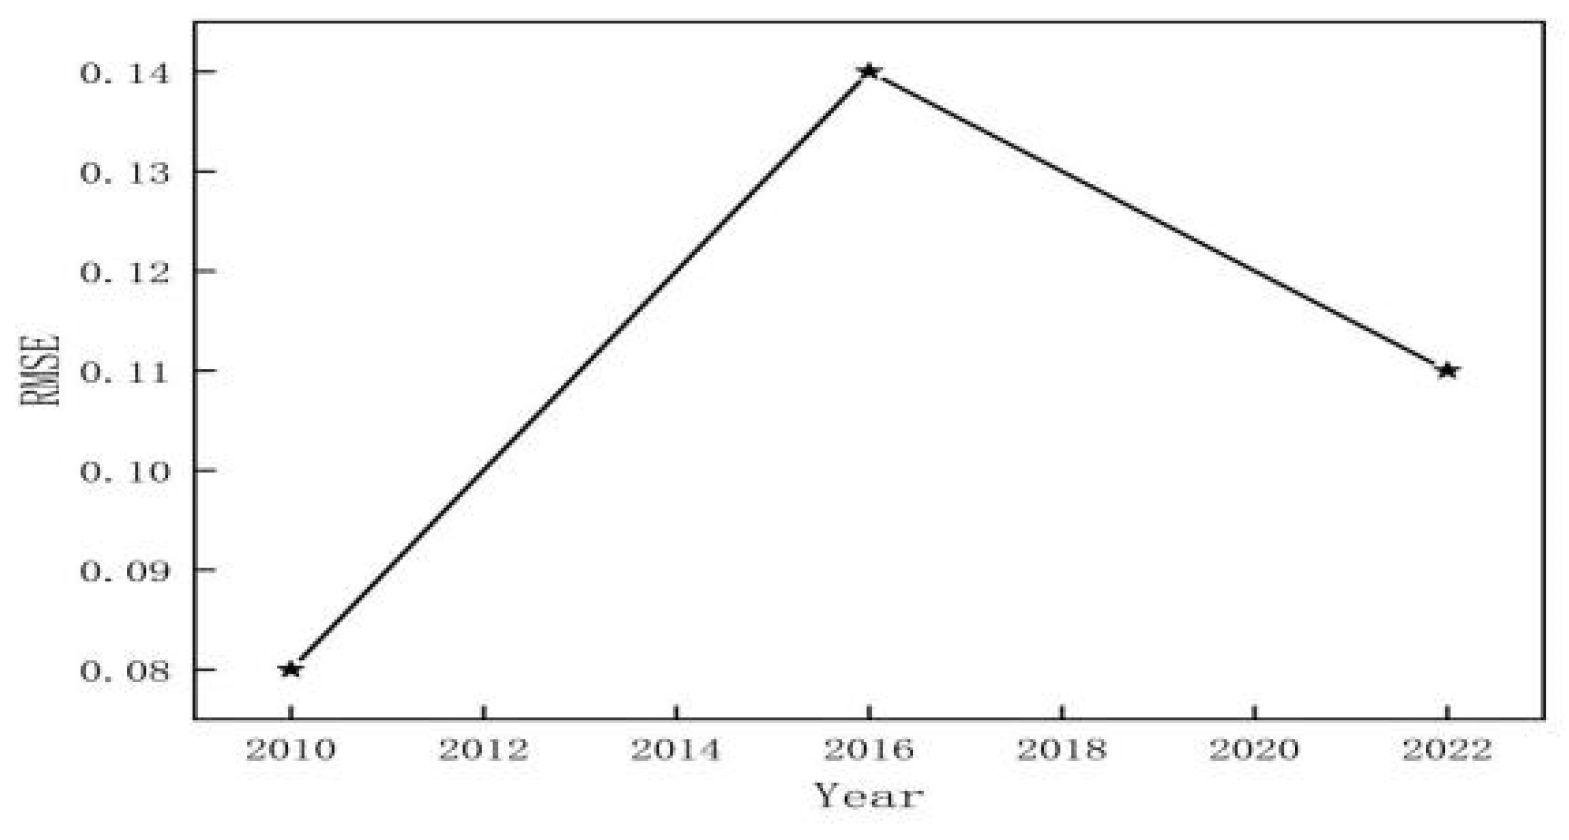
2.4.2. Accuracy Verification

Given the slow growth of mangroves, annual changes are not easily discernible. Therefore, we focused on three key time points within the 14-year period (2010, 2016, and 2022) to evaluate classification accuracy. The validation sample size was 10 × 10 pixels (100 m × 100 m), and the proportion of features in the sample window was used as the estimated value. Sampling windows were acquired on the 2022 UAV high-resolution images, and the proportion of different features in the sampling area was calculated by visual interpretation. These proportions served as the reference values for each feature. A total of 30 validation samples were used for each type. The root mean square error (RMSE) of the reference and estimated values was calculated. Since the reference data for the 2022 UAV images and the 2022 Google Earth historical images were identical, we utilized Google Earth validation data from 2010 and 2016 to evaluate classification accuracy.
The RMSE reflects the deviation between the predicted and real values. The smaller the value, the higher the accuracy and the better the model performance. The RMSE is calculated as follows:
R M S E = i = 1 N Y i X i 2 / N
where X i is the estimated value for a feature; Y i denotes the reference value for a feature.

2.4.3. Analysis of Landscape Pattern Change

Four landscape indices, the number of patches, class area, total edge, and area-weighted mean shape index, were calculated to characterize the growth and evolution of Sonneratia apetala. Landscape indices reflect the landscape pattern and can be used to quantify the landscape structure, composition, and spatial configuration. They are widely applied in landscape ecology to analyze patterns and monitor changes over time [40]. We used landscape indices to examine the fragmentation of Sonneratia apetala forests and evaluate their impact on local mangrove species to provide a scientific basis for environmental management and protection. The class area was used to measure changes in the proportion of Sonneratia apetala. The number of patches and the total edge length were used to infer the degree of fragmentation and assess the health of mangrove forests. The area-weighted mean shape index was used to determine changes in the shape of the patches, reflecting the ability of Sonneratia apetala to withstand disturbances. The equations of the four parameters are listed in Table 2:

3. Results and Discussion

3.1. Classification Accuracy

Accuracy validation was performed on the RMSE of the eastern coast of Leizhou City for the years 2010, 2016, and 2022 using precision verification methods. The results showed in Figure 4 that the classification accuracy RMSE values were 0.08 for 2010, 0.14 for 2016, and 0.11 for 2022, all below 0.2. These findings demonstrate the effectiveness of the classification method employed in this study. In addition to the RMSE values reported for classification accuracy, we calculated additional precision metrics, including precision, recall, Kappa coefficient, and F1-score for each class. The F1-scores for 2010, 2016, and 2022 were 0.87, 0.71, and 0.78, respectively, reflecting a balanced performance between precision and recall. These findings provide a more comprehensive evaluation of the classification results and identify areas where further improvements can be made.

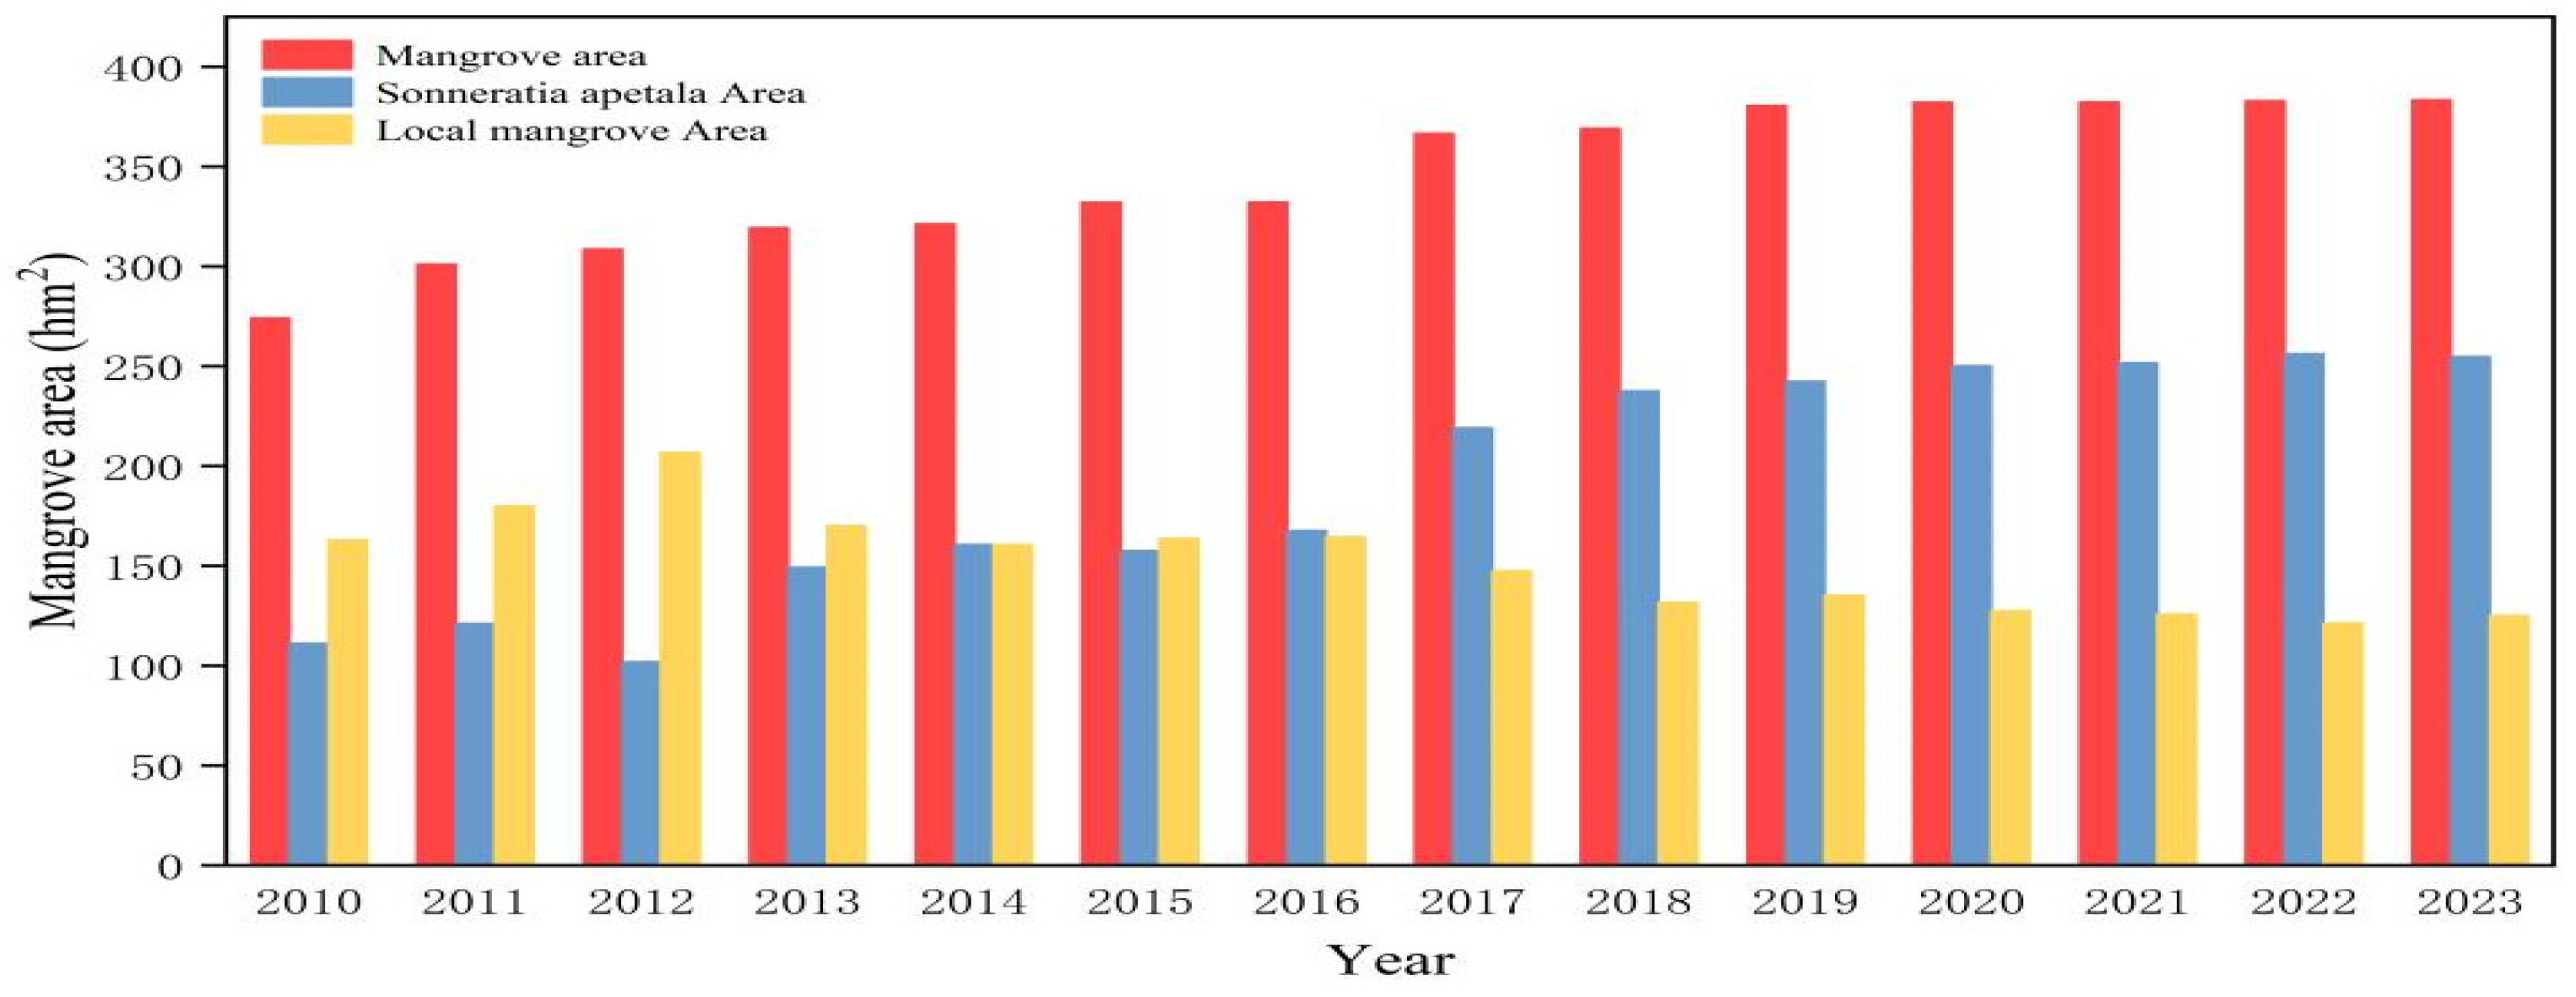
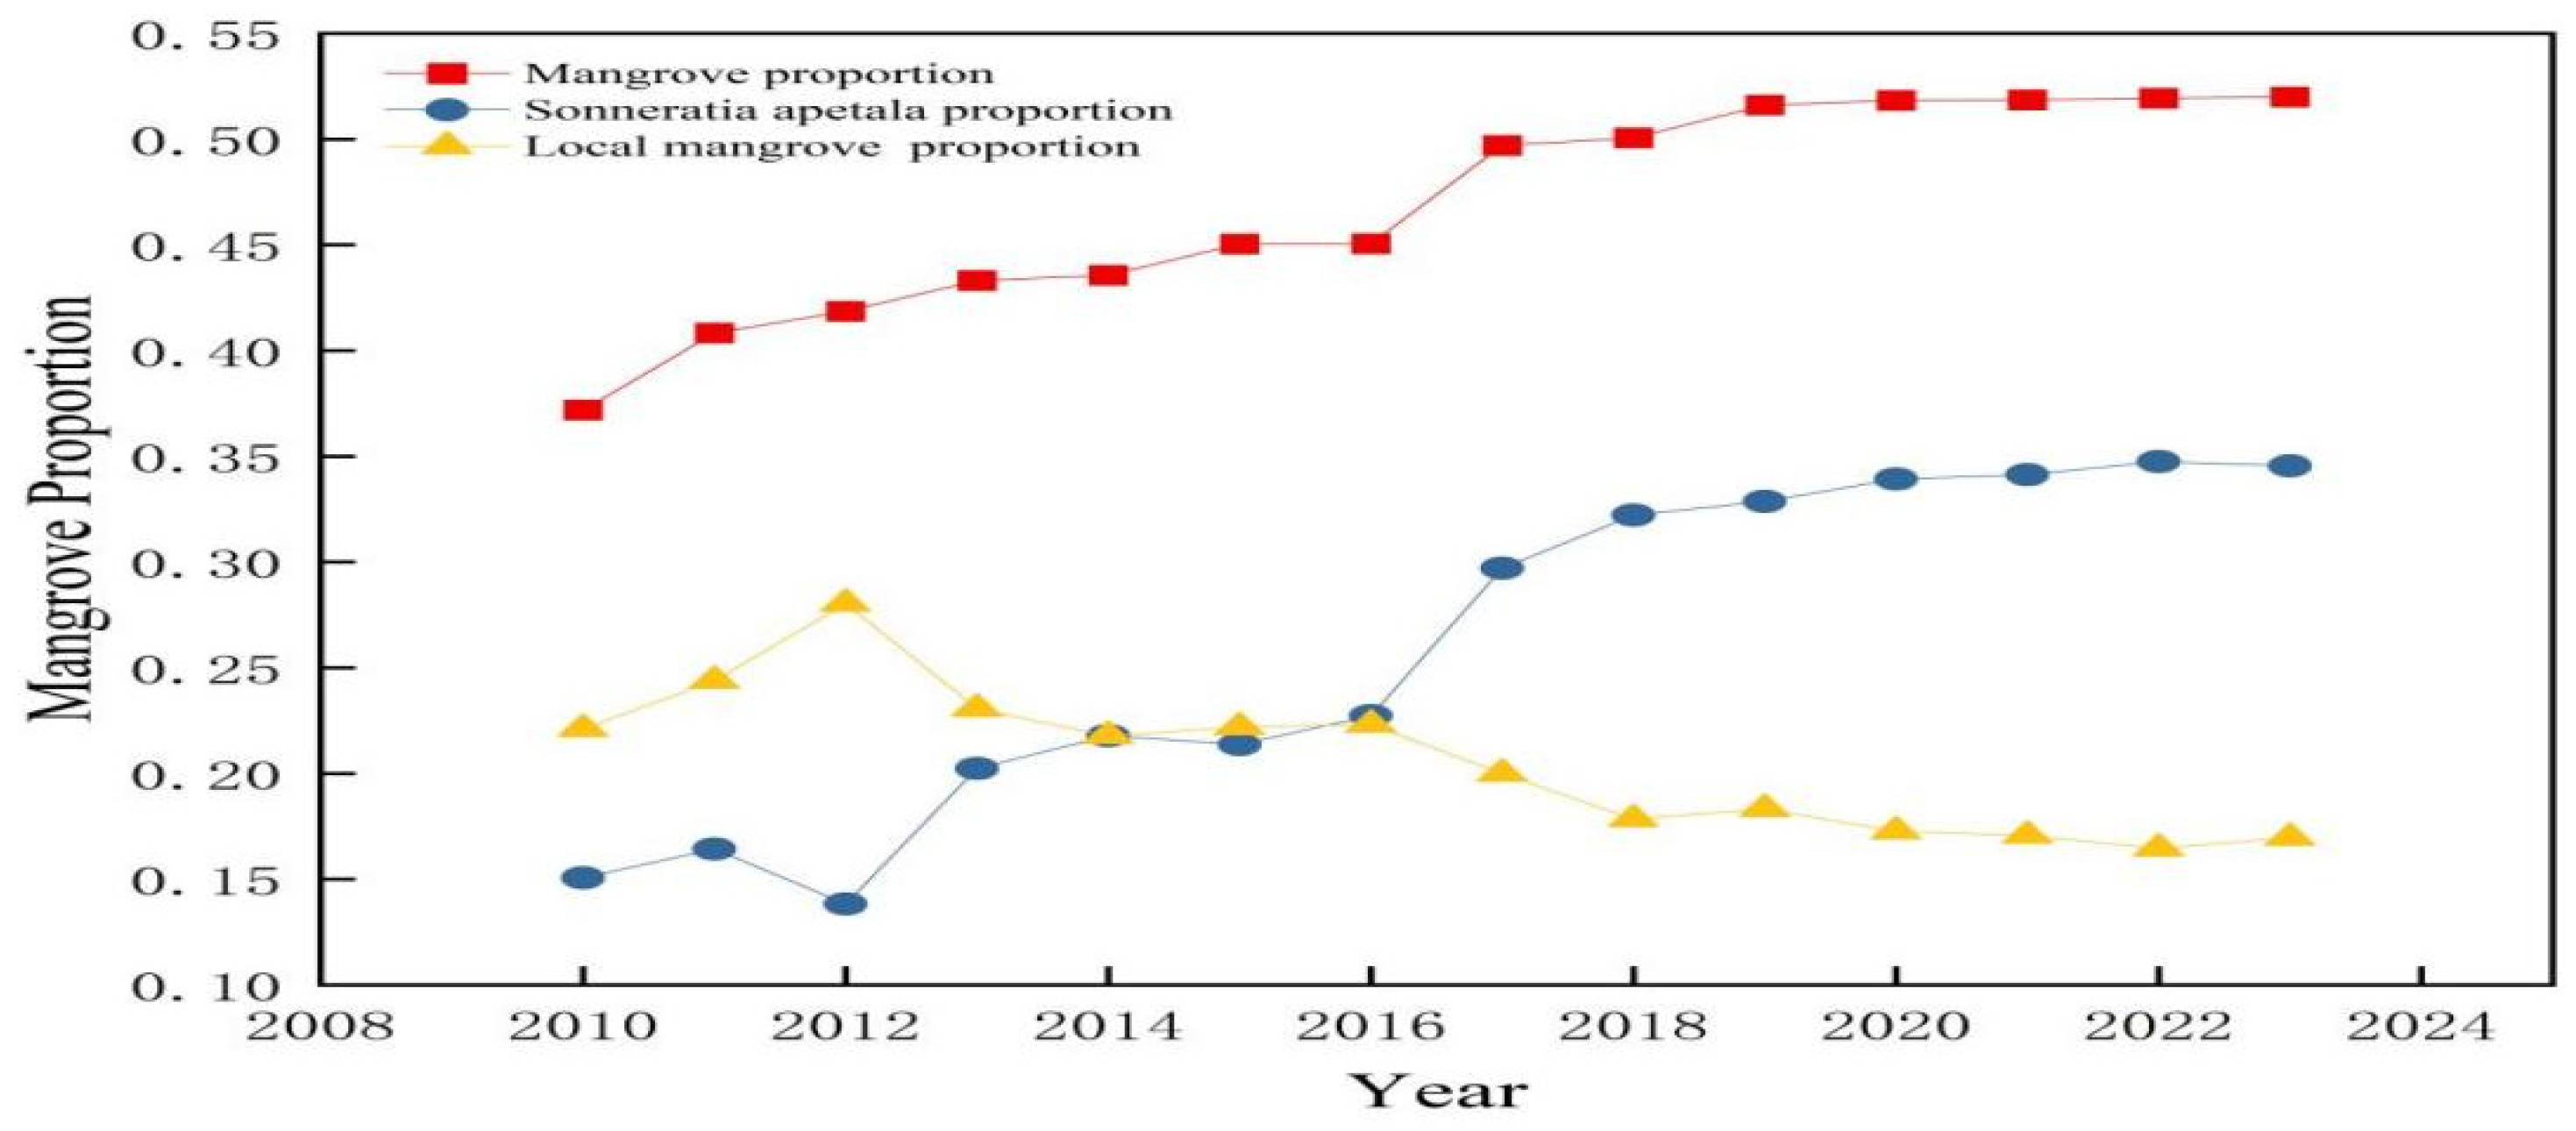
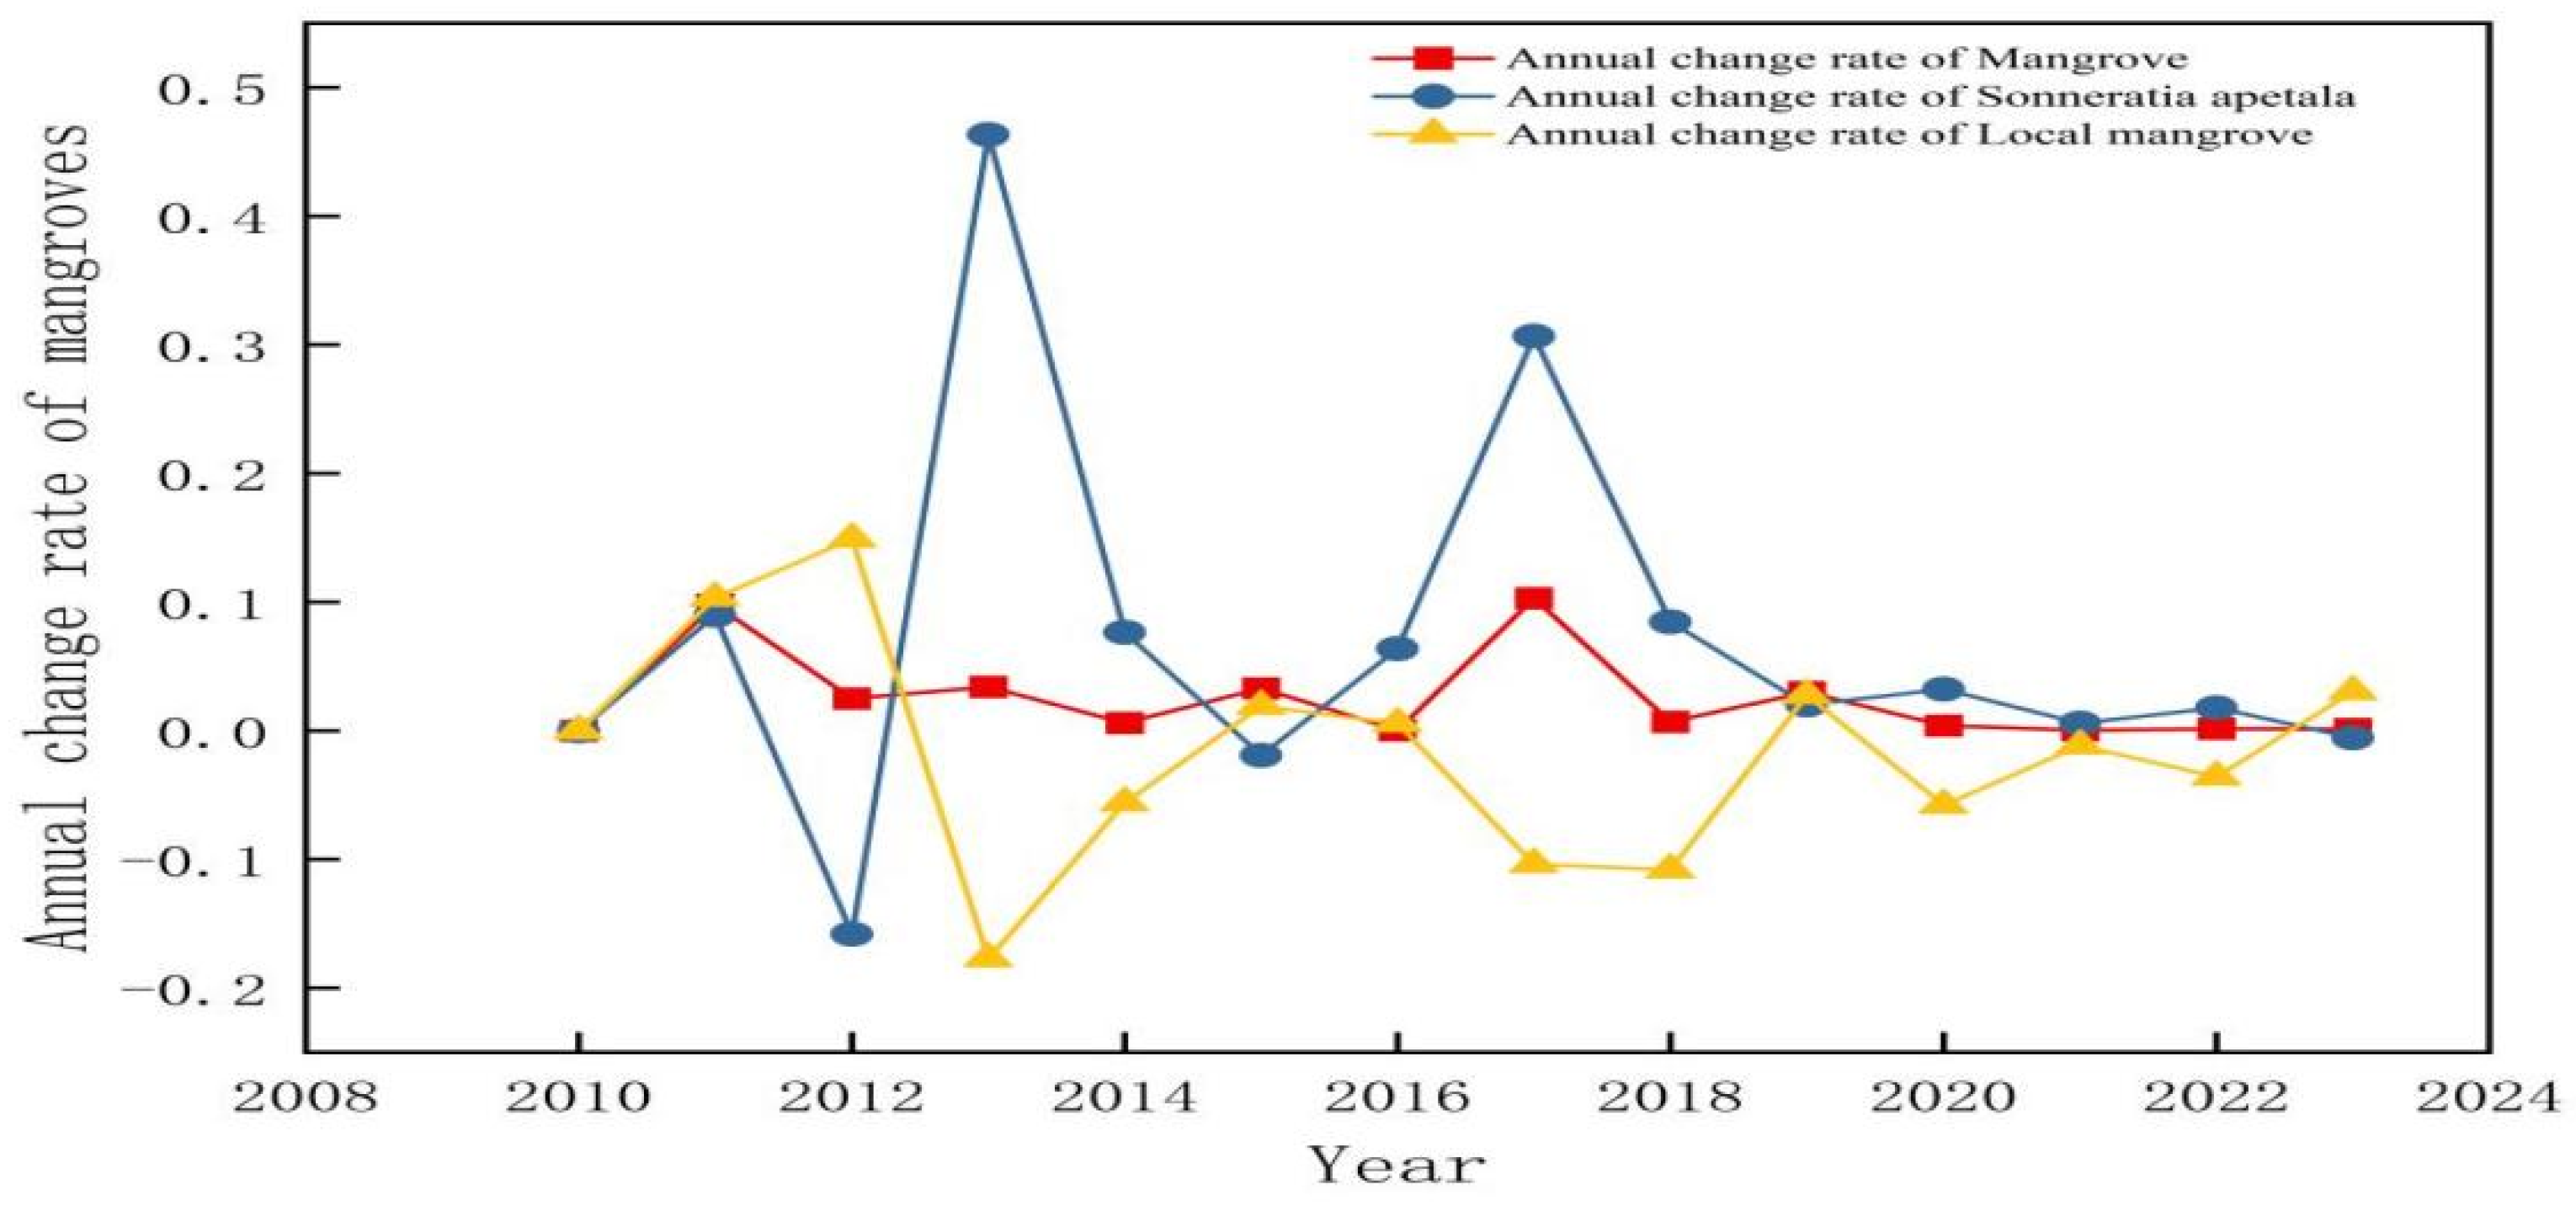
3.2. Changes in Mangrove Forests from 2010 to 2023

The Leizhou mangrove forests have increased substantially during the past two decades. The forests have grown rapidly in recent years and expanded into the ocean. Table 3 and Figure 5 show the changes in the mangrove forests in typical areas along the east coast of Leizhou City. The following was observed regarding the distribution of mangrove forests from 2010 to 2023. The mangrove wetland area on the east coast of Leizhou City exhibited a significant upward trend in the last two decades [41]. The mangrove area was 274.17 hm2 in 2010 and 383.42 hm2 in 2023, representing an increase of 109.25 hm2 and a growth rate of 7.80 hm2/a. Due to problems with the raw data, a large error was generated for 2012; therefore, this year was not considered in the statistical results.
The most notable increase in mangrove forest area occurred from 2010 to 2011, with a one-year growth of 26.85 hm2. From 2010 to 2016, the growth rate was particularly significant, resulting in an increase of 58.06 hm2. Although the growth of mangrove forests slowed from 2017 to 2023, the trend remained upward, with mangroves expanding to cover more than half of the study area. Thus, we conclude that the Leizhou mangrove forests have shown a substantial growth trend over the past two decades. This ongoing trend highlights successful restoration efforts driven by increased awareness of conservation and enhanced protection measures implemented by the government [42]. The area occupied by Sonneratia apetala has also expanded significantly between 2010 and 2023. This growth is primarily attributed to both its natural spread and large-scale artificial cultivation. The species was widely planted during the 1990s and 2000s, and by 2010, it had become well established in the region. In the years that followed, its spread continued to be driven by natural processes. Additionally, localized planting and restoration efforts have been ongoing in the study area between 2010 and 2023. As a result, much of the increase in Sonneratia apetala cover during this period can be attributed to its natural expansion, as well as continued human intervention, surpassing the coverage of native mangrove species.
Figure 6 shows the proportion of mangrove forests in the study area from 2010 to 2023. The proportion showed an increasing trend from 37.18% in 2010 to 51.99% in 2023. The proportion of Sonneratia apetala also showed an increasing trend annually. It was 15.07% in 2010 and 34.55% in 2023. In contrast, the proportion of local mangroves decreased from 22.11% in 2010 to 16.96% in 2023.
Figure 7 shows the average annual rate of change of mangrove forests from 2010 to 2023. The average annual rate of change of Sonneratia apetala fluctuated in the range of −0.1–0.1, indicating that this species increased steadily in the last 14 years. In contrast, the fluctuations in the mean annual change of the local mangroves were minimal, indicating that the influence of Sonneratia apetala caused instabilities in the local mangroves, especially during the rapid spread of Sonneratia apetala from 2016 to 2017, resulting in a large decline in the mean annual change in 2017.

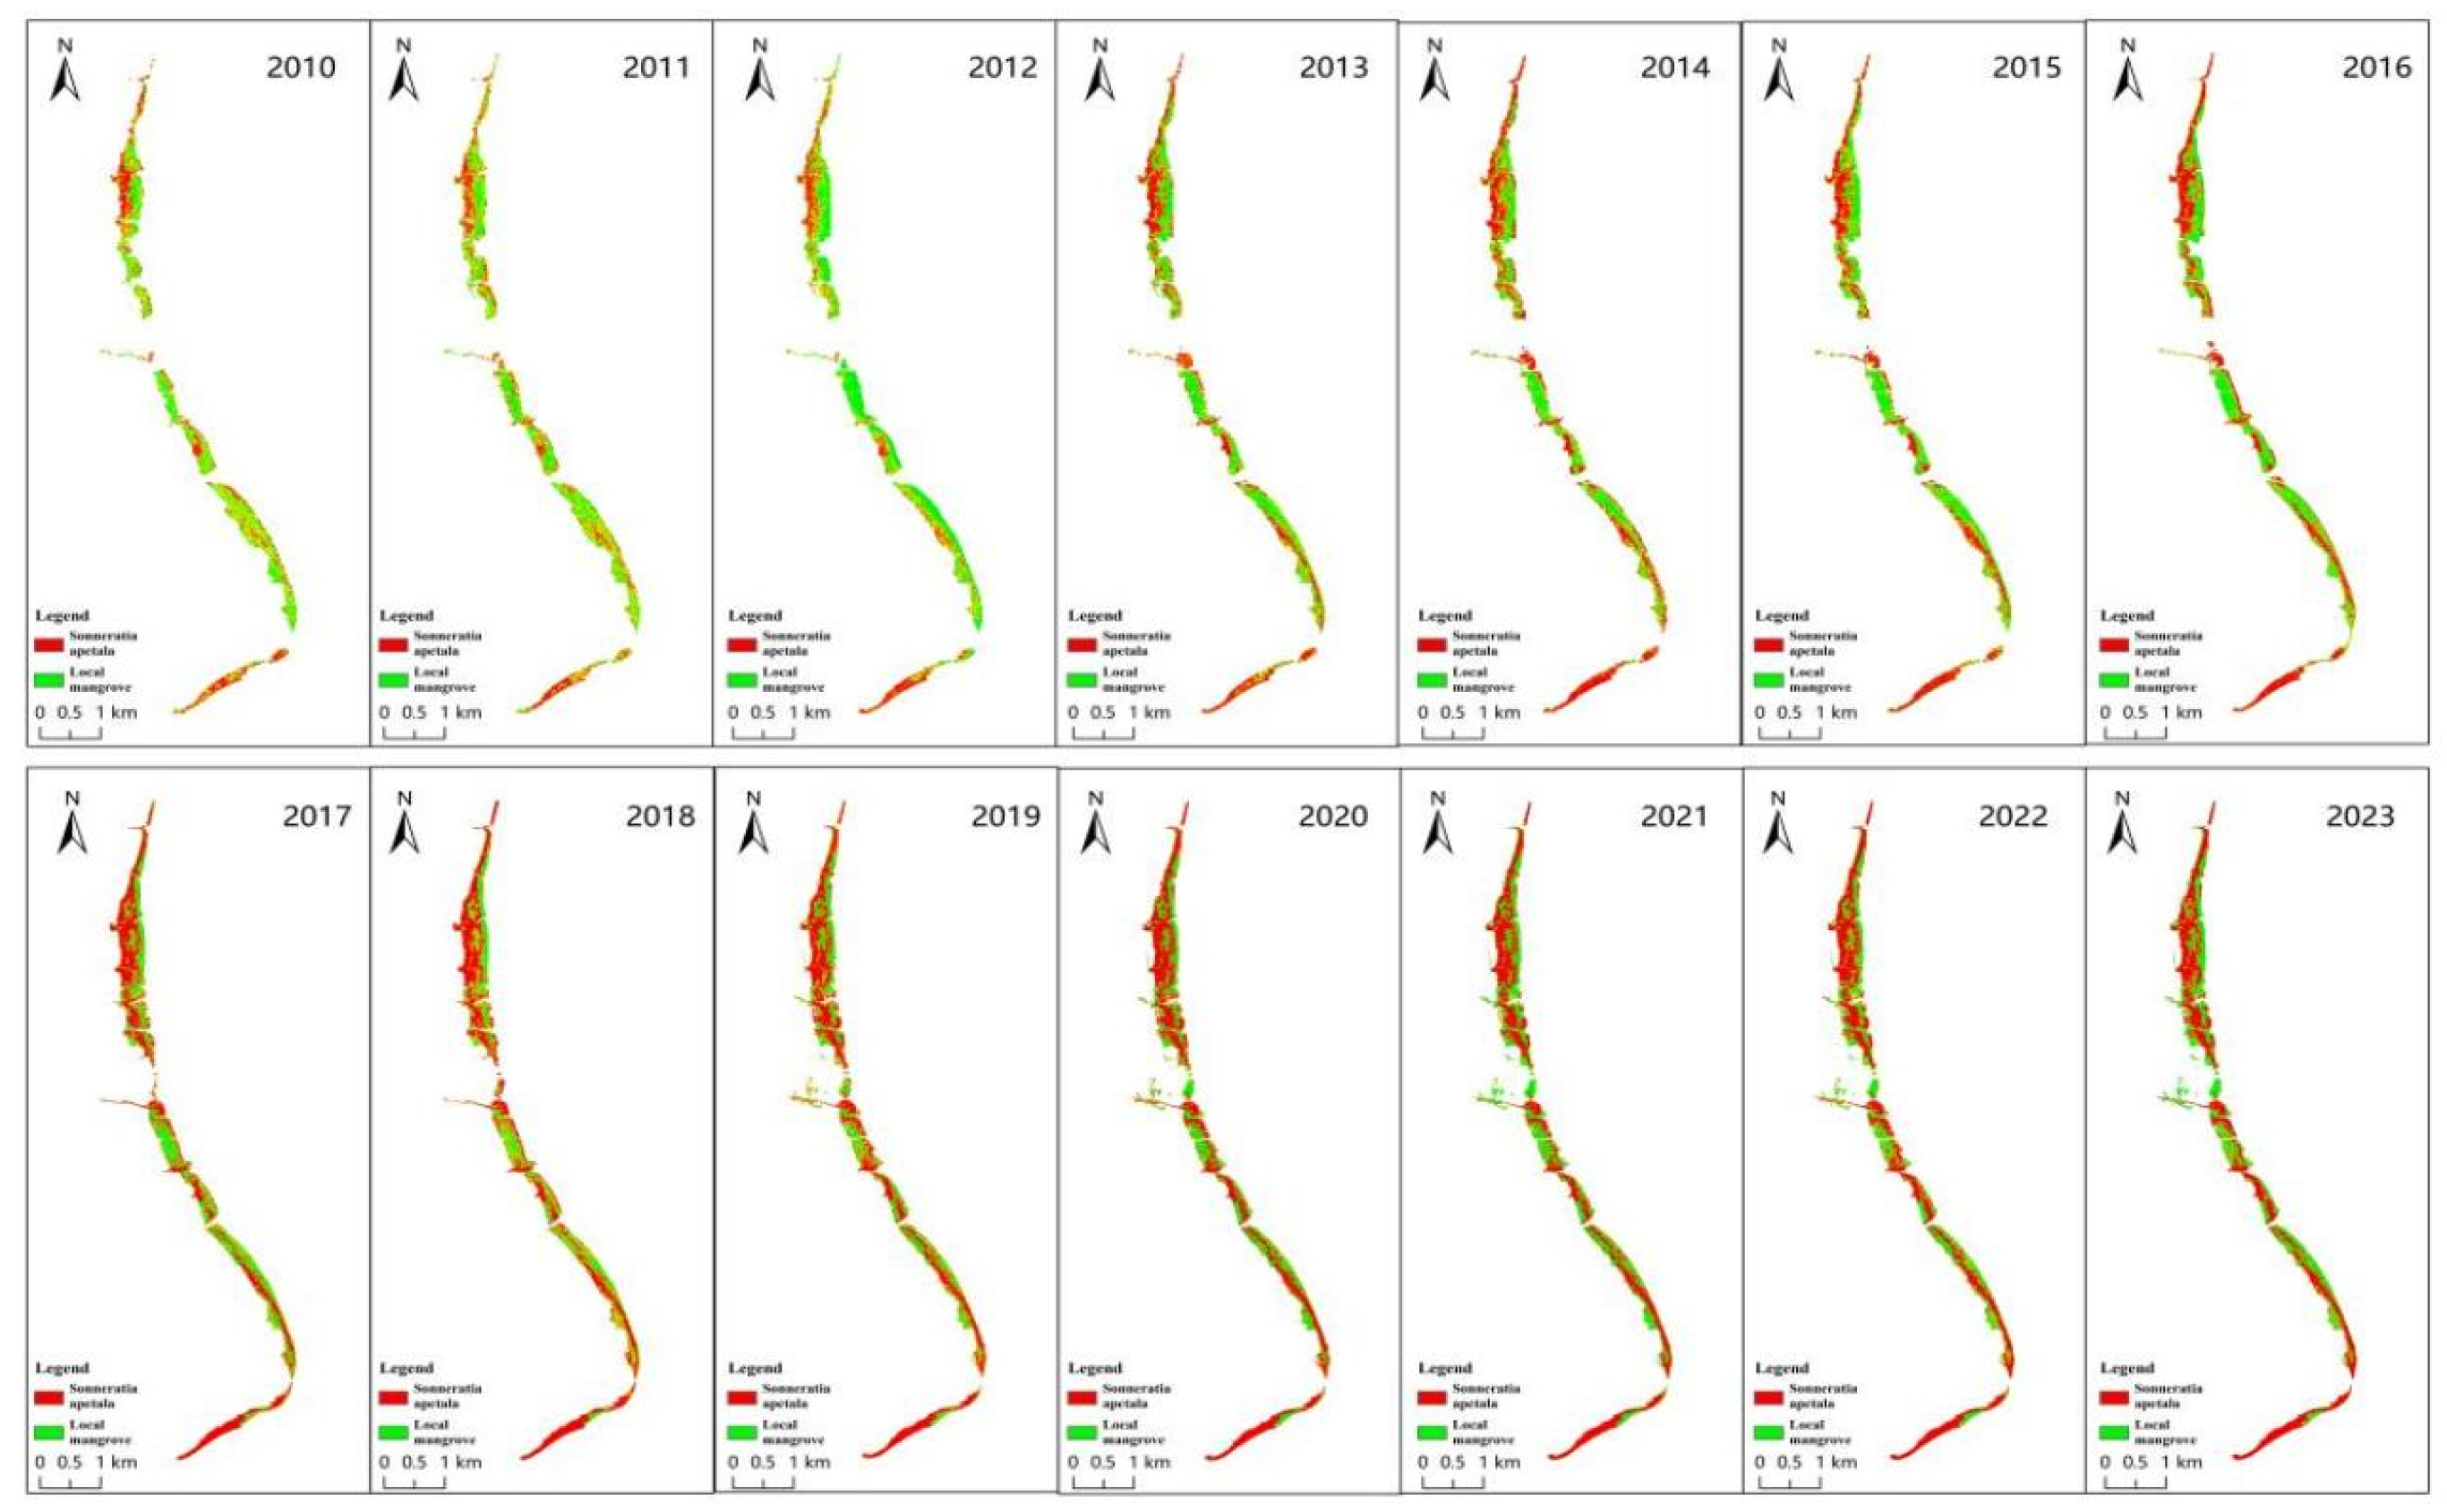
3.3. Spatial and Temporal Changes of Sonneratia apetala

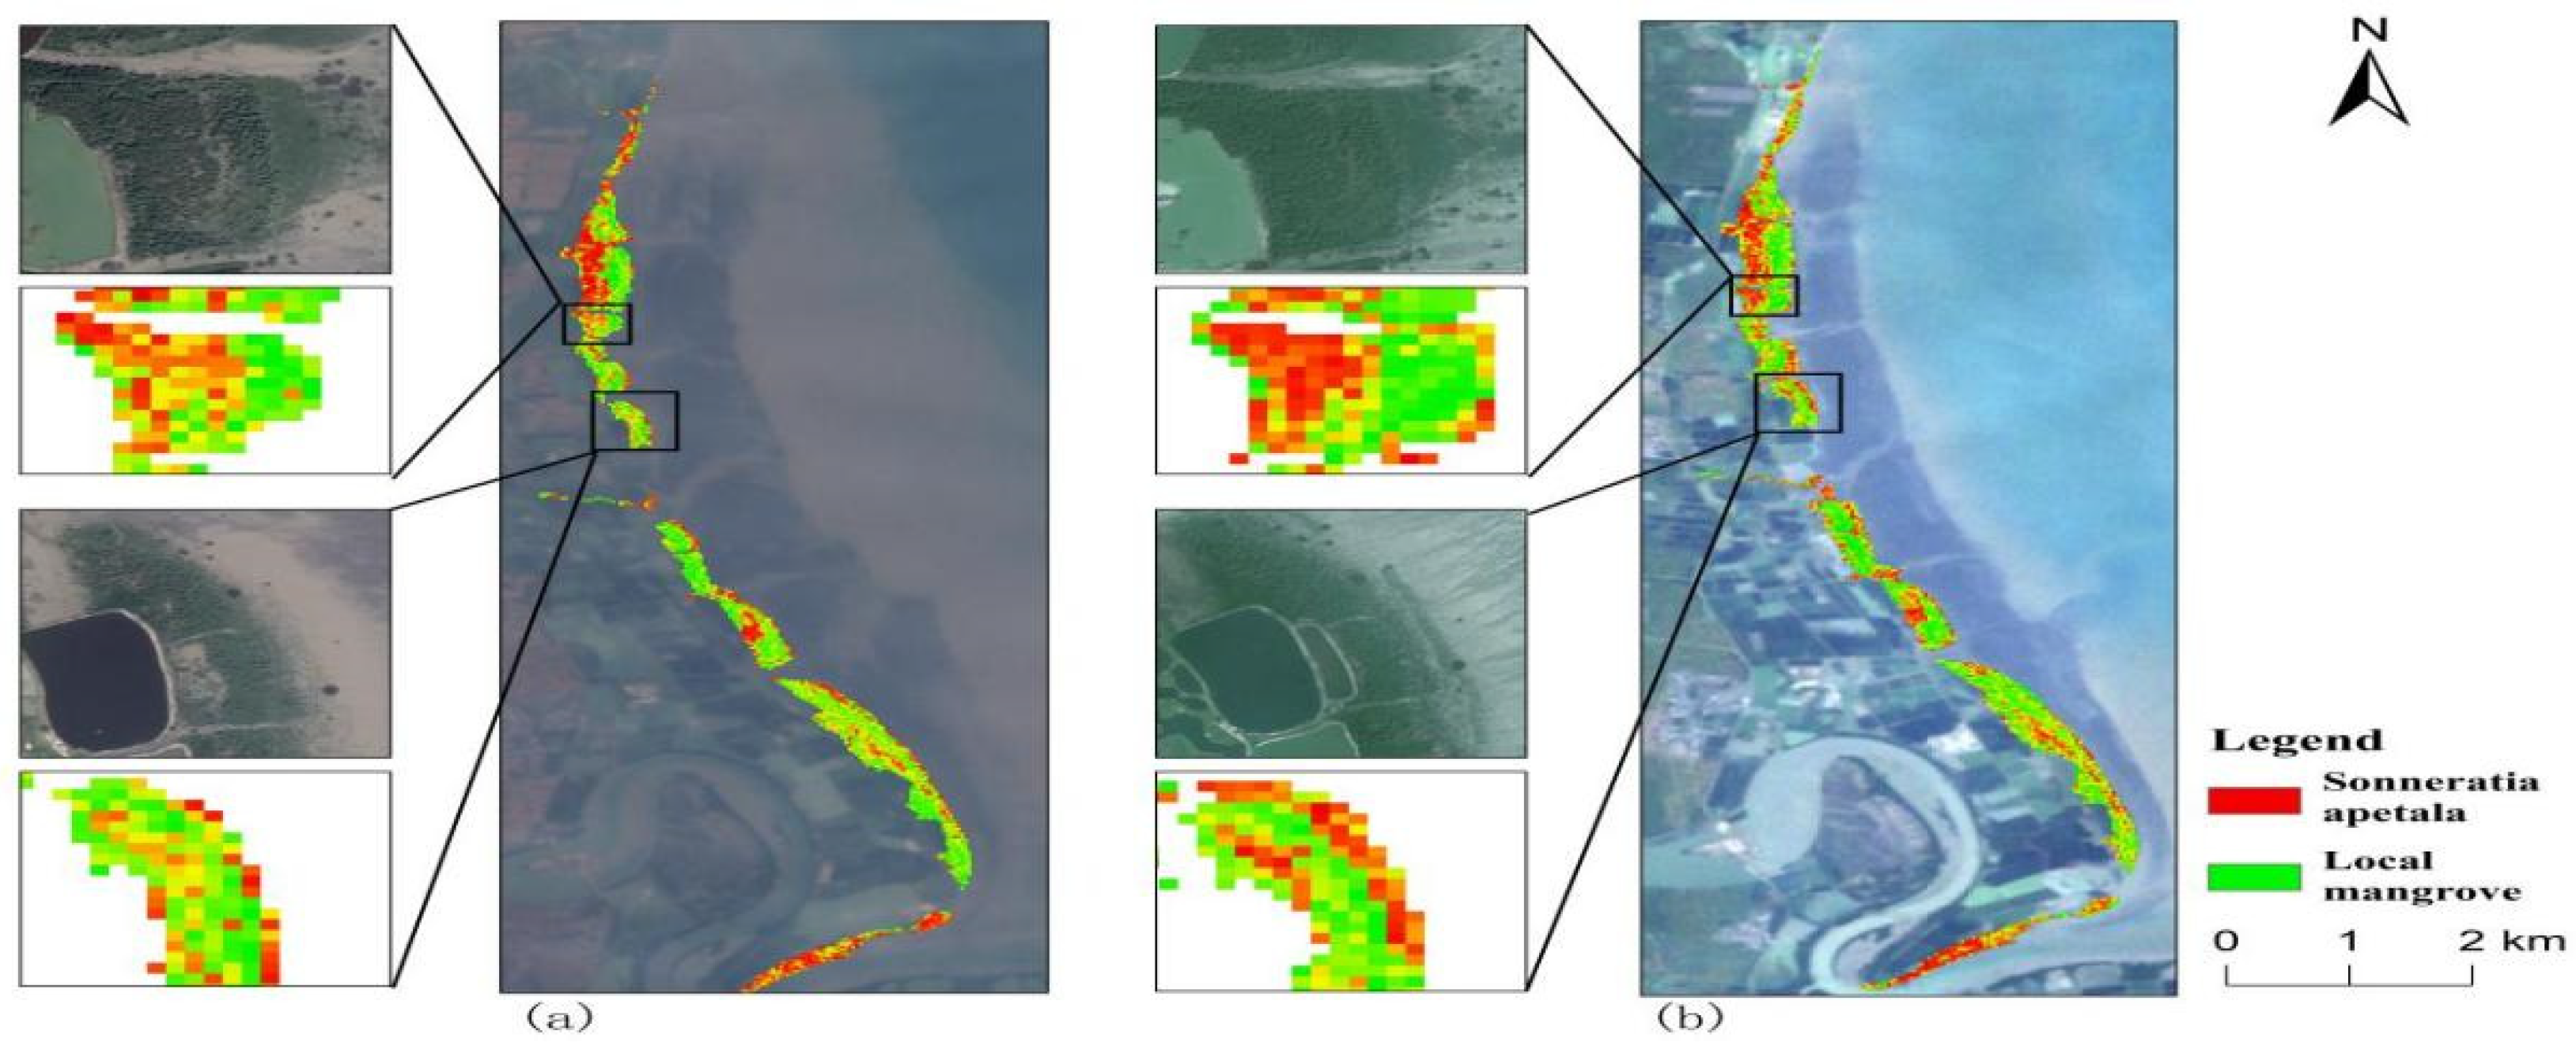
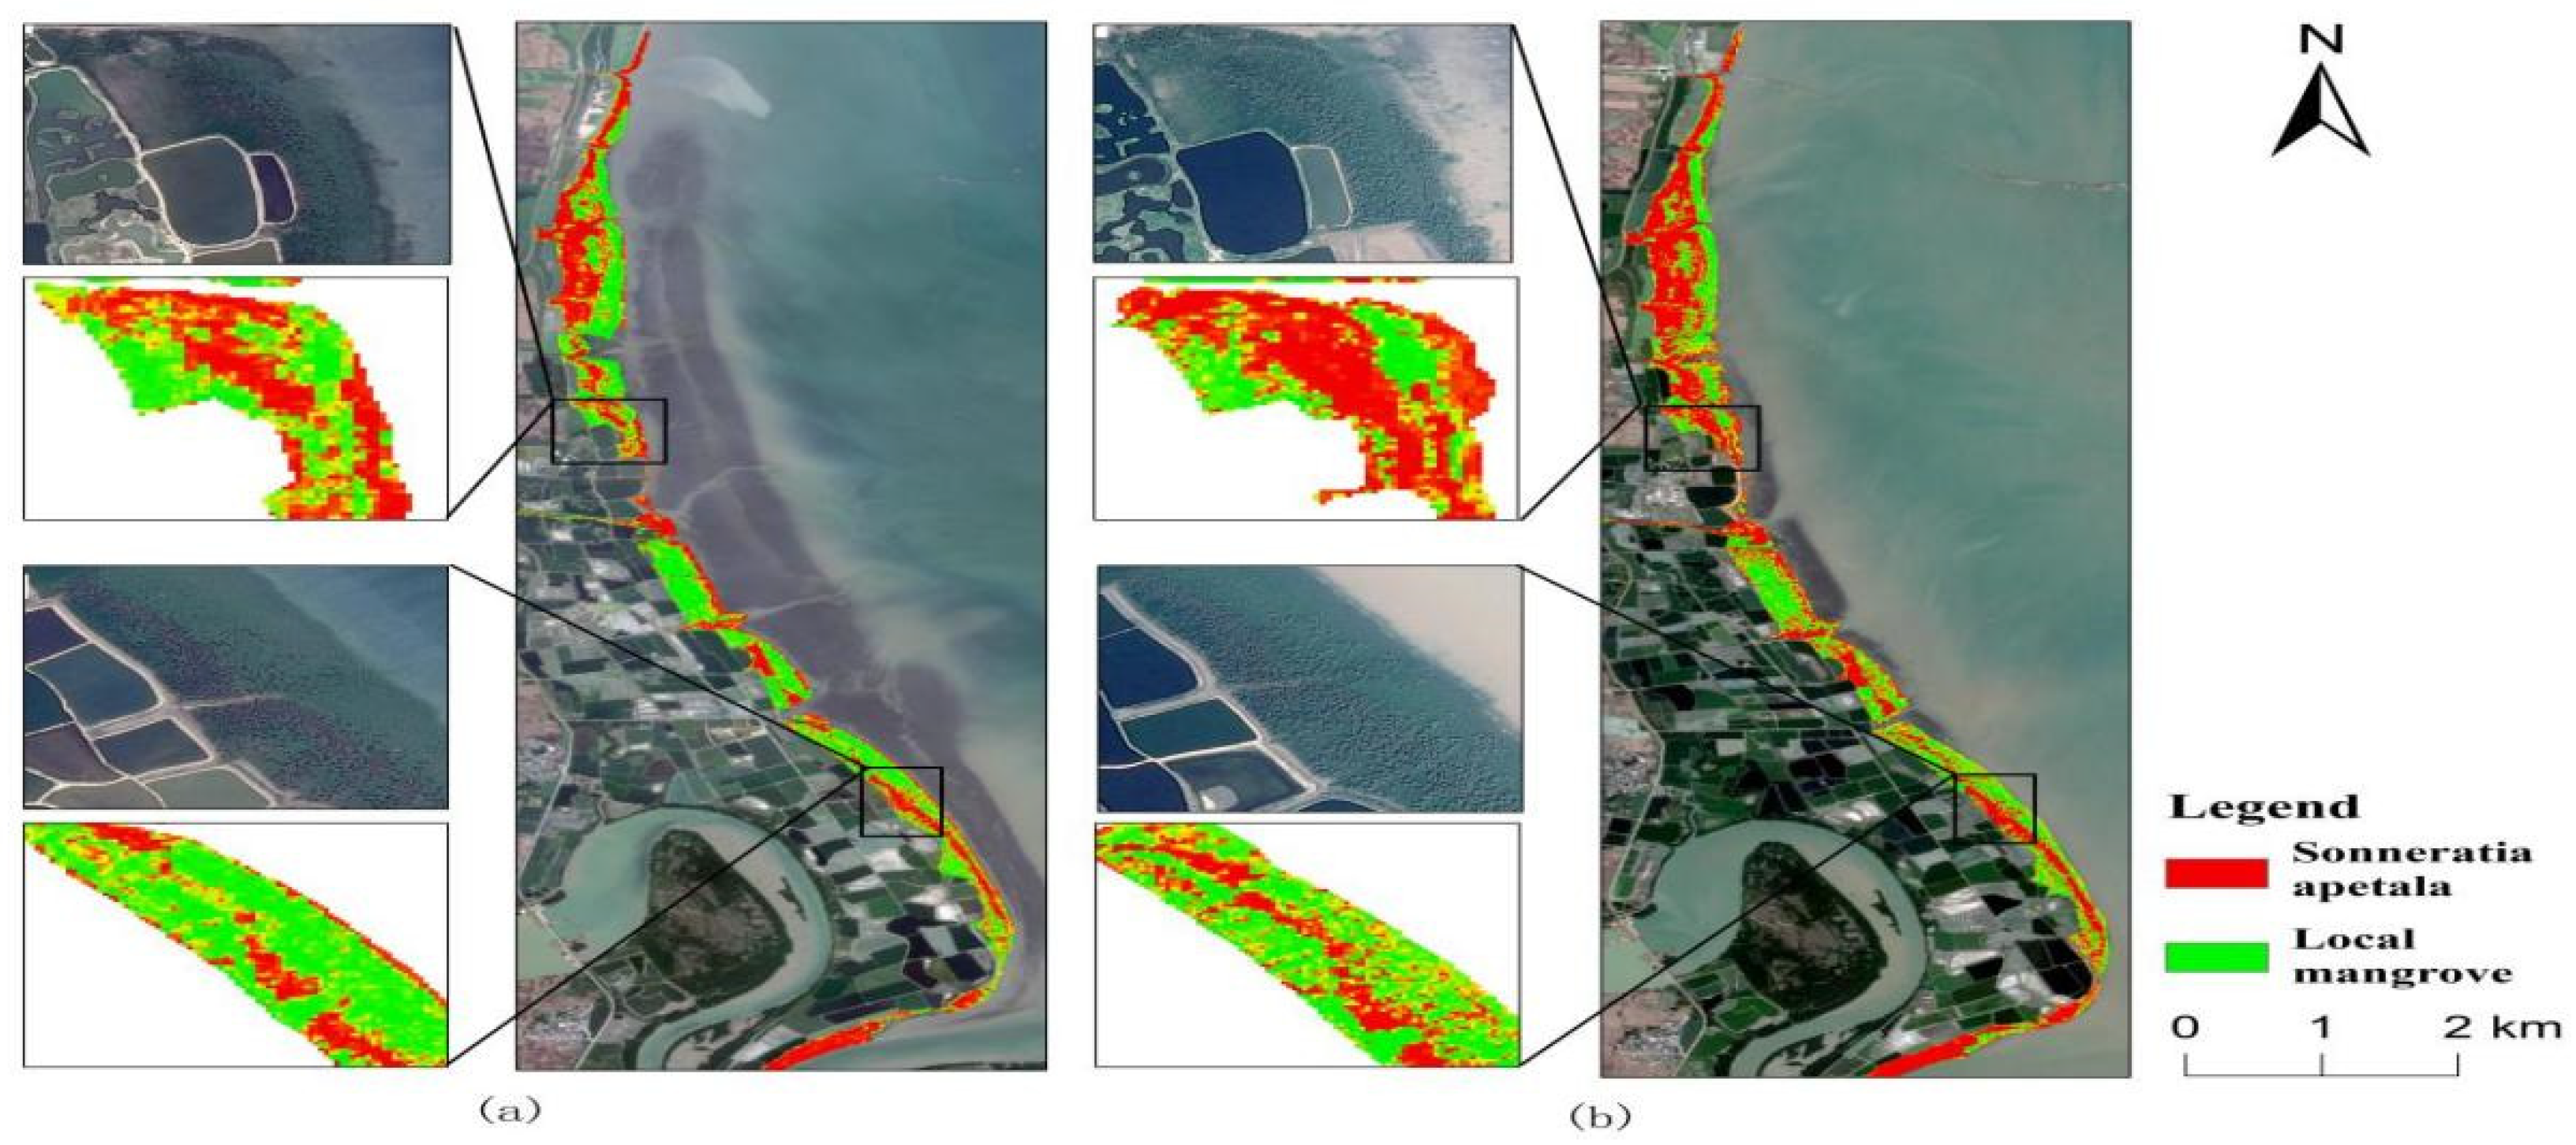
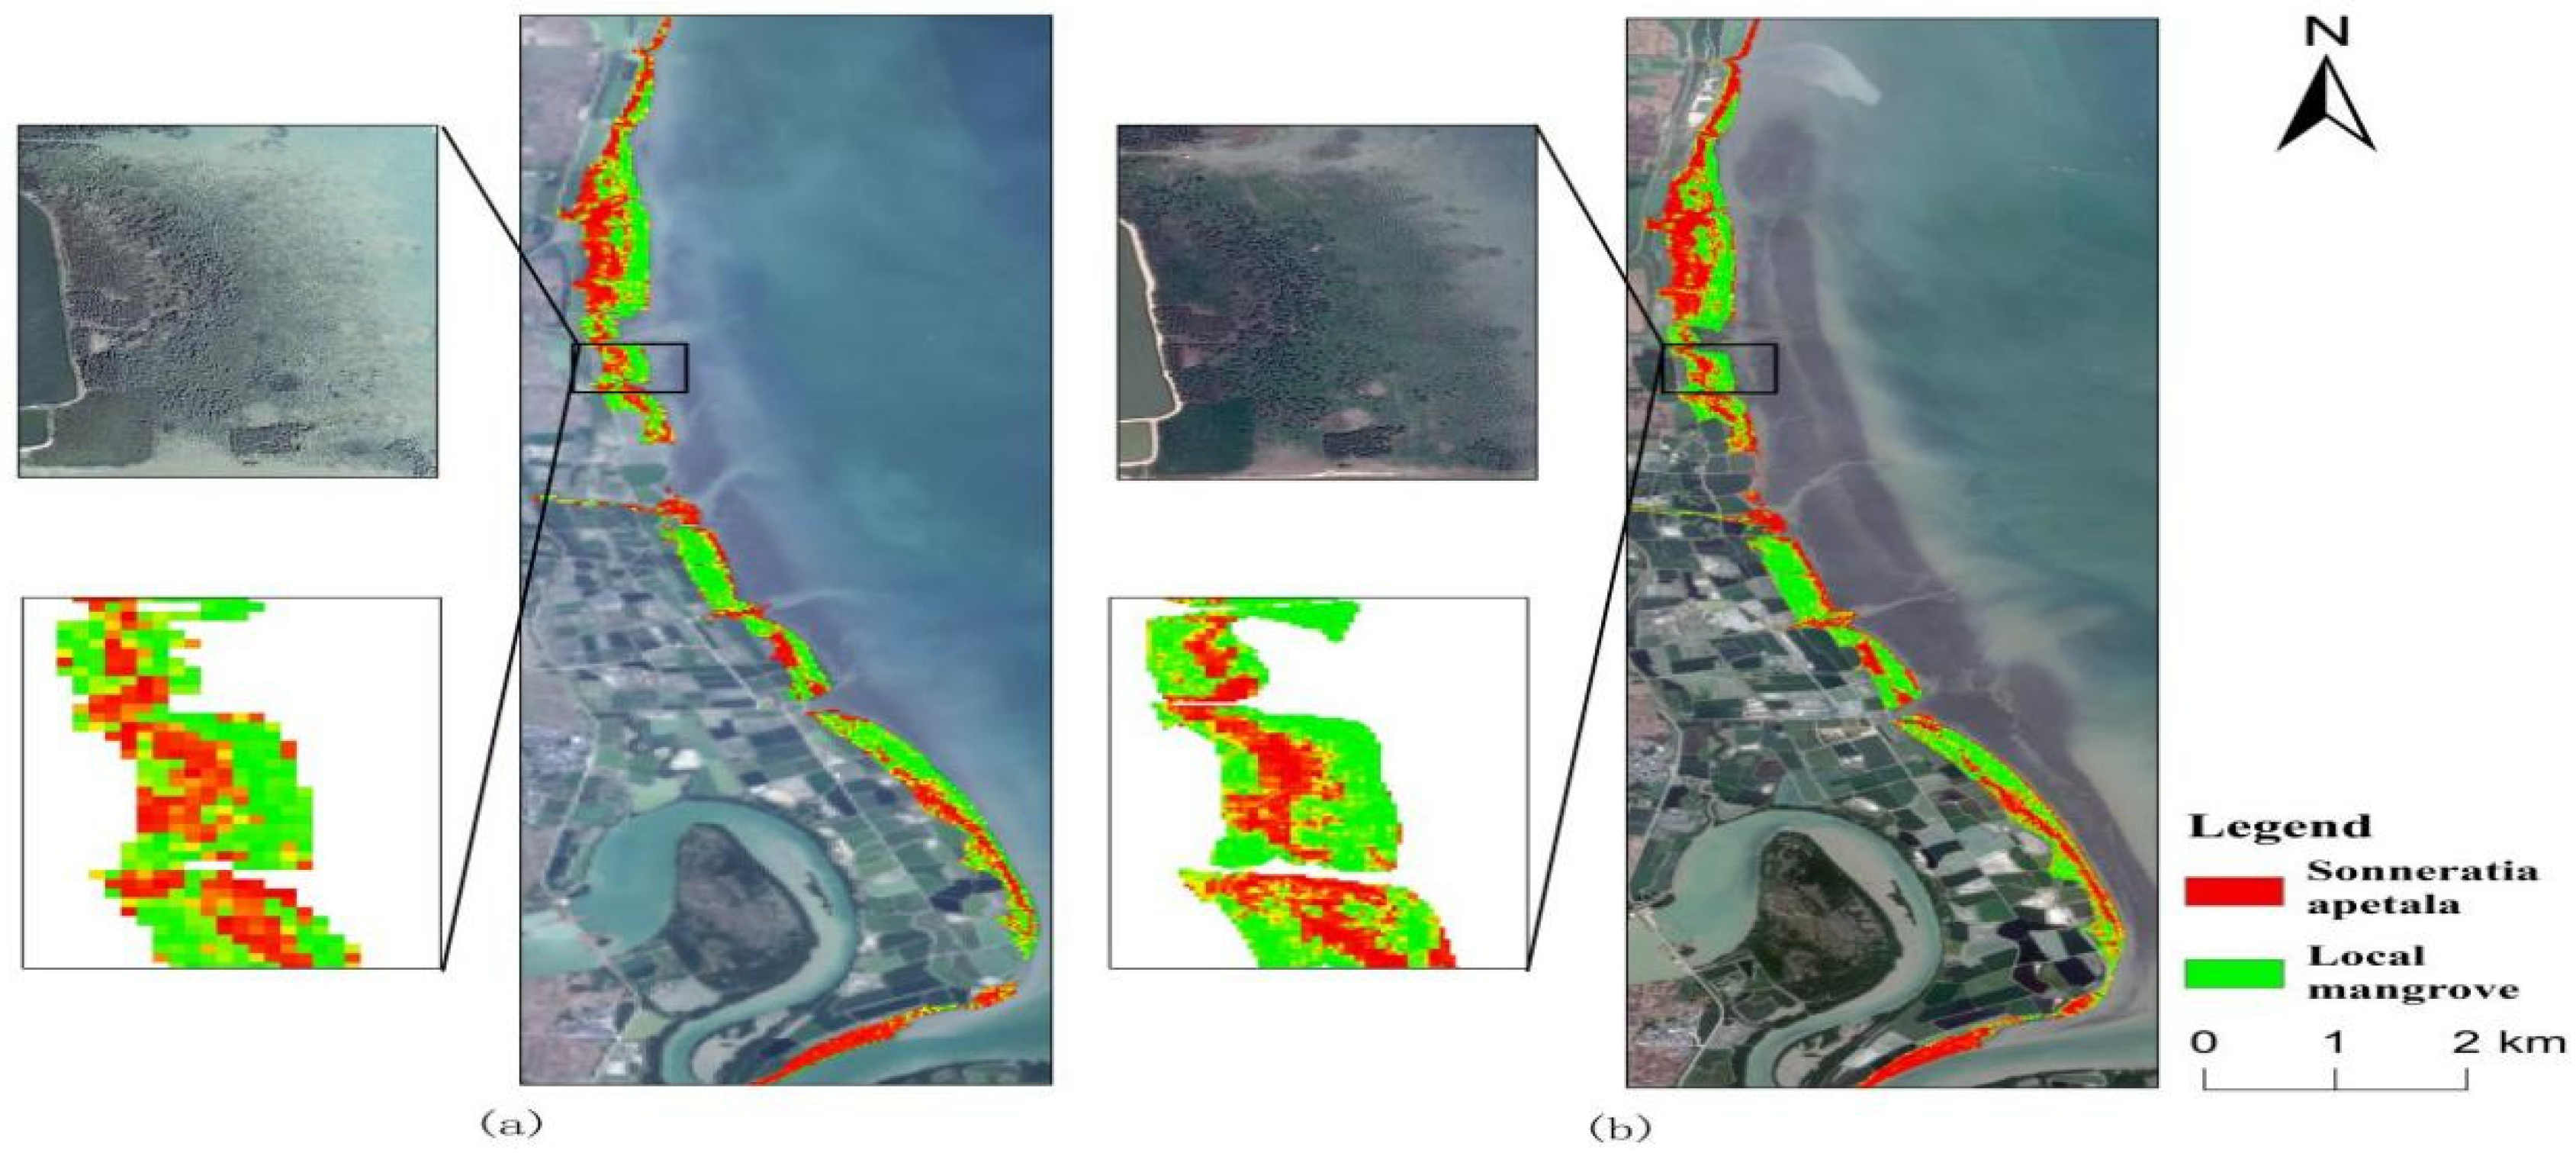
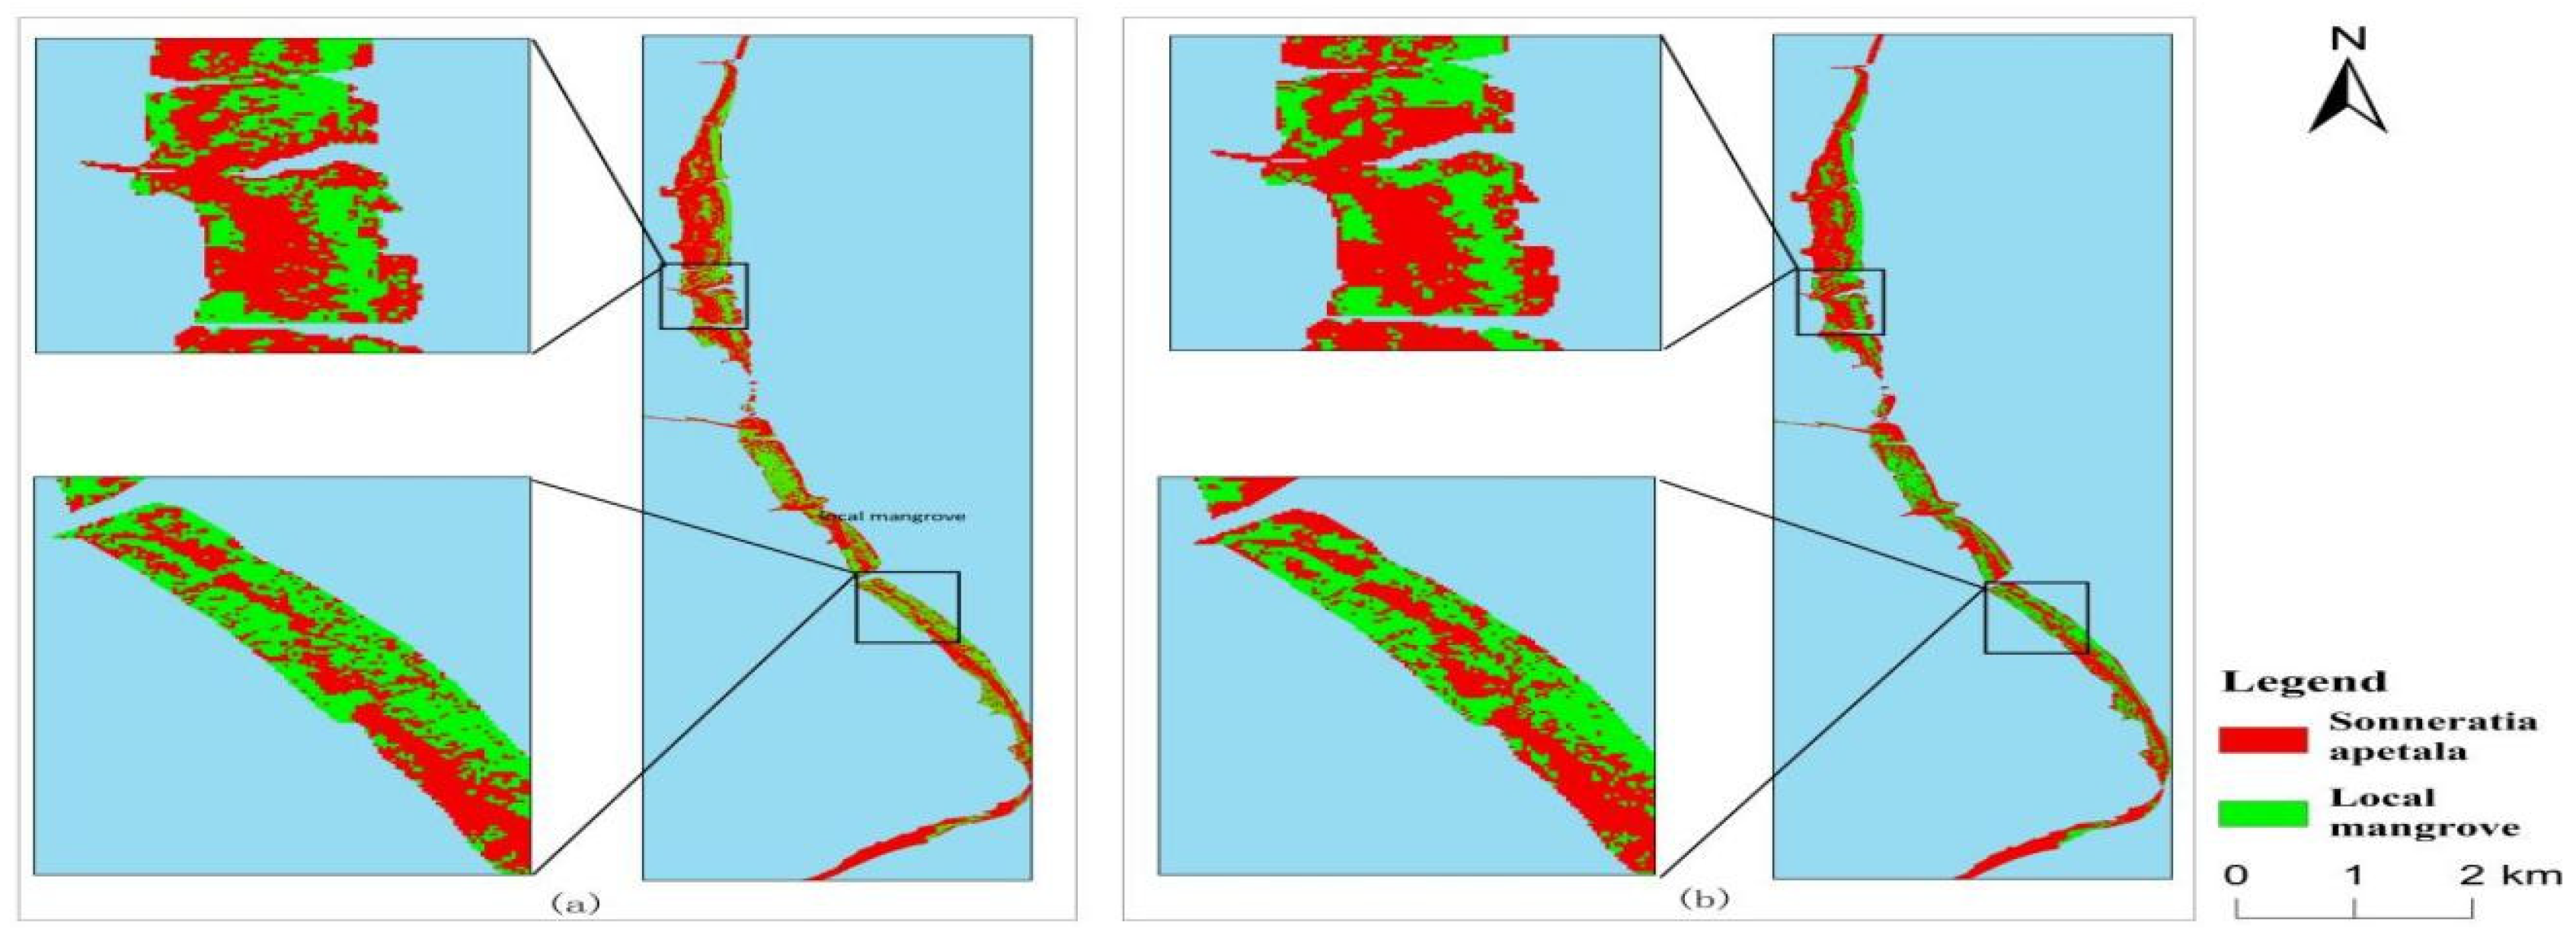
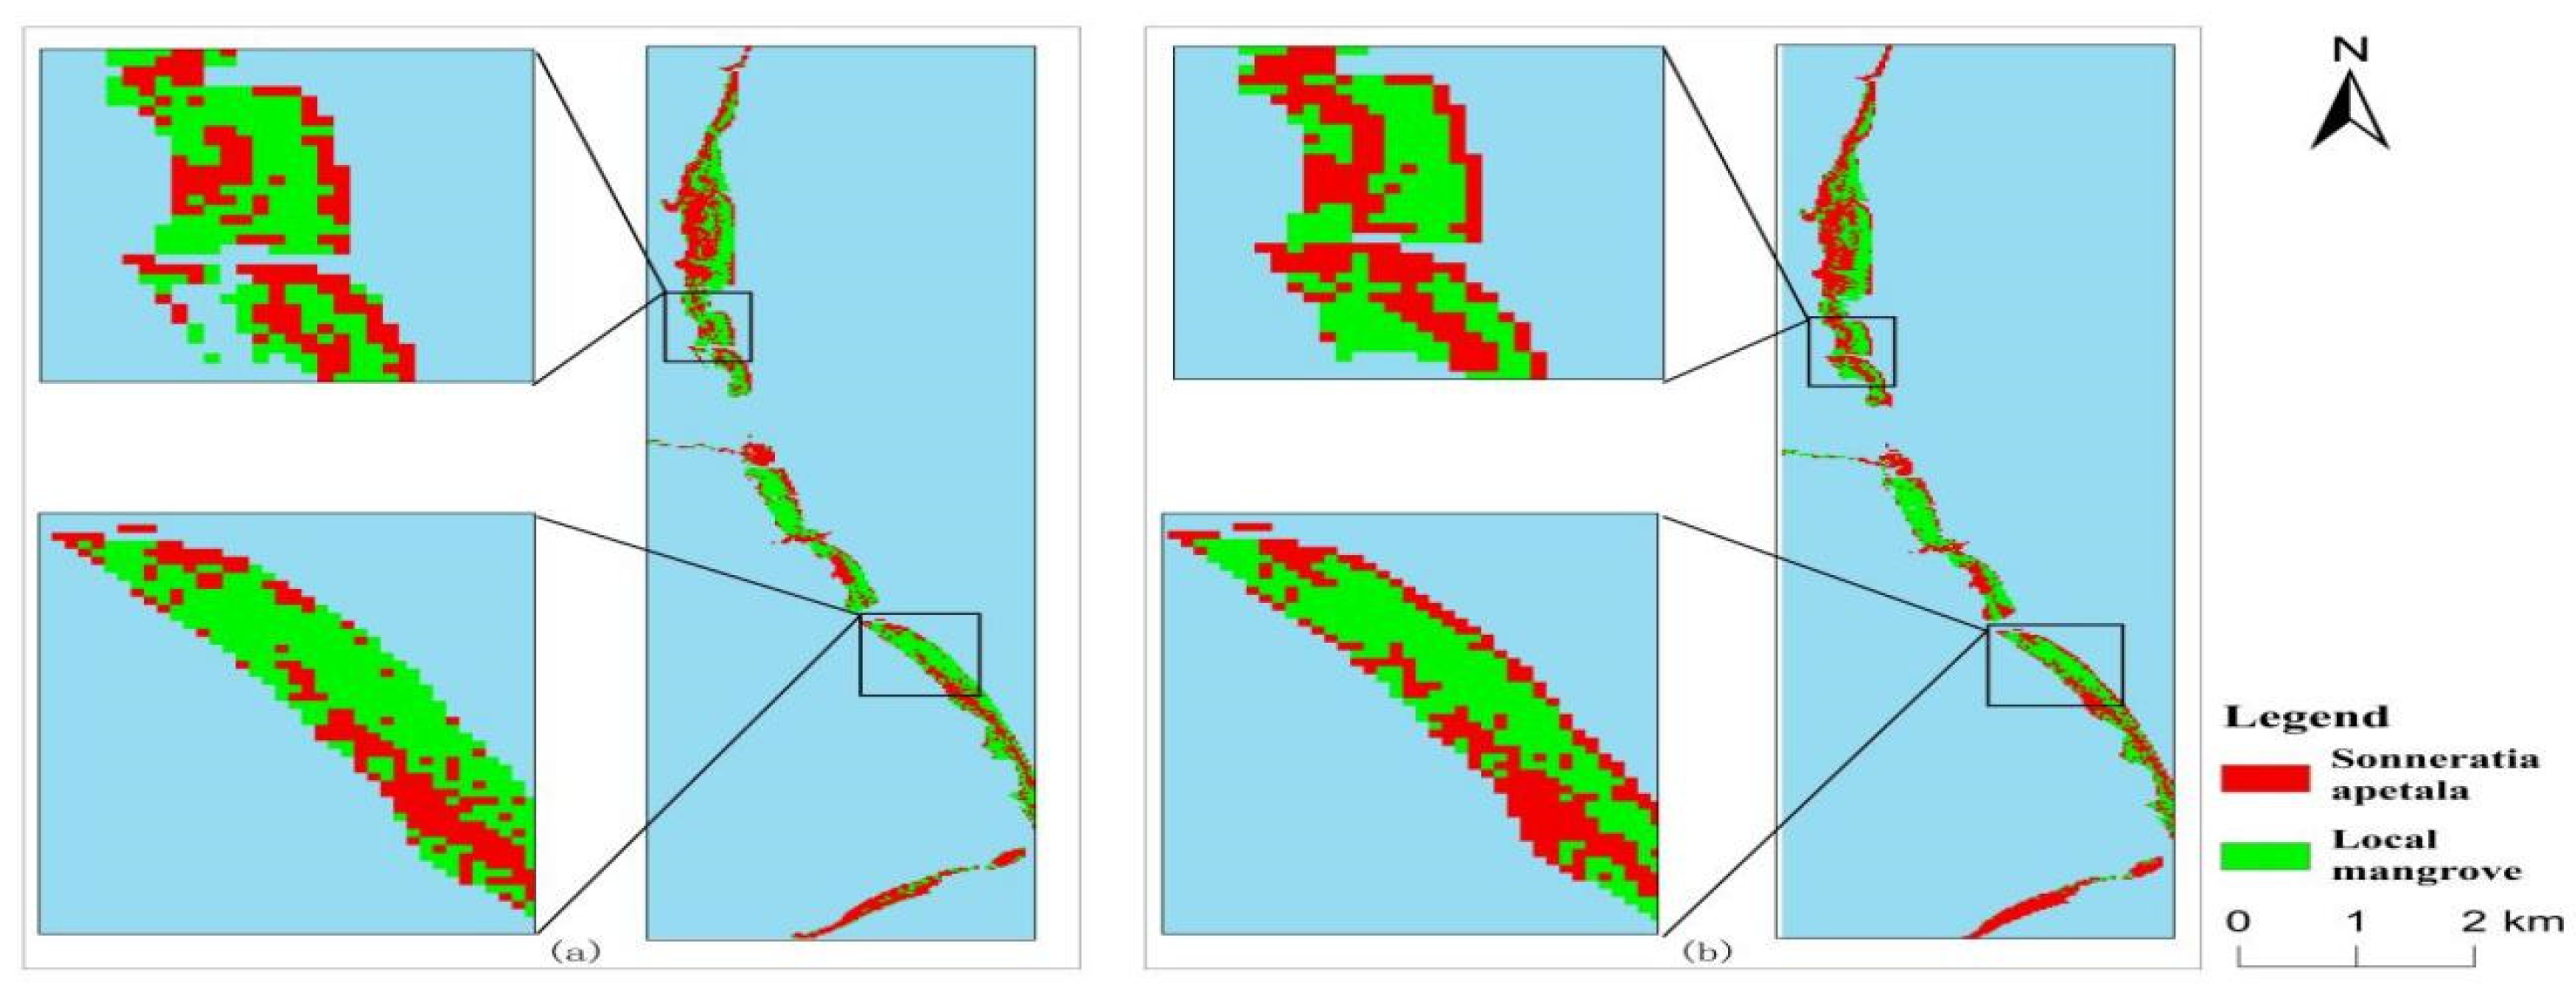
3.3.1. Spatial Variation of Mangroves from 2010 to 2023

Mangrove forests on the Leizhou Peninsula are primarily found on the leeward side of estuaries, inlets, and islands. In Leizhou Bay, many introduced Sonneratia apetala are located in the northern and southern parts of the mangrove forests, while fewer occur in the central region [43]. On the landward side, Sonneratia apetala is typically planted, whereas the areas closer to the ocean support naturally growing mangrove species such as Kandelia obovata, Avicennia marina, and Aegiceras corniculatum, which grow in strips.
Figure 8 illustrates the spatial distribution of mangrove forests on the east coast of Leizhou City. From 2010 to 2016, Sonneratia apetala was mainly concentrated in the northern and southern regions of the mangrove area, with few occurrences in the central region. Over time, Sonneratia apetala spread from the northern land areas and expanded into the central part of the southern region. By 2013, a large patch of Sonneratia apetala had formed in the center and continued to grow. A rapid increase in the area of Sonneratia apetala occurred from 2016 to 2017, particularly in the northern mangrove region, where most of the area transitioned to Sonneratia apetala, spreading further toward the center. The previously sparse Sonneratia apetala areas in the center expanded, and the southernmost region, once dominated by local mangroves, was transformed into Sonneratia apetala territory, further extending toward the center. This period saw nearly half of the total growth occurring within just one year. From 2017 to 2023, Sonneratia apetala continued to expand, but the growth rate slowed significantly compared to the previous period, with the most rapid growth occurring in the central region, rather than the northern or southern areas. This finding suggests that the growth and spread of Sonneratia apetala have continued over the past 20 years. The species now covers the entire study area, highlighting the relatively rapid succession of mangrove species in this region [44]. These results demonstrate the success of planting Sonneratia apetala in mangrove forest restoration efforts.
In 2010, mangrove forests along the east coast of the Leizhou Peninsula were primarily composed of naturally occurring local mangrove species and were distributed in strips. In the northern part of the study area, the mangrove vegetation was roughly split between local species and Sonneratia apetala, while in the central and southern regions, local mangrove species dominated. However, with the gradual expansion of Sonneratia apetala, the distribution of native mangrove species has been steadily shrinking. This decline was especially pronounced between 2017 and 2023, when native species almost completely disappeared from the northern part of the study area, and large populations of Sonneratia apetala increasingly replaced native mangroves in the central and southern parts.

3.3.2. Temporal Changes of Sonneratia apetala from 2010 to 2023

The area of Sonneratia apetala increased from 115.15 hm2 in 2010 to 254.81 hm2 in 2023 (Figure 5). Invasive species typically exhibit strong tolerance, high competitive ability, and rapid growth rates, which often allow them to thrive in resource-limited habitats, outcompeting native species [45]. Sonneratia apetala often exhibit strong tolerance to environmental stress, high competitive ability, and rapid growth rates—traits that contribute to their invasive nature. Additionally, S. apetala has a strong competitive edge, growing densely and quickly, which shades out native species and limits their access to sunlight. Sonneratia apetala is particularly well suited to the climatic conditions of Leizhou City, China. The large-scale planting of Sonneratia apetala on exposed beaches in 2010 resulted in high survival rates and vigorous growth, enabling the species to quickly colonize these bare areas. In contrast, most native mangrove species grow more slowly and face challenges in establishing themselves, particularly on bare beaches and harsh tidal flats [46].
The growth rate of Sonneratia apetala increased from 167.65 hm2 in 2016 to 219.06 hm2 in 2017, which is nearly triple. The fastest growth rate occurred from 2016 to 2017 (Figure 9). Sonneratia apetala grows rapidly and can naturally regenerate in Spartina alterniflora stands and low mangrove forests [47]. It invades gaps in local mangrove ecosystems, where it thrives quickly, often overshadowing and replacing surrounding low-growing local mangrove species, such as Kandelia obovata and Aegiceras corniculatum.
Over the next five years, the area of Sonneratia apetala showed a slow but steady increase, reaching 254.81 hm2, with a corresponding rise in its proportion. However, Sonneratia apetala experienced two fluctuations in 2015 and 2023, marked by slight decreases in both area and proportion. In certain areas, native species have already developed well-established root systems and ecological niches, which create a competitive environment that hinders the successful establishment of Sonneratia apetala. The mature root systems of these native species, along with their adapted ecological roles, make it more challenging for S. apetala to thrive and expand in these regions. In these years, the growth of Sonneratia apetala was suppressed by local mangrove species [48], leading to a slowdown in its expansion and a slight reduction in its area.
In contrast, the area of local mangroves decreased. It was 163.02 hm2 in 2010 and decreased to 125.06 hm2 in 2023. This indicates that the growth of native species such as Avicennia marina, Excoecaria agallocha, and Barringtonia asiatica under Sonneratia apetala has been significantly suppressed [49]. The slight upward trends observed in 2011 and 2016 were mainly due to the role of Sonneratia apetala as a pioneer species in mangrove restoration. The planting of Sonneratia apetala improved the soil structure and fertility of the forested land. It was planted in low-tide zones, bare beaches, or mudflats where local mangroves did not grow well [50], thereby promoting the growth and expansion of local mangrove species toward the leading edge of the mudflats (Figure 10). Sonneratia apetala was initially introduced and planted in areas where local mangrove species struggled to thrive due to environmental constraints such as extreme salinity, unstable sediments, or fluctuating tides(Figure 11). These regions, often characterized by tidal mudflats or degraded mangrove habitats, offered favorable conditions for the establishment of S. apetala, which is highly tolerant of diverse environmental factors. However, over time, S. apetala has spread beyond its original planting sites into areas already occupied by native mangrove species.
In summary, Sonneratia apetala is increasingly dominating the local environment, exhibiting strong dispersal and competitive abilities [51]. Its area continues to expand, and its proportion of the total mangrove coverage is also rising. Once planted, Sonneratia apetala grows rapidly, forming dense canopies that threaten the diversity and balance of local mangrove communities. The area of native mangrove species has been steadily decreasing, with many being replaced by Sonneratia apetala. Some native species are now only able to expand toward the sea. Sonneratia apetala has already shown signs of becoming invasive, and further measures are needed to manage and protect this critical ecosystem

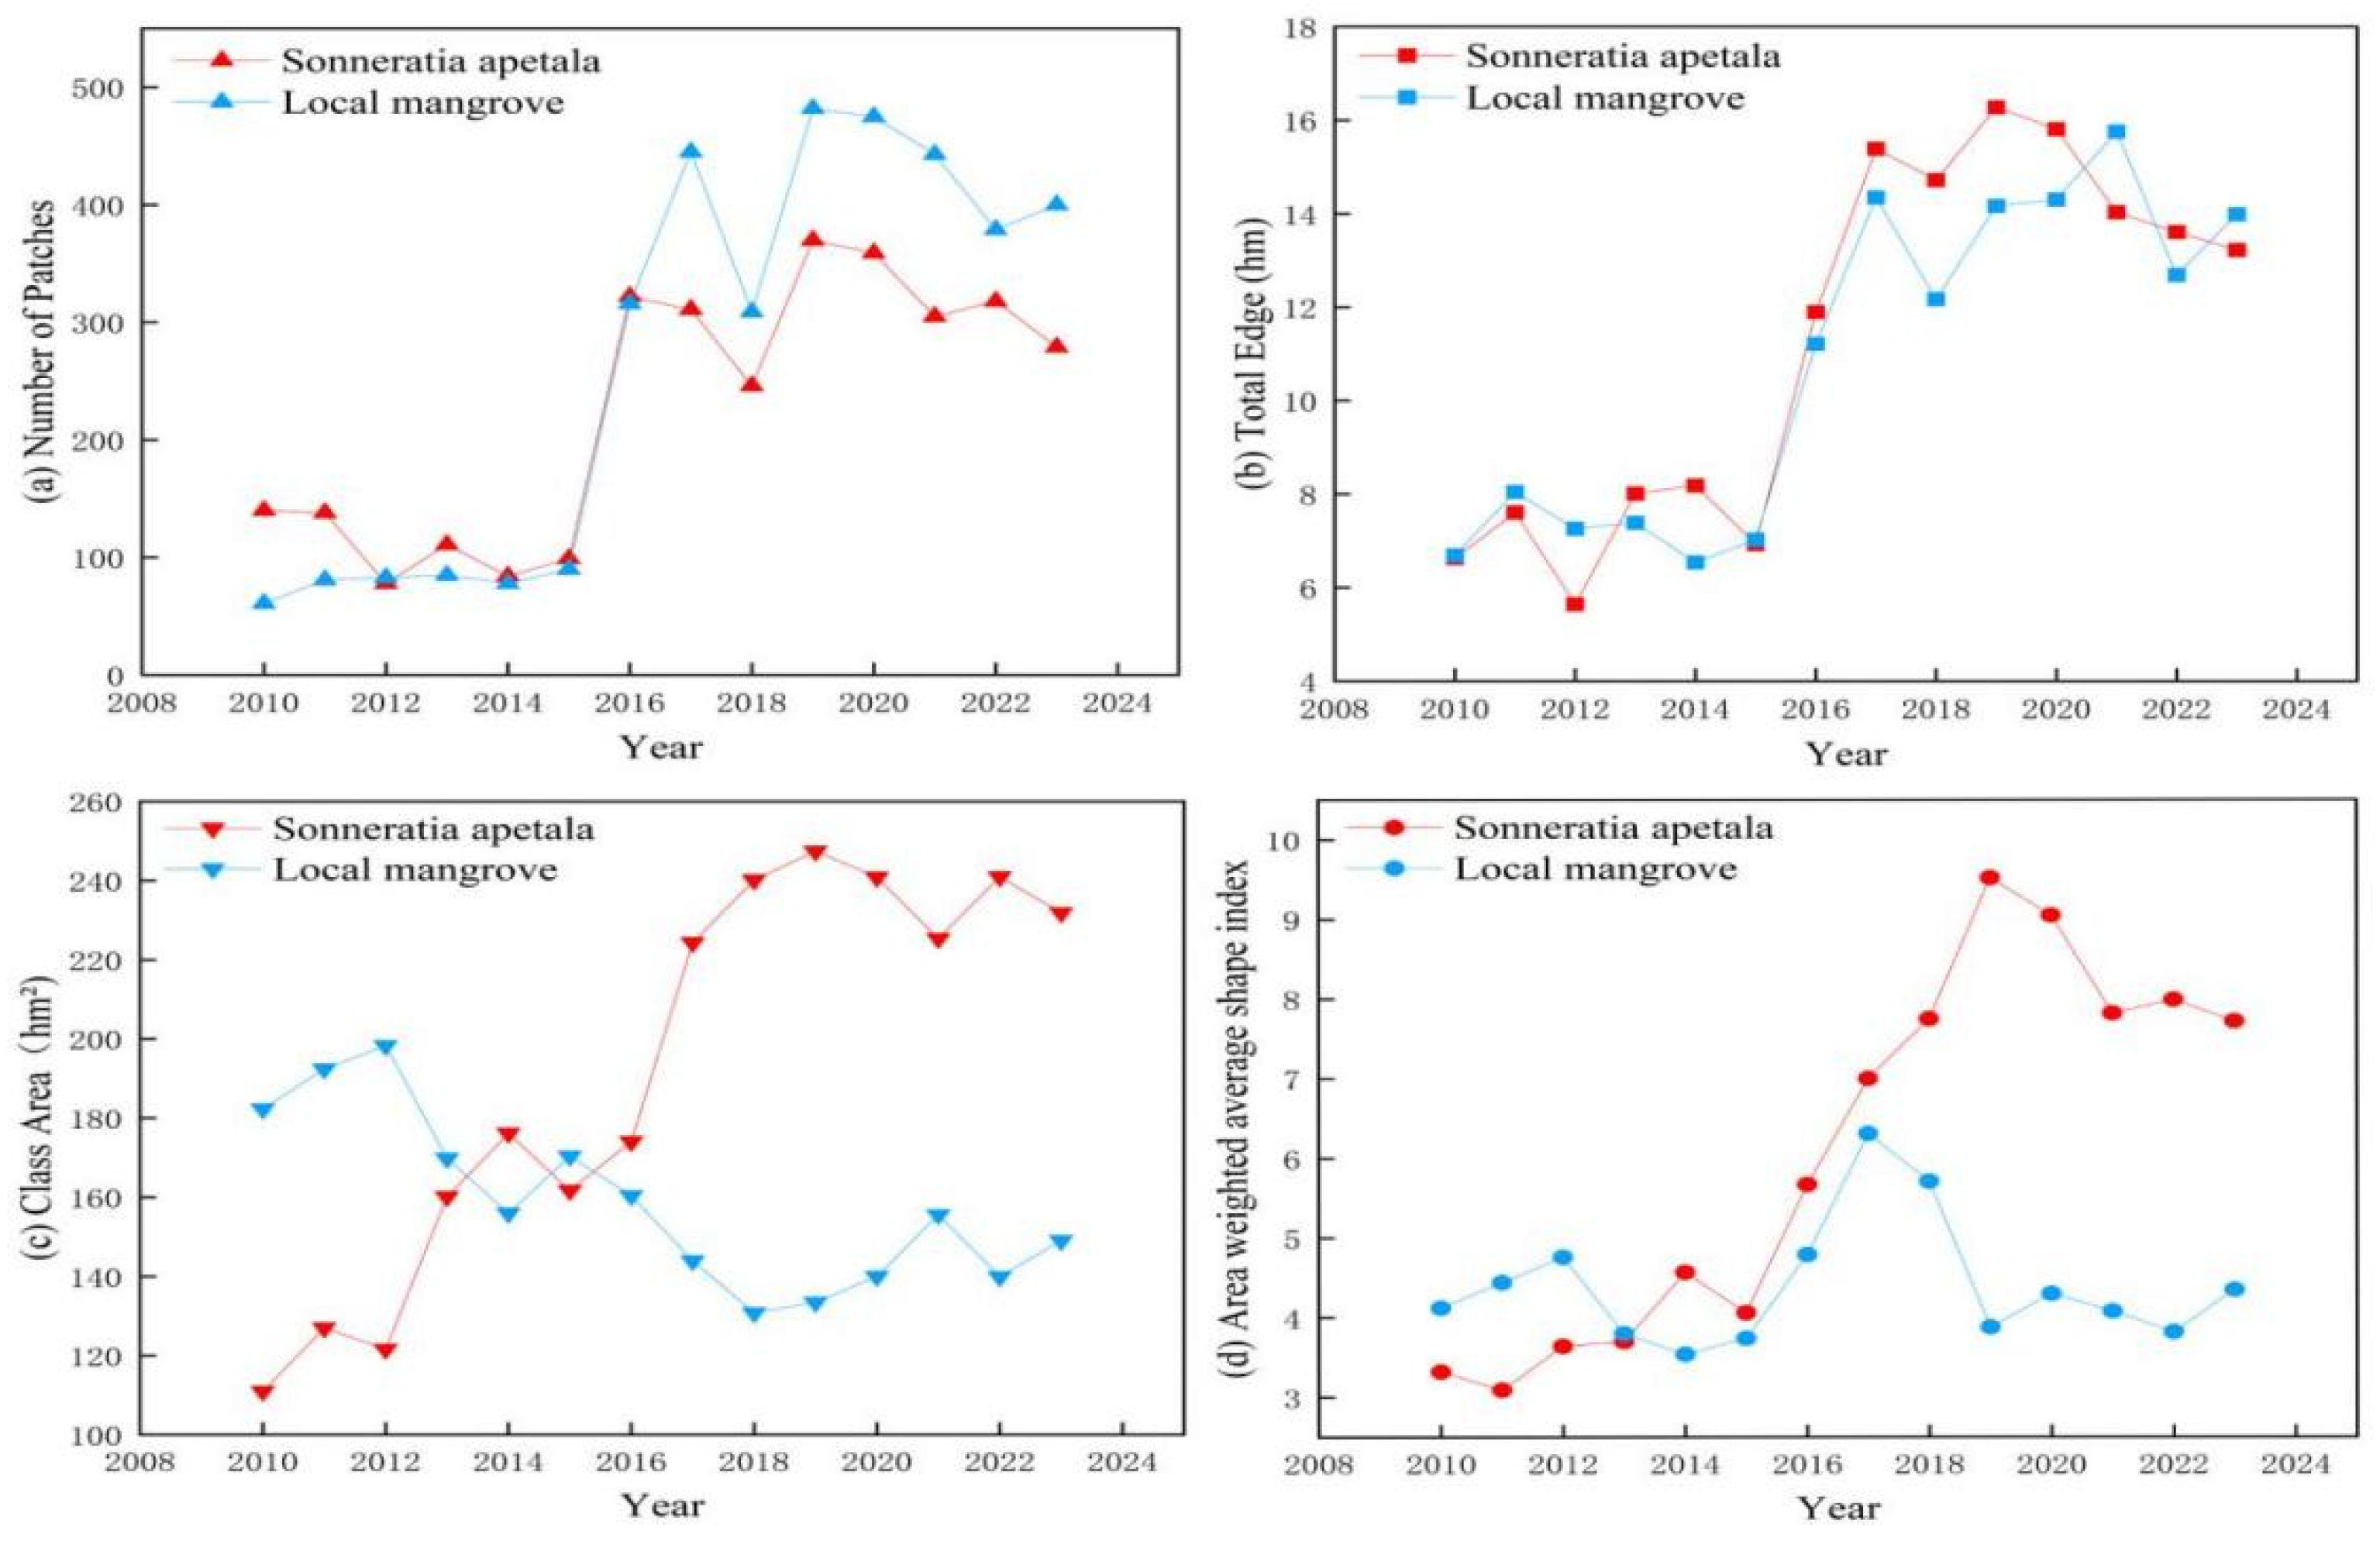
3.4. Changes in Landscape Pattern

The landscape pattern of mangroves, such as Sonneratia apetala, exhibited significant changes during the past decade. The landscape indices from 2010 to 2023 are listed in Table 4. The number of patches and the total edges of Sonneratia apetala and the local mangroves showed a significant upward trend. The area of Sonneratia apetala patches increased, whereas the area of local mangrove patches decreased. The area-weighted mean shape index of the Sonneratia apetala patches increased from 3.4 to 7.81, whereas that of the local mangrove patches did not change much, increasing from 4.13 to 4.41.
Figure 12 shows the landscape indices from 2010 to 2023. The natural dispersal of Sonneratia apetala increased the number of patches from 139 to 324 from 2010 to 2023, showing a rapid increase. In 2018, the scattered patches of Sonneratia apetala coalesced to form a strip-like distribution (Figure 13). Effective habitat protection facilitated the natural expansion of mangroves, which in turn enhanced patch stability and reduced their number [52]. However, by 2021, some planted Sonneratia apetala trees died, and patches near the sea disappeared. During the same period, the fragmentation of local mangroves increased, with the number of patches rising from 61 to 390. The invasion of Sonneratia apetala contributed to greater fragmentation, leading to a rapid increase in patch numbers and diminishing connectivity between local mangrove ecosystems [53].
The total edge length of Sonneratia apetala increased from 6.636 hm in 2010 to 13.186 hm in 2023, showing a net increase of 6.55 hm over the 14-year period. This nearly tripling in edge length indicates the rapid growth of Sonneratia apetala, with both its area and perimeter expanding significantly. Similarly, due to increased fragmentation and changes in patch numbers, the total edge length of local mangroves also increased, from 6.696 hm in 2010 to 14.068 hm in 2023, reflecting substantial fragmentation.
The area of Sonneratia apetala patches increased from 111.15 hm2 in 2010 to 228.38 hm2 in 2023, marking an increase of 117.23 hm2. The sharp increase in patch area in 2014 was primarily due to the rapid growth of Sonneratia apetala near the coastline (Figure 14). In contrast, the number of patches of local species increased, but their area decreased from 182.07 hm2 in 2010 to 152.49 hm2 in 2023. The patch area of local mangroves exhibited unstable fluctuations.
The area-weighted mean shape index of Sonneratia apetala increased significantly from 3.4 in 2010 to 7.81 in 2023, indicating notable changes in patch shape. In contrast, the area-weighted mean shape index of local mangroves remained relatively stable, increasing slightly from 4.13 in 2010 to 4.41 by 2023. Between 2010 and 2015, the shape index of Sonneratia apetala showed minimal change, suggesting that the patches maintained relatively simple shapes. However, as Sonneratia apetala rapidly spread and grew, patch shapes became more complex, leading to a significant increase in the shape index after 2015. From 2019 to 2023, the shape index of Sonneratia apetala displayed a decreasing trend, indicating that the patches became more concentrated and less fragmented.
During the natural expansion of mangroves, Sonneratia apetala undergoes clustering, with the boundaries of ecologically stable patches becoming clearer and forming more stable communities. In recent years, rising salinity in certain areas has posed a particular challenge for local mangroves, leading to stunted growth and mortality. Alterations in tidal patterns and water levels have further reduced the availability of suitable habitats for native mangroves. These changes have weakened the competitive ability of native species, making it increasingly difficult for them to compete with the invasive Sonneratia apetala, which is better equipped to adapt to fluctuating environmental conditions. Local mangroves in poor growth conditions, unable to adapt to the changing environment, gradually deteriorate, leading to increased fragmentation of their patches [54]. Early natural mangrove forests, free from human interference or natural disasters, remained in a stable growth phase, with relatively regular patch shapes. During the initial stages of Sonneratia apetala planting, the patches were simple and uniform [55]. Over time, however, the shape of the patches evolved due to human protection efforts, becoming more complex. Initially, patch aggregation was high and concentrated, but it later showed a slight decrease in aggregation. This was primarily due to the introduction of smaller patches through artificial planting and natural restoration, which reduced patch connectivity. Overall, the landscape was gradually disturbed by human intervention and slowly became more diversified [56].

4. Conclusions

In this study, remote sensing data from 2010 to 2023 were analyzed to assess the expansion of Sonneratia apetala and its impact on local mangroves along the eastern coast of the Leizhou Peninsula. The key findings are as follows:
(1)
Expansion of S. apetala and Decline of Local Mangroves: The area of mangrove forests increased, primarily driven by the expansion of S. apetala. While local mangroves showed a slow decline, S. apetala’s growth is largely attributed to its strong competitive ability and extensive planting efforts. This invasive species has significantly altered the distribution and coverage of local mangrove species.
(2)
Spatial and Temporal Trends: S. apetala has expanded along mudflats and the edges of mangrove forests, reducing the area of native mangroves. It is expected to continue spreading and may dominate the region within the next two to three decades. Thus, urgent measures to control S. apetala’s growth and protect local mangrove species are needed to maintain biodiversity and ecosystem balance.
(3)
Increased Fragmentation: Over the 14-year study period, S. apetala patches increased in number and complexity due to early-stage planting and subsequent spread. The fragmentation of S. apetala habitats, influenced by both natural and human factors, poses a high invasion risk, especially in areas with sparse local mangrove coverage.
In conclusion, Sonneratia apetala has had a profound impact on local mangrove ecosystems, with its expansion threatening the survival of native species. To safeguard the region’s mangrove biodiversity and ensure sustainable ecosystem health, it is essential to implement management strategies that control the spread of S. apetala and promote the recovery of native mangroves.

Author Contributions

Conceptualization, Y.D. (Yingbin Deng) and M.L. (Miao Li); Methodology, X.F.; Software, Y.D. (Yingbin Deng) and D.G.; Validation, W.Z.; Formal Analysis, X.F.; Investigation, M.L. (Miao Li); Resources, H.L. and Y.D. (Yan Deng); Data Curation, Z.L. and X.P.; Writing—Original Draft Preparation, X.F.; Writing—Review and Editing, R.C. and D.G.; Visualization, Y.J.; Supervision, Y.D. (Yingbin Deng) and M.L. (Mingmin Li); Project Administration, X.L. and Z.X. All authors have read and agreed to the published version of the manuscript.

Funding

This research was funded by Beibu Gulf Marine Ecological Environment Field Observation and Research Station of Guangxi (Grant No. GUIKE 23-026-271); National Natural Science Foundation of China (Grant number 42207506); National Ecosystem Science Data Center—Coastal Ecological Remote Sensing Data sub-Center (Grant number 2024B1212080002); The GDAS’ Project of Science and Technology Development (2022GDASZH-2022010202, 2022GDASZH-2022010111, 2022GDASZH-2022020402-01); In addition, partial funding was provided by Guangdong Zhanjiang mangrove wetland ecological quality comprehensive monitoring station.

Data Availability Statement

The data used in the article is publicly available.

Acknowledgments

We would like to thank the Geographical Science Data Center of The Greater Bay Area for providing the relevant data for this study. We also thank the anonymous reviewers for their constructive comments.

Conflicts of Interest

The authors declare no conflicts of interest.

References

  1. Lagomasino, D.; Price, R.M.; Whitman, D.; Campbell, P.K.; Melesse, A. Estimating major ion and nutrient concentrations in mangrove estuaries in Everglades National Park using leaf and satellite reflectance. Remote Sens. Environ. 2014, 154, 202–218. [Google Scholar] [CrossRef]
  2. Murdiyarso, D.; Purbopuspito, J.; Kauffman, J.B.; Warren, M.W.; Sasmito, S.D.; Donato, D.C.; Manuri, S.; Krisnawati, H.; Taberima, S.; Kurnianto, S. The potential of Indonesian mangrove forests for global climate change mitigation. Nat. Clim. Change 2015, 5, 1089–1092. [Google Scholar] [CrossRef]
  3. He, B.Y.; Fan, H.Q.; Wang, M.; Lai, T.H.; Wang, W.Q. Species diversity in mangrove wetlands of China and its causation analyses. Acta Ecol. Sin. 2007, 27, 4859–4870. [Google Scholar] [CrossRef]
  4. Polidoro, B.A.; Elfes, C.T.; Sanciangco, J.C.; Pippard, H.; Carpenter, K.E. Conservation status of marine biodiversity in oceania: An analysis of marine species on the iucn red list of threatened species. J. Mar. Biol. 2010, 2011, 247030. [Google Scholar] [CrossRef]
  5. Proisy, C.; Couteron, P.; Fromard, F. Predicting and mapping mangrove biomass from canopy grain analysis using Fourier-based textural ordination of IKONOS images. Remote Sens. Environ. 2007, 109, 379–392. [Google Scholar] [CrossRef]
  6. Al-Mur, B.A. Green zinc oxide (ZnO) nanoparticle synthesis using mangrove leaf extract from Avicenna marina: Properties and application for the removal of toxic metal ions (Cd2+ and Pb2+). Water 2023, 15, 455. [Google Scholar] [CrossRef]
  7. Rahman, A.F.; Dragoni, D.; Didan, K.; Barreto-Munoz, A.; Hutabarat, J.A. Detecting large scale conversion of mangroves to aquaculture with change point and mixed-pixel analyses of high-fidelity MODIS data. Remote Sens. Environ. 2013, 130, 96–107. [Google Scholar] [CrossRef]
  8. Seto, K.C.; Fragkias, M. Mangrove conversion and aquaculture development in Vietnam: A remote sensing-based approach for evaluating the Ramsar Convention on Wetlands. Glob. Environ. Change 2007, 17, 486–500. [Google Scholar] [CrossRef]
  9. Breithaupt, J.L.; Smoak, J.M.; Smith, T.J.; Sanders, C.J.; Hoare, A. Organic carbon burial rates in mangrove sediments: Strengthening the global budget. Glob. Biogeochem. Cycles 2012, 26. [Google Scholar] [CrossRef]
  10. Polidoro, B.A.; Carpenter, K.E.; Collins, L.; Duke, N.C.; Ellison, A.M.; Ellison, J.C.; Farnsworth, E.J.; Fernando, E.S.; Kathiresan, K.; Koedam, N.E.; et al. The loss of species: Mangrove extinction risk and geographic areas of global concern. PLoS ONE 2010, 5, e10095. [Google Scholar] [CrossRef] [PubMed]
  11. Blasco, F.; Aizpuru, M.; Gers, C. Depletion of the mangroves of Continental Asia. Wetl. Ecol. Manag. 2001, 9, 255–266. [Google Scholar] [CrossRef]
  12. Romañach, S.S.; DeAngelis, D.L.; Koh, H.L.; Li, Y.; Teh, S.Y.; Barizan, R.S.R.; Zhai, L. Conservation and restoration of mangroves: Global status, perspectives, and prognosis. Ocean Coast. Manag. 2018, 154, 72–82. [Google Scholar] [CrossRef]
  13. Sun, Z.; Sun, W.; Tong, C.; Zeng, C.; Yu, X.; Mou, X. China’s coastal wetlands: Conservation history, implementation efforts, existing issues and strategies for future improvement. Environ. Int. 2015, 79, 25–41. [Google Scholar] [CrossRef] [PubMed]
  14. Chen, B.; Xiao, X.; Li, X.; Pan, L.; Doughty, R.; Ma, J.; Dong, J.; Qin, Y.; Zhao, B.; Wu, Z.; et al. A mangrove forest map of China in 2015: Analysis of time series Landsat 7/8 and Sentinel-1A imagery in Google Earth Engine cloud computing platform. J. Photogramm. Remote Sens. 2017, 131, 104–120. [Google Scholar] [CrossRef]
  15. Moberg, F.; Rönnbäck, P. Ecosystem services of the tropical seascape: Interactions, substitutions and restoration. Ocean Coast. Manag. 2003, 46, 27–46. [Google Scholar] [CrossRef]
  16. Sarker, S.K.; Matthiopoulos, J.; Mitchell, S.N.; Ahmed, Z.U.; Al Mamun, B.; Reeve, R. 1980s–2010s: The world’s largest mangrove ecosystem is becoming homogeneous. Biol. Conserv. 2019, 236, 79–91. [Google Scholar] [CrossRef] [PubMed]
  17. Ren, H.; Jian, S.; Lu, H.; Zhang, Q.; Shen, W.; Han, W.; Yin, Z.; Guo, Q. Restoration of mangrove plantations and colonisation by native species in Leizhou bay, South China. Ecol. Res. 2008, 23, 401–407. [Google Scholar] [CrossRef]
  18. Chen, L.; Peng, S.; Li, J.; Lin, Z.; Zeng, Y. Competitive control of an exotic mangrove species: Restoration of native mangrove forests by altering light availability. Restor. Ecol. 2013, 21, 215–223. [Google Scholar] [CrossRef]
  19. Tian, G.; Chen, L.; Peng, S.; Yang, X.; Chen, J.; Chen, M.; Li, J.; Zeng, Y.; Lei, Z. Ecological traits of invasiveness of alien mangrove species Sonneratia apetala. Ecol. Environ. 2010, 19, 3014. [Google Scholar] [CrossRef]
  20. Zeng, W.J.; Liao, B.W.; Chen, X.R.; Li, J.; Ma, S.Q.; Guan, W. The ecological effect of mangrove Sonneratia apetala mixed with three local mangrove species. Ecol. Sci. 2008, 27, 31–37. [Google Scholar] [CrossRef]
  21. Li, M.; Liao, B.; Zheng, S.; Chen, Y. Allelopathic effects of Sonneratia apetala aqueous extracts on growth performance of some indigenous mangroves. For. Res. 2004, 17, 641–645. [Google Scholar] [CrossRef]
  22. Gao, J.; Lundquist, C.J.; Schwendenmann, L. Characterizing landscape patterns in changing mangrove ecosystems at high latitudes using spatial metrics. Estuar. Coast. Shelf Sci. 2018, 215, 1–10. [Google Scholar] [CrossRef]
  23. Buitre, M.J.C.; Zhang, H.; Lin, H. The mangrove forests change and impacts from tropical cyclones in the philippines using time series satellite imagery. Remote Sens. 2019, 11, 688. [Google Scholar] [CrossRef]
  24. Chamberlain, D.; Phinn, S.; Possingham, H. Remote sensing of mangroves and estuarine communities in central Queensland, Australia. Remote Sens. 2020, 12, 197. [Google Scholar] [CrossRef]
  25. Xin, K.; Huang, X.; Hu, J.; Li, C.; Yang, X.; Arndt, S.K. Land use change impacts on heavy metal sedimentation in Mangrove wetlands—A case study in Dongzhai Harbor of Hainan, China. Wetlands 2014, 34, 1–8. [Google Scholar] [CrossRef]
  26. Zhang, J.; Yang, X.; Wang, Z.; Zhang, T.; Liu, X. Remote sensing based spatial-temporal monitoring of the changes in coastline mangrove forests in China over the last 40 years. Remote Sens. 2021, 13, 1986. [Google Scholar] [CrossRef]
  27. Sun, Y.; Zhao, D.; Guo, W.; Gao, Y.; Su, X.; Wei, B. A review on the application of remote sensing in mangrove ecosystem monitoring. Acta Ecol. Sin. 2013, 33, 4523–4538. [Google Scholar] [CrossRef]
  28. Giri, C. Observation and monitoring of mangrove forests using remote sensing: Opportunities and challenges. Remote Sens. 2016, 8, 783. [Google Scholar] [CrossRef]
  29. Valderrama-Landeros, L.; Flores-De-Santiago, F.; Kovacs, J.M.; Flores-Verdugo, F. An assessment of commonly employed satellite-based remote sensors for mapping mangrove species in Mexico using an NDVI-based classification scheme. Environ. Monit. Assess. 2018, 190, 23. [Google Scholar] [CrossRef] [PubMed]
  30. Everitt, J.H.; Yang, C.; Sriharan, S.; Judd, F.W. Using high resolution satellite imagery to map black mangrove on the Texas Gulf Coast. J. Coast. Res. 2008, 246, 1582–1586. [Google Scholar] [CrossRef]
  31. Selvam, V. Environmental classification of mangrove wetlands of India. Curr. Sci. 2003, 84, 757–765. [Google Scholar] [CrossRef]
  32. Hai, P.M.; Tinh, P.H.; Son, N.P.; Van Thuy, T.; Hanh, N.T.H.; Sharma, S.; Hoai, D.T.; Duy, V.C. Mangrove health assessment using spatial metrics and multi-temporal remote sensing data. PLoS ONE 2022, 17, e0275928. [Google Scholar] [CrossRef] [PubMed]
  33. Xia, Q.; Qin, C.-Z.; Li, H.; Huang, C.; Su, F.-Z. Mapping mangrove forests based on multi-tidal high-resolution satellite imagery. Remote Sens. 2018, 10, 1343. [Google Scholar] [CrossRef]
  34. Hens, L.; Nierynck, E.; Van, Y.T.; Quyen, N.H.; Hien, L.T.T.; An, L.D. Land cover changes in the extended Ha long city area, north-eastern vietnam during the period 1988–1998. Environ. Dev. Sustain. 2000, 2, 235–252. [Google Scholar] [CrossRef]
  35. Zhao, C.; Qin, C.-Z.; Wang, Z.; Mao, D.; Wang, Y.; Jia, M. Decision surface optimization in mapping exotic mangrove species (Sonneratia apetala) across latitudinal coastal areas of China. J. Photogramm. Remote Sens. 2022, 193, 269–283. [Google Scholar] [CrossRef]
  36. Hu, Z.; Wu, J.; Wang, J.; Zhang, Y.; Zhou, H.; Gao, C.; Wang, J.; Wu, G. How exotic Sonneratia species affect the spatiotemporal dynamics of mangroves in Shenzhen Bay, China: A remote sensing perspective. Ecol. Indic. 2023, 153. [Google Scholar] [CrossRef]
  37. Yang, H.; Xu, B.; Han, C.; Huang, Z. Situation and benefit of mangrove resources in Leizhou peninsula. Ecol. Environ. 2004, 13, 222–224. [Google Scholar] [CrossRef]
  38. Gupta, K.; Mukhopadhyay, A.; Giri, S.; Chanda, A.; Majumdar, S.D.; Samanta, S.; Mitra, D.; Samal, R.N.; Pattnaik, A.K.; Hazra, S. An index for discrimination of mangroves from non-mangroves using LANDSAT 8 OLI imagery. MethodsX 2018, 5, 1129–1139. [Google Scholar] [CrossRef]
  39. Zhao, D.; Wang, J.; Jiang, X.; Zhen, J.; Miao, J.; Wang, J.; Wu, G. Reflectance spectroscopy for assessing heavy metal pollution indices in mangrove sediments using XGBoost method and physicochemical properties. Catena 2022, 211, 105967. [Google Scholar] [CrossRef]
  40. Do, A.N.T.; Tran, H.D.; Ashley, M.; Nguyen, A.T. Monitoring landscape fragmentation and aboveground biomass estimation in Can Gio Mangrove Biosphere Reserve over the past 20 years. Ecol. Inform. 2022, 70. [Google Scholar] [CrossRef]
  41. Jia, M.; Wang, Z.; Mao, D.; Huang, C.; Lu, C. Spatial-temporal changes of China’s mangrove forests over the past 50 years: An analysis towards the Sustainable Development Goals (SDGs). Chin. Sci. Bull. 2021, 66, 3886–3901. [Google Scholar] [CrossRef]
  42. Zhang, R.; Jia, M.; Wang, Z.; Zhou, Y.; Mao, D.; Ren, C.; Zhao, C.; Liu, X. Tracking annual dynamics of mangrove forests in mangrove National Nature Reserves of China based on time series Sentinel-2 imagery during 2016–2020. Int. J. Appl. Earth Obs. Geoinf. 2022, 112, 102918. [Google Scholar] [CrossRef]
  43. Zhang, J.; Lin, Q.; Peng, Y.; Pan, L.; Chen, Y.; Zhang, Y.; Chen, L. Distributions of the Non-Native Mangrove Sonneratia apetala in China: Based on Google Earth Imagery and Field Survey. Wetlands 2022, 42, 35. [Google Scholar] [CrossRef]
  44. Pimple, U.; Leadprathom, K.; Simonetti, D.; Sitthi, A.; Peters, R.; Pungkul, S.; Pravinvongvuthi, T.; Dessard, H.; Berger, U.; Siri-On, K.; et al. Assessing mangrove species diversity, zonation and functional indicators in response to natural, regenerated, and rehabilitated succession. J. Environ. Manag. 2022, 318, 115507. [Google Scholar] [CrossRef]
  45. Liao, W.B.; Lan, C.Y.; Zan, Q.J.; Wong, Y.S.; Tam, N.F.Y. Growth dynamics and self-thinning of the dominant populations in the mangrove community. Acta Bot. Sin. 2004, 46, 522–532. [Google Scholar]
  46. Peng, Z.; Wang, B.; Zhao, H. Population dynamics and spread characteristics of alien mangrove species Sonneratia apetala in Sanya River, China. Chin. J. Ecol. 2021, 40, 23. [Google Scholar] [CrossRef]
  47. Levine, J.M.; Vilà, M.; Antonio, C.M.D.; Dukes, J.S.; Grigulis, K.; Lavorel, S. Mechanisms underlying the impacts of exotic plant invasions. Proc. R. Soc. B Biol. Sci. 2003, 270, 775–781. [Google Scholar] [CrossRef] [PubMed]
  48. Gorchov, D.L.; Trisel, D.E. Competitive effects of the invasive shrub, Lonicera maackii (Rupr.) Herder (Caprifoliaceae), on the growth and survival of native tree seedlings. Plant Ecol. 2003, 166, 13–24. [Google Scholar] [CrossRef]
  49. Nguyen, H.T.T.; Hardy, G.E.S.J.; Van Le, T.; Nguyen, H.Q.; Le, D.H.; Van Nguyen, T.; Dell, B. Mangrove dieback and leaf disease in Sonneratia apetala and Sonneratia caseolaris in Vietnam. Forests 2021, 12, 1273. [Google Scholar] [CrossRef]
  50. Ren, H.; Lu, H.; Shen, W.; Huang, C.; Guo, Q.; Li, Z.; Jian, S. Sonneratia apetala Buch. Ham in the mangrove ecosystems of China: An invasive species or restoration species? Ecol. Eng. 2009, 35, 1243–1248. [Google Scholar] [CrossRef]
  51. Ng, S.; Corlett, R. The bad biodiversity: Alien plant species in Hong Kong. Biodivers. Sci. 2002, 10, 109–118. [Google Scholar] [CrossRef]
  52. Forman, R.T.T. Land Mosaics: The Ecology of Landscapes and Regions; Cambridge University Press: Cambridge, UK, 1995. [Google Scholar] [CrossRef]
  53. Haddad, N.M.; Brudvig, L.A.; Clobert, J.; Davies, K.F.; Gonzalez, A.; Holt, R.D.; Lovejoy, T.E.; Sexton, J.O.; Austin, M.P.; Collins, C.D.; et al. Habitat fragmentation and its lasting impact on Earth’s ecosystems. Sci. Adv. 2015, 1, e1500052. [Google Scholar] [CrossRef]
  54. Li, C.; Liu, S.; Fan, H.; Dai, H. A patch-based method for mechanism analysis on spatial dynamics of mangrove distribution. Acta Ecol. Sin. 2012, 32, 4329–4342. [Google Scholar] [CrossRef]
  55. Li, M.; Liao, B.W.; Guan, W.; Zheng, S.F.; Chen, Y.J. Survey on cold damage of mangroves in Guangdong Province. Prot. For. Sci. Technol. 2009, 2, 29–31. [Google Scholar] [CrossRef]
  56. Huang, X.; Yuan, J.; Wang, X.; Kwan, K.; Zhang, Q. Dynamics of mangrove change: Insights from 30-year observations of Maowei Sea. J. Mar. Sci. 2022, 40, 132. [Google Scholar] [CrossRef]
Figure 1. Satellite image (left) and drone images (right) of the study area.
Sustainability 17 01069 g001
Figure 2. Workflow of this study.
Sustainability 17 01069 g002
Figure 3. Images of Sonneratia apetala (left) and local mangroves (right) ((a) Sonneratia apetala; (b) Avicennia marina; (c) Kandelia obovata; (d) Aegiceras corniculatum).
Sustainability 17 01069 g003
Figure 4. RMSE of classification in 2010, 2016, and 2022.
Sustainability 17 01069 g004
Figure 5. Changes in mangrove areas from 2010 to 2023.
Sustainability 17 01069 g005
Figure 6. Changes in the proportion of mangrove forests from 2010 to 2023.
Sustainability 17 01069 g006
Figure 7. Average annual rate of change of mangrove forests from 2010 to 2023.
Sustainability 17 01069 g007
Figure 8. Spatial pattern of Sonneratia apetala from 2010 to 2023.
Sustainability 17 01069 g008
Figure 9. Classification results for 2010 (a) and 2011 (b).
Sustainability 17 01069 g009
Figure 10. Classification results for 2016 (a) and 2017 (b).
Sustainability 17 01069 g010
Figure 11. Classification results for 2015 (a) and 2016 (b).
Sustainability 17 01069 g011
Figure 12. Landscape index change from 2010 to 2023 ((a) number of patches, (b) total edge length, (c) class area, (d) area-weighted mean shape index).
Sustainability 17 01069 g012
Figure 13. Classification results for 2017 (a) and 2018 (b).
Sustainability 17 01069 g013
Figure 14. Classification results for 2013 (a) and 2014 (b).
Sustainability 17 01069 g014
Table 1. Masking of water bodies using the normalized difference water index.
Index NameEquationDescription
Normalized difference water index (NDWI) N D W I = ρ G ρ N I R ρ G + ρ N I R The index was used to determine the threshold between vegetation and water.
Table 2. The equations of the landscape pattern indices.
Index NameFormulasDescriptive
Number of patches (NP)NP = NTotal number of patches in the landscape
Patch area (CA)CA = AThe sum of the areas of all patches of a given class in a landscape.
Total edge length (TE)TE = ETotal perimeter of patches of a given patch type.
Area-weighted mean shape index (AWMSI) A W M S I = i = 1 m j = 1 n 0.25 P i j a i j a i j A The perimeter-to-area ratio of area-weighted patches was calculated by dividing the perimeter of each patch by the square root of the area and multiplying the result by a square correction factor.
Note: N is the total number of patches, A is the patch area, E is the total length of the patch boundary, a i j is the area of the ith category j patch, and P i j is the perimeter of the ith category j patch.
Table 3. Changes in mangrove areas from 2010 to 2023.
YearMangrove Area/hm2Average Annual Rate of Change/%Percentage of Mangroves/%Sonneratia apetala Area/hm2Average Annual Rate of Change/%Percentage of Sonneratia apetala/%Local Mangrove Area/hm2Average Annual Rate of Change/%Percentage of Local Mangroves/%
2010274.17 0.3718111.15 0.1507163.02 0.2211
2011301.020.0980.4082121.140.08980.1642179.880.10340.2439
2012308.710.0250.4186101.97−0.15820.1382206.730.14920.2803
2013319.340.0340.4331149.220.46330.2023170.11−0.17710.2307
2014321.250.0060.4356160.650.076510.2178160.60−0.05590.2177
2015332.100.0330.4503157.59−0.01900.2137163.660.01910.2219
2016332.230.00030.4505167.650.06380.2273164.570.00550.2231
2017366.550.1030.4971219.060.30660.2970147.49−0.10380.2000
2018369.150.0070.5006237.60.08460.3222131.55−0.10810.1784
2019380.580.0300.5161242.370.02010.3286135.170.02750.1833
2020382.200.0040.5183250.210.03230.3393127.36−0.05780.1727
2021382.370.00040.5185251.70.00590.3413125.87−0.01160.1707
2022382.950.00150.5193256.230.01790.3474121.35−0.03590.1645
2023383.420.00120.5199254.81−0.00550.3455125.060.03050.1696
Aggregate change109.250.39850.1481143.661.29240.1948−37.95−0.2328−0.0514
Table 4. Changes in landscape indices from 2010 to 2023.
YearNumber of Sonneratia apetala PatchesNumber of Local Mangrove PatchesArea of Sonneratia apetala Patches/hm2Area of Local Mangrove Patches/hm2Total Edge Length of Sonneratia apetala /hmTotal Edge Length of Local Mangroves /hmArea-Weighted Mean Shape Index of Sonneratia apetalaArea-Weighted Mean Shape Index of Local Mangroves
201014061110.97182.256.6306.6903.324.12
201113881126.99192.427.6088.0463.094.44
20127883121.59198.275.6467.2603.644.76
201311185160.11169.838.0107.3863.73.8
20148478176.13155.978.1846.5404.573.54
20159990161.73170.376.9307.0264.063.74
2016322316174.04160.3511.89611.2145.674.79
2017311445224.32143.9815.39014.34876.31
2018246309240.11130.7714.72012.1687.755.71
2019370482247.42133.4516.27814.1669.523.88
2020359475240.83140.0415.80814.3029.054.3
2021305443225.31155.5614.03015.7567.824.08
2022318379240.94139.9313.60812.6887.993.82
2023279400231.82149.0513.22213.9887.724.35
Aggregate change139339120.85−33.26.5927.2984.40.23
Disclaimer/Publisher’s Note: The statements, opinions and data contained in all publications are solely those of the individual author(s) and contributor(s) and not of MDPI and/or the editor(s). MDPI and/or the editor(s) disclaim responsibility for any injury to people or property resulting from any ideas, methods, instructions or products referred to in the content.

