Abstract
In order to elucidate the market potential and competition strategies of various photovoltaic (PV) technologies in the context of future architectural trends, taking into account the aesthetic impact and evolving architectural styles, a suite of market assessment methodologies was proposed and applied to systematically evaluate five commercially available PV technologies. Three methodologies were employed or introduced: a comprehensive weighting approach that integrates the TOPSIS entropy weight method with user weight surveys, cumulative prospect theory (CPT), and a market integration method. The survey revealed that price emerged as the paramount factor distinguishing technologies, with a score of 4.8766, closely followed by conversion rates, at 4.8326. Aesthetics was deemed 3% more significant than government subsidies to consumers, scoring 4.4414. During the evaluation, technical indicators were translated into professional financial metrics. The results indicated that crystalline silicon PV technologies hold market advantages in both traditional and transparent applications. Monocrystalline silicon exhibited the highest utility in traditional settings, with a value of −0.0766, whereas polysilicon topped the charts in transparent applications, scoring −0.0676. However, when aesthetics was fully factored in, thin-film technologies began to outperform crystalline silicon, initially in transparent settings and subsequently in traditional ones. When both scenarios were merged, the market share of thin-film PVs increased with a rise in transparent applications, while that of crystalline silicon PVs decreased. Sensitivity and comparative analyses yielded diverse outcomes, validating the robustness of the findings. Further research unveiled that, beyond utility and cost, competition and technological factors also influence market shares, particularly when contemplating future shifts in architectural styles and innovations in product aesthetics. Considering the above, crystalline silicon PV can dominate the PVs in the building market due to their advantages of cost and efficiency, and thin-film PVs can increase their own market share with their aesthetic advantages in the future.
1. Introduction
The world is experiencing the threat of global warming, driven by the extensive use of fossil fuels in human activities, which leads to high greenhouse gas (GHG) emissions [1]. The El Niño phenomenon is frequent, and human beings are facing serious environmental challenges owing to these emissions [2]. The rise in temperature brings many uncertainties that threaten human health, food security, and so on [3]. Renewable energy has developed rapidly in recent years, yet fossil fuels continue to dominate, supplying about 80% of our energy needs. Moreover, buildings constitute a substantial share of overall energy usage. Nearly 36% of the world’s energy is consumed by buildings, accounting for about 39% of the total carbon emissions [4]. Solar energy has very distinct environmental characteristics and has the potential to replace fossil energy with the development of technologies, especially photovoltaic (PV) technology [5]. PVs can be used to power homes independently or be connected to the grid [6] so the volatility of power generation can be better controlled, and the proportion of clean energy in the electricity grid can be increased by using them [7]. The window-to-wall ratio of modern buildings is changing [8], and the use of curtain walls is also becoming more extensive [9]. This trend provides a market for PV applications in the construction field and alters the balance in terms of both light transmittance and aesthetics [10]. Moreover, keen market sense and accurate adjustments in response to these changes will significantly contribute to the reduction in GHG emissions and promote sustainable development.
In recent years, scholars have achieved numerous research results in the field of energy conservation and emission reduction in buildings, especially in the field of PVs. In order to reduce GHG emissions in buildings, Hachem-Vermette et al. have put forward the concept of the “net-zero” building, which can be self-sufficient in energy [11]. Zomer et al. have also put forward the concept of energy-rich buildings, which can generate more electricity than their own requirements by integrating PV modules [12]. An experiment found that a 10 kW PV system was capable of reducing 15 tons/year of carbon, which shows a strong potential for environmental protection [13]. Yang and Zou have systematically analyzed the costs, benefits, risks, and obstacles of buildings using PV modules, and pointed out that they not only can reduce GHG emissions but also bring economic and social benefits [14]. PV integration can also influence the aesthetic appeal of buildings, save part of the construction cost, and increase the acceptance of integrated buildings [15]. Innovations in production processes, stability, flexibility, and diversity all facilitate the integration of PVs with buildings as well as reduce energy loss [16]. Including technological innovation, cost reduction, and new product innovation, the use of PV systems in buildings has been growing at a relatively rapid pace year by year [17]. The application of PV systems is becoming a dominant feature in contemporary buildings [18]. PVs are permeating existing building technologies, prototypes, and processes [19].
Commercially used PVs include crystalline silicon PV (CSPV) and thin-film PV (TFPV) [20]. CSPV includes monocrystalline silicon (M-Si) and polysilicon (P-Si), which have rich raw materials and a mature production process. TFPV mainly consists of amorphous silicon (A-Si), copper indium gallium selenium (CIGS), and cadmium telluride (CdTe). The latter two contain rare metals, and their manufacturing costs are relatively high. In the building field, Sarkar et al. mainly paid attention to the efficiency of different PVs in different regions as well as the influencing factors of power generation efficiency, including tilt, orientation, and shading, among others [21]. In terms of PV assessment, scholars have conducted research from both the overall and technical perspectives, but no scholar has conducted systematic research by distinguishing different application scenarios. PV modules can be installed on roofs, walls, or windows, involving the integration of traditional scenarios (TDSs) and transparent scenarios (TPSs).
During the assessment, the current study evaluates the PVs according to the parameters and the attributes that consumers consider, from a comprehensive perspective. In this analysis, the attribute values are transformed and normalized through mathematical methods utilizing interval numbers. Regarding PV assessment, various scholars have adopted different weight methods. In this field, the objective measurement of attribute weight represents an innovative aspect. Wu et al. tended to use the expert direct evaluation method or the expert indirect evaluation method [22], while Cheng et al. treated the weights of attributes as equal [23]. Their calculations of weights were subjective, limiting their ability to discern differences in attribute values across various attributes. In contrast, this paper adopts the comprehensive weight method to research PVs, which incorporates an objective weighting method and a subjective method. The subjective weight based on user surveys can be more realistic than expert evaluations, while the objective weight calculated using the TOPSIS entropy weight method can better reflect information differences among varied attributes. TOPSIS entropy is calculated by combining the TOPSIS method with the entropy weight method, which have the characteristics of objectivity, simplicity, and intuitiveness.
In terms of evaluation ranking, the assessment of market space cannot rely solely on expected utility, as market participants have varying psychological perceptions of gains and losses [24]. Most multi-attribute decision-making methods are grounded in expectation theory, which treats the “higher than expected” and “lower than expected” components on an equal level. However, for actual consumers, their psychological experiences of income and loss are markedly different [25]. Prospect theory has proved that losses of the same magnitude tend to influence people’s behavior more significantly than gains, and cumulative prospect theory (CPT) has illustrated these differences with a given formula [26]. In application, CPT can cater to consumers’ expectation levels, preferences, and rational attitudes. Owing to its straightforward functional form and its capacity to systematically reflect consumers’ psychological characteristics, CPT has been widely employed in the field of evaluation, especially in market evaluations that involve extensive consumer participation [27]. Through sensitivity analysis and comparative analysis, the CPT method can comprehensively demonstrate the features and their varying rules of PVs under different hypothetical conditions.
There are some obvious differences in the technical parameters of PV systems between the two primary scenarios, necessitating separate measurements for both. Consequently, when assessing the overall performance of the market, it involves integrating the unique factors present in these two scenarios. To address this issue, the current study proposes a proportional distribution method based on a nonlinear function by referring to the shape of the Lorenz curve, and then, comprehensively analyzes the overall market. Furthermore, from the consumer’s perspective, cost expenditure and utility are two concepts. It is common practice to analyze the market value of a technology based solely on the single dimensional attribute of cost, but the independent value relationship between cost and utility in market practice should also be recognized. On this basis, this study introduces the concept of cost–profit space in the field of technology assessment so as to analyze the relationships among cost, profit, price, and utility, which can provide more comprehensive and realistic evaluation information.
To sum up, this study aims to systematically evaluate the potential of PVs to improve the efficiency in the building sector by exploring which type of PV is more practical under different conditions. The development of PVs in the building sector is influenced by technological performance, cost, and architectural aesthetics. For market participants, it is vital to identify which technologies have advantages and which ones have more potential for the future. This understanding is key to seizing market opportunities, to improving technical performance efficiently, and to driving accurate product innovation. The contributions of this study can be summarized as follows. Firstly, five PVs are systematically evaluated by translating the technical parameters into attributes that consumers care about, and the utilities of different alternatives are measured using CPT, thereby ensuring the reliability and practicality of the data. Secondly, the utility of PVs in the building integration market is analyzed from both the TDS and TPS perspectives by using the CPT, and the influences of aesthetic factors are also analyzed, thus filling the gap in the research field. Thirdly, the method of objective weight calculation is innovated, while subjective weights are confirmed through questionnaires. The combined application of these two weights ensures the rationality of the assessment. Fourthly, by combining economics, decision science, and other knowledge, the current study proposes a way to integrate two separate markets, calculating the possible distribution of the overall market and providing a reference for solving similar problems. Fifthly, taking into account consumers’ habit of considering cost and utility as a pair of factors, the concept of cost–profit space in technology evaluation is proposed, which offers a reference for research into pricing strategies.
2. Literature Review
2.1. Research on PVs in the Building Field
In terms of PVs in the building field, many scholars have conducted relevant research. Shukla et al. evaluated PVs from the aspect of technical application, aiming to improve application effects and spaces. Shukla et al. analyzed the paths and methods to improve the efficiency of PV modules, considering operation parameters and climate impact [28]. Biyik et al. conducted a systematic review of previous PV research, pointing out that both CSPVs and TFPVs have potential for application in building integration, with TFPVs being especially suitable due to their plasticity [29]. These studies have explored the application value of different PV technologies in the field of building integration; however, they generally conduct research based on certain characteristics of a specific technology without visually presenting or quantifying the relevant qualitative evaluations through quantitative analysis.
Some scholars have conducted various evaluations and comparative analyses of PVs through experimental analysis. Shafique et al. reviewed the advantages and limitations of PV roofs and proposed extensive experimental research, providing references for improving the design and development of PVs in architecture [30]. Pelle et al. evaluated colored building-integrated PV technologies in terms of methodology and experiments, discussing the balance of aesthetics, energy savings, and power generation [31]. Xu et al. studied PV curtain walls and constructed a mathematical model, subsequently conducting experimental research and analysis on the efficiency of CSPVs and TFPVs in three cities [32]. Wang et al. proposed a method to evaluate the indoor adaptive thermal comfort of buildings integrated with semi-transparent PV windows [33]. These studies mentioned the application of PV technologies in different fields, particularly in TDSs and TPSs. These quantitative comparisons are highly intuitive, but they fail to calculate the utility value and influencing factors of various PV technologies in different scenarios. As such, it is necessary to conduct an overall evaluation of the utility of PV technologies from a multi-attribute assessment perspective as well as sensitivity tests, among others.
Sun et al. discussed the influencing factors of PVs in the building field, focusing on the installation conditions or installation specifications of buildings [34]. Zomer et al. studied the influence of shadows on the power generation efficiency of PVs and found that shadows can affect power generation for both CSPVs and TFPVs, but the main factor is the absolute intensity of light [12]. Azami and Sevinç researched the influence of building shape, studying the effects of shape and direction on power generation through the shape coefficient and other indicators [35]. Based on a brief review, Cibi and Manikandan analyzed PVs in the building field from the perspectives of orientation, tilt, performance, and cooling and discussed future development [36]. These studies have explored the impact of natural environmental factors on the efficiency of PV systems in building scenarios, but they are not applicable to market assessments. In the overall market, the influence of these natural factors tends to be balanced out, whereas social factors, particularly consumers’ differing perceptions of gains and losses and their varied focus on different attributes, significantly impact the ultimate market share. Therefore, it is crucial to place greater emphasis on social factors in market assessment studies and to conduct market potential evaluations and various conditional tests based on these factors.
2.2. Research on PV Assessments
In terms of PV assessment, Kaa et al. evaluated the dominant potential of PVs from the perspective of the overall market. They applied the analytic hierarchy process (AHP) method based on expert evaluation and adopted market and stakeholder indicators in their evaluation [37]. Muhammad et al. evaluated and analyzed PVs based on attributes such as performance, maintenance, safety, economy, environment, and applicable space, taking into account the geographical environment of Pakistan, mainly using AHP [38]. Long and Geng evaluated PVs in an interval intuitive fuzzy environment, focusing on how to select the right PV modules for PV power stations in terms of quality, cost, supplier reputation, and operational capability [39]. Based on the actual situation in Poland, Zdyb and Gulkowski evaluated different PVs according to factors such as power generation efficiency, maximum power, and temperature coefficient, among others [40]. Fang et al. evaluated the sustainable attributes of PVs from four dimensions and adopted the cloud model method in this area [41]. Zhang et al. analyzed the future potential of different PVs from a sustainability perspective considering various technical indicators. They proposed a method using mixed information and CPT for this analysis [27]. These evaluation studies are systematic and quantitative, proposing numerous reliable methodologies, yet they primarily concentrate on technical options and seldom integrate specific requirements within the realm of buildings.
In terms of the economic aspect, Zhang evaluated PVs from the perspectives of economy and reliability, considering attributes like manufacturing cost, energy efficiency, market share, and carbon emissions. They then ranked the alternatives by using fuzzy number and prospect theory [42]. Compared with pure economic evaluation, Bahou conduct techno-economic evaluation [43]. Anoune’s studies frequently concentrate on the technical and economic performance of specific projects [44]. Ali et al. primarily delve into the viability of integrating PV technology with other technologies [45]. This exploration can offer valuable insights and inspiration for the current study, particularly regarding economic indicators. In terms of building-integrated PV technologies, different scholars have conducted various experimental studies on the technical parameters of PVs from different perspectives. Peng et al. discussed PV selection and emphasized the importance of considering function, cost, technology, aesthetics, and maintenance and replacement in the application of integrated PVs in buildings [46]. Zhang et al. reviewed relevant studies on the energy performance of building-integrated PVs [47]. As a unique attribute in the field of architecture, aesthetics receives a level of attention in architecture that is unmatched in other areas of PV technology application. As part of a building, the aesthetic attributes of PV technology should not be overlooked. Furthermore, as this is an assessment within the market realm, certain financial metrics also merit attention, necessitating the translation of technical indicators into those suitable for market evaluation.
From this literature review, it can be seen that previous studies on PVs primarily focused on specific technical parameters, and no scholars have conducted systematic utility analysis. Although some scholars evaluated PVs in the building sector, these evaluations were largely qualitative judgments based on quantitative parameters, lacking systematic mathematical calculations. In terms of PV assessment, Singh et al. evaluated specific PV technologies or modules from different perspectives within the broader market context [48], while a systematic market potential assessment encompassing various PVs in the building sector remains unexplored.
3. Methodology
Regarding methodology, a variety of methods were adopted or proposed in these evaluations, ranging from qualitative to quantitative approaches, with some scholars also considering the influence of risk aversion and rationality. Inspired by previous studies, this study aims to ensure the objectivity of evaluations while fully considering the psychological characteristics of consumers. To this end, we propose a novel objective weight calculation method named the TOPSIS entropy, which is an objective method in which the determination of weights and decision results is not influenced by subjective preferences or the weight method for technology evaluation. Recognizing the ease of identifying consumer preferences in the building sector, this study also assigns subjective weights, which are then combined with the objective weights to derive comprehensive weights as the metric for attribute importance. Furthermore, acknowledging that consumers are not fully rational and exhibit varying attitudes toward profit and cost [49], this study adopts CPT as the basis for ranking calculations, following the precedent set by prior studies. Given that PV applications in building integration encompass both traditional and transparent scenarios, we also introduce a market fusion model to calculate the overall market potential of PV technology across these two distinct markets.
The adopted methods are divided into four parts: research preparation, data preparation, utility value calculation, and test analysis. The data preparation phase involves collecting technical parameters and translating these technical parameters into attributes. In the utility value calculation part, the TOPSIS entropy method and CPT method are employed to calculate the utility value of different PVs in the TDS and TPS. The integration analysis is based on a ratio formula that mimics the Lorenz curve. In the test section, both sensitivity analysis and comparison analysis are conducted. The cost–profit profiles are then presented to illustrate the relationships between pricing, cost, revenue, and competition (Figure 1).
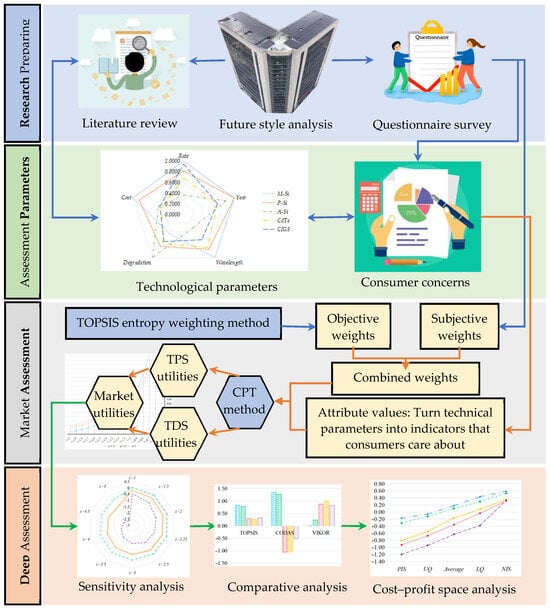
Figure 1.
Research process and methods.
3.1. Description
Suppose there are technologies that need to be analyzed, and each candidate has attributes that are relevant to the decision. Let represent the PV set, where is the th technology, and its subscript set is , where represents the subscript of the th technology. Let represent the technical index set of each PV, and its subscript set is , where represents the subscript of the th technical parameter. The attribute set required for evaluation can be obtained by calculating the technical parameters through their interconnections. Let represent the attribute set, and its subscript set is , where represents the subscript of the th attribute of the alternatives. Let be the decision matrix, where is the value of the th attribute of the th technique. In addition, the attributes of profit type and cost type are defined as and . If , the attribute is the benefit type; if , the attribute belongs to cost. Let be the weight vector of attributes, satisfying and , where represents the weight of the th attribute, .
3.2. Variables
If the characteristic of an attribute of PV is definite, the expected value of attribute and its attribute value can be expressed by clear numbers. If the attribute is difficult to be determined as an accurate value, and its value can be determined to be within a certain range, then an interval number can be adopted. In this case, let be the interval number, where = [, ], , , . A clear number can be regarded as a special form of interval number that can be converted to interval number by the formula , where . In order to facilitate calculation, all clear numbers are converted into interval numbers in this case.
Given that the attribute value is the interval number , , , and can be recorded. According to the properties of interval numbers, when , if , then ; if , then . When , if , then ; if , then .
Let represent the normalized value of . According to the characteristics of interval numbers, the normalization of in the decision matrix can be defined as follows [50]:
where
3.3. TOPSIS Entropy Method
The TOPSIS (Technique for Order of Preference by Similarity to Ideal Solution) entropy method is an objective tool in which the determination of weights and decision results is not influenced by subjective preferences but relies entirely on the objective data. The TOPSIS method determines the distance between the solution and both the positive ideal solution (PIS) and the negative ideal solution (NIS). It calculates the degree of closeness by comparing the distance to the NIS with the total distance, enabling the selection of the solution that is closest to the PIS and furthest from the NIS [51]. Subsequently, utilizing the relative position and discrete distribution information of the attribute values retained in the transformation process, the entropy weight method [52] is then adopted to calculate the weights. This approach is improved as the TOPSIS entropy weight method [53]. The calculation procedure is outlined below.
Calculate the values of PIS and NIS, i.e., and .
Calculate the distance between the attribute value and the PIS and NIS.
Calculate the closeness degree of each attribute value.
Normalize the closeness degrees.
Calculate the entropy value of closeness degree
where .
Calculate the objective weight of each attribute.
At the same time, it is assumed that the subjective weight is , where represents customers’ attention to attribute , the weight coefficient is set as , and ; then, the final weight can be determined as follows:
3.4. Utility Calculation Based on CPT
When constructing the profit and cost matrix, it is necessary to measure the distance between the normalized attribute value and its corresponding reference value. Assuming the normalized reference vector is , the above distance can be calculated using Euclidean geometry. Let represent the distance matrix; the calculation formula of is defined as follows:
Let represent the profit and cost value; then,
According to the connotation of standardized matrix, when is positive, it belongs to gain; otherwise, it is a loss.
According to the CPT, the reference vector is an effective tool to reflect the intuitive utility of consumers. Let represent the utility matrix of ; then, is defined as follows:
In Formula (14), and are the decreasing sensitivity coefficients of decision makers in the case of gain and loss, respectively. represents the loss aversion coefficient, reflecting the degree of loss avoidance of human beings. , , and satisfy , , and . According to the literature, the values of , , and are , , and .
According to the CPT, the total utility is determined by weight function and subjective value function. Let represent the total utility, and the overall utility of is determined as follows:
The larger the value of is, it represents that the corresponding can better meet the expectations of customers.
4. Case Study
4.1. Attribute Identification and Calculation
To analyze the attributes about PVs that users pay more attention to, this study conducted a questionnaire survey by adopting the Likert seven-level scale. This survey was mainly conducted through schools, WeChat groups, etc. More than 500 questionnaires were collected, and 478 ones were valid. The Cronbach’s coefficient of the questionnaire as a whole was 0.948. Among the participants in the survey questionnaire, there were 211 men and 267 women, with 309 individuals from rural areas and 220 individuals from urban areas (Table 1).

Table 1.
Descriptive statistical characteristics of the sample.
As illustrated in Table 2, the results show that many factors such as technology-related price, conversion rate, operating cost (cleaning), installation cost, and aesthetics have a high impact on consumers’ purchasing intention. The survey also analyzed the importance of various business behaviors, with after-sales service or the reputation of the merchant topping the list, closely followed by price, which is about 1% lower than the former. Price is deemed 8.4% more important than brand and 2.5% more important than government reputation. Aesthetics is considered 3% more significant than government subsidies and 6.8% more crucial than merchants’ promises of recycling. These disparities in business behaviors have a greater impact on enterprises or regions and do not constitute a notable difference in PV technology; thus, they were not considered in this study. Drawing on the previous literature, survey results, and financial knowledge, the current study evaluates the market potential of PV technology in the architectural field based on five attributes: annual average installation cost index (), annual procurement cost (), annual module efficiency (), soiling loss index (), and aesthetics ().

Table 2.
The average importance of attributes that consumers are concerned about.
These five attributes encompass the key factors mentioned in the literature and offer novel insights. However, these attributes need to be measured and calculated through basic technical indicators on the basis of professional finance knowledge. Relative parameters include battery efficiency (), module efficiency (), KWH area (), module life (), degradation rate (), soiling coefficient (), cost (), and appearance () (Table 3). In addition to the attributes mentioned, financial analysis often considers depreciation, but given that consumers are unlikely to easily dispose of PV modules, they have limited bargaining power in the second-hand market, where price fluctuations can be significant. As such, to simplify the issue, the current study does not consider depreciation or the second-hand market situation.

Table 3.
Technical parameters of different PVTs in TDSs.
The values of technical parameters used in this study are shown in Table 3, and most of them were obtained by querying the literature. Nascimento et al. contributed to the battery efficiency, module efficiency, KWH area, and soiling coefficient of the five alternatives as well as the module life of A-Si [54]. Ludin et al. illustrated the module life of M-Si, P-Si, and CdTe [55], and Kong et al. presented the module life of CIGS [56]. Jordan and Kurtz presented the degradation rate of these PVs [57]. The cost data were determined by checking the quotation on Alibaba. The evaluation of appearance was carried out through subjective analysis by setting up seven different levels of aesthetic attractiveness: Ae = {[0.1, 0.4], [0.2, 0.5], [0.3, 0.6], [0.4, 0.7], [0.5, 0.8], [0.6, 0.9]}, where a larger coefficient indicates a more beautiful appearance. For CSPVs, the appearance color of P-Si is blue, and it has irregular stripes on its surface. For another, the color of M-Si is blue to black, and the surface is more regular, so it appears more beautiful. Furthermore, for TFPVs, they can be used on different substrates and can have better malleability [58]; thus, they have better scores in aesthetics than CSPVs [29].
Annual average installation cost index (): The installation cost is related to the area (), and the average cost is simultaneously affected by service life (). Considering that the installation costs in the same area and region are the same, the calculation formula of the is given as follows:
Annual procurement cost (): Under the same cost (), the longer the service life (), the lower the average cost is. Taking 1 kw power as an example, the calculation formula of is as follows:
Annual module efficiency (): Battery efficiency () exists only in a laboratory setting, so is adopted in this study. will decrease with age due to varied attenuation, which can be reflected by the degradation rate (), whose influence accumulates each year. Based on this, by referring to the sum formula of a geometric series and combining the relationships between , , and module life (), the formula for calculating is created as follows:
Soiling loss index (): PV modules are not only affected by high temperature, but also by dust attachment [59]. Dust reduces light transmittance at a typical rate (), which results in a loss of electricity generation. Based on this, the formula of is as follows:
Aesthetics (): can be directly transformed from the evaluation result as follows:
According to Formulas (16)–(20), the values of the attributes can be calculated (Table 4). Attribute and attribute belong to the profit type, while the others belong to the cost type.

Table 4.
Evaluation attributes of PVs in TDSs.
4.2. Utility Calculation in TDSs
First, calculate the weights according to Formulas (3)–(10):
Based on the influence of various attributes on consumers’ purchase intention shown in the questionnaire (Table 2), the subjective weight coefficient was calculated.
Based on the objective weight and subjective weight, the comprehensive weight vector can be calculated by setting the coefficient according to Formula (11):
After the weights are obtained, the utility value needs to be calculated. According to Formulas (1) and (2), the normalized attribute matrix is obtained. After this, the reference vector must be determined. Considering that the expectation of consumers is not necessarily optimal, but generally is not lower than the average, the upper quartile (UQ) of each attribute is taken as the reference, namely:
According to Formula (12), the distance matrix can be calculated. Then, the distance matrix with direction marker is obtained according to Formula (13). Then, according to Formula (14), the prospect matrix can be constructed. Based on the and weight vector, the utility values of the five PVs in TDSs can be calculated according to Formula (15): = −0.0766, = −0.1288, = −0.4592, = −0.4939, = −1.1359. That is, the priorities of the PVs in the TDS are as follows:
Because of its advantages in majority attributes, M-Si dominates the assessment, followed by P-Si. CdTe surpasses CIGS in the ranking due to its relative advantages in degradation rate and cost. However, the difference between the two is not significant, indicating that there may be mutual substitution potential between them. A-Si ranks behind these PVs due to its low conversion rate, poor stability, and worse soiling loss coefficient.
The ranking of PVs may differ at different levels of expectation. The PIS, UQ, average, lower quartile (LQ), and NIS are used as reference points to calculate priorities so as to analyze the changes in the ranking relationships under different assumptions. The results are shown in Figure 2. M-Pi and P-Si remain in relatively stable positions due to their advantages in conversion rate, lifetime, and soiling loss coefficient. CIGS takes the third place over CdTe when the average is taken as reference vector, and CdTe remains in third place in other cases.
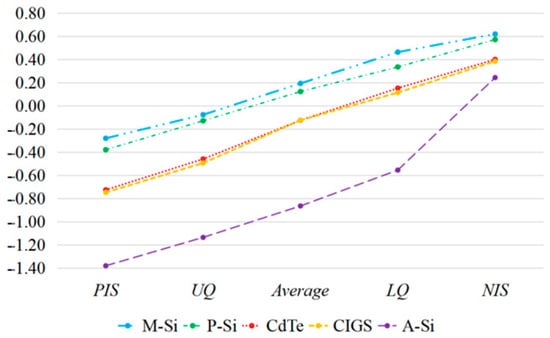
Figure 2.
Sequence of photovoltaic technologies in TDSs.
In addition to the differences in expectation levels, consumers may be more concerned about aesthetics in the building field because the aesthetics of PVs has received more attention in the field of building integration than in other fields. The importance of attributes can be reflected by the magnitude of the weights, so the scenario can be described by increasing the relative weight of aesthetics. Assuming that the subjective weight of other attributes remains unchanged, the weight of aesthetics is set to = {0.25, 0.5, 0.75, 1, 1.25}, and the reference vector is set to the UQ. Then, as shown in Figure 3, with the increase of , the utility values of TFPVs show an increasing trend.
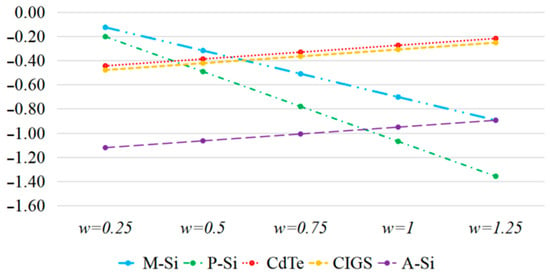
Figure 3.
Influence trend of aesthetics in TDSs.
4.3. Utility Calculation in the TPS
For building PVs, whether on roofs or windows, the buildings inevitably need light transmission, which necessitates the use of transparent PV products [60]. CSPVs can be made transparent by using glass substrates and rasterizing fills. TFPVs, on the other hand, can be made transparent by directly utilizing transparent substrates [61]. Based on the current technological development, a module efficiency with a light transmittance of about 20% () is typically used as the technical parameter for calculations. Akinoglu et al. presented the efficiencies of CIGS and A-Si in the TPS [20]; Barman et al. provided data on CdTe [62]; and Lee et al. studied the efficiencies of M-Si and P-Si [63]. Compared with TDSs, the efficiencies of PV modules in TPSs vary, and the required installation areas () for the same watt are increased. TFPVs not only have a simpler appearance, but they can also can be colored by adding other compounds [64], enhancing their aesthetic appeal. This, in turn, amplifies the difference in transparency beauty () (Table 5). For other parameter values, this study assumes that there are no significant differences.

Table 5.
Varied technical parameters of PVs in the TPS.
By replacing with , with , and with , according to Formulas (16)–(20), the attribute values in the TPS can be calculated. Among them, , , and have non-homogeneous changes (Table 6), and the others remain the same as above.

Table 6.
Varied attribute values of PVs in the TPS.
The objective attributes are calculated by Formulas (3)–(10):
According to Formula (11), the comprehensive weight can be calculated by setting :
Take the UQ as the reference vector, and according to Formulas (12)–(14), the accumulated prospect matrix can be calculated. Based on the CPT matrix and weight vector, the utility values can be calculated according to Formula (15) as follows: = −0.0944, = −0.0676, = −0.8887, = −0.9327, = −0.7752. The priority order of the five PVs in the TPS is
The application of CSPVs in the TPS is still advantageous.
In order to test the influence of reference levels in the TPS, the abovementioned five levels are adopted here, and the results are calculated as shown in Figure 4. It is easy to figure out that in the TPS, the utility differences between TFPVs are not so significant.
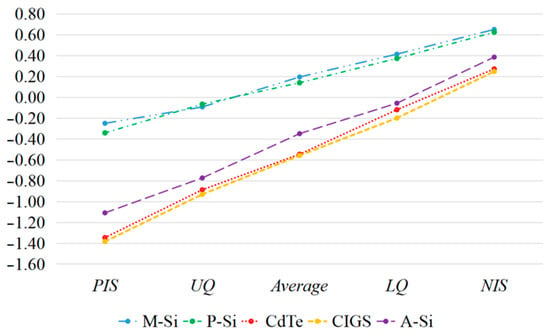
Figure 4.
Sequence of photovoltaic technologies in TPS.
It should be noted that the transmittance of light for TFPVs and CSPVs is fundamentally different in the TPS fields. TFPVs are designed so that the entire PV panel can transmit light, whereas CSPVs typically employ a grid-type form of light transmission. In the TPS, consumers can experience the aesthetic impact both from the exterior and inside the buildings. Some consumers cannot accept the grid type of light transmission due to vision blocking. Therefore, the aesthetic impact may be more significant. Assuming that the subjective weights of other attributes remain unchanged, the weight assigned to aesthetics is orderly set to = {0.25, 0.5, 0.75, 1, 1.25}. As can be seen from Figure 5, the utility values of the three TFPV options are similar, and they increase at the same rate, gradually surpassing CSPVs to become the optimal choices in the TPS.
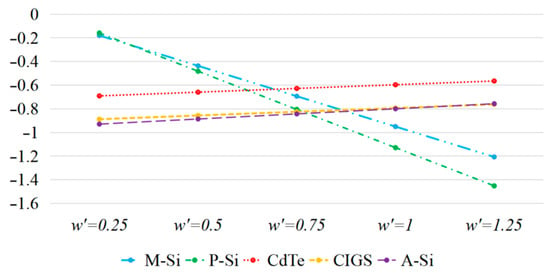
Figure 5.
Effect of aesthetics on PV sequencing in TPS.
4.4. Market Share Division and Integrative Analysis
Taking into account the generally nonlinear distribution of market shares and the existence of an inequality similar to income disparities, this study designs a proportional algorithm according to the Lorenz curve form and calculates the market proportion of the TDS and TPS according to it. Assuming that the total quota coefficient of the TPS is denoted by , then the market share ratio of the TPS is inversely proportional to , i.e., proportional to , where . As shown in Figure 6, the curve of has characteristics similar to the Lorenz curve [65]; i.e., the larger the value of is, the smaller the proportion of the TPS becomes.
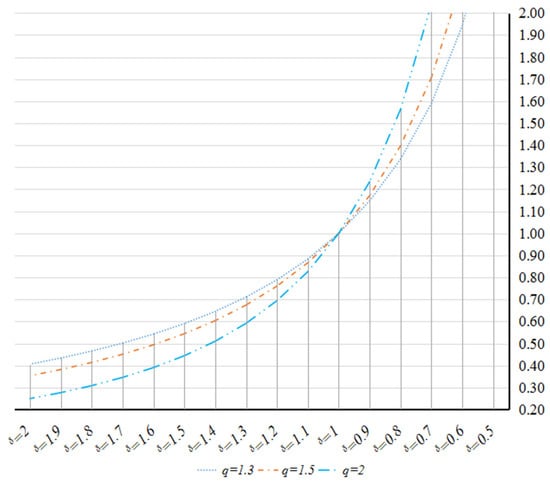
Figure 6.
is similar to the Lorenz curve.
In order to observe the effect of market share in a more efficient way in the range , this study assumes that . Let denote the market share, assuming that the consumers choose the TDS, and the TPS accounts for 50% at the same market price, i.e., when , . Then, when , the market share of the TDS and TPS can be set as and ; that is, with the increase in , increases and decreases. Obviously, . According to the connotation represented by the variation interval, is taken to observe the influence of the market share ratio on PVs.
The reference point is taken as the UQ, the subjective weight of the aesthetics degree of the TDS market is = 0.5, and the subjective weight of the aesthetics degree of the TPS is = 0.5 and = 1.25. As shown in Figure 7, when the subjective weight of aesthetics for the TPS is the same as that for the TDS, the relative advantages of M-Si and P-Si remain in the TPS. However, the relative advantages of CdTe and CIGS in the TPS are not obvious, and they show a decreasing trend. A-Si has comparative advantages in the TPS, so it shows an increasing trend in utilities, but the priorities have not changed.
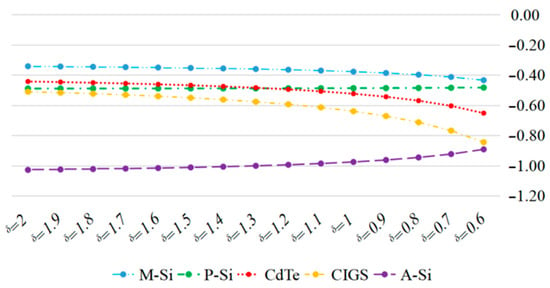
Figure 7.
Influence of market share on utilities and rankings ( = 0.5, = 0.5).
As shown in Figure 8, when the aesthetic weight remains unchanged in the TDS but increases in the TPS, the changing trends of CdTe and CIGS do not alter, yet they have higher priorities. Due to the aesthetic disadvantages of M-Si and P-Si, their utility values and sequence relationship exhibit a decreasing trend. Under this circumstance, CdTe and CIGS emerge as the optimal PV technologies. Meanwhile, A-Si contributes to the rise, gradually surpassing CSPVs in ranking due to its advantages in aesthetics and other aspects.
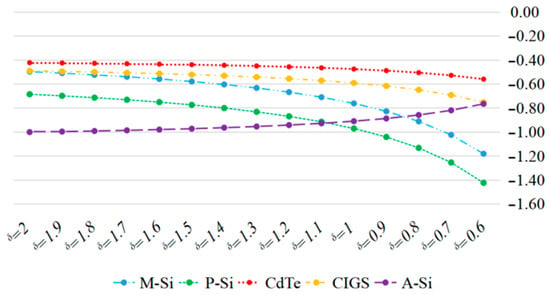
Figure 8.
Influence of market share on utilities and rankings ( = 0.5, = 1.25).
Through systematic evaluation and comprehensive analysis, the advantages and disadvantages of different alternatives are undoubtedly revealed. For consumers adhering to pragmatic values, it is undoubtedly the best choice to opt for CSPVs. However, for consumers who are more concerned about aesthetics, they are more likely to choose alternatives from TFPVs. Considering the advantages and disadvantages of PVs and the relative stability of the technical level, the substitutability of scenarios and product innovations, which can enhance aesthetic appeal and broaden application fields, can play a crucial role in shaping the market landscape.
5. Sensitivity Analysis and Hypothesis Tests
5.1. Sensitivity Analysis of the Risk-Aversion Coefficient
The risk-aversion coefficient () plays a crucial role in shaping risk attitudes, which can significantly influence the ranking of photovoltaic (PV) technologies because different risk attitudes directly influence consumer choices. Supposing , the results are shown in Figure 9. Figure 9a depicts the results in the TDS field, while Figure 9b presents the results in the TPS. The results indicate that as the risk-avoidance coefficient increases, the total utility values decrease continuously, and the lower the relative utility, the faster the rate of decrease.
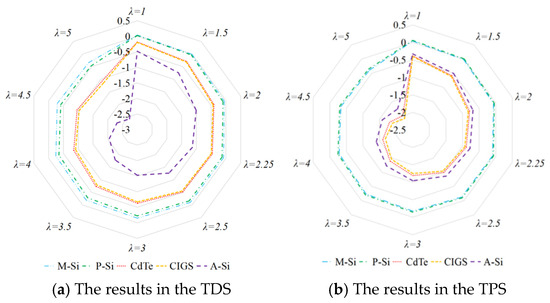
Figure 9.
Ranking change rule of PVs with change in risk attitude.
Although the utility is changing at different rates, the sequence relationship between the alternatives is not changing in the current case. The significance of the effect of is inversely proportional to the magnitude of the difference between the attribute values. That is, more significant differences between two PVs lead to a lower possibility of crossover due to the change in , while the lower the distinction between attribute values, the more likely the crossover will occur.
5.2. Comparison Analysis of Methods
In order to test the robustness of the conclusions and the validity of the CPT method, four different methods are adopted for comparative analysis. Firstly, the TOPSIS method ranks the alternatives by judging closeness to the PIS [51]. Secondly, the CODAS method is a multi-attribute decision-making method that sorts alternatives based on the combination of first-order distance and second-order distance [66]. Thirdly, the VIKOR method addresses the prioritization of alternatives through a compromise of weights and distances from ideal points and follows the reverse sort rule [67]. Fourthly, the simple weighting method (SWM) sorts alternatives by directly calculating the sum of the product of weight and attribute value [42].
To ensure that different methods are compared on the same basis, the weights and attribute values adopted by the four methods are consistent with those mentioned above. Evaluations were conducted separately in traditional markets and transparent markets. Following the calculation rules of different algorithms, the results are presented in Figure 10 and Figure 11. In the TDS market, the sorting results obtained by all algorithms are consistent as > > > > when the default coefficients in different algorithms are taken, and the results of the CODAS algorithm remain robust when the threshold parameter . The VIKOR method is consistent with the other algorithms when the compromise coefficient , while the positions of P-Si and CdTe are alternated when .
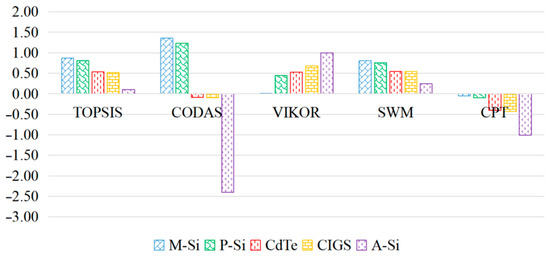
Figure 10.
Comparison results in the TDS.
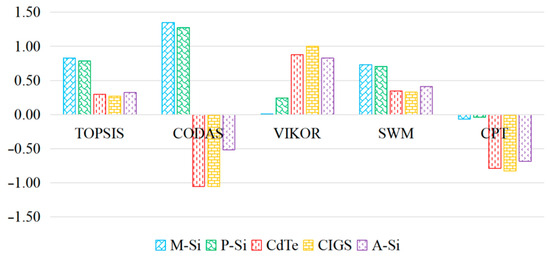
Figure 11.
Comparison results in the TPS.
In the TPS market, the TOPSIS and SWM algorithms obtain the same result as > > > > . When , the result of the CODAS algorithm is > > > > , while when , the result is > > > > ; i.e., the order of CdTe and CIGS has changed. The results of the VIKOR algorithm are the same as CODAS when and and when and . Although the conclusions of the two methods are similar, there are obvious differences between them. CODAS, as a joint distance analysis method, is sensitive to small numerical differences, whereas VIKOR, as a compromise algorithm, is affected by the rationality of weight setting.
The results of the comparative analysis show that the conclusions drawn are robust to a certain extent. Following different ranking rules, the conclusions derived by different methods exhibit some differences. However, these differences tend to arise between two PVs whose utility values and characteristics are similar, such as M-Si and P-Si or CdTe and CIGS. From the theoretical perspective of ranking, the CPT method is the only one that considers consumer psychology in the analysis. From the standpoint of application flexibility, the CPT method can reflect the real market expectation level by adjusting the reference vector. In terms of robustness analysis, the CPT method can produce robust results and provide a more reasonable explanation.
5.3. Comparison of Weight Methods
The differences between different PVs are widespread. No PV technologies can be superior in all attributes, and no one is inferior in all attributes either. Assigning a larger weight to different attributes will enable a PV that dominates in that attribute to obtain higher utility values. In this study, the TOPSIS entropy weight method is adopted to calculate the objective weight. This weight calculation method is based on the relative distribution information of attribute values, which favors attributes with advantages across multiple technologies. The specific characteristics of this method are verified through comparative analysis.
For the objective weight solution of interval number, Wang proposed a maximum deviation method, and Zhang et al. improved this method and extended it to the field of mixed information decision making, which includes interval numbers [27]. This study takes this as an example and compares it with the TOPSIS entropy method. Furthermore, in order to highlight the difference between subjective and objective weights, the subjective weight vector is included in the comparison here. Therefore, the three tools include the TOPSIS entropy weight vector, maximum deviation vector, and subjective weight vector, which are used to calculate the utilities and rankings under different conditions, as shown in Figure 12.
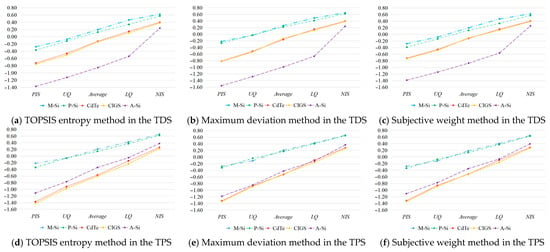
Figure 12.
Comparison results of different weight methods.
Obviously, different weight vectors directly affect the results, especially when comparing two similar technologies. Each method has its own characteristics, and these methods exhibit different advantages and disadvantages in various application scenarios. Just as different periods, buildings, and groups assign different weights to attributes, so do different methods. Apart from the inherent differences between methods, the fluctuation in results can be analyzed from the perspectives of environmental differences and fuzzy decision making. Two technologies with similar characteristics may have different priorities at different times and in different regions, markets, and buildings. In situations where requirements are not very clear, two similar technologies can be considered as equivalent choices without the need for precise differentiation. This is fuzzy decision making, which is more commonly encountered in reality.
In terms of the value range, regardless of whether it is in the TDS or TPS, different weight methods change the range of utility values for different PVs. However, there is generally no significant change in the relative position of these ranges. This may be attributed to three main reasons. First, the results obtained from different weighting methods are not significantly different. Second, the differences in the attributes corresponding to the changed weights are not significant enough. Third, the advantages and disadvantages of different technologies are not mutually exclusive. The first reason is easy to understand. The second reason implies that even if a certain technology has an advantage in a particular aspect, the relative information contained in this attribute from different perspectives may be insufficient, leading to small differences. As for the third reason, it is easy to understand that some technologies excel in multiple attributes, while others may lag behind. Therefore, although the value range may change, the extent of variation under different weighting methods is limited.
5.4. Cost–Profit Space Analysis
The market promotion of PV technology cannot be separated from the analysis of its costs and benefits. The price data adopted in the current study come from an online sales website, and there are three points with a few deficiencies. Firstly, the market quotation changes with the price of raw materials, etc., so it is volatile. Secondly, due to the influence of volatility, the correlation between selling price and cost is weakened. Thirdly, although the data are representative to some extent, they cannot accurately reflect profit. On this basis, this study considers setting the cost of all PVs as a uniform value so as to observe the differences between the utility values. When doing this, the assessed values of different PVs represent their utilities only. These utilities can then be used as reference standards to measure the maximum cost–profit spaces. By setting all costs to be within [0.2, 0.25] at different reference levels in the TDS and TPS, the results shown in Figure 13 can be obtained. Among them, Figure 13a,b represent the technical evaluation results based on the current situation.
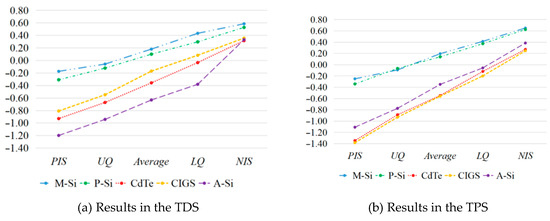
Figure 13.
The priority of the utility value of cost–profit space of different PVTs.
For the status quo, CSPVs have the preferential pricing power owing to their higher utility values. However, their price is not high in the actual market, likely influenced by market competition pressures. The relatively low cost of CSPVs allow market competition to drive down prices. From the perspective of price increase potential, CSPVs have strong market vitality. In contrast, the costs of CdTe and CIGS are higher because they use rare metals in their production, and the extraction of these metals requires more costs. To secure their profit margins, they require higher prices, which reduce their competitiveness in the market. Their existence and development in the market indicate that consumers have a relatively high preference for aesthetics. For A-Si, its pricing power is minimal in the TDS (Figure 13a), but it performs relatively well in the TPS (Figure 13b). Currently priced at a premium, A-Si has underperformed in previous evaluations. Given that the cost of A-Si is lower than those of CdTe and CIGS, it may have a better profit margin. The utility cannot be directly and obviously improved in the short term, so cost control based on management or process improvement and aesthetics improvement based on application expansion or appearance design become the most direct and effective choices for specific enterprises.
6. Conclusions and Discussion
This study conducted a comprehensive analysis of the key attributes of PV systems that consumers focus on in the building sector through questionnaire surveys, and it integrated technical parameters into the calculation of attribute values through financial conversion. In the survey, price was the most important factor, serving as a general technology differentiator, with a value of 4.8766. Its conversion rates followed closely, which had a value of 4.8326. Aesthetics was deemed 3% more significant than government subsidies to PVs consumers, with an importance value of 4.4414. Notably, in the application field of buildings, consumers place a high emphasis on aesthetics, a factor that is often overlooked in other application areas of PV technology. Technical indicators were translated into five professional indicators in the evaluation, including annual average installation cost index, annual procurement cost, annual module efficiency, soiling loss index, and aesthetics. The results showed that CSPV technologies have market advantages in both traditional and transparent scenarios. (M-Si) had the highest utility in traditional scenarios, with a value of −0.0766: > > > > ; (P-Si) had the highest utility in transparent scenarios, with a value of −0.0676: > > > > . However, when aesthetics was fully considered, the advantages of TFPV technologies gradually surpassed those of CSPVs, first in the TPS and then in the TDS. When the two scenarios were combined, the market share of TFPV rose with an increase in the TPS while that of CSPV decreased.
Sensitivity analysis reveals that the utility values of different PV technologies decrease as the risk-aversion coefficient increases, with a faster decline observed at lower utility values. The ranking of different PV technologies does not undergo significant changes with variations in the risk coefficient values, indicating that the cross-variation in attribute utilities is not pronounced under the existing assumptions. Comparative analysis with various multi-attribute decision-making methods shows that the application of CPT to technology ranking not only reflects consumers’ risk attitudes but also demonstrates good robustness and applicability. Through comparative weight analysis methods, the results are robust when obtained using the TOPSIS entropy weight method proposed in this study, highlighting the effectiveness of this method. Meanwhile, weight comparisons reveal that differences in attribute weighting are primarily observed among similar technologies, reflecting consumer fluctuations in choosing between similar technologies. Cost–utility analysis finds that CSPVs have high utility and lower prices, which are the primary reasons for their market dominance. Additionally, the results suggest that CSPVs have strong market competitiveness and potential for price increases, which may limit the market space for new technologies coming in. A-Si exhibits high utility in the transparent PV market, and it provides lower cost compared with the other two technologies, with a higher profit margin.
This study conducts a market assessment of building-integrated photovoltaic (BIPV) technologies from a future perspective, primarily considering the impact on architectural aesthetics and future building styles. Market research indicates that consumers attach great importance to architectural aesthetics, suggesting that aesthetics-based product innovation may become a key direction for future technological advancements. Architectural aesthetics has proven to be a unique variable that evolves with the market and offers substantial room for innovation, especially when technological innovation in other areas encounters bottlenecks. Therefore, some innovations that improve architectural aesthetics can change the competitive landscape. CSPVs have many advantages in most technical attributes but not in aesthetics, especially in TPS fields. High demands for architectural aesthetics widen the cost–profit space, and building-integrated transparent PV modules can replace part of the building materials and offset part of the construction cost, which provides more market opportunities for the development of TFPVs. The ratio of electricity consumption to area affects consumers’ choice, and a high ratio may lead consumers to choose higher efficiencies, rotating modules, or slanted installations [68], which magnify the advantages of CSPVs as these tendencies sacrifice aesthetic requirements. In order to meet high aesthetic requirements, innovations on the product side become the main way for CSPVs to improve their competitive position. The beauty of CSPVs’ appearance can be increased through regular or artistic arrangements. The development of flexible products for CSPVs can also broaden their applications on tiles and other building materials, which improves the artistic level [69].
In addition to aesthetic differences, the window–wall ratio also influences the competition between different application scenarios and PVs. TFPVs have a very strong advantage in TPS fields, and they offer good environmental benefits as a clean way to generate energy [8]. Regarding building design trends, the area occupied by windows will increase as people increasingly prefer open views. In densely populated countries like China, the average roof area and wall area of widely distributed high-rise buildings are becoming increasingly smaller, which further increases the proportion of TPSs [70]. Windows have become one of the key areas of competition, expanding the advantages of TFPVs in the first place, especially in buildings like skyscrapers, museums, airports, or exhibition halls that require large curtain walls. Furthermore, Yu et al. proposed the design of PV shutters to amplify the competitive advantage of CSPVs in response to this situation [6]. Such similar product innovations shift the competition from the TPS to that in the TDS, broadening the application field of CSPVs. Technological innovations benefit all PVs. Advances in cooling technologies, such as the use of phase change materials, enable all PVs to generate more power over a limited area [71]. In addition to mitigating the impact of temperature, the use of thermal energy generated by PVs can also convert the heat into hot water, among other uses, thereby further reducing energy consumption [72]. These comprehensive technological innovations will contribute to the wider adoption of PVs in the building sector, increasing their market share. Ultimately, the success of any PV technology is beneficial for the environment, as PVs produce significantly fewer GHG emissions than fossil fuels [55].
7. Summary and Prospects
This study proposed a new method for assessing market potential and conducted research using five PV technologies as an example. The assessment used three methods, the TOPSIS entropy method, CPT method, and scenario fusion method. This study proposed a preferential weight algorithm in the field of technology evaluation, solved the problem of market segmentation integration, and broadened the application mode and field of CPT, providing important references for similar research. By transforming technical parameters into attributes that consumers care about and using the above methods, this study illustrated the market potential of PVs and their changing tendencies. CSPVs have advantages in both the TPS and TDS scenarios, which is basically consistent with the current market situation and also validates the practicality of this research method. With the increasing window-to-wall ratio and heightened aesthetic demands in the market, the share of transparent PVs, particularly TFPVs, is likely to increase in the future. The pairwise analysis of cost and utility finds that high profits depend on PVs’ utility and on the competition situation. For product competitiveness, this study underscores the impact of architectural aesthetics on PV competition. Future product innovations can find a balance in terms of transmittance and aesthetics to increase market share. All in all, considering the above five dimensions, CSPV will continue to dominate the PVs in the building market with its advantages of cost and efficiency, and TFPV will maintain its own market share with its aesthetic advantages in the future.
Future research can be conducted from the perspectives of method improvement, application area expansion, and application field expansion. In terms of method improvement, considerations can be given to refining the weighting calculation methods, attribute selection, and indicator calculations. It is worthwhile to propose new methods that better reflect attribute differences, construct more comprehensive indicator systems, and validate more rigorous indicator calculations. In terms of market integration methodologies, the method proposed in this study introduces a non-equilibrium distribution function, similar to the Lorenz curve, based on the nonlinear assumption of market changes. While this approach is intuitive, it may not encompass all patterns of market share changes. Future research can develop more scientific and reliable methods or models tailored to the characteristics of specific research cases. In terms of application area expansion, the selection of PV technologies under different building types and revenue expectations can be explored as well as analysis of the impacts of changing aesthetic demands and technological advancements on the market. In terms of application field expansion, the method adopted in this study considers factors such as objective differences, user concerns, risk avoidance, aesthetic changes, and changes in architectural styles, demonstrating innovative value in technology assessment. This study can serve as a reference for assessing the market potential of other technologies in major fields, particularly new technologies that are about to be launched into the market.
Author Contributions
Conceptualization, D.Z.; methodology, D.Z.; software, J.D.; validation, J.D. and J.S.; formal analysis, J.D. and W.L.; investigation, D.Z.; resources, J.D. and W.L.; data curation, J.D. and D.Z.; writing—original draft preparation, J.S., J.D. and D.Z.; writing—review and editing, J.D. and D.Z.; visualization, D.Z.; supervision, W.L.; project administration, W.L. and D.Z.; funding acquisition, D.Z. All authors have read and agreed to the published version of the manuscript.
Funding
This research was funded by the Shandong Provincial Philosophy and Social Sciences Youth Talent Team Project, grant number 2024-QNRC-43.
Institutional Review Board Statement
Not applicable.
Informed Consent Statement
Not applicable.
Data Availability Statement
The research data will be provided on request.
Conflicts of Interest
The authors declare no conflicts of interest.
References
- Johnsson, F.; Kjärstad, J.; Rootzén, J. The threat to climate change mitigation posed by the abundance of fossil fuels. Clim. Policy 2019, 19, 258–274. [Google Scholar] [CrossRef]
- Hobday, A.J.; Burrows, M.T.; Filbee-Dexter, K.; Holbrook, N.J.; Gupta, A.S.; Smale, D.A.; Smith, K.E.; Thomsen, M.S.; Wernberg, T. With the arrival of El Niño, prepare for stronger marine heatwaves. Nature 2023, 621, 38–41. [Google Scholar] [CrossRef] [PubMed]
- Mora, C.; Spirandelli, D.; Franklin, E.C.; Lynham, J.; Kantar, M.B.; Miles, W.; Smith, C.Z.; Freel, K.; Moy, J.; Louis, L.V.; et al. Broad threat to humanity from cumulative climate hazards intensified by greenhouse gas emissions. Nat. Clim. Chang. 2018, 19, 1062–1071. [Google Scholar] [CrossRef]
- Liu, Z.; Zhang, Y.; Yuan, X.; Liu, Y.; Xu, J.; Zhang, S.; He, B.-J. A comprehensive study of feasibility and applicability of building integrated photovoltaic (BIPV) systems in regions with high solar irradiance. J. Clean. Prod. 2021, 307, 127240. [Google Scholar] [CrossRef]
- Kannan, N.; Vakeesan, D. Solar energy for future world: A review. Renew. Sustain. Energy Rev. 2016, 62, 1092–1105. [Google Scholar] [CrossRef]
- Yu, G.; Yang, H.; Luo, D.; Cheng, X.; Ansah, M.K. A review on developments and researches of building integrated photovoltaic (BIPV) windows and shading blinds. Renew. Sustain. Energy Rev. 2021, 149, 111355. [Google Scholar] [CrossRef]
- Xu, K.; Wang, Y.; Li, Z.; Li, X.; Song, H. Voltage optimization control and risk assessment technology for high-proportion distributed photovoltaic access to distribution network. J. Phys. Conf. Ser. 2023, 2488, 012056. [Google Scholar] [CrossRef]
- Su, X.; Zhang, L.; Luo, Y.; Liu, Z. Energy performance of a reversible window integrated with photovoltaic blinds in Harbin. Build. Environ. 2022, 213, 108861. [Google Scholar] [CrossRef]
- Liu, M.; Liu, C.; Xie, H.; Zhao, Z.; Zhu, C.; Lu, Y.; Bu, C. Analysis of the Impact of Photovoltaic Curtain Walls Replacing Glass Curtain Walls on the Whole Life Cycle Carbon Emission of Public Buildings Based on BIM Modeling Study. Energies 2023, 16, 7030. [Google Scholar] [CrossRef]
- Basher, M.K.; Nur-E-Alam, M.; Rahman, M.M.; Alameh, K.; Hinckley, S. Aesthetically Appealing Building Integrated Photovoltaic Systems for Net-Zero Energy Buildings. Current Status, Challenges, and Future Developments—A Review. Buildings 2023, 13, 863. [Google Scholar] [CrossRef]
- Hachem-Vermette, C.; Guarino, F.; La Rocca, V.; Cellura, M. Towards achieving net-zero energy communities: Investigation of design strategies and seasonal solar collection and storage net-zero. Sol. Energy 2019, 192, 169–185. [Google Scholar] [CrossRef]
- Zomer, C.; Custódio, I.; Antoniolli, A.; Rüther, R. Performance assessment of partially shaded building-integrated photovoltaic (BIPV) systems in a positive-energy solar energy laboratory building: Architecture perspectives. Sol. Energy 2020, 211, 879–896. [Google Scholar] [CrossRef]
- Anand, A.; Verayiah, R.A.P.; Mansor, M.; Hasim, T.J.T.; Shukla, A.; Panchal, H.; Sharma, A.; Natrayan, L.; Kumar, A. A comprehensive analysis of small-scale building integrated photovoltaic system for residential buildings: Techno-economic benefits and greenhouse gas mitigation potential. J. Build. Eng. 2024, 82, 108232. [Google Scholar] [CrossRef]
- Yang, R.J.; Zou, P.X.W. Building integrated photovoltaics (BIPV): Costs, benefits, risks, barriers and improvement strategy. Int. J. Constr. Manag. 2015, 16, 39–53. [Google Scholar] [CrossRef]
- Shukla, A.K.; Sudhakar, K.; Baredar, P.; Mamat, R. BIPV in Southeast Asian countries—Opportunities and challenges. Renew. Energy Focus 2017, 21, 25–32. [Google Scholar] [CrossRef]
- Kapsalis, V.; Maduta, C.; Skandalos, N.; D’Agostino, D.; Yang, R.J.; Udayraj; Parker, D.; Karamanis, D. Bottom-up energy transition through rooftop PV upscaling: Remaining issues and emerging upgrades towards NZEBs at different climatic conditions. Renew. Sustain. Energy Transit. 2024, 5, 100083. [Google Scholar] [CrossRef]
- Tabakovic, M.; Fechner, H.; van Sark, W.; Louwen, A.; Georghiou, G.; Makrides, G.; Loucaidou, E.; Ioannidou, M.; Weiss, I.; Arancon, S.; et al. Status and outlook for building integrated photovoltaics (BIPV) in relation to educational needs in the BIPV sector. Energy Procedia 2017, 111, 993–999. [Google Scholar] [CrossRef]
- Celadyn, W.; Filipek, P. Investigation of the Effective Use of Photovoltaic Modules in Architecture. Buildings 2020, 10, 145. [Google Scholar] [CrossRef]
- Bonomo, P.; Frontini, F. Building Integrated Photovoltaics (BIPV): Analysis of the Technological Transfer Process and Innovation Dynamics in the Swiss Building Sector. Buildings 2024, 14, 1510. [Google Scholar] [CrossRef]
- Akinoglu, B.G.; Tuncel, B.; Badescu, V. Beyond 3rd generation solar cells and the full spectrum project. Recent advances and new emerging solar cells. Sustain. Energy Technol. Assess. 2021, 46, 101287. [Google Scholar] [CrossRef]
- Sarkar, D.; Kumar, A.; Sadhu, P.K. A Survey on Development and Recent Trends of Renewable Energy Generation from BIPV Systems. IETE Tech. Rev. 2019, 37, 258–280. [Google Scholar] [CrossRef]
- Wu, Y.; Xu, C.; Zhang, T. Evaluation of renewable power sources using a fuzzy MCDM based on cumulative prospect theory: A case in China. Energy 2018, 147, 1227–1239. [Google Scholar] [CrossRef]
- Cheng, J.; Feng, Y.; Lin, Z.; Liu, Z.; Tan, J. Anti-vibration optimization of the key components in a turbo-generator based on heterogeneous axiomatic design. J. Clean. Prod. 2017, 171, 1467–1477. [Google Scholar] [CrossRef]
- Kothiyal, A.; Spinu, V.; Wakker, P.P. An experimental test of prospect theory for predicting choice under ambiguity. J. Risk Uncertain. 2014, 48, 1–17. [Google Scholar] [CrossRef]
- Kahneman, D.; Tversky, A. Prospect theory: An analysis of decision under risk. J. Econom. 1979, 47, 263–291. [Google Scholar] [CrossRef]
- Ying, C.-S.; Li, Y.-L.; Chin, K.-S.; Yang, H.-T.; Xu, J. A new product development concept selection approach based on cumulative prospect theory and hybrid-information MADM. Comput. Ind. Eng. 2018, 122, 251–261. [Google Scholar] [CrossRef]
- Zhang, D.; Li, Y.; Chin, K.-S. Photovoltaic technology assessment based on cumulative prospect theory and hybrid information from sustainable perspective. Sustain. Energy Technol. Assess. 2022, 52, 102116. [Google Scholar] [CrossRef]
- Shukla, A.K.; Sudhakar, K.; Baredar, P. Exergetic assessment of BIPV module using parametric and photonic energy methods: A review. Energy Build. 2016, 119, 62–73. [Google Scholar] [CrossRef]
- Biyik, E.; Araz, M.; Hepbasli, A.; Shahrestani, M.; Yao, R.; Shao, L.; Essah, E.; Oliveira, A.C.; del Caño, T.; Rico, E.; et al. A key review of building integrated photovoltaic (BIPV) systems. Eng. Sci. Technol. 2017, 20, 833–858. [Google Scholar] [CrossRef]
- Shafique, M.; Luo, X.; Zuo, J. Photovoltaic-green roofs: A review of benefits, limitations, and trends. Sol. Energy 2020, 202, 485–497. [Google Scholar] [CrossRef]
- Pelle, M.; Lucchi, E.; Maturi, L.; Astigarraga, A.; Causone, F. Coloured BIPV Technologies: Methodological and Experimental Assessment for Architecturally Sensitive Areas. Energies 2020, 13, 4506. [Google Scholar] [CrossRef]
- Xu, L.; Ji, J.; Luo, K.; Li, Z.; Xu, R.; Huang, S. Annual analysis of a multi-functional BIPV solar wall system in typical cities of China. Energy 2020, 197, 117098. [Google Scholar] [CrossRef]
- Wang, H.; Lin, C.; Hu, Y.; Zhang, X.; Han, J.; Cheng, Y. Study on indoor adaptive thermal comfort evaluation method for buildings integrated with semi-transparent photovoltaic window. Build. Environ. 2023, 228, 109834. [Google Scholar] [CrossRef]
- Sun, C.; Lu, Y.; Ju, X. Experimental and numerical study to optimize building integrated photovoltaic (BIPV) roof structure. Energy Build. 2024, 309, 114070. [Google Scholar] [CrossRef]
- Azami, A.; Sevinç, H. The Energy Performance of Building Integrated Photovoltaics (BIPV) by Determination of Optimal Building Envelope. Build. Environ. 2021, 199, 107856. [Google Scholar] [CrossRef]
- Cibi, M.R.; Manikandan, S. Concise overview of BIPV systems and its future scope. IOP Conf. Ser. Mater. Sci. Eng. 2021, 1130, 012033. [Google Scholar] [CrossRef]
- Van de Kaa, G.; Rezaei, J.; Kamp, L.; de Winter, A. Photovoltaic technology selection: A fuzzy MCDM approach. Renew. Sustain. Energy Rev. 2014, 32, 662–670. [Google Scholar] [CrossRef]
- Muhammad, S.; Mahmood, T.; Choudhry, M.A. Photovoltaic technology selection using analytical hierarchical process. J. Sol. Energy 2015, 137, 021018. [Google Scholar] [CrossRef]
- Long, S.; Geng, S. Decision framework of photovoltaic module selection under interval-valued intuitionistic fuzzy environment. Energy Convers. Manag. 2015, 106, 1242–1250. [Google Scholar] [CrossRef]
- Zdyb, A.; Gulkowski, S. Performance assessment of four different photovoltaic technologies in Poland. Energies 2020, 13, 196. [Google Scholar] [CrossRef]
- Fang, H.; Wang, X.; Song, W.Y. Technology selection for photovoltaic cell from sustainability perspective: An integrated approach. Renew. Energy 2020, 153, 1029–1041. [Google Scholar] [CrossRef]
- Zhang, X. New interval-valued intuitionistic fuzzy behavioral MADM method and its application in the selection of photovoltaic cells. Energies 2016, 9, 835. [Google Scholar] [CrossRef]
- Bahou, S. Techno-economic assessment of a hydrogen refuelling station powered by an on-grid photovoltaic solar system: A case study in Morocco. Int. J. Hydrogen Energy 2023, 48, 23363–23372. [Google Scholar] [CrossRef]
- Anoune, K.; Ghazi, M.; Bouya, M.; Laknizi, A.; Ghazouani, M.; Ben Abdellah, A.; Astito, A. Optimization and techno-economic analysis of photovoltaic-wind-battery based hybrid system. J. Energy Storage 2020, 32, 101878. [Google Scholar] [CrossRef]
- Ali, M.B.; Kazmi, S.A.A.; Altamimi, A.; Khan, Z.A.; Alghassab, M.A. Decarbonizing Telecommunication Sector: Techno-Economic Assessment and Optimization of PV Integration in Base Transceiver Stations in Telecom Sector Spreading across Various Geographically Regions. Energies 2023, 16, 3800. [Google Scholar] [CrossRef]
- Peng, C.; Huang, Y.; Wu, Z. Building-integrated photovoltaics (BIPV) in architectural design in China. Energy Build. 2011, 43, 3592–3598. [Google Scholar] [CrossRef]
- Zhang, T.; Wang, M.; Yang, H. A Review of the Energy Performance and Life-Cycle Assessment of Building-Integrated Photovoltaic (BIPV) Systems. Energies 2018, 11, 3157. [Google Scholar] [CrossRef]
- Singh, D.; Chaudhary, R.; Karthick, A.; Patil, P.P.; Kaliappan, S. Economic and life cycle cost analysis of building-integrated photovoltaic system for composite climatic conditions. Environ. Sci. Pollut. Res. 2024, 31, 13392–13413. [Google Scholar] [CrossRef]
- Tversky, A.; Kahneman, D. Advances in prospect theory: Cumulative representation of uncertainty. J. Risk Uncertain. 1992, 5, 297–323. [Google Scholar] [CrossRef]
- Li, Y.-L.; Ying, C.-S.; Chin, K.-S.; Yang, H.-T.; Xu, J. Third-party reverse logistics provider selection approach based on hybrid-information MCDM and cumulative prospect theory. J. Clean. Prod. 2018, 195, 573–584. [Google Scholar] [CrossRef]
- Hwang, C.L.; Yoon, K. Multiple Attribute Decision Making: Methods and Applications; Springer: New York, NY, USA, 1981. [Google Scholar] [CrossRef]
- Shannon, C.E. A mathematical theory of communication. Bell Syst. Tech. J. 1948, 27, 379–423. [Google Scholar] [CrossRef]
- Zhang, D.; Li, Y.; Li, Y.; Shen, Z. Service Failure Risk Assessment and Service Improvement of Self-Service Electric Vehicle. Sustainability 2022, 14, 3723. [Google Scholar] [CrossRef]
- Nascimento, L.R.; Braga, M.; Campos, R.A.; Naspolini, H.F.; Rüther, R. Performance assessment of solar photovoltaic technologies under different climatic conditions in Brazil. Renew. Energy 2020, 146, 1070–1082. [Google Scholar] [CrossRef]
- Ludin, N.A.; Mustafa, N.I.; Hanafiah, M.M.; Ibrahim, M.A.; Teridi, M.A.M.; Sepeai, S.; Zaharim, A.; Sopian, K. Prospects of life cycle assessment of renewable energy from solar photovoltaic technologies: A review. Renew. Sust. Energy Rev. 2018, 96, 11–28. [Google Scholar] [CrossRef]
- Kong, H.; Yu, Z.; Zhang, J.; Han, Y.; Wu, L.; Wang, H.; Wang, J. Perspective of CIGS-BIPV’s Product Competitiveness in China. Int. J. Photoenergy 2020, 2020, 5392594. [Google Scholar] [CrossRef]
- Jordan, D.C.; Kurtz, S.R. Photovoltaic Degradation Rates—An Analytical Review. Prog. Photovolt. Res. Appl. 2013, 21, 12–29. [Google Scholar] [CrossRef]
- Tian, X.; Wang, J.; Ji, J.; Wang, C.; Ke, W.; Yuan, S. A multifunctional curved CIGS photovoltaic/thermal roof system: A numerical and experimental investigation. Energy 2023, 273, 127259. [Google Scholar] [CrossRef]
- Elnosh, A.; Al-Ali, H.O.; John, J.J.; Alnuaimi, A.; Ubinas, E.R.; Stefancich, M.; Banda, P. Field study of factors influencing performance of PV modules in buildings (BIPV/BAPV) installed in UAE. In Proceedings of the 2018 IEEE 7th World Conference on Photovoltaic Energy Conversion, Waikoloa, HI, USA, 10–15 June 2018; pp. 565–568. Available online: https://ieeexplore.ieee.org/abstract/document/8547298/ (accessed on 1 June 2024).
- Fan, Z.; Yang, Z.; Yang, L. Daylight performance assessment of atrium skylight with integrated semi-transparent photovoltaic for different climate zones in China. Build. Environ. 2021, 190, 107299. [Google Scholar] [CrossRef]
- Wu, Y.; Li, S.; Gao, X.; Fan, H. Daylighting Performance of CdTe Semi-Transparent Photovoltaic Skylights with Different Shapes for University Gymnasium Buildings. Buildings 2024, 14, 241. [Google Scholar] [CrossRef]
- Barman, S.; Chowdhury, A.; Mathur, S.; Mathur, J. Assessment of the efficiency of window integrated CdTe based semi-transparent photovoltaic module. Sustain. Cities Soc. 2018, 37, 250–262. [Google Scholar] [CrossRef]
- Lee, K.; Kim, N.; Kim, K.; Um, H.-D.; Jin, W.; Choi, D.; Park, J.; Park, K.J.; Lee, S.; Seo, K. Neutral-Colored Transparent Crystalline Silicon Photovoltaics. Joule 2020, 4, 235–246. [Google Scholar] [CrossRef]
- Block, A.B.; Palou, J.E.; Faes, A.; Virtuani, A.; Ballif, C. Accurate color characterization of solar photovoltaic modules for building integration. Sol. Energy 2024, 267, 112227. [Google Scholar] [CrossRef]
- Gastwirth, J.L. The Estimation of the Lorenz Curve and Gini Index. Rev. Econ. Stat. 1972, 54, 306–316. [Google Scholar] [CrossRef]
- Ecer, F.; Pamucar, D.; Mardani, A.; Alrasheedi, M. Assessment of renewable energy resources using new interval rough number extension of the level based weight assessment and combinative distance-based assessment. Renew. Energy 2021, 170, 1156–1177. [Google Scholar] [CrossRef]
- Nsafon, B.E.K.; Butu, H.M.; Owolabi, A.B.; Roh, J.W.; Suh, D.; Huh, J.-S. Integrating multi-criteria analysis with PDCA cycle for sustainable energy planning in Africa: Application to hybrid mini-grid system in Cameroon. Sustain. Energy Technol. Assess. 2020, 37, 100628. [Google Scholar] [CrossRef]
- Cerón, I.; Caamaño-Martín, E.; Neila, F.J. ‘State-of-the-art’ of building integrated photovoltaic products. Renew. Energy 2013, 58, 127–133. [Google Scholar] [CrossRef]
- Shukla, A.K.; Sudhakar, K.; Baredar, P. A comprehensive review on design of building integrated photovoltaic system. Energy Build. 2016, 128, 99–110. [Google Scholar] [CrossRef]
- Chen, L.; Sun, Y.; Zhang, N.; Yang, J.; Wang, D. Quantifying the benefits of BIPV windows in urban environment under climate change: A comparison of three Chinese cities. Renew. Energy 2024, 221, 119740. [Google Scholar] [CrossRef]
- Shakibi, H.; Afzal, S.; Shokri, A.; Sobhani, B. Utilization of a phase change material with metal foam for the performance improvement of the photovoltaic cells. J. Energy Storage 2022, 51, 104466. [Google Scholar] [CrossRef]
- Yang, T.; Athienitis, A. A review of research and developments of building-integrated photovoltaic-thermal (BIPVT) systems. Renew. Sustain. Energy Rev. 2016, 66, 886–912. [Google Scholar] [CrossRef]
Disclaimer/Publisher’s Note: The statements, opinions and data contained in all publications are solely those of the individual author(s) and contributor(s) and not of MDPI and/or the editor(s). MDPI and/or the editor(s) disclaim responsibility for any injury to people or property resulting from any ideas, methods, instructions or products referred to in the content. |
© 2025 by the authors. Licensee MDPI, Basel, Switzerland. This article is an open access article distributed under the terms and conditions of the Creative Commons Attribution (CC BY) license (https://creativecommons.org/licenses/by/4.0/).