Abstract
The increasing frequency and severity of extreme natural events, along with their escalating impacts, highlight the urgent need for robust tools to assess and strengthen national capacities for disaster preparedness and recovery. In this context, this paper introduces one of these tools, called the Recovery Gap Index (RGI), a comprehensive composite index designed to quantify and evaluate the post-extreme natural event response and recovery capabilities at the country level. The tool addresses the need for a systematic approach to quantify resilience and evaluate the impacts of consecutive events on vulnerable areas. The RGI synthesizes data from three well-established indices: the World Risk Index, INFORM, and Global Infrastructure Risk Model and Index (GIRI), covering critical dimensions related to sociodemographic factors, infrastructure, governance, technology, and economic resilience. By extracting key parameters from these diverse indices and aggregating them, the RGI provides a detailed assessment of each nation’s ability to manage the aftermath of extreme natural events. The index findings reveal significant regional disparities in recovery capacities, with European countries exhibiting stronger resilience, whereas many African and Asian nations face substantial challenges. Furthermore, this study proposes several potential future enhancements, such as the incorporation of early warning systems and insurance coverage metrics, aimed at improving its accuracy and practical application. The RGI aims to be a valuable tool for policymakers, disaster management professionals, and stakeholders, enabling them to make informed decisions and implement targeted interventions to further enhance global disaster resilience.
1. Introduction
Extreme natural events have become a pressing global issue, exerting significant impacts on human life, infrastructure, and economic stability [1]. Over recent decades, these events have increased in both frequency and magnitude, as documented by numerous reports and studies [2,3]. The primary driver behind this escalation is climate change, which manifests differently across the globe. Rising global temperatures contribute to more frequent and severe flooding [4], shorter intervals between intense rainfall events, and more extreme climatic conditions conducive to high-impact phenomena like hurricanes [5,6]. Human actions also have a significant influence on the impacts of extreme natural events, particularly through intensified urbanization and construction in high-risk areas [7]. Such growths increase vulnerability and lead to more severe consequences [8]. In the context of this study, recovery refers to the processes and capacities required to restore critical systems, services, and livelihoods following extreme natural events. This encompasses immediate stabilization efforts, medium-term rebuilding activities, and long-term improvements aimed at reducing future vulnerabilities.
The increased frequency of extreme natural events has caused the compounded and consecutive effects of these events to become a focal point in scientific conversations [9,10,11]. This topic has acquired interest not only from academia but also from investors and insurance companies looking to recognize and mitigate these risks [1,12]. Researchers aim to understand the cumulative impacts of extreme natural events in different regions, assessing how these events interact over time. For instance, the 2011 earthquake and subsequent tsunami in Japan illustrate the direct relationship between the two hazards [13]. Similarly, the back-to-back impacts of Hurricanes Maria and Irma in 2017 in Puerto Rico, followed by an earthquake a year and a half later, highlight the significance of studying such phenomena [14]. Recent studies have focused on identifying global hotspots where extreme events occur in rapid succession [15,16]. These studies aim to prioritize regions for mitigation and risk management efforts [17].
Despite these advances, there remains a notable gap in the comprehensive evaluation of post-event phases. In this context, the scientific community has increasingly focused on studying the relationships between the impacts of consecutive events over time, often emphasizing the role of vulnerability [18,19,20]. However, there has been less attention paid to the quantitative analysis of the post-event recovery phase. Resilience is defined as a system’s ability to anticipate, absorb, adapt to, and recover from adverse events, encompassing not only the recovery process but also pre-event preparedness and long-term adaptive capacities [21,22]. Quantifying resilience and understanding the cumulative impacts of consecutive natural events are essential for capturing the broader picture of risk and vulnerability dynamics. This study is part of a larger effort to address these challenges by developing methodologies that assess the complex interactions between multiple hazards over time and the recovery [23]. The Recovery Gap Index (RGI) is intentionally designed to provide a flexible framework that can be applied across a wide range of natural hazards and their cascading effects [24]. By adopting a broad, multi-hazard perspective, the RGI allows for the evaluation of recovery capacities at a national scale, offering insights that are not restricted to a single extreme natural hazard but are instead transferable across diverse contexts. This aspect is crucial because a comprehensive evaluation of post-event phases helps to reveal how consecutive hazards interact and influence each other over time. Accurately measuring these dynamics provides critical insights into a nation’s ability to respond and recover, which is essential for effective risk assessment and management [25,26]. This necessitates a comprehensive approach that goes beyond assessing the immediate impacts of these events to include a range of economic, organizational, social, demographic, technological, infrastructural, and governmental factors [27].
It is important to clarify the relationship between recovery and resilience in the context of this study. While recovery focuses specifically on the post-event phases, stabilizing and restoring a system to functionality or improved conditions, resilience provides a broader perspective. Resilience encompasses the ability to prepare for disasters, absorb shocks, recover effectively, and adapt to future challenges [28]. The Recovery Gap Index (RGI) targets the recovery dimension within the resilience framework, providing insights into the specific capacities required for effective response and restoration following extreme natural events. By focusing on recovery, the RGI complements broader resilience assessments, enabling a more detailed understanding of post-event processes.
In the current scientific landscape, few recognized and operationally employed indices consider a wide range of interdisciplinary parameters necessary to thoroughly study the impacts of various hazards across different nations. Among these, the most widely used is the INFORM Index [29], while more recently developed indices include the Global Infrastructure Risk Model and Index (GIRI) [30] and the World Risk Index [31]. These indices primarily focus on assessing risk through its core components, namely hazard, vulnerability, and exposure, providing a broad analysis of overall risk levels. However, recovery and response capacities, critical to understanding post-event dynamics, remain underexplored within these frameworks. The Recovery Gap Index (RGI) addresses this gap by consolidating relevant parameters from these indices to create a targeted assessment tool. By focusing specifically on national recovery and response capacities, the RGI provides a clear and precise evaluation of strengths and weaknesses, offering valuable insights for disaster management professionals and policymakers [32].
The RGI’s relevance lies in its ability to highlight critical aspects of resilience, such as socioeconomic, infrastructural, governance, and technological dimensions, that influence recovery after extreme events. Unlike existing indices, which often provide generalized evaluations, the RGI translates these assessments into actionable recommendations, allowing countries to address systemic vulnerabilities more effectively [33]. For instance, RGI outputs can help prioritize investments in key areas such as healthcare systems and infrastructure upgrades, directly enhancing preparedness and recovery capabilities. This specificity also benefits stakeholders such as investors and insurance companies, enabling them to better assess risks associated with recovery efforts and efficiently allocate resources [11,34].
Furthermore, the RGI extends its utility to the analysis of multi-hazard events and their cascading impacts. By providing an estimate of the time required to complete response and recovery phases, it offers a valuable framework for understanding interactions between consecutive hazards [23,35]. These interactions often exacerbate losses, particularly in regions with limited recovery capacities due to weak governance, underdeveloped infrastructure, or constrained economic resources. Incorporating these insights, the RGI supports more comprehensive multi-hazard risk assessments and guides the development of resilience strategies tailored to varying national contexts [23,29].
This article is structured to introduce and define the Recovery Gap Index. Section 2 reviews existing literature on various published indices, examining their management of post-extreme event phases and identifying gaps that underscore the need for a composite index focused on recovery. By addressing recovery as a specific dimension of resilience, the RGI bridges gaps in existing frameworks and provides actionable insights into post-event recovery dynamics. Section 3 details the methodology used to construct the RGI, including data collection, indicator selection, and the analytical tools employed for the analysis. Section 4 discusses the results, providing both graphical and tabular representations of the RGI across different regions and countries. Section 5 concludes the article, summarizing key findings, offering formal recommendations for policymakers, and suggesting directions for future research.
2. Existing Indices for Risk Assessment and Management
Building on the need for comprehensive disaster risk management, this chapter delves into existing indices that have been developed to evaluate different dimensions of vulnerability, exposure, and recovery capacity. While Section 1 introduced the concept and necessity of assessing post-event recovery capacities, this chapter provides an in-depth analysis of three of the most widely used indices in global risk assessment and management: the INFORM Index, the World Risk Index, and GIRI. These indices are critical tools in understanding how different regions can withstand, respond to, and recover from extreme natural events. By examining their methodologies, objectives, and constraints, we highlight the need for a complementary tool that specifically addresses challenges related to the recovery phase. The Recovery Gap Index (RGI) seeks to fill this gap by providing a more focused and measurable assessment of recovery dynamics, offering a clearer understanding of how regions can strengthen their recovery capacities, which are a critical component of broader resilience efforts, following consecutive disasters.
2.1. INFORM Index
The INFORM Index (Index for Risk Management) is an open-source tool developed by the Joint Research Centre (JRC) of the European Commission. It is designed to support disaster risk reduction and humanitarian action by providing a comprehensive assessment of humanitarian crises and disasters. The INFORM Index integrates multiple dimensions of risk, including hazard and exposure, vulnerability, and lack of coping capacity, to deliver a nuanced understanding of risk levels across different regions [36,37]. The INFORM Index employs a multifaceted approach to risk assessment by integrating data from diverse sources, including international organizations, national statistics, and scientific research. The index is structured around three primary dimensions:
- Hazard and exposure: This dimension evaluates the probability and impact of various natural and human-made hazards, including earthquakes, floods, tropical cyclones, droughts, epidemics, and conflicts. Using historical data, the INFORM Index assesses the frequency, intensity, and distribution of these events over time, providing a clear picture of the baseline risks faced by populations and infrastructure. This approach helps identify regions that are recurrently affected and more vulnerable, supporting more effective risk management and mitigation strategies.
- Vulnerability: This dimension assesses socioeconomic factors that affect a population’s susceptibility. It includes indicators such as poverty rates, access to healthcare, literacy rates, malnutrition, and population density. These factors help in evaluating how different communities might be differentially impacted by the same hazard, providing insights into the underlying vulnerabilities that exacerbate the impacts of disasters.
- Lack of coping capacity: This dimension examines the ability of governance structures and infrastructure to manage and mitigate the effects of disasters. It includes indicators like governance effectiveness, infrastructure quality, emergency response capabilities, and logistical capacity. This dimension evaluates the readiness and resilience of a region to respond to and recover from disasters.
The INFORM Index covers 191 countries and uses 80 different indicators to calculate the risk score, providing a comprehensive and comparative assessment of risk across the globe. The index uses a weighted formula to combine these indicators into a single risk score, allowing for a standardized comparison between different regions [26].
The primary objective of the INFORM Index is to support the prioritization of disaster risk reduction and humanitarian interventions by identifying regions most at risk and in need of support. For instance, the INFORM Index has been utilized to assess disaster risk in coastal districts of Bangladesh, providing critical insights that guide resource allocation and disaster preparedness efforts [38]. Similarly, it has been applied to analyze humanitarian crises and disaster risk exposure across various regions, aiding in the development of targeted interventions. The 2024 update of the INFORM Index includes enhanced models for sudden-onset hazards and incorporates population dynamics to improve the quality of risk analysis [39]. The index provides a standardized framework for risk assessment, enabling more effective allocation of resources and better-informed decision-making in disaster risk management [40].
2.2. World Risk Index
The World Risk Index, developed by the United Nations University Institute for Environment and Human Security (UNU-EHS) and the Alliance Development Works/Bündnis Entwicklung Hilft, assesses disaster risk by examining the interplay between exposure to natural hazards and the vulnerability of societies [29]. This index provides a comprehensive view of disaster risk by integrating both physical and societal factors that influence vulnerability.
The World Risk Index’s methodology involves calculating risk based on four key components:
- Exposure: This component measures the likelihood of a region being affected by natural hazards such as earthquakes, storms, floods, and sea-level rise. It uses historical data to evaluate the frequency, severity, and geographical spread of these hazards over time. Indicators include the number of recorded events and their intensity, giving a clear picture of the areas most frequently impacted. This historical approach helps to understand not only current risk levels but also the potential for future events.
- Susceptibility This component evaluates conditions that increase the likelihood of suffering harm from a hazard. Indicators include economic status, food security, public infrastructure, housing conditions, and the prevalence of diseases. Susceptibility reflects the intrinsic vulnerability of a society to various hazards and provides insights into the potential impacts on human health and well-being.
- Coping capacities: This component assesses the ability of societies to respond effectively to disasters. It includes governance quality, disaster preparedness, healthcare systems, and access to clean water and sanitation. Coping capacities measure the immediate response potential of a society when a disaster strikes, highlighting strengths and weaknesses in disaster management infrastructure.
- Adaptive capacities: This component focuses on long-term strategies to mitigate future risks. Indicators include education levels, investment in research, sustainable development initiatives, and environmental protection measures. Adaptive capacities evaluate a society’s ability to adapt and transform in the face of evolving risk landscapes, emphasizing the importance of resilience and sustainability in disaster risk reduction.
The World Risk Index covers 193 countries and uses 100 indicators to calculate the risk score with the primary objective of raising awareness of the complex interactions between natural hazards and societal vulnerabilities [41]. It aims to inform policymakers and practitioners about where interventions are most needed to reduce risk and build resilience [42]. By integrating socioeconomic factors with hazard exposure data, the index provides a nuanced understanding of where and why certain regions are at greater risk, facilitating targeted risk reduction strategies [43,44]. The index is a valuable tool for comprehending the multifaceted nature of disaster risk, guiding decision-makers in prioritizing resources effectively [45].
2.3. GIRI
GIRI (Global Infrastructure Risk Index) evaluates the capacity of countries to absorb, respond to, and recover from extreme natural events. Developed by the Global Facility for Disaster Reduction and Recovery (GFDRR), GIRI focuses on infrastructure and resource availability, which are critical for effective disaster management [46].
GIRI uses a fully probabilistic model to estimate the risks associated with major hazards such as earthquakes, tsunamis, tropical cyclones, and floods. This approach involves calculating the likelihood and potential impact of these hazards by analyzing a wide range of data. The index assesses risk through three key dimensions, which together provide a comprehensive view of the threats faced by different regions:
- Capacity to absorb: This dimension measures the robustness of existing infrastructure and sociodemographic factors affecting resilience. Indicators include the quality of buildings, roads, and other critical infrastructure, as well as population distribution and density. These factors determine how well a region can withstand the initial impact of a disaster. The index also considers historical data on infrastructure performance during past disasters to enhance the predictive accuracy of the model.
- Capacity to respond: This dimension evaluates the availability and effectiveness of emergency services, governance structures, and technological resources. Indicators include the presence of emergency response teams, communication systems, and comprehensive disaster management plans. These elements are crucial for an immediate and effective response to disasters. The index assesses the integration of advanced technologies such as early warning systems and remote sensing in disaster response strategies.
- Capacity to recover: This dimension assesses long-term recovery potential by examining economic stability, investment in infrastructure, and social support systems. Indicators include GDP per capita, investment levels in public infrastructure, social capital, and access to financial resources for reconstruction. These factors influence how quickly and effectively a region can rebuild and recover following a disaster. The index incorporates scenario analysis to evaluate the impact of different recovery strategies and investment priorities on long-term resilience.
GIRI covers 169 countries and uses 18 indicators to calculate the risk score. The index employs a probabilistic approach, which involves simulating a wide range of possible disaster scenarios to estimate potential losses and recovery times [47]. The primary objective of GIRI is to offer a detailed assessment of infrastructure-related risks and capacities, enabling stakeholders to identify weaknesses and prioritize investments in resilience-building measures [48]. GIRI uses comprehensive sets of simulated events to account for all possible manifestations of each hazard, integrating climate change scenarios to provide a granular understanding of potential future losses.
2.4. Limitations of Existing Indices and Need for the Recovery Gap Index
While the INFORM Index and World Risk Index provide valuable insights into disaster risk and preparedness, their primary focus is on assessing risk and vulnerability before an event occurs, rather than evaluating the response and recovery phases that follow a disaster. In contrast, GIRI incorporates aspects of these post-event phases, making it more aligned with our objective of assessing recovery capacity after consecutive disasters. However, even GIRI does not fully capture the complexity of recovery processes over time. Moreover, these indices treat critical dimensions of recovery, such as governance, sociodemographic factors, and technological capacity, in a fragmented manner, without integrating them into a unified framework that explicitly targets post-event recovery.
Our proposed Recovery Gap Index (RGI) complements these existing tools by providing a detailed and quantitative evaluation of recovery dynamics, offering a clearer perspective on how different regions can strengthen their resilience and reduce vulnerability in the aftermath of multiple hazards. This synthesis addresses the fragmentation observed in existing indices, ensuring that relevant indicators are not only considered but also systematically combined to offer a more holistic view of recovery capacities.
The INFORM Index is comprehensive in its assessment of risk and vulnerability [49]. Its primary strength lies in identifying areas most at risk and requiring immediate humanitarian intervention. However, its scope is limited to hazard, vulnerability, and coping capacities, leaving post-disaster recovery largely unexplored. Similarly, the World Risk Index offers a robust framework for understanding societal vulnerabilities and adaptive capacities, yet it falls short in evaluating the effectiveness and speed of recovery processes following a disaster [50]. GIRI, with its focus on infrastructure and probabilistic risk assessment, provides valuable insights into the potential impacts of natural hazards on critical infrastructure. However, it focuses primarily on physical infrastructure while neglecting broader socioeconomic factors, such as governance quality, economic resilience, and social cohesion, which are critical for post-event recovery [51].
The Recovery Gap Index (RGI) is designed to provide a more detailed analysis of post-event recovery capacities, offering a quantitative measure that can be applied within a comprehensive framework for disaster risk management and resilience building. By integrating the strengths of these indices and addressing their gaps, the RGI provides a novel tool that explicitly focuses on recovery dimensions, including sociodemographic, infrastructural, technological, and economic factors. The RGI integrates a wide range of factors, including economic, organizational, social, demographic, technological, infrastructural, and governmental aspects, to deliver a holistic evaluation of a nation’s ability to recover from extreme natural events. By quantifying these diverse dimensions, the RGI aims to assess the overall effectiveness of the recovery process, pinpointing specific areas that require attention and providing actionable insights to guide targeted interventions and improve resilience.
By addressing the challenges associated with describing and quantifying post-event response and recovery processes, the RGI aims to provide a more comprehensive understanding of these dynamics, both in the context of a single event and when two consecutive events occur. In contrast to existing indices, the RGI ensures that critical recovery indicators are not overlooked or dispersed but are instead consolidated into a single, actionable framework. This approach supports the development of targeted interventions to build resilience. To provide a clear overview of the information and characteristics of each index discussed, the following scheme (Figure 1) summarizes the key aspects of the INFORM Index, World Risk Index, and GIRI.
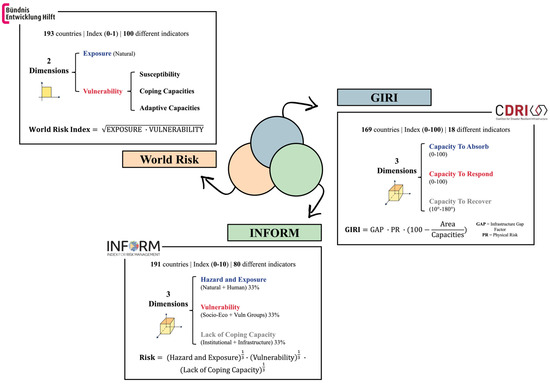
Figure 1.
Overview of existing indices and methodologies. This figure compares three global risk indices: INFORM, World Risk Index, and GIRI. It outlines their methodologies, country coverage, and key dimensions, highlighting how each index assesses disaster risks and capacities at a global scale.
This summary provides a visual representation of the core elements of the INFORM Index, World Risk Index, and GIRI, highlighting their unique methodologies and areas of focus. It illustrates how these indices interrelate and complement each other, emphasizing the comprehensive approach required for effective disaster risk management and post-event recovery assessment.
3. Materials and Methods
Building on the theoretical foundations laid out earlier, this chapter introduces the methodology for developing the Recovery Gap Index (RGI), a tool designed to evaluate a nation’s capacity to respond to and recover from extreme natural events, whether they occur individually or consecutively. The RGI adopts a multi-dimensional approach to capture the complexity of recovery processes, integrating indicators across five critical dimensions: sociodemographic, infrastructure and resources, government and policy, technological, and economic factors. These categories provide a comprehensive evaluation of both qualitative and quantitative aspects of post-event phases, ensuring a holistic assessment of recovery capabilities within the broader context of resilience.
The development of the Recovery Gap Index (RGI), as illustrated in Figure 2, began with the collection of data from selected indices, including the INFORM Index, World Risk Index, and GIRI. All relevant indicators were carefully selected based on their relevance to post-event response and recovery themes. This initial phase involved downloading, identifying, and integrating the data into a cohesive dataset, as described in Section 3.1. Following data integration, the selected indicators were organized into five main categories, namely sociodemographic, infrastructure and resources, government and policy, technological, and economic factors, with each representing a critical dimension of recovery capacity. These categories and their subcategories were defined to provide a comprehensive assessment of a nation’s ability to manage and recover from extreme natural events. This process is detailed in Section 3.2.
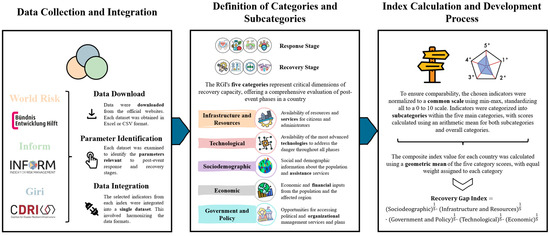
Figure 2.
Methodology flowchart for developing the Recovery Gap Index. This flowchart outlines the comprehensive process of developing the RGI, starting with data collection from key indices (World Risk, INFORM, and GIRI) and progressing through parameter identification and data integration. It illustrates the creation of categories and subcategories within the RGI, covering critical dimensions such as infrastructure, technology, sociodemographic, economic, and governance factors. The final stage of the index calculation and development process involves standardizing and normalizing the data to calculate the RGI, providing a detailed and comparative measure of recovery capacity across different nations.
To ensure comparability across datasets with differing original scales, the indicators were normalized to a common scale of 0 to 10 using the min–max method. This step enables consistent aggregation and avoids distortions that could arise from unequal scaling. The final Recovery Gap Index for each country was calculated using a geometric mean of the five category scores. This methodological choice reflects the interconnected nature of recovery dimensions, ensuring that no single category disproportionately influences the overall score. This calculation process, along with the rationale for the chosen methods, is outlined in Section 3.3.
While the methodology provides a robust framework for assessing recovery capacities, it is important to acknowledge certain limitations, such as the reliance on publicly available global datasets and the equal weighting of categories. These aspects are further discussed in the concluding sections, where potential refinements and future applications of the RGI are also explored.
3.1. Data Collection and Integration
The selection and integration of indicators are crucial steps in developing a robust and meaningful Recovery Gap Index (RGI). Data from the INFORM Index, World Risk Index, and GIRI, which provide comprehensive insights into various dimensions of disaster risk and recovery, were collected from their respective official websites in formats such as Excel and CSV. Each dataset included methodological details and descriptions of the parameters used. For reference, INFORM Index data were accessed from the INFORM website at https://drmkc.jrc.ec.europa.eu/inform-index (accessed on 2 December 2024), World Risk Index data from the Weltrisikobericht website at https://weltrisikobericht.de/worldriskreport/ (accessed on 2 December 2024), and GIRI data at https://giri.unepgrid.ch/ (accessed on 2 December 2024).
The selection process focused on identifying indicators most relevant to post-event response and recovery. Overlapping indicators were streamlined to create a cohesive dataset, and only countries with complete data from all three indices were included to ensure consistency and comparability.
For the INFORM Index, the emphasis was placed on indicators related to vulnerability and lack of coping capacity, including economic, health, recent extreme events, institutional, and communication aspects. Overly specific parameters, such as those related to infections or diseases, were excluded to maintain a focused dataset. A total of 21 indicators were selected (see Appendix B).
For the World Risk Index, indicators were chosen from the vulnerability category, focusing on the susceptibility, coping capacities, and adaptive capacities subcategories. Parameters related to exposure or with limited data availability were excluded to ensure the dataset’s reliability. A total of 40 indicators were selected (see Appendix A).
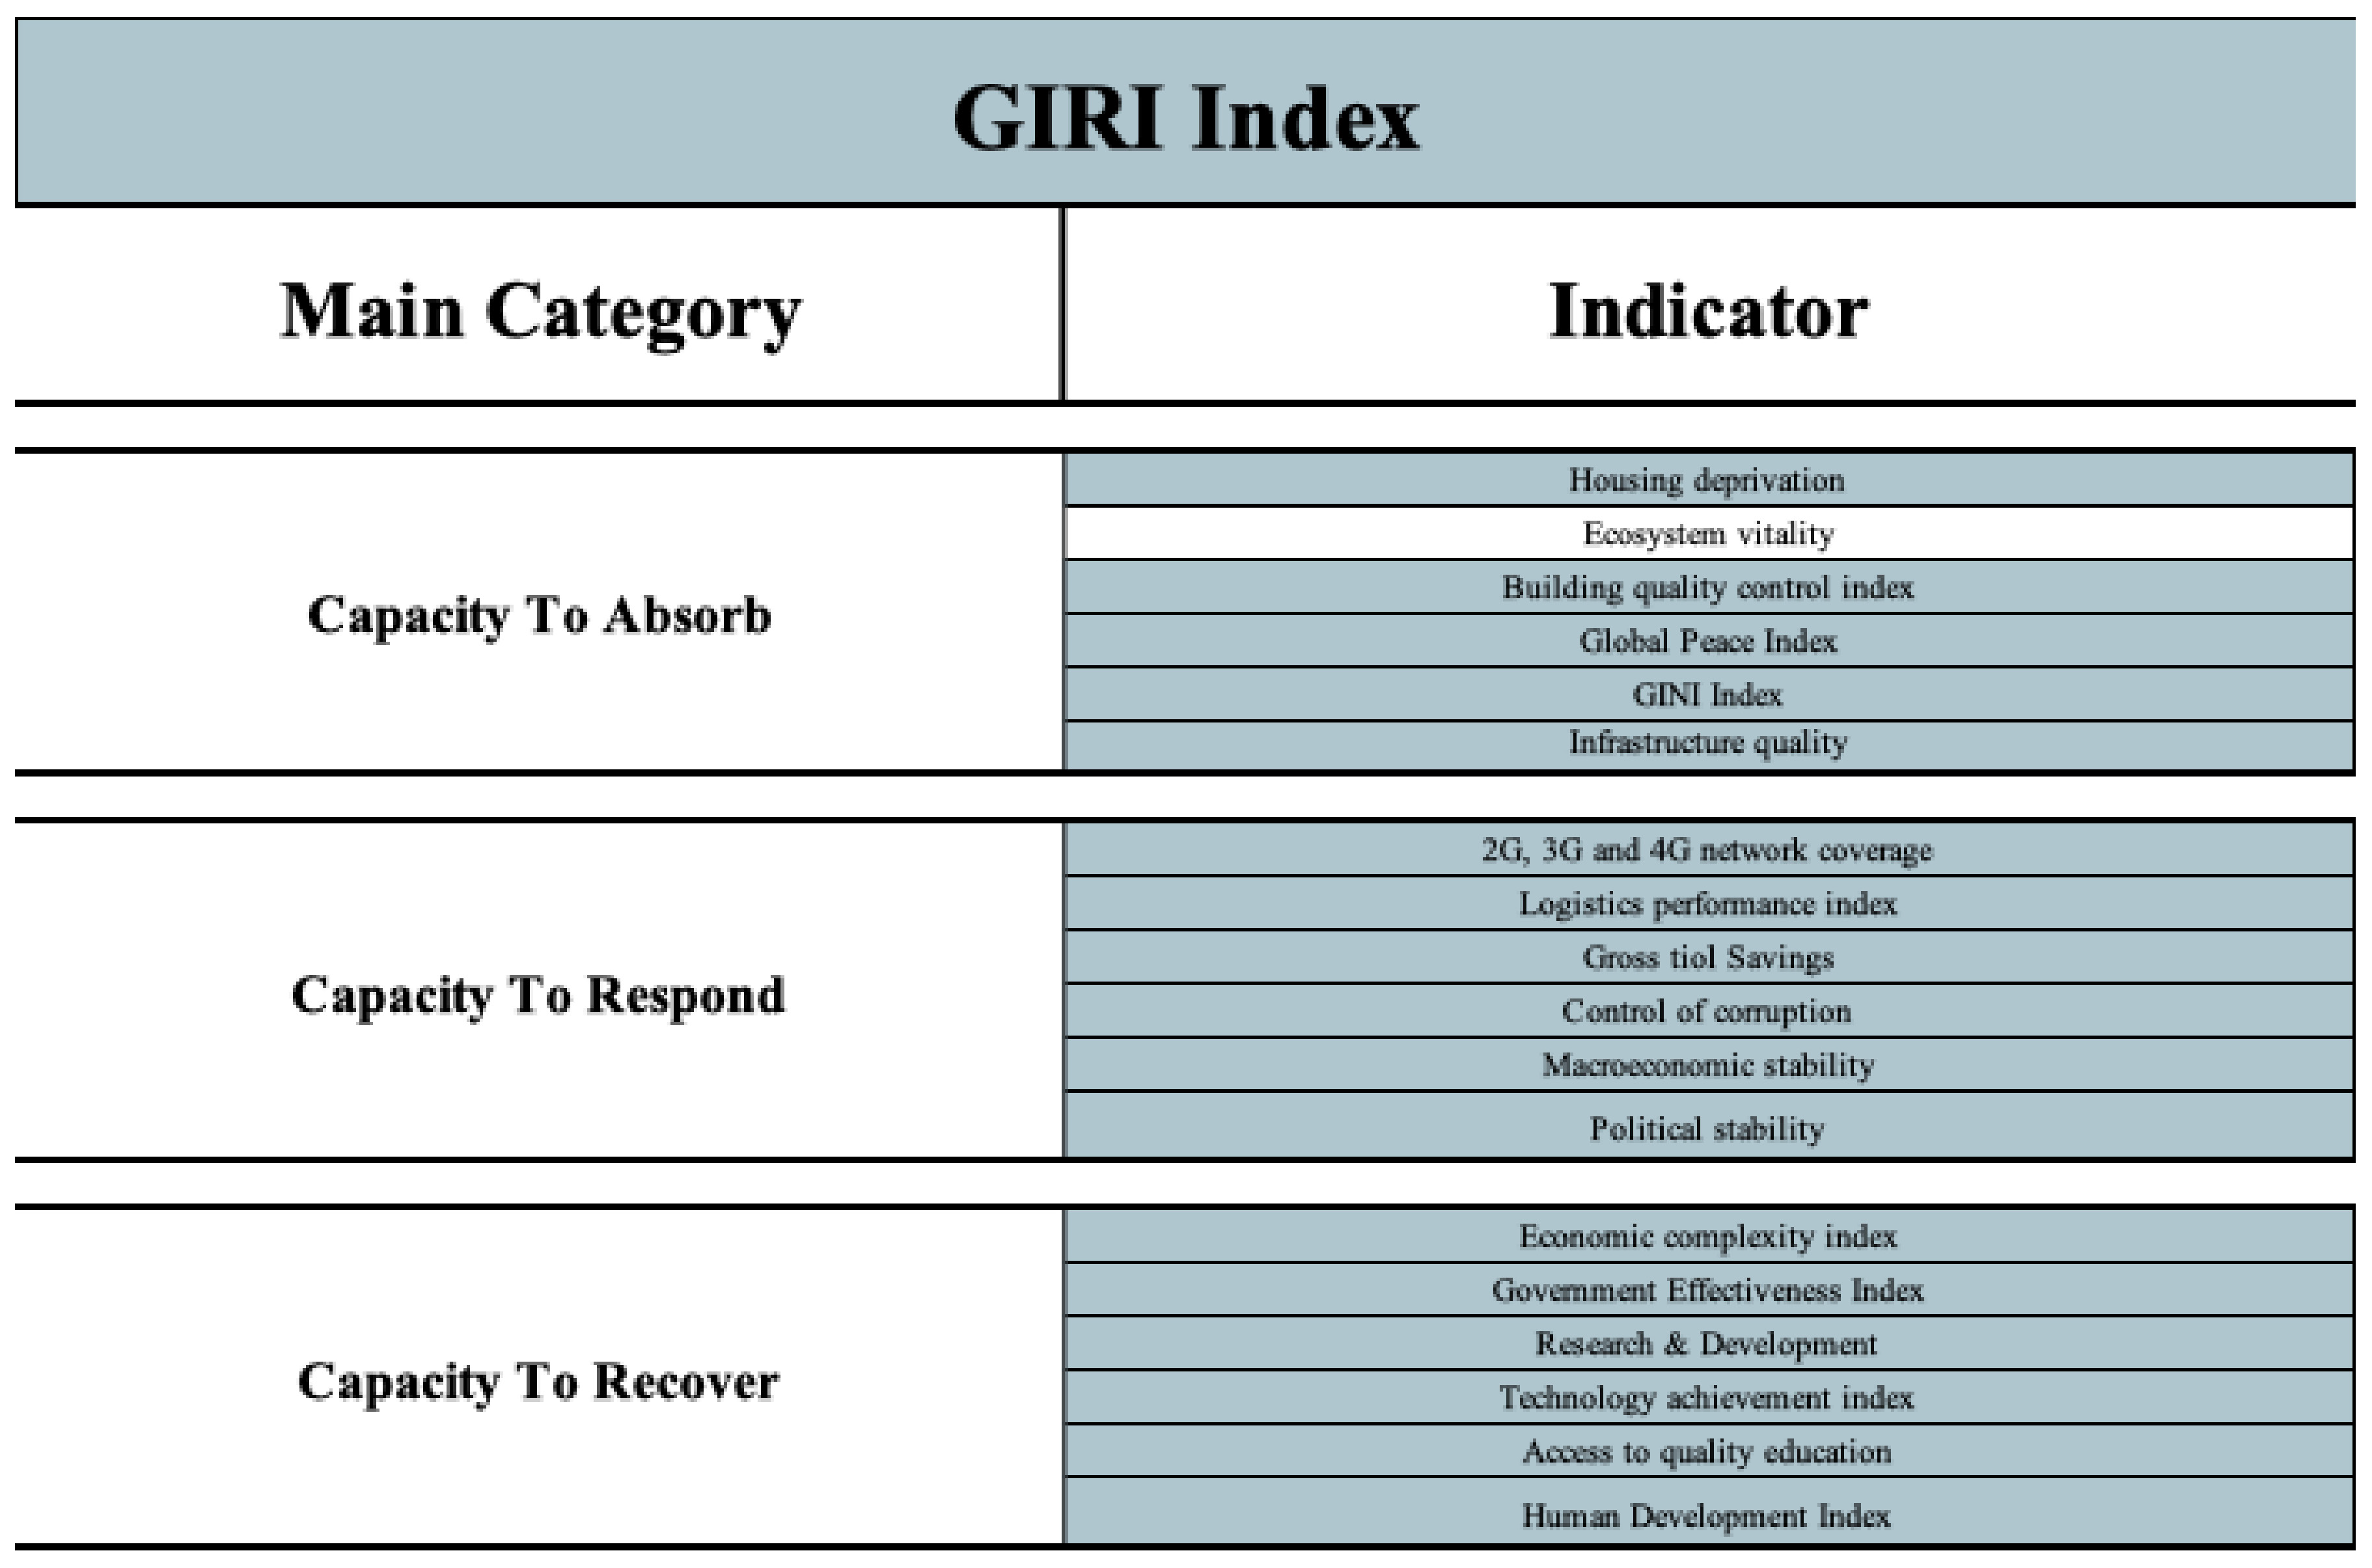
For GIRI, parameters were selected from the categories of capacity to absorb, capacity to respond, and capacity to recover. One indicator related to ecosystem vitality was excluded as it did not align with the focus on response and recovery phases. The final selection included 17 indicators (see Appendix C).
The integration of indicators from well-established indices such as INFORM, GIRI, and the World Risk Index ensures consistency and comparability across nations. However, while these datasets provide a comprehensive overview of recovery capacities, they are inherently limited by their reliance on aggregated and historical data. Such limitations may overlook real-time variations or country-specific nuances, particularly in rapidly evolving scenarios. To address this, future iterations of the Recovery Gap Index (RGI) could benefit from the inclusion of real-time survey data from representative countries across different continents. This would enhance the index’s granularity and contextual relevance, providing a more dynamic and adaptive tool for assessing recovery capacities. Despite these limitations, the current approach lays a solid foundation for understanding global recovery capacities and offers a valuable starting point for further refinement.
After selecting the various indicators from the literature-based indices, the focus shifted to the creation of categories and subcategories to systematically organize these indicators. This structured classification allows for a comprehensive representation of both qualitative and quantitative aspects of post-event phases, capturing the different dimensions of recovery and response.
3.2. Definition of Categories and Subcategories
The Recovery Gap Index (RGI) was developed to evaluate national recovery capacities through a structured framework. This framework is based on five main categories and their respective subcategories, which were selected to represent the key dimensions influencing a nation’s ability to recover from disasters. While resilience encompasses a system’s overall capacity to resist and adapt to hazards, the focus of the RGI is specifically on recovery, measuring the practical capabilities required to respond to and restore normalcy after extreme events.
The selection of these categories is grounded in existing literature on disaster resilience and recovery, where multi-dimensional frameworks are widely recognized as essential for capturing the complexity of recovery dynamics. Studies such as that by Saja [52] emphasize the importance of integrating socioeconomic, governance, and technological dimensions in resilience assessments. Similarly, the Sendai Framework for Disaster Risk Reduction highlights governance, infrastructure, and socioeconomic resilience as critical components of recovery. These foundational studies provided the theoretical basis for defining the five main categories of the RGI.
The five main categories reflect the critical dimensions affecting recovery. The theoretical foundation and relevance of each category are briefly outlined below:
- Sociodemographic: This category evaluates factors such as population density, literacy rates, and healthcare access, which influence the ability of populations to recover effectively [53].
- Infrastructure and resources: This category examines the quality and availability of essential services, such as emergency response capabilities and access to clean water, which are vital during recovery efforts [48].
- Government and policy: This category assesses governance effectiveness, the presence of disaster preparedness plans, and the ability of political frameworks to support recovery operations [27].
- Technological: This category addresses the use of advanced technologies, such as early warning systems and remote sensing, which play a crucial role in facilitating recovery processes [54].
- Economic: This category captures financial aspects, including GDP per capita and public investments, which significantly affect recovery speed and sustainability [55].
To complement these main categories, subcategories were developed to capture the diversity of recovery capacities in more detail. Indicators were grouped into subcategories based on their relevance to the recovery process following a structured approach guided by expert judgment. This grouping was informed by both theoretical foundations and practical considerations, ensuring that all critical dimensions of recovery were systematically included [56]. This method ensures that the RGI covers all key dimensions of recovery while maintaining a consistent and transparent methodology. The subcategories allow for a more precise evaluation of indicators, highlighting critical strengths and weaknesses in national recovery capacities.
Figure 3 summarizes the RGI’s structure, illustrating how indicators from existing indices were classified into subcategories and subsequently grouped into the main categories. Additional details on the classification process and a sample dataset of evaluated countries are provided in Appendix D, offering a clear and transparent overview of the methodology.
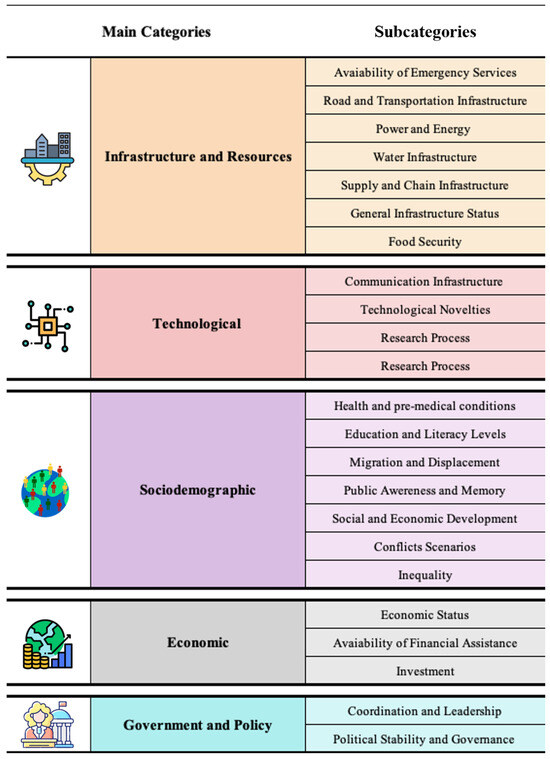
Figure 3.
Categories and subcategories of the Recovery Gap Index. This figure provides a detailed breakdown of the subcategories within the five main categories of the RGI. Each main category is further divided into specific subcategories that represent critical dimensions of a nation’s capacity to respond to and recover from extreme natural events.
3.3. Index Calculation and Development Process
After defining the main categories and subcategories and selecting the relevant indicators, the next step in the development of the Recovery Gap Index (RGI) was to standardize the diverse datasets to ensure comparability. The indicators used in the RGI were sourced from well-established indices such as the INFORM Index, the World Risk Index, and GIRI, each of which employs its own scale ranging from 0 to 10 (INFORM), 0 to 1 (World Risk Index), and 0 to 100 (GIRI). To integrate these indicators into a unified framework, all values were normalized to a common scale from 0 to 10 using min–max normalization. This method was chosen for its simplicity and ability to preserve the relative differences among values while ensuring all indicators are brought to the same scale. The normalization ensures that indicators with inherently larger scales, such as those in GIRI, do not dominate the final calculations. By transforming all data to a consistent 0–10 scale, this approach prevents potential biases and allows for accurate aggregation across different categories. The standardized indicators were then aggregated into subcategories and categories, as detailed in the subsequent sections. This step ensures that the final Recovery Gap Index provides a balanced and consistent measure of recovery capacity across nations.
Once normalized, the indicators were organized into their respective subcategories within the five main categories of the RGI framework: sociodemographic, infrastructure and resources, government and policy, technological, and economic. The process of aggregation followed a hierarchical structure to ensure consistency and accuracy.
For each subcategory, the arithmetic mean of the normalized indicator values was calculated. If an indicator had missing data, it was excluded from the calculation, provided that the subcategory retained at least two valid indicators to ensure reliability. Subcategory scores were then averaged to calculate the scores for each of the five main categories, representing a country’s performance in that specific dimension of recovery capacity.
To derive the overall Recovery Gap Index (RGI) value for each country, a geometric mean of the five main category scores was used. The geometric mean was chosen due to its ability to reflect the interdependence and compensatory limitations of the different dimensions of recovery capacity. Unlike the arithmetic mean, which assumes equal compensability between dimensions, the geometric mean penalizes disproportionate values among the categories. This ensures that a poor performance in one category has a more significant impact on the overall index, aligning with scientific best practices for composite indicators where dimensions are interconnected but non-substitutable [49,57]. The formula used for the RGI calculation is presented below (Formula (1)):
This formulation ensures that no single category can dominate the composite index, thereby offering a balanced evaluation of recovery capacities. The equal weighting of categories reflects an initial neutral assumption that is commonly employed in composite index construction when empirical or theoretical evidence does not suggest clear differences in relative importance [58]. However, as this may not fully capture the contextual nuances of specific nations, future iterations of the RGI may refine this approach by integrating context-specific weighting schemes.
The analysis was conducted using Microsoft Excel for data management, calculation of indicators, and creation of the database. Python was used for data visualization, including the creation of graphs and maps to represent the results. The combination of these tools ensured a rigorous and systematic approach to developing the RGI.
With the indicators standardized and categorized, we calculated values for each subcategory, then for the main categories, and finally a single RGI value for each country. The process started by calculating the arithmetic mean for each subcategory’s indicators. Missing values were marked with an “X”, and calculations were adjusted accordingly, ensuring each subcategory had at least two indicators. Main category values were calculated by averaging the subcategory values. The final RGI value for each nation was calculated using a geometric mean, assigning equal weight to the five main categories. The database includes values for 169 nations, represented by full names and ISO codes, with a simplified example shown in Appendix D. The full dataset is available in Supplementary CSV files accompanying the article.
4. Results and Discussion
This chapter presents a detailed analysis and interpretation of the results obtained from the Recovery Gap Index (RGI) evaluation. The goal is to provide a comprehensive overview of the data, which is available in the Supplementary Materials, and to present graphical representations on a global and regional scale. The analysis aims to uncover regional and country-specific differences in the capacity to respond to and recover from extreme natural events, offering valuable insights for policymakers, administrators, and investors. In addition to the graphical representations with maps at global and regional levels, an analysis of the geographical variability of the different category values has also been conducted, providing a more detailed view of the recovery capacity for each nation.
4.1. Global and Regional RGI Results
The initial step involved the compilation of a complete database of RGI values, including all categories, subcategories, and parameters for 169 nations. This database serves as the foundation for various graphical and statistical analyses, enabling a deep understanding of the data. A global map was created to visualize the RGI values for all nations, highlighting those with better or worse capacities. This map facilitates the identification of geographic areas with significantly higher or lower RGI values and prompts further investigation into the sources of these differences. Figure 4 illustrates the global distribution of the Recovery Gap Index values.
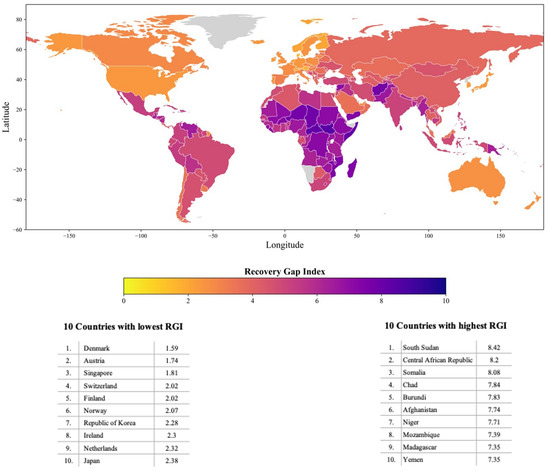
Figure 4.
Global distribution of the Recovery Gap Index. The world map presents the RGI values for 169 countries, illustrating the global variation in recovery capacities. The color gradient highlights regions with differing levels of resilience, from those well prepared for post-disaster recovery to those facing significant challenges. Below the map, two tables display the 10 countries with the lowest and highest RGI values, respectively, providing a detailed comparison of the extremes in recovery capacities.
Countries without data are shaded in gray. Nations with low RGI values, indicating strong capacities to respond and recover from extreme natural events, are colored yellow. Among the top ten countries, seven are European, with the remaining three being Asian (Singapore, South Korea, and Japan). Conversely, countries with the highest RGI values, indicating weaker capacities, are predominantly African, with some from the Middle East (Afghanistan and Yemen). Figure 4 and its accompanying tables provide a comprehensive view of these global and regional distributions, offering a clearer perspective on the disparities in recovery capacities across different countries. This contrast highlights the need for more focused disaster preparedness and recovery strategies in the African continent [59]. To further analyze these differences, detailed maps for each continent were created, highlighting nations with particularly low capacities. Figure 5 illustrates these regional distributions.
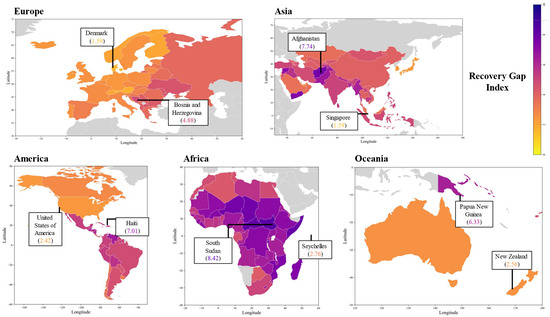
Figure 5.
Continental RGI maps. The maps display the RGI values across different continents, highlighting regional disparities in recovery capacities. The visualization provides a detailed comparison of how various regions are equipped to respond to and recover from extreme natural events.
These maps provide a more detailed view of the RGI values for each continent, including the names and RGI values of the countries with the highest and lowest capacities. This approach allows for a more nuanced understanding of regional disparities and highlights specific areas that require targeted interventions [41].
The average global RGI value is 4.75. Figure 6 presents the numerical distribution of RGI values for each continent, from minimum to maximum, illustrating the average values.
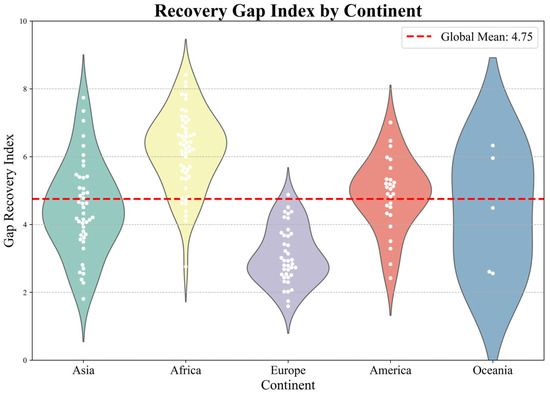
Figure 6.
Distribution of RGI values by continent. This violin plot illustrates the distribution of RGI values across different continents, highlighting the variability within each region. The plot provides insights into how recovery capacities are distributed globally, with the global mean indicated by the dashed red line.
This graph clearly shows that European countries generally have RGI values below the global average, with the highest European value being 4.88 for Bosnia and Herzegovina. In contrast, African countries, except for a few exceptions (Seychelles, Tunisia, and Morocco), mostly have values above the global average, indicating significant challenges in post-event recovery. This stark contrast highlights the need for more focused disaster preparedness and recovery strategies in the African continent [60].
The remaining three continents, Asia, the Americas (combined North and South), and Oceania, show a wide range of values, indicating significant differences in response and recovery capacities within the same geographic region. This variability is due to diverse economic, social, organizational, governmental, infrastructural, and technological contexts. Despite this variability, the average RGI values for these continents are like the global average.
4.2. Global and Regional Recovery Disparities
A detailed examination of the RGI values for each main category was conducted. Figure 7 presents spatial representations of the values for the five main categories (infrastructure and resources, technological, sociodemographic, economic, government and policy).
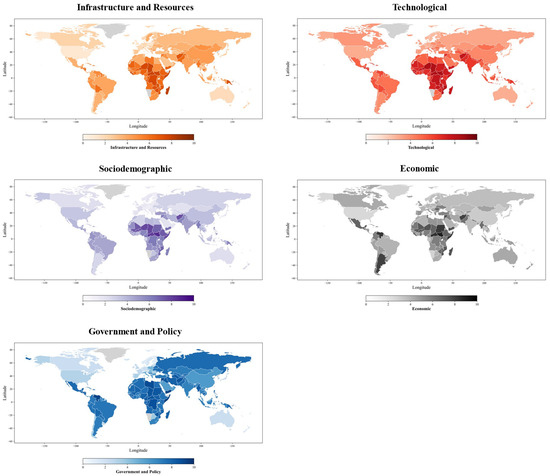
Figure 7.
Spatial analysis of main RGI categories. These maps illustrate the distribution of RGI values across the five main categories: infrastructure and resources, technological, sociodemographic, economic, and governance and policy. Each map provides a visual representation of how different regions perform in each category, highlighting the geographical variability in recovery capacities.
The analysis of the composite response and recovery index, through maps and violin plots (Figure 7 and Figure 8), reveals significant global disparities. The spatial maps show that Asia and Africa have high values, indicating slower response and recovery after extreme events. These high values, marked in deep red, highlight the extreme vulnerability of large areas in these continents. This can be attributed to underdeveloped infrastructure, limited resources, and weak governance [61]. In contrast, Europe and North America show significantly lower values, indicated by lighter colors on the maps, suggesting better response and recovery capacities. For example, Europe’s lower values may result from well-structured risk management policies and efficient healthcare systems. Similarly, North America’s recovery capacities, which contribute to its broader resilience, can be linked to advanced technologies and substantial resource mobilization capabilities [62].
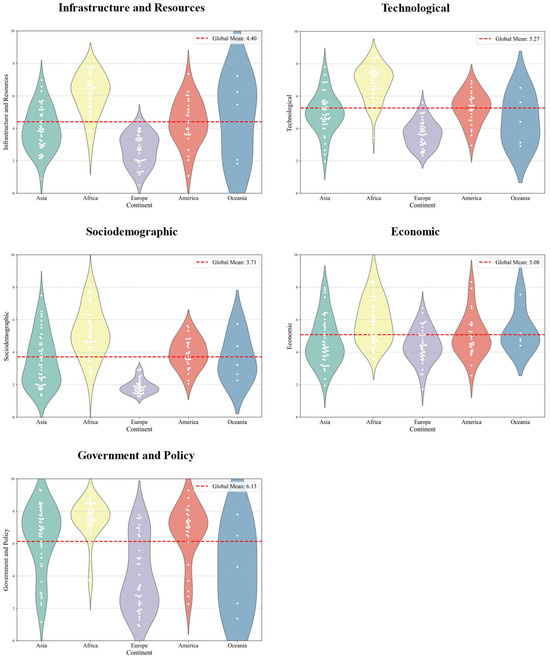
Figure 8.
Violin plots of main RGI categories. These violin plots depict the distribution of values for each of the five main RGI categories: infrastructure and resources, technological, sociodemographic, economic, and governance and policy. The plots highlight the variability within each category across different continents, providing insights into the spread and central tendency of recovery capacities.
Continental comparisons further highlight significant differences. The Americas show a stark contrast between the more resilient North America and the more vulnerable South America. While some South American areas show moderate values, vast regions remain highly vulnerable. Oceania also shows variable vulnerability, with some regions more exposed than others, as indicated by the different shades of blue [63].
The violin plots provide detailed distributions of category values, helping to identify specific aspects that most influence post-event resilience. For instance, the plots show that infrastructure, healthcare resources, and governance are key factors. Asia’s wide variability in infrastructure indicates significant disparities in preparedness. Differences in category means between continents highlight specific strengths and weaknesses, suggesting the need for targeted interventions. The composite index value for each state, represented in the violin plots, offers an overall view of response and recovery capacities. Countries with particularly high values, identified by peaks in the plots, require targeted interventions to improve resilience. High-value countries should be prioritized for international development and assistance programs, focusing on infrastructure improvements, community training, and emergency planning [64].
Analyzing policies in countries with low values can provide replicable models for regions with high vulnerability. The violin plots suggest that investments in resilient infrastructure, early warning systems, and adequate healthcare resources can significantly reduce response and recovery times. Regional cooperation, especially among countries with similar vulnerabilities, can also be highly effective. Sharing resources and knowledge can accelerate overall resilience improvements [65]. In summary, the data clearly highlight global disparities in post-event response and recovery capacities. A global approach is essential, with a particular focus on the most vulnerable regions. Implementing recommendations based on this analysis can significantly reduce the impact of extreme natural events, saving lives and reducing long-term economic losses.
4.3. Country-Specific Insights
To provide specific insights for each nation, radar charts were used to visually represent the values of the different categories for each country. These charts effectively illustrate the overall capacity to respond and recover. Figure 9 presents radar charts for four representative nations: Afghanistan, Italy, Togo, and Argentina.
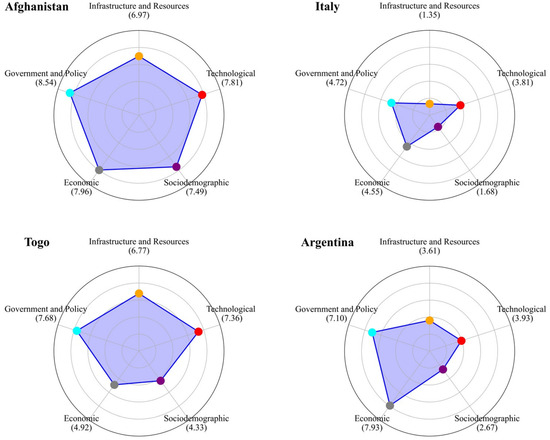
Figure 9.
Radar charts for country-specific RGI analysis. These radar charts illustrate the RGI values across the five main categories for Afghanistan, Italy, Togo, and Argentina, providing a visual comparison of each country’s strengths and weaknesses in terms of recovery capacities.
These radar charts show the numerical distribution of values across different categories. The blue central area represents the overall response and recovery capacity. A larger area indicates a poorer capacity, while a smaller area indicates better resilience. This visualization tool is useful for administrators and organizational officials to identify areas that require improvement in risk management and assessment. The radar charts for Afghanistan, Italy, Togo, and Argentina reveal significant differences in response and recovery capacities. Afghanistan shows significant weaknesses in infrastructure and resources, indicating fragile infrastructure and limited resources, severely compromising its response capacity. Weak governance further exacerbates emergency management and resource coordination issues. The Public Health sector is also notably weak, reflecting an inadequately prepared healthcare system [66]. In stark contrast, Italy demonstrates robust values across categories. Strong performance in infrastructure and resources indicates solid infrastructure and sufficient resources for effective disaster response. Well-developed governance mechanisms suggest effective emergency management, while strong Public Health reflects a capable healthcare system [67]. Togo, similar to Afghanistan, shows significant weaknesses in infrastructure and resources. However, its governance is relatively stronger, though still insufficient for effective response. A positive note for Togo is the natural environment category, where it shows less vulnerability compared to other low-scoring countries, suggesting that the natural environment may play a less detrimental role compared to other areas of weakness [63]. Argentina displays strong performance in infrastructure and resources, indicating robust infrastructure and adequate resources. Developed governance suggests good emergency management capacity. However, the communication and awareness category is relatively weak, indicating a need for improvement in public communication and awareness to enhance overall resilience [68].
These radar charts provide clear insights into each country’s strengths and weaknesses. Countries like Afghanistan and Togo require targeted interventions to improve infrastructure and resources, strengthen governance, and bolster healthcare systems. Significant investments in resilient infrastructure and healthcare are crucial for Afghanistan. For Italy and Argentina, although they show overall good capacities, there are areas for improvement. Italy could further enhance emergency response by improving public communication and awareness. Argentina could invest in emergency management training programs and improve public communication to increase its response capacity. In conclusion, the radar charts provide a detailed view of various dimensions of resilience, helping identify priorities for improvement. Strengthening infrastructure, improving governance, and enhancing healthcare resources are essential steps to increase global resilience to extreme natural events.
4.4. RGI Limitations
While the Recovery Gap Index (RGI) provides a robust framework for assessing national recovery capacities following extreme natural events, several limitations should be acknowledged to ensure a transparent understanding of the study’s scope and potential areas for improvement. These limitations are outlined below:
- Data availability and quality: The RGI relies on publicly available datasets, including the INFORM Index, GIRI, and World Risk Index. While these datasets are well established and widely used, their coverage and granularity can vary significantly, particularly for less developed regions. For example, some indicators may not be updated regularly, or data for specific countries may be incomplete. In some cases, missing or outdated data may affect the accuracy of the results, highlighting the need for more localized and up-to-date datasets in future iterations of the RGI. Future iterations of the RGI should aim to incorporate more localized, high-resolution, and up-to-date datasets, particularly for underrepresented regions, to improve accuracy and inclusivity. Collaboration with national statistical agencies and international organizations could facilitate this process.
- Equal weighting of categories: The current RGI assigns equal weight to all five main categories (sociodemographic, infrastructure and resources, government and policy, technological, and economic). This approach, while neutral and straightforward, may not reflect the varying importance of these dimensions in different national or regional contexts. For instance, governance may play a more critical role in some countries, while infrastructure could be the limiting factor in others. Future research could address this limitation by exploring context-specific weighting schemes derived from empirical data or expert consultation.
- National-level focus: The RGI is designed for national-level assessments, which may overlook significant sub-national variations in recovery capacity. For instance, disparities between urban and rural areas or among administrative regions within a country can be substantial. Including regional or local data in future iterations of the RGI would provide a more nuanced understanding of recovery dynamics.
- Limited consideration of cascading and multi-hazard effects: While the RGI accounts for recovery capacities following individual or consecutive extreme events, it does not explicitly model cascading hazards or their long-term socioeconomic impacts. For example, the compounding effects of back-to-back disasters, such as a flood followed by an epidemic, may not be fully captured. Future work could integrate dynamic modeling approaches to address these interactions.
- Simplification of recovery dynamics: The RGI simplifies the complexity of recovery by aggregating indicators into categories and using a composite index. While this approach provides a clear and comparable metric, it may not capture the full range of factors influencing recovery, such as social cohesion or cultural dimensions. These aspects could be explored in future research to provide a more holistic understanding.
- Theoretical and empirical validation: While the RGI is based on a robust theoretical framework and uses data from established indices, its empirical validation remains a priority for future work. Testing the RGI against real-world recovery scenarios through case studies or historical data could strengthen its reliability and practical applicability. Additionally, feedback from disaster management practitioners could provide valuable insights for refining the methodology and improving its operational relevance.
Despite these limitations, the RGI represents a significant step forward in quantifying national recovery capacities, offering valuable insights for disaster management and resilience building. By addressing these challenges, future iterations of the RGI could further enhance its accuracy, applicability, and impact.
5. Conclusions and Future Directions
Having presented the methodology behind the development of the Recovery Gap Index (RGI) and the various maps and graphs that illustrate its findings, this final chapter aims to summarize the key points of this research. We will reflect on the results obtained, discuss their implications, and outline future research directions that can enhance the utility and accuracy of the RGI.
5.1. Summary of Key Findings
The Recovery Gap Index (RGI) represents a novel and comprehensive tool for quantifying the response and recovery capacities of nations following extreme natural events. Developed through the integration of data from three well-established indices, the World Risk Index, INFORM, and GIRI, the RGI provides a multi-dimensional assessment by incorporating sociodemographic, infrastructural, governmental, technological, and economic factors. This framework enables a detailed evaluation of each nation’s ability to manage post-event phases effectively, addressing a critical gap in disaster risk management research.
The global analysis of the RGI revealed significant regional disparities, with European countries generally exhibiting lower RGI values, indicating strong response and recovery capacities. The spatial distribution maps (Figure 4 and Figure 5) visually highlight these differences, providing a clear representation of recovery capacity disparities across regions. Furthermore, continental analyses underscored variability within continents. For example, while Europe displayed consistently low RGI values across its nations, regions such as Asia and the Americas showed a broader range of values, indicating diverse capacities and recovery potential within these areas. These findings emphasize the necessity for tailored disaster risk management strategies that reflect the specific needs and capacities of individual nations. The radar charts (Figure 9) provided more granular insights into national disaster management capacities. These visualizations identified specific strengths and weaknesses, such as governance deficiencies, infrastructural limitations, or sociodemographic vulnerabilities, offering actionable intelligence for policymakers.
These findings not only highlight the value of the RGI in identifying and comparing national recovery capacities but also demonstrate its potential as a practical tool for guiding disaster preparedness investments, policymaking, and resilience-building initiatives. The RGI framework can inform targeted interventions that address specific weaknesses, ultimately contributing to more effective disaster risk management at both regional and global scales.
5.2. Future Research Directions
The current iteration of the Recovery Gap Index (RGI) provides a solid foundation for assessing a nation’s capacity to respond to and recover from extreme natural events. However, several enhancements could further refine and expand its capabilities, transforming the RGI into a more comprehensive tool for disaster management and resilience building.
- Integration of early warning systems (EWSs): Incorporating data on early warning systems (EWS), as highlighted by the United Nations’ “Early Warnings for All” initiative [69], could significantly enhance the RGI’s ability to evaluate a country’s preparedness. EWS are crucial for mitigating the impacts of disasters by enabling timely evacuations and preparation measures. Using sources like the Sendai Framework Monitor, which provides global information on multi-hazard early warning systems [70], would add a valuable dimension to the RGI. However, this integration would require the normalization of new indicators to align them with the existing framework [71,72].
- Inclusion of insurance coverage metrics: Integrating metrics related to insurance coverage, such as the Natural Catastrophe Insurance Resilience Index (I-RI) and the Natural Catastrophe Protection Gap, would provide deeper insights into a nation’s financial resilience and its capacity to recover from economic shocks caused by disasters [55,73,74,75]. These metrics highlight the disparity between available and necessary insurance coverage, revealing financial vulnerabilities that are critical for a comprehensive assessment of national recovery capabilities.
- Evaluation of legal and policy frameworks: Assessing the robustness of disaster response laws and emergency plans is essential, as studies indicate that well-established legal frameworks can significantly improve the efficiency of post-event recovery [76]. Developing a comprehensive database of national disaster response policies would offer valuable insights into governance and institutional readiness. Although this would involve extensive data collection and country-specific research, it would greatly enhance the RGI’s ability to evaluate legal and organizational capacities.
- Refinement of weighting and normalization methods: The current RGI assigns equal weight to all components, which may not accurately reflect their relative importance across different contexts. Future iterations could refine this approach by adjusting the weights based on empirical data from detailed case studies, offering a more accurate and context-specific assessment [56]. This would require collaboration with national authorities and disaster management experts to ensure that the revised weights are relevant and reflect real-world recovery dynamics.
- Developing targeted recommendations based on RGI categories: The RGI, with its detailed categorization of recovery capacities across dimensions such as government and policy, infrastructure and resources, technological capacity, sociodemographic, and economic factors, provides a valuable tool for identifying specific areas of improvement for each country. The availability of category-specific scores for every nation allows for the development of tailored recommendations that address the unique challenges highlighted by the RGI. For instance, a country with a high score in government and policy might prioritize improving institutional coordination and transparency to strengthen its governance systems, while a nation with elevated technological scores could focus on enhancing early warning systems or training personnel to better utilize disaster management tools. Similarly, regions with high sociodemographic scores could invest in public awareness campaigns and equitable access to healthcare, and those with economic vulnerabilities may seek to diversify revenue streams or implement social safety nets. Future research could expand on these initial insights by exploring how the RGI can be used to generate detailed, country-specific recommendations, providing actionable guidance for policymakers and stakeholders.
- Using the RGI for risk and timeline assessments: The RGI provides a robust measure of national recovery and response capacities, but future research could expand its application by integrating it with parameters such as hazard intensity, exposure characteristics, and vulnerability metrics. This combination would enable predictive models for estimating recovery and response timelines, offering policymakers actionable insights for prioritizing interventions. For instance, regions with high RGI scores could be identified for capacity-building efforts, while areas with lower scores but significant exposure might require immediate focus. Such integrative approaches would support more dynamic and comprehensive frameworks for disaster risk management and resilience planning.
Addressing these areas could significantly improve the RGI, transforming it into a more robust and effective tool for disaster risk management. Such enhancements would benefit both the academic community and practical field applications, providing a more nuanced understanding of global resilience and guiding targeted interventions to strengthen recovery capacities.
The RGI represents a significant advancement in understanding and quantifying a nation’s capacity to respond to and recover from extreme natural events. However, there is ample scope for improvement. Incorporating additional factors such as early warning systems, insurance coverage, and legal frameworks; refining weighting methods; and developing interactive tools can enhance the RGI’s accuracy and utility. This research serves as a foundational step toward a more comprehensive understanding of post-event recovery, providing valuable insights for academia, policymakers, and disaster management practitioners. The ongoing development and refinement of the RGI will be crucial in addressing the complex challenges posed by extreme natural events in the years to come.
Supplementary Materials
The following supporting information can be downloaded at: https://www.mdpi.com/article/10.3390/su17031044/s1, Database World RGI.
Author Contributions
Conceptualization, A.B., T.G., E.T. and D.O.; Methodology, A.B., T.G., E.T. and D.O.; Investigation, A.B.; Writing—original draft, A.B.; Writing—review & editing, T.G., E.T. and D.O.; Supervision, T.G., E.T., D.O., R.R. and L.F. All authors have read and agreed to the published version of the manuscript.
Funding
This research received no external funding.
Institutional Review Board Statement
Not applicable.
Informed Consent Statement
Informed consent was obtained from all subjects involved in the study.
Data Availability Statement
The data used to support the findings of this study are publicly available and can be accessed from the respective official websites of the indices utilized. Specifically, INFORM Index data are available from the INFORM website at https://drmkc.jrc.ec.europa.eu/inform-index (accessed on 2 September 2024). World Risk Index data can be accessed from the Weltrisikobericht website at https://weltrisikobericht.de/worldriskreport/ (accessed on 2 September 2024). GIRI (Global Risk Index) data are available at https://giri.unepgrid.ch/ (accessed on 2 September 2024). All datasets include methodological explanations and descriptions of the parameters used.
Conflicts of Interest
The authors declare no conflicts of interest.
Appendix A
This figure presents the indicators from the World Risk Index selected for the RGI. The relevant indicators are highlighted in color chosen to represent the indicator in the article, showing their categories and subcategories used in the analysis.
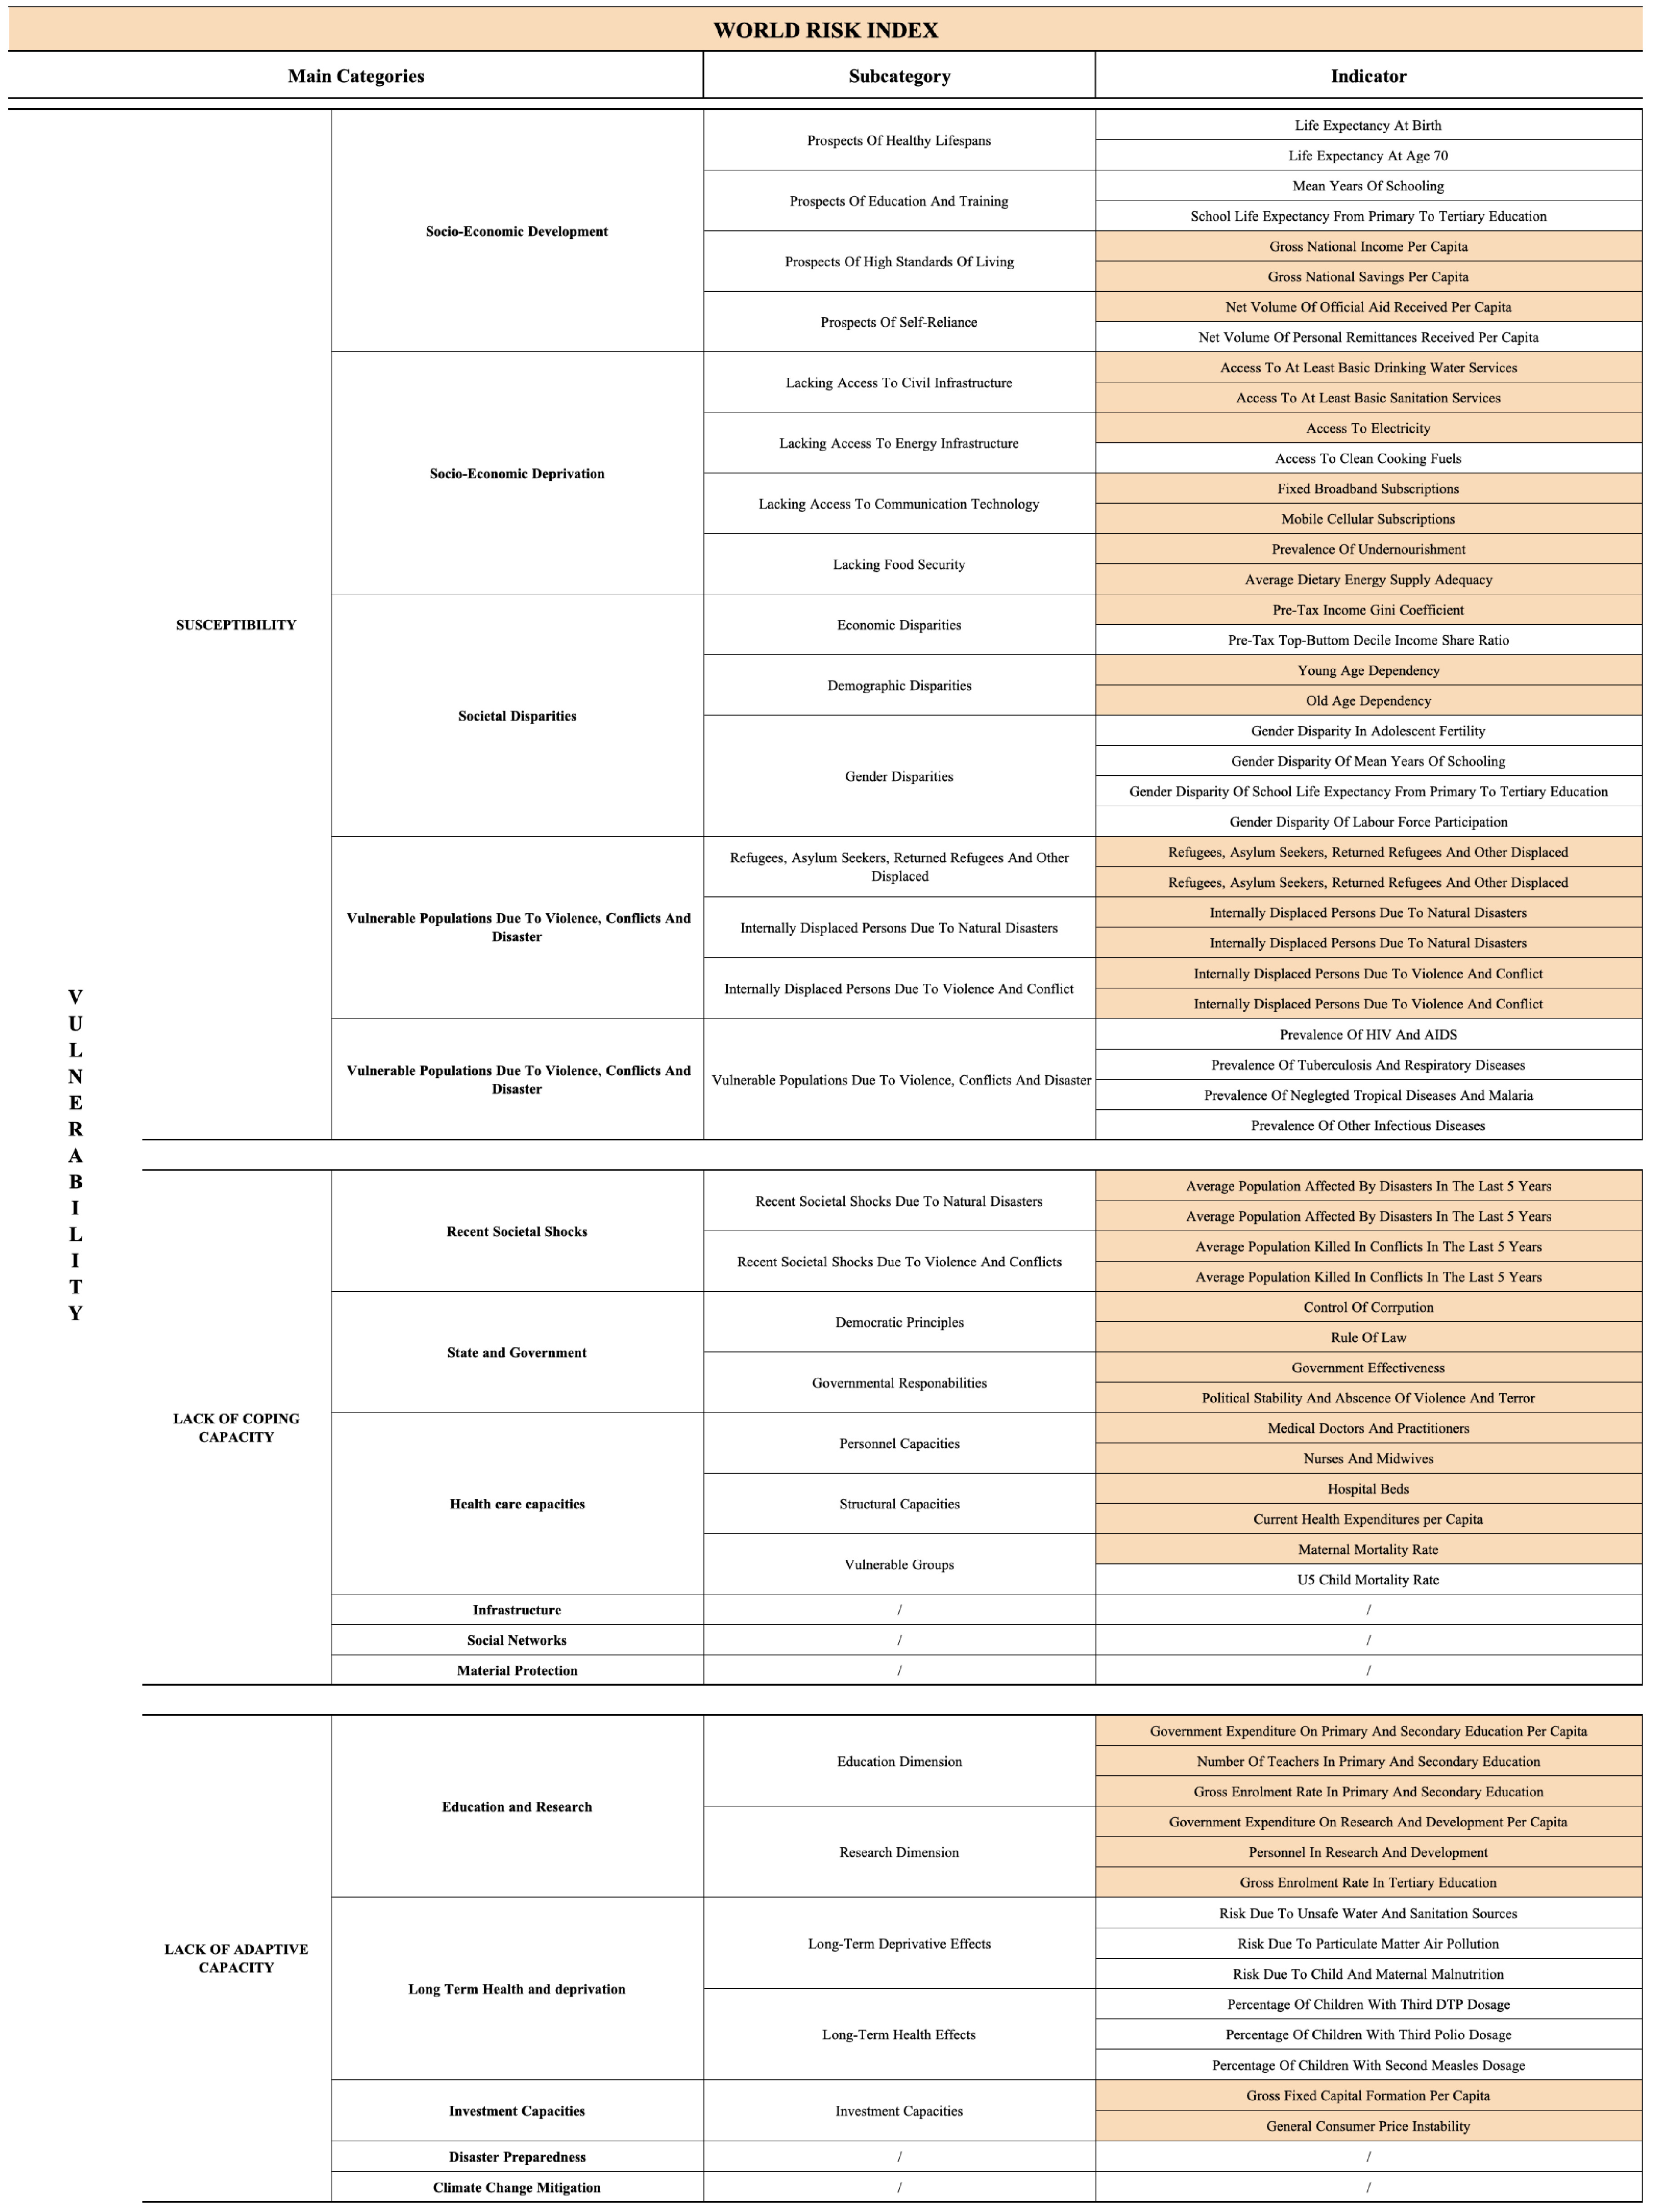
Appendix B
This figure lists the selected indicators from the INFORM Index that were used in the RGI. The color-coded cells identify the indicators chosen, along with their respective categories and subcategories.
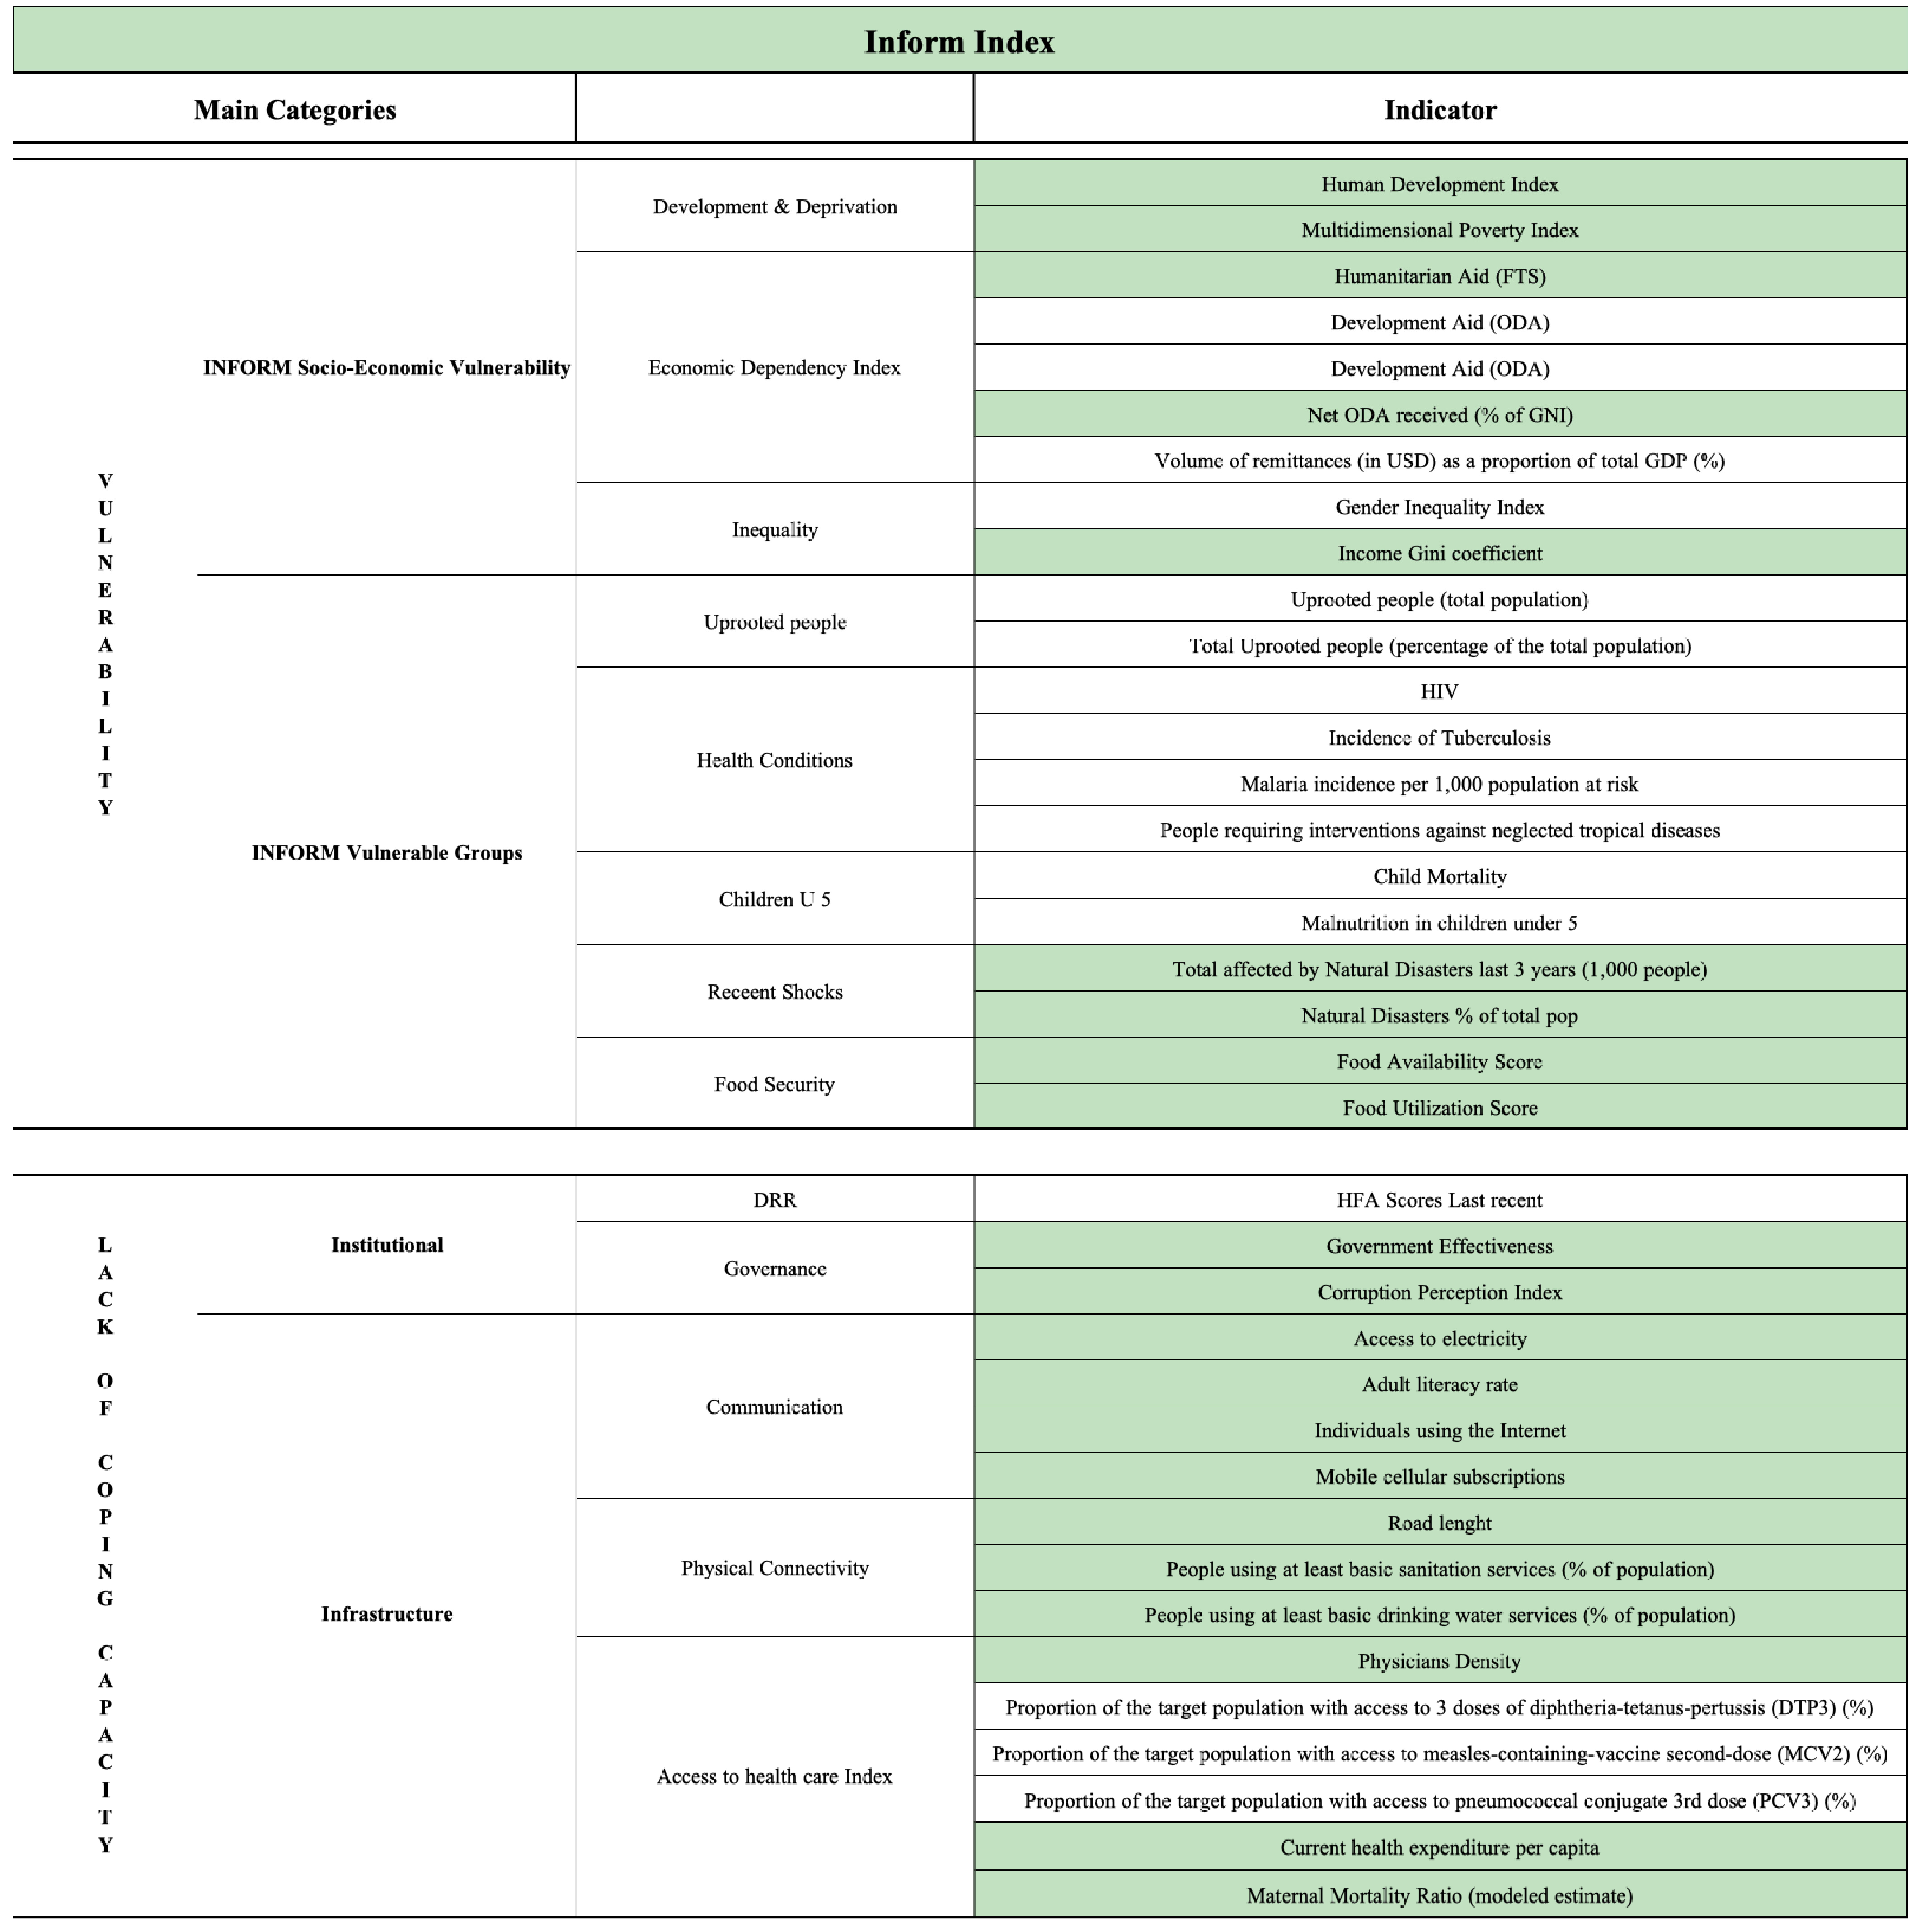
Appendix C
This figure details the indicators from GIRI that were included in the RGI. Highlighted indicators are shown with their categories and subcategories, illustrating their role in the overall index.
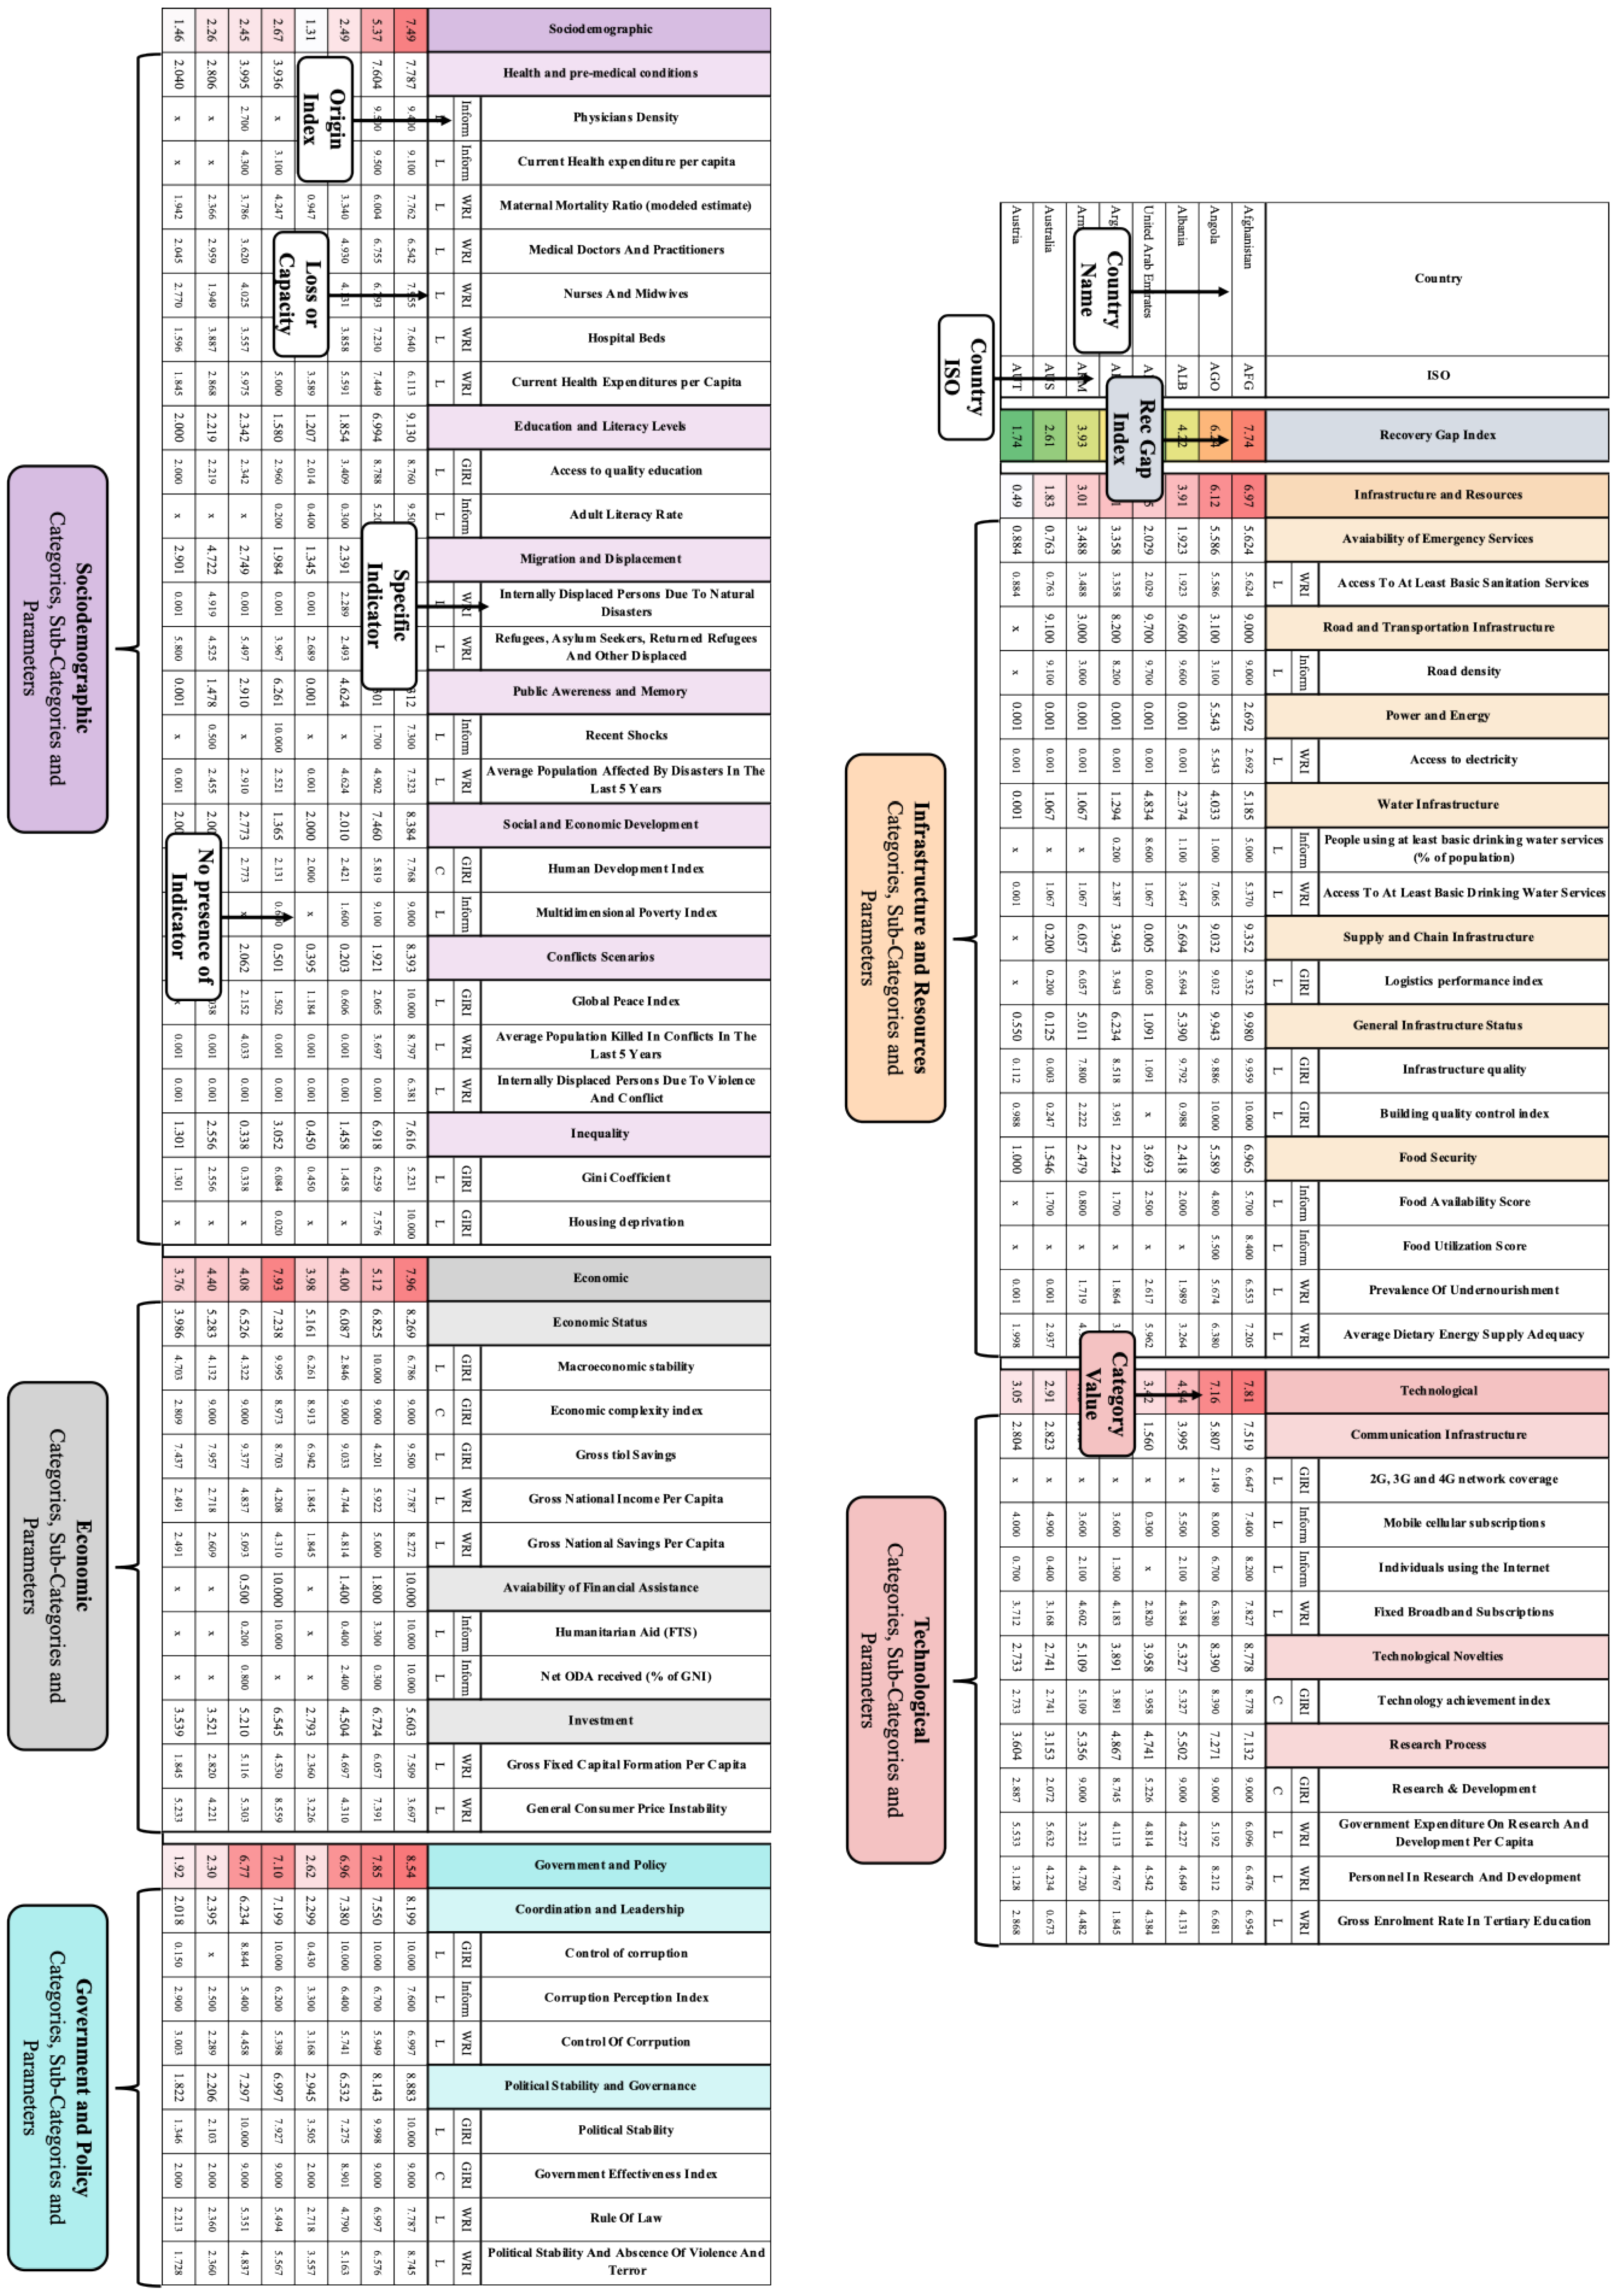
Appendix D
This figure illustrates an example of the Recovery Gap Index (RGI) database, displaying the RGI values and category scores for 169 countries. The database is organized into five main categories, namely infrastructure and resources, technological, sociodemographic, economic, and governance and policy, each further divided into subcategories. The figure showcases the detailed scoring and rankings across these dimensions, providing a comprehensive overview of each country’s capacity to respond to and recover from extreme natural events.
References
- CRED. Annual Disaster Statistical Review 2022: The Numbers and Trends; Centre for Research on the Epidemiology of Disasters (CRED), Université catholique de Louvain: Ottignies-Louvain-la-Neuve, Belgium, 2023. [Google Scholar]
- IPCC. Climate Change 2021: The Physical Science Basis. Contribution of Working Group I to the Sixth Assessment Report of the Intergovernmental Panel on Climate Change; Cambridge University Press: Cambridge, UK, 2021. [Google Scholar]
- UNDRR. Human Cost of Disasters: An Overview of the Last 20 Years 2000–2019; United Nations Office for Disaster Risk Reduction: Geneva, Switzerland, 2020. [Google Scholar]
- Clarke, B.; Otto, F.; Stuart-Smith, R. Extreme Weather Impacts of Climate Change: An Attribution Perspective. Environ. Res. Clim. 2022, 1, 012001. [Google Scholar] [CrossRef]
- Emanuel, K. Downscaling CMIP5 Climate Models Shows Increased Tropical Cyclone Activity Over the 21st Century. Proc. Natl. Acad. Sci. USA 2013, 110, 12219–12224. [Google Scholar] [CrossRef] [PubMed]
- Trenberth, K.E.; Cheng, L.; Jacobs, P.; Zhang, Y.; Fasullo, J. Hurricane Harvey Links to Ocean Heat Content and Climate Change Adaptation. Earth’s Future 2018, 6, 730–744. [Google Scholar] [CrossRef]
- Li, H.; Xu, E.; Zhang, H. Examining the Coupling Relationship Between Urbanization and Natural Disasters: A Case Study of the Pearl River Delta, China. Int. J. Disaster Risk Reduct. 2021, 58, 102373. [Google Scholar] [CrossRef]
- Botzen, W.J.W.; Deschenes, O.; Sanders, M. The Economic Impacts of Natural Disasters: A Review of Models and Empirical Studies. Rev. Environ. Econ. Policy 2019, 13, 167–188. [Google Scholar] [CrossRef]
- Wahlstrom, M.; Guha-Sapir, D. The Human Cost of Weather Related Disasters 1995–2015; UNISDR: Geneva, Switzerland, 2015. [Google Scholar]
- Ward, P.J.; de Ruiter, M.C.; Daniell, J.E.; Blauhut, V.; Bloemendaal, N.; Veldkamp, T.I.E. Bending the Trend: Towards Sustainable Flood and Drought Risk Solutions Through Understanding Global Disaster Risk. Environ. Res. Lett. 2020, 15, 113005. [Google Scholar]
- Kunreuther, H.; Michel-Kerjan, E.; Doherty, N.; Grace, M.; Klein, R.; Pauly, M. At War with the Weather: Managing Large-Scale Risks in a New Era of Catastrophes; MIT Press: Cambridge, MA, USA, 2013. [Google Scholar]
- Mori, N.; Takahashi, T.; Yasuda, T.; Yanagisawa, H. Survey of 2011 Tohoku Earthquake Tsunami Inundation and Run-Up. Geophys. Res. Lett. 2013, 38, L00G14. [Google Scholar]
- Kishore, N.; Marqués, D.; Mahmud, A.; Kiang, M.V.; Rodriguez, I.; Fuller, A.; Leaning, J. Mortality in Puerto Rico After Hurricane Maria. N. Engl. J. Med. 2018, 379, 162–170. [Google Scholar] [CrossRef]
- Ward, P.J.; Blauhut, V.; Bloemendaal, N.; Daniell, J.E.; de Ruiter, M.C.; Duncan, M.J.; Emberson, R.; Jenkins, S.F.; Kirschbaum, D.; Kunz, M. Natural Hazard Risk Assessments at the Global Scale. Nat. Hazards Earth Syst. Sci. 2020, 20, 1069–1082. [Google Scholar] [CrossRef]
- Ridder, N.N.; Pitman, A.J.; Westra, S.; Ukkola, A.M.; Do, H.X.; Bador, M.; Hirsch, A.L.; Evans, J.P.; Di Luca, A.; Zscheischler, J. Global Hotspots for the Occurrence of Compound Events. Nat. Commun. 2020, 11, 5956. [Google Scholar] [CrossRef]
- Gall, M.; Borden, K.A.; Cutter, S.L. When Do Losses Count? Six Fallacies of Natural Hazards Loss Data. Bull. Am. Meteorol. Soc. 2014, 90, 799–809. [Google Scholar] [CrossRef]
- de Ruiter, M.C.; Van Loon, A.F. The Challenges of Dynamic Vulnerability and How to Assess It. iScience 2022, 25, 105592. [Google Scholar] [CrossRef] [PubMed]
- Zscheischler, J.; Martius, O.; Westra, S.; Bevacqua, E.; Raymond, C.; Horton, R.M.; van den Hurk, B.; AghaKouchak, A.; Jézéquel, A.; Mahecha, M.D.; et al. A Typology of Compound Weather and Climate Events. Nat. Rev. Earth Environ. 2020, 1, 333–347. [Google Scholar] [CrossRef]
- Raymond, C.; Horton, R.M.; Zscheischler, J.; Martius, O.; AghaKouchak, A.; Balch, J.; Bowen, S.G.; Camargo, S.J.; Hess, J.; Kornhuber, K.; et al. Understanding and Managing Connected Extreme Events. Nat. Clim. Change 2020, 10, 611–621. [Google Scholar] [CrossRef]
- De Angeli, S.; Borre, A.; Trasforini, E.; Ottonelli, D.; Boni, G.; Ghizzoni, T. A mathematical framework to quantify physical damages from concurrent and consecutive hazards. In Proceedings of the EGU General Assembly 2024, Vienna, Austria, 14–19 April 2024. EGU24-9418. [Google Scholar] [CrossRef]
- Folke, C. Resilience: The emergence of a perspective for social–ecological systems analyses. Glob. Environ. Change 2006, 16, 253–267. [Google Scholar] [CrossRef]
- Cutter, S.L.; Barnes, L.; Berry, M.; Burton, C.; Evans, E.; Tate, E.; Webb, J. A place-based model for understanding community resilience to natural disasters. Glob. Environ. Change 2008, 18, 598–606. [Google Scholar] [CrossRef]
- Gill, J.C.; Malamud, B.D. Reviewing and Visualizing the Interactions of Natural Hazards. Rev. Geophys. 2014, 52, 680–722. [Google Scholar] [CrossRef]
- Trogrlić, R.Š.; Duncan, M.J.; Wright, G.B.; Adeloye, A.J.; Mwale, F.D. Multi-Hazard Early Warning Systems: A Case Study of Malawi. Int. J. Disaster Risk Reduct. 2024, 85, 103075. [Google Scholar]
- Tierney, K. The Social Roots of Risk: Producing Disasters, Promoting Resilience; Stanford University Press: Stanford, CA, USA, 2014. [Google Scholar]
- De Groeve, T.; Poljansek, K.; Vernaccini, L.; Ispra, J.R.C. Index for Risk Management (INFORM) Concept and Methodology Report; European Commission: Luxembourg, 2014. [Google Scholar]
- GFDRR. GIRI Is the First Fully Probabilistic Model to Identify and Estimate the Risk Associated with Major Hazards; Global Facility for Disaster Reduction and Recovery: Washington, DC, USA, 2023. [Google Scholar]
- Manyena, B.; Machingura, F.; O’Keefe, P. Disaster Resilience Integrated Framework for Transformation (DRIFT): A new approach to theorising and operationalising resilience. World Dev. 2019, 123, 104587. [Google Scholar] [CrossRef]
- Birkmann, J.; Welle, T.; Krause, D.; Wolfertz, J.; Suarez, D.-C.; Setiadi, N. World Risk Index: Concept and Results. In World Risk Report 2011; Bündnis Entwicklung Hilft: Berlin, Germany, 2011. [Google Scholar]
- Birkmann, J.; Cardona, O.D.; Carreño, M.L.; Barbat, A.H.; Pelling, M.; Schneiderbauer, S.; Welle, T. Framing Vulnerability, Risk and Societal Responses: The MOVE Framework. Nat. Hazards 2013, 67, 193–211. [Google Scholar] [CrossRef]
- Panwar, V.; Sen, S. Economic Impact of Natural Disasters: An Empirical Re-Examination. Margin J. Appl. Econ. Res. 2019, 13, 217–241. [Google Scholar] [CrossRef]
- Nofal, O.M.; Amini, K.; Padgett, J.E.; van de Lindt, J.W.; Rosenheim, N.; Darestani, Y.M.; Enderami, A.; Sutley, E.J.; Hamideh, S.; Duenas-Osorio, L. Multi-Hazard Socio-Physical Resilience Assessment of Hurricane-Induced Hazards on Coastal Communities. Resilient Cities Struct. 2023, 2, 67–81. [Google Scholar] [CrossRef]
- Hofmann, R. Resilience to Extreme Natural Events: Concepts, Measures, and Policies. In Natural Hazards: Impacts, Adjustments, and Resilience; Springer: Cham, Switzerland, 2021. [Google Scholar]
- Khan, M.T.I.; Anwar, S.; Sarkodie, S.A. Do Natural Disasters Affect Economic Growth? The Role of Human Capital, Foreign Direct Investment, and Infrastructure Dynamics. Heliyon 2023, 9, e01118. [Google Scholar] [CrossRef] [PubMed]
- Marin-Ferrer, M.; Vernaccini, L.; Poljansek, K. Index for Risk Management INFORM Concept and Methodology Report—Version 2017; European Commission: Luxembourg, 2017. [Google Scholar] [CrossRef]
- INFORM Index. INFORM Report 2023: Shared Evidence for Managing Crises and Disasters; Publication Office of the European Union: Luxembourg, 2023. [Google Scholar]
- Peduzzi, P.; Dao, H.; Herold, C.; Mouton, F. Assessing Global Exposure and Vulnerability Towards Natural Hazards: The Disaster Risk Index. Nat. Hazards Earth Syst. Sci. 2009, 9, 1149–1159. [Google Scholar] [CrossRef]
- Haque, D.M.E.; Mimi, A.; Mazumder, R.K. Evaluation of Natural Hazard Risk for Coastal Districts of Bangladesh Using the INFORM Approach. Int. J. Disaster Risk Reduct. 2020, 46, 101517. [Google Scholar] [CrossRef]
- INFORM. INFORM Annual Report 2024; European Commission: Luxembourg, 2024. [Google Scholar]
- Visser, H.; De Bruin, S.; Martens, A.; Knoop, J. What Users of Global Risk Indicators Should Know. Glob. Environ. Change 2020, 63, 102120. [Google Scholar] [CrossRef]
- Birkmann, J.; Cutter, S.L.; Rothman, D.S.; Welle, T.; Garschagen, M.; van Ruijven, B.; Setiadi, N. Scenarios for Vulnerability: Opportunities and Constraints in the Context of Climate Change and Disaster Risk. Clim. Change 2022, 133, 53–68. [Google Scholar] [CrossRef]
- Depietri, Y. The Social–Ecological Dimension of Vulnerability and Risk to Natural Hazards. Sustain. Sci. 2020, 15, 1001–1015. [Google Scholar] [CrossRef]
- Garschagen, M.; Doshi, D.; Reith, J.; Hagenlocher, M. Global Patterns of Disaster and Climate Risk—An Analysis of the Consistency of Leading Index-Based Assessments and Their Results. Clim. Change 2021, 167, 11. [Google Scholar] [CrossRef]
- Ramli, M.W.A.; Alias, N.E.B.; Yusop, Z. Disaster Risk Index: A Review of Local Scale Concept and Methodologies. IOP Conf. Ser. Earth Environ. Sci. 2020, 479, 012023. [Google Scholar] [CrossRef]
- UNU-EHS Official Website—World Risk Report 2022. Available online: https://www.worldriskreport.org (accessed on 2 September 2024).
- GFDRR. The Making of a Riskier Future: How Our Decisions Are Shaping Future Disaster Risk; Global Facility for Disaster Reduction and Recovery: Washington, DC, USA, 2016. [Google Scholar]
- UNESCAP. Multi-Hazard Risk to Exposed Stock and Critical Infrastructure in Central Asia: A Probabilistic Risk Assessment Approach Using the GIRI Model. Available online: https://repository.unescap.org/bitstream/handle/20.500.12870/4109/ESCAP-2020-WP-Multi-Hazard-Risk.pdf?sequence=1&isAllowed=y (accessed on 2 September 2024).
- Dhakal, S.; Zhang, L. A Social Welfare–Based Infrastructure Resilience Assessment Framework: Toward Equitable Resilience for Infrastructure Development. Nat. Hazards Rev. 2023, 24, 04022043. [Google Scholar] [CrossRef]
- Shiozaki, Y.; Nagamatsu, S.; Sato, K.; Bhattacharya, Y. A Systematic Literature Review of Empirical Validation of Disaster Resilience Indicators. Int. J. Disaster Risk Reduct. 2024, 111, 104681. [Google Scholar] [CrossRef]
- Rodriquez, C.; Mendes, J.M.; Romão, X. Identifying the Importance of Disaster Resilience Dimensions Across Different Countries Using the Delphi Method. Sustainability 2022, 14, 9162. [Google Scholar] [CrossRef]
- Burton, C.G.; Asad, K.M.B.; Musori, M. The Validation and Development of Composite Indices for Measuring Vulnerability and Recovery Potential from Earthquakes; Global Earthquake Model Foundation: Pavia, Italy, 2019. [Google Scholar]
- Saja, A.M.A.; Goonetilleke, A.; Teo, M.; Ziyath, A.M. A critical review of social resilience assessment frameworks in disaster management. Int. J. Disaster Risk Reduct. 2019, 35, 101096. [Google Scholar] [CrossRef]
- Cutter, S.L.; Boruff, B.J.; Shirley, W.L. Social Vulnerability to Environmental Hazards. In Hazards, Vulnerability and Environmental Justice, 2nd ed.; Routledge: London, UK, 2008; pp. 115–132. [Google Scholar]
- Hallegatte, S.; Rentschler, J.; Rozenberg, J. Lifelines: The Resilient Infrastructure Opportunity; World Bank: Washington, DC, USA, 2019. [Google Scholar]
- World Bank. The Role of Insurance in Disaster Risk Reduction; World Bank: Washington, DC, USA, 2023. [Google Scholar]
- OECD. Handbook on Constructing Composite Indicators; OECD: Paris, France, 2008. [Google Scholar]
- Saltelli, A.; Tarantola, S.; Campolongo, F.; Ratto, M. Sensitivity Analysis in Practice: A Guide to Assessing Scientific Models; John Wiley & Sons Inc.: Hoboken, NJ, USA, 2004. [Google Scholar]
- Greco, S.; Ishizaka, A.; Tasiou, M.; Torrisi, G. On the Methodological Framework of Composite Indices: A Review of the Issues of Weighting, Aggregation, and Robustness. Soc. Indic. Res. 2019, 141, 61–94. [Google Scholar] [CrossRef]
- Jongman, B.; Ward, P.J.; Aerts, J.C. Global Exposure to River and Coastal Flooding: Long-Term Trends and Changes. Glob. Environ. Change 2015, 31, 1–12. [Google Scholar] [CrossRef]
- Thieken, A.H.; Petrow, T.; Kreibich, H.; Merz, B. Insurability and Mitigation of Flood Losses in Private Households in Germany. Risk Anal. 2016, 26, 383–395. [Google Scholar] [CrossRef]
- Shi, P.; Kasperson, R.; Jia, H. World Atlas of Natural Disaster Risk; Springer: Cham, Switzerland, 2020. [Google Scholar]
- Kelman, I.; Gaillard, J.C.; Mercer, J. Climate Change’s Role in Disaster Risk Reduction’s Future: Beyond Vulnerability and Resilience. Int. J. Disaster Risk Sci. 2022, 13, 1–10. [Google Scholar] [CrossRef]
- Lopez-Carr, D.; Marter-Kenyon, J.; Pricope, N. A Spatial Analysis of Climate-Related Disaster Resilience Across the Globe. Environ. Res. Lett. 2022, 17, 024017. [Google Scholar]
- Balk, D.; Montgomery, M.R.; Todd, M. Urbanization and Vulnerability to Climate-Related Disasters in Europe and the Americas. Environ. Res. Lett. 2021, 16, 045008. [Google Scholar]
- Cutter, S.L.; Emrich, C.T.; Mitchell, J.T. Disaster Resilience Indicators for Benchmarking Baseline Conditions. J. Homel. Secur. Emerg. Manag. 2015, 12, 585–602. [Google Scholar] [CrossRef]
- Neumayer, E.; Plümper, T. The Gendered Nature of Natural Disasters: The Impact of Catastrophic Events on the Gender Gap in Life Expectancy, 1981–2002. Ann. Assoc. Am. Geogr. 2017, 97, 551–566. [Google Scholar] [CrossRef]
- Boin, A.; McConnell, A.; ’t Hart, P. Governing the Pandemic: The Politics of Navigating a Mega-Crisis; Palgrave Macmillan: London, UK, 2020. [Google Scholar]
- Fuchs, S.; Kuhlicke, C.; Meyer, V. Editorial for the Special Issue: Vulnerability and Resilience to Natural Hazards–Theory and Practical Application. Nat. Hazards 2021, 101, 1–9. [Google Scholar]
- United Nations. Early Warnings for All Initiative; United Nations: New York, NY, USA, 2023; Available online: https://www.un.org/en/climatechange/early-warnings-for-all (accessed on 2 September 2024).
- Sendai Framework Monitor. Target G: Global Status of Multi-Hazard Early Warning Systems; Sendai Framework Monitor: Geneva, Switzerland, 2022. [Google Scholar]
- Basher, R. Global Early Warning Systems for Natural Hazards: Systematic and People-Centred. Philos. Trans. R. Soc. A Math. Phys. Eng. Sci. 2006, 364, 2167–2182. [Google Scholar] [CrossRef]
- Cools, J.; Innocenti, D.; O’Brien, S. Lessons from Flood Early Warning Systems. Environ. Sci. Policy 2016, 58, 117–122. [Google Scholar] [CrossRef]
- Swiss Re Institute. Restoring Resilience: The Need to Reload Shock Absorbing Capacity; Sigma Report; Swiss Re: Zurich, Switzerland, 2022; Available online: https://www.swissre.com/institute/research/sigma-research/sigma-2022-03.html (accessed on 2 September 2024).
- European Insurance and Occupational Pensions Authority (EIOPA). Natural Catastrophe Dashboard; EIOPA: Frankfurt, Germany, 2023; Available online: https://www.eiopa.europa.eu/tools-and-data/dashboard-insurance-protection-gap-natural-catastrophes_en (accessed on 2 September 2024).
- Surminski, S.; Oramas-Dorta, D. Flood Insurance Schemes and Climate Adaptation in Developing Countries. Int. J. Disaster Risk Reduct. 2014, 7, 154–164. [Google Scholar] [CrossRef]
- Birkmann, J.; Welle, T. Enhancing Disaster Resilience Through Legal and Policy Frameworks: Insights from the World Risk Index. J. Extreme Events 2022. [Google Scholar]
Disclaimer/Publisher’s Note: The statements, opinions and data contained in all publications are solely those of the individual author(s) and contributor(s) and not of MDPI and/or the editor(s). MDPI and/or the editor(s) disclaim responsibility for any injury to people or property resulting from any ideas, methods, instructions or products referred to in the content. |
© 2025 by the authors. Licensee MDPI, Basel, Switzerland. This article is an open access article distributed under the terms and conditions of the Creative Commons Attribution (CC BY) license (https://creativecommons.org/licenses/by/4.0/).