Article

Trade-Offs and Synergies Among Habitat, Water, and Carbon Services Driven by Urbanization: A Spatiotemporal Analysis of the Chang-Zhu-Tan City Cluster

School of Civil and Environmental Engineering, Hunan University of Technology, Zhuzhou 412007, China
*
Author to whom correspondence should be addressed.
Sustainability 2025, 17(23), 10596; https://doi.org/10.3390/su172310596
Submission received: 8 August 2025 / Revised: 31 October 2025 / Accepted: 24 November 2025 / Published: 26 November 2025

Abstract

Understanding the evolution of ecosystem services (ESs) is crucial for sustainable development in rapidly urbanizing regions. This study quantifies the spatiotemporal evolution of habitat quality (HQ), water yield (WY), and carbon storage (CS) in the Chang-Zhu-Tan City Cluster (CZTCC) of China from 2000 to 2020. Results showed that rapid urbanization—where construction land expanded from 2.78% to 7.40% of the area—was the primary driver of ES degradation. Specifically, low-quality habitat (HQ) areas expanded by 162%, and total carbon storage (CS) declined by 1.83% (11.78 Tg C), while regional WY fluctuated with precipitation. Inter-service relationships also became more conflictual: the trade-off between HQ and WY intensified (Pearson’s R strengthened from −0.696 to −0.735), a persistent trade-off between WY and CS was observed (e.g., R = −0.607 in 2020), while the HQ-CS synergy remained stable and strong (R > 0.88). These findings highlight escalating ecological conflicts and offer a robust scientific basis for optimizing land use to manage ES trade-offs and promote sustainable development.

1. Introduction

Ecosystem services (ESs) are the benefits provided by natural systems that support human well-being and development, including both direct products and indirect functions derived from ecological processes [1]. Rapid global urbanization is a primary driver of the worldwide contraction and degradation of natural ecosystems, alongside other factors such as climate change, land-use policies, and socioeconomic shifts. Globally, as cities expand, natural land cover is often replaced by built-up areas, leading to habitat loss, altered water cycles, and decreased carbon storage. These trends are observed globally, as urbanization continues to increase in many regions [2,3,4]. The Intergovernmental Science-Policy Platform on Biodiversity and Ecosystem Services (IPBES) reports a decline in 78% (14 out of 18) of monitored global ecosystem services since 1970 [5]. This persistent degradation represents a critical challenge to global sustainability objectives and the aspiration for harmonious human-ecological relationships. In China, the combined pressures of urbanization and climate change exacerbate these trends, causing widespread ecosystem degradation and reducing the provision of ecosystem services. The 20th National Congress of the Communist Party of China signaled a strategic shift by highlighting the principle that “lucid waters and lush mountains are invaluable assets” and calling for planning based on the harmonious coexistence between humanity and nature [6]. This policy shift elevates ecological conservation to a national priority, thereby emphasizing the need for rigorous scientific assessments of ES dynamics to inform spatial planning and support the development of China’s “ecological civilization”.
The conceptual roots of ecosystem services trace back to the mid-19th century. Scholars such as George Marsh [7] and Arthur Tansley [8] made early contributions by exploring the links between natural resources and ecological balance. The field gained momentum in the mid-20th century, driven by the rise of the “natural capital” concept and increasing awareness of the ecological impacts of environmental pollution [9,10]. Influential works by scholars and institutions, such as SCEP [11], Holdren [12], and Walter [13], expanded the theoretical foundation of ecosystem service functions. The term “ecosystem services” was first systematically defined by the Ehrlich research group [14]. Building on this work, Costanza et al. [15] further developed this framework to quantify the global economic value of ES. Gretchen Daily’s work transitioned the concept from theory to application, creating a foundation for modern ES research [16]. The Millennium Ecosystem Assessment (MA) [17] formalized a global framework at the start of the 21st century, categorizing ES into four types: provisioning, regulating, cultural, and supporting services. While significant progress has been made in understanding ES, much of the existing literature still focuses on static assessments or general models. This study contributes to the field by providing a spatiotemporal analysis of ES in a rapidly urbanizing region. By examining the interactions among habitat quality, carbon storage, and water yield, this analysis offers a clearer understanding of the evolving trade-offs and synergies within urban ecosystems. Such an approach is essential for advancing the study of ES dynamics, particularly in landscapes subject to rapid urbanization.
The Integrated Valuation of Ecosystem Services and Tradeoffs (InVEST) model is a widely used tool for quantitative ES assessment. Developed by the Natural Capital Project [18], InVEST employs a production function approach to link changes in ecosystem structure and function with service flows affecting human well-being [19]. InVEST’s current version (3.15.0) can assess multiple services across both terrestrial and marine ecosystems. Its main advantages include multi-scale applicability and spatially explicit analysis, enabling detailed mapping and valuation of services [20]. As a result, InVEST has been widely applied across diverse ecosystems, including islands [21], grasslands [22], watersheds [23,24], and forests [25]. In China, InVEST has facilitated extensive research across various regions [26], such as mountainous areas [27], karst landscapes [28], the Loess Plateau [29], and multiple river basins [30]. Additionally, there is increasing academic interest in applying InVEST to urban agglomerations, where natural and anthropogenic factors interact in complex ways [31,32]. This interest is accompanied by advancements in method validation [33,34] and multi-model integration approaches [35,36,37,38]. Metropolitan areas, as engines of economic growth, are key drivers of global urbanization. However, intense human activity and land-use changes fundamentally alter ecosystem structure and function, leading to degradation and imbalances in ES supply and demand [39,40,41]. Therefore, understanding the spatiotemporal dynamics of ES trade-offs and synergies is crucial for aligning regional development with ecological conservation goals [42,43,44]. Prior studies often report a strong synergy between habitat quality and carbon storage due to their shared reliance on healthy vegetation. The relationship with water yield is often context-dependent, presenting as a trade-off in forested catchments but a potential synergy in arid regions [45]. However, the temporal evolution of these trade-offs and synergies in highly dynamic landscapes remains underexplored. Characterized by frequent land-use changes and complex administrative structures, these rapidly transforming regions often serve as “policy laboratories” where innovative strategies, such as ecological redlining or new land financing models, are first implemented and evaluated before wider application. While a static analysis captures only a snapshot of ES trade-offs, a dynamic, long-term perspective is crucial because it reveals the trajectory and rate of ecological change. This approach can identify accelerating degradation or weakening synergies, providing early warning for policymakers and enabling proactive, adaptive management rather than reactive responses. While studies in other regions have documented shifts in ES bundles over time, the evolution of specific interdependencies between habitat quality, water yield, and carbon storage under the unique pressures of rapid, state-led urbanization in a humid environment remains insufficiently understood.
The Chang-Zhu-Tan City Cluster (CZTCC) offers an insightful case study for understanding the interplay between urbanization and ecological protection. As the first nationally designated metropolitan area in Central China and a pioneer of “resource-conserving and environment-friendly” development, it presents a unique context where rapid urbanization coincides with strong ecological protection efforts. This highlights the intense conflict between development and conservation in China’s rapidly emerging inland urban clusters, which may face ecological pressures distinct from, or even exceeding, those in established coastal megaregions. Unlike the contiguous green belts or broad-scale redlines seen in coastal megacities, the CZTCC’s policy focuses on preserving a central, cross-jurisdictional “Ecological Green Heart,” making it a distinct natural laboratory to study the evolving interactions among key ecosystem services—habitat quality (HQ), water yield (WY), and carbon storage (CS). Therefore, to elucidate these complex dynamics, this study utilizes land use data from 2000 to 2020 and other geospatial datasets for the CZTCC, applying the InVEST model and correlation analysis to: (1) characterize the spatiotemporal changes in HQ, WY, and CS and their evolving trade-offs and synergies and (2) quantify the impacts of land use change on these services. By integrating these three interrelated services, this study offers a comprehensive understanding of the regional ecosystem’s trajectory. This approach builds on the established utility of similar ES assessment in informing policy, such as China’s Ecological Protection Redlines and European green infrastructure planning [46,47]. The results are therefore expected to provide a robust scientific basis for optimizing land-use strategies and promoting sustainable development in other rapidly urbanizing metropolitan areas.

2. Materials and Methods

2.1. Study Area

The Chang-Zhu-Tan City Cluster (CZTCC) is situated in the central-eastern part of Hunan Province, China (27°12′–28°40′ N, 111°54′–114°15′ E, Figure 1). As the first metropolitan area in Central China to receive national-level development planning approval, it serves as an important part of the Yangtze River Middle Reaches Urban Agglomeration. The study area comprises 19 counties and districts of the CZTCC, covering approximately 18,900 km2. The region has a diverse topography with elevation decreasing from its periphery toward the central areas. It is characterized by a subtropical humid climate, with an average annual precipitation of 1200–1800 mm and an average annual temperature of 16–19 °C. These climatic parameters, defined by thermally intensive, high-humidity summers and temperate, precipitation-abundant winters, facilitate intensive agricultural productivity and have established the region’s substantial ecological capital. Socioeconomically, the region exhibits intense urbanization pressure. While historical data for the precise study area boundaries is limited, statistics for the slightly larger Chang-Zhu-Tan urban agglomeration show its urbanization rate had already reached 63.39% by 2012 [48]. In 2021, while comprising only 22.41% of the provincial population with 14.84 million residents, its urbanization rate reached 80.9%, exceeding the provincial average by 21.2 percentage points [49]. This developmental intensity creates a direct tension with the region’s valuable ecological assets, most notably the “Ecological Green Heart,” which is designated as a critical ecological barrier [50]. Therefore, this sharp contrast between state-driven rapid urbanization and mandated ecological conservation makes CZTCC a highly representative case study for examining the evolution of ecosystem services in China’s rapidly developing inland regions.

2.2. Data Sources

The primary geospatial datasets used in this study were obtained from the Resource and Environmental Science and Data Center, Chinese Academy of Sciences (RESDC) and the Harmonized World Soil Database (HWSD). The meteorological data from RESDC are gridded datasets derived from interpolation of ground station observations. Additional biophysical parameters necessary for the InVEST models, including habitat threat factors and carbon pool densities, were derived from relevant regional literature (Table 1). Crop evapotranspiration (ET0) was calculated using the modified Hargreaves equation:
ET0 = 0.0013 × 0.408 × RA × (Tav + 17) × (TD − 0.0123P)0.76
where Tav is the monthly average temperature (°C), TD is the temperature difference between monthly maximum and minimum values (°C), RA is extraterrestrial radiation, and P is the monthly precipitation (mm). Plant Available Water Content (PAWC) was estimated based on soil texture data (i.e., the proportions of sand, silt, and clay) and soil organic matter content obtained from the HWSD, using the formula provided in the InVEST user guide, which is based on textural analysis [19]. All spatial datasets were processed using ArcGIS 10.8.2 software (ESRI, Redlands, CA, USA). The datasets were projected to a unified coordinate system (GCS_WGS_1984) and resampled to a spatial resolution of 100 m × 100 m to ensure consistency for model input.

2.3. Methods

This study employed the InVEST model (Version 3.15.0) to quantify selected ecosystem services within the CZTCC. The model operates using spatially explicit inputs—including land use/land cover (LULC), climate data, soil properties, and other biophysical parameters—to quantify, map, and value ecosystem services. The InVEST model is well-suited for this study, as the CZTCC comprises a complex mosaic of urban, rural, and natural systems undergoing rapid LULC change. Unlike more data-intensive models like ARIES or those focused on social values like SolVES, InVEST is specifically designed to simulate ES responses to LULC transformations. Its spatially explicit outputs help identify key areas of ES provision and support the development of spatially targeted management strategies, aligning directly with the study’s objectives. Notably, the accuracy of model outputs depends heavily on the quality and resolution of the input data, as well as on the localization of biophysical parameters.

2.3.1. Habitat Quality

The InVEST Habitat Quality (HQ) model evaluates a landscape’s capacity to support biodiversity by analyzing LULC patterns in conjunction with the spatial distribution and intensity of anthropogenic threats. The resulting HQ index ranges from 0 (lowest) to 1 (highest). The HQ index (Qxj) for a grid cell x in LULC type j is calculated as:
Q xj = H j 1 D xj z D xj z + K z
where Hj is the habitat suitability score for LULC type j (ranging from 0 to 1); Dxj is the total threat level in pixel x with LULC type j; k is the half-saturation constant (set to 0.5 in this study, representing half the maximum degradation score); and z is a scaling parameter (set to a default value of 2.5) [51]. Following the InVEST user manual, the attributes of each threat factor and the sensitivity level of each LULC type to those threats were defined (Table 2 and Table 3). The assigned weights were based on values from previous studies that have successfully applied the HQ model in similar urbanizing landscapes in China. This weighting scheme reflects the disparate ecological impacts of land use types. Urban construction is assigned the maximum weight (1.0) as it causes near-permanent habitat loss, whereas cropland receives a lower weight (0.6) as it represents a less intense, albeit significant, disturbance that can still support some species [52,53,54].

2.3.2. Water Yield

The InVEST Water Yield (WY) model estimates the annual water yield (Yx) for each pixel (x) using the Budyko hydrological curve and the principle of water balance [59]. WY is calculated as the precipitation that is not evapotranspired:
Y x = 1 A E T x P x × P x
where AETx is the annual actual evapotranspiration (mm), and Px is the annual precipitation (mm) for pixel x. Biophysical parameters for each LULC type, including maximum root depth and the vegetation evapotranspiration coefficient (Kc), were assigned based on model documentation and regional literature [52,54]. The Z parameter is an empirical constant that influences the shape of the Budyko curve and reflects regional precipitation patterns and hydrogeological characteristics. Based on values used in comparable studies within the broader Yangtze River basin, which shares a similar subtropical monsoon climate, the Z parameter was set to 0.5 in this study [60]. The parameter areas are detailed in Table 4.

2.3.3. Carbon Storage

The InVEST Carbon Storage (CS) model estimates total carbon storage by summing the contribution of four carbon pools: aboveground biomass (Cabove), belowground biomass (Cbelow), soil organic matter (Csoil), and dead organic matter (Cdead). Carbon density values (t C/ha) for each pool across all LULC types (Table 5) were derived from an extensive review of literature focusing specifically on subtropical ecosystems in Central and Southern China [55,56] to ensure the parameters were regionally appropriate. The selected aboveground biomass density for forests (50.5 t C/ha), while lower than IPCC default ranges for mature primary forests, is representative of the prevalent secondary and managed forests in the study area. The non-zero carbon densities for construction land and water bodies account for carbon stored in urban green infrastructure and aquatic biomass/sediments, respectively, with values derived from studies in comparable subtropical regions of China [57,58]. Total CS (Ctotal) per pixel is calculated as:
C total = C above + C below + C soil + C dead

2.3.4. Ecosystem Service Trade-Off/Synergy Analysis

To examine the interrelationships among HQ, WY, and CS, this study adopted a widely used quantitative approach based on spatial correlation. The operational definitions are as follows: a synergy is identified when two ecosystem services show a statistically significant positive Pearson correlation (p < 0.05), indicating they increase or decrease concurrently. A trade-off is identified when they show a statistically significant negative correlation (p < 0.05), indicating that an increase in one service is associated with a decrease in the other. First, the study area was divided into 19,563 grid cells (1 km × 1 km) using ArcGIS. Mean values for HQ, WY, and CS were extracted for each grid cell across all study years. Subsequently, Pearson correlation coefficient (Rxy) was calculated between each pair of ecosystem services using R software (version 4.5.1), and the strength of the relationship was quantified by the absolute value of correlation coefficient, where a higher value indicates a stronger relationship [61]. The Pearson correlation coefficient is calculated as:
R xy = i = 1 n ( X i X ¯ ) ( Y i Y ¯ ) i = 1 n ( X i X ¯ ) 2 i = 1 n ( Y i Y ¯ ) 2
where Xi and Yi are the values of ecosystem services X and Y in the i-th grid cell, respectively; X ¯ and Y ¯ are the mean values of services X and Y across all grid cells, respectively; and n is the total number of grid cells (19,563).
By analyzing these coefficients over the study period, the temporal dynamics of the ES interrelationships were examined.

2.4. Analytical Framework

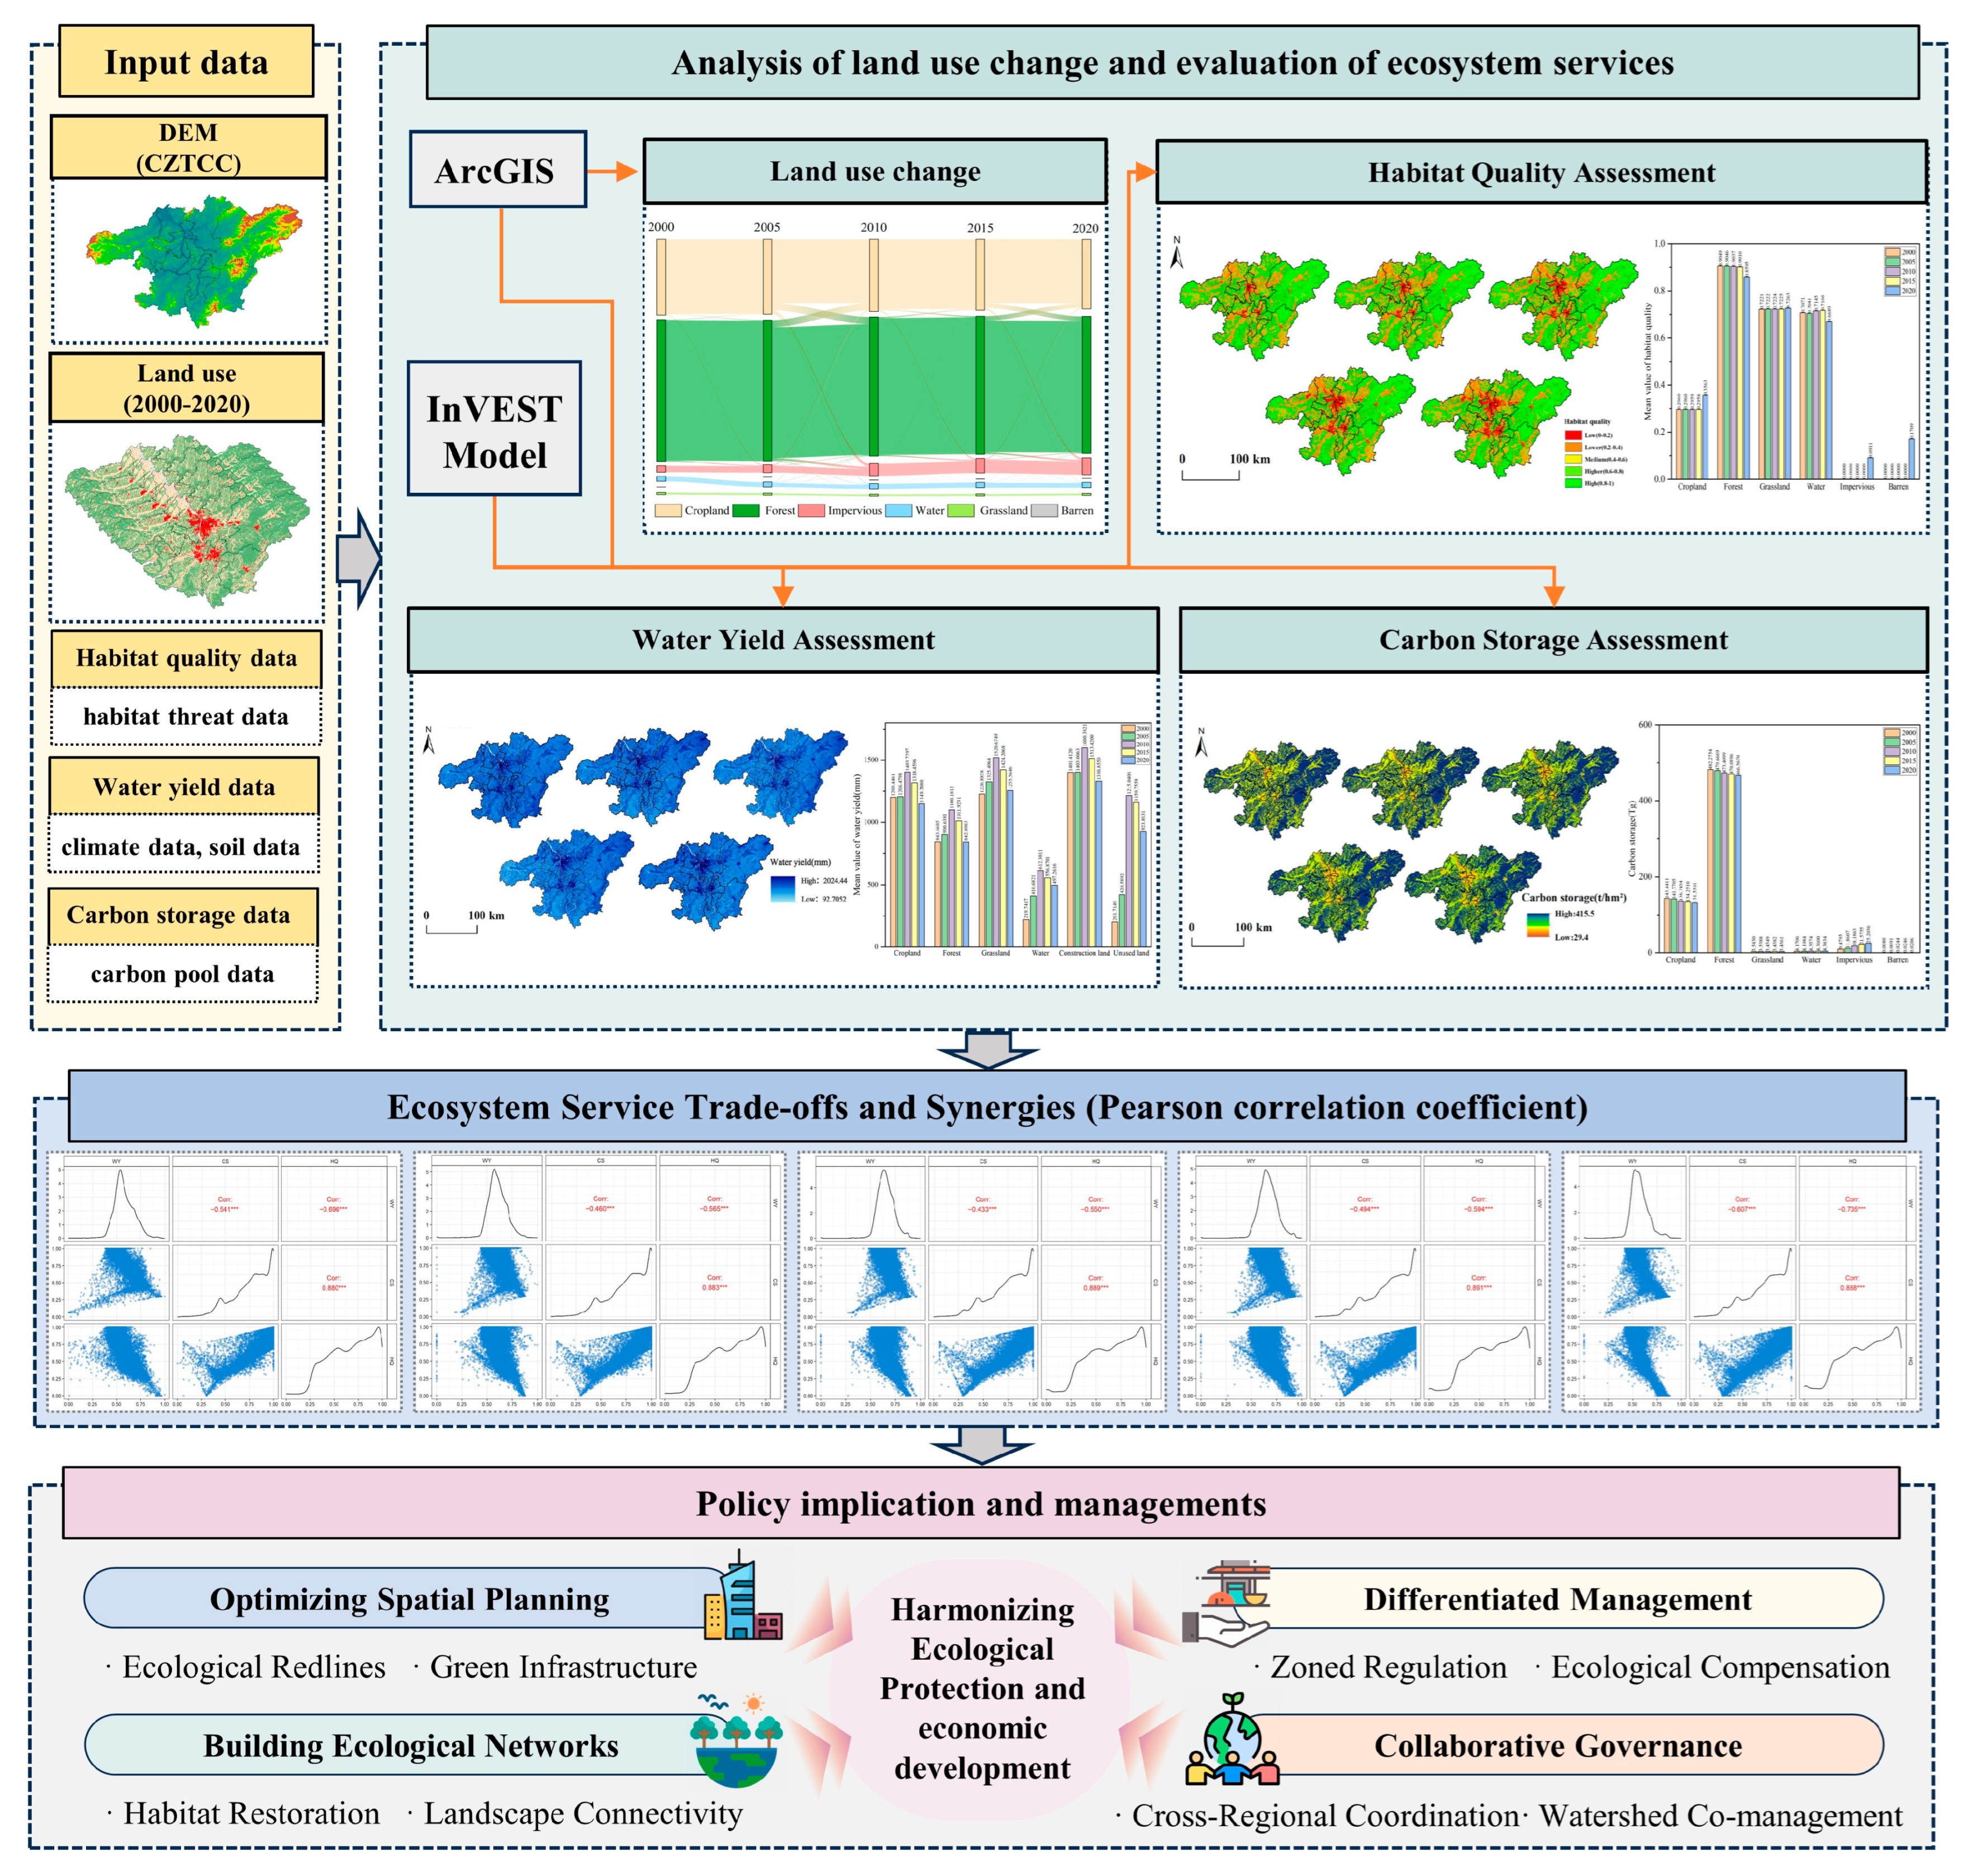
The analytical framework of this study consists of a systematic, multi-stage process. The workflow begins with the collection and preprocessing of multi-source datasets, including LULC, DEM, climate, and soil data. These data were then processed using the InVEST model and ArcGIS to quantify spatiotemporal changes in LULC and the three ecosystem services (HQ, WY, and CS). Specifically, data preprocessing steps included standardizing spatial resolution and aligning datasets to a common coordinate system. The InVEST model was then applied to simulate the three ecosystem services, using the processed data to compute service flows based on ecological processes linked to land use and climate conditions. Finally, Pearson correlation analysis was conducted to explore trade-off/synergy dynamics among the services. This integrated workflow underpins the overall analysis and informs policy-relevant insights, as illustrated in Figure 2.

3. Results

3.1. Analysis of Land Use Change

Analysis of land use/land cover (LULC) data from 2000 to 2020 revealed significant landscape transformations in the CZTCC, primarily driven by rapid urbanization (Table 6). Land use change matrices coupled with Sankey flow visualization (Figure 3) elucidate the principal land cover transformation patterns, quantifying net losses of 517.43 km2 of agricultural land and 375.1 km2 of forest cover. Concurrently, construction land expanded by 873.51 km2, increasing from 526.64 km2 in 2000 to 1400.15 km2 in 2020. Cropland experienced the largest gross loss in area, primarily converted to construction land (461.05 km2), and to a lesser extent, to forest land. The latter conversion is partially attributable to ecological restoration policies, such as the “Grain for Green” program. Forest land also underwent substantial conversion, losing 394.95 km2 to construction land, which reflects strong urban expansion pressures. This loss was partially compensated for by cropland converted into forest under the aforementioned restoration initiatives. The expansion of construction land, driven by regional development demands, occurred mainly on former cropland and forest land, together contributing 855.99 km2 of the total increase. Changes in water bodies, grassland, and unused land were relatively minimal. In summary, the dominant LULC change in the CZTCC from 2000 to 2020 was the conversion of cropland and forest land into construction land, significantly altering the structure and function of the regional ecosystem.

3.2. Spatial-Temporal Characteristics of Ecosystem Service Functions

The InVEST model was applied to evaluate habitat quality (HQ), water yield (WY), and carbon storage (CS) in the years 2000, 2005, 2010, 2015, and 2020. ArcGIS was subsequently used for spatial analysis and mapping to reveal the spatiotemporal dynamics of these services.

3.2.1. Spatiotemporal Characteristics of HQ in the CZTCC

Overall habitat quality (HQ) in the CZTCC showed a declining trend from 2000 to 2020, with the most rapid deterioration occurring before 2010. HQ was categorized into five levels (Low: 0–0.2, Lower: 0.2–0.4, Medium: 0.4–0.6, Higher: 0.6–0.8, High: 0.8–1.0), each exhibiting distinct temporal trends (Table 7). The proportion of High and Higher HQ areas—representing core habitats—decreased from 62.90% in 2000 to 60.87% in 2020. The most notable change was a 162% increase in Low HQ areas, which coincided with the peak period of urban expansion. This decline was driven by the expansion of construction land into former cropland and forested areas. The slower rate of decline after 2010 may be attributable to the implementation of the “Overall Plan for the Ecological Green Heart Area of the Chang-Zhu-Tan City Cluster” and its associated conservation policies.
Spatially, HQ exhibited a highly heterogeneous distribution across the study area (Figure 4). High HQ values were concentrated in the forested and mountainous eastern and southern peripheries, areas characterized by high ecological integrity and minimal anthropogenic disturbance. In contrast, low HQ values were prevalent in the flat central plains, corresponding to zones dominated by intensive agriculture and urban development. During the study period, low HQ zones expanded outward from urban cores, particularly in the northern area of Changsha, contributing to the fragmentation of adjacent high HQ areas. This process was most apparent at the urban-forest fringe, creating zones of notable habitat degradation where previously contiguous ecosystems were encroached upon by new development. Notably, the designated “Ecological Green Heart” consistently maintained High HQ levels, serving as an ecological stronghold amid surrounding low-quality zones and highlighting the effectiveness of targeted conservation policies.

3.2.2. Spatiotemporal Characteristics of WY in the CZTCC

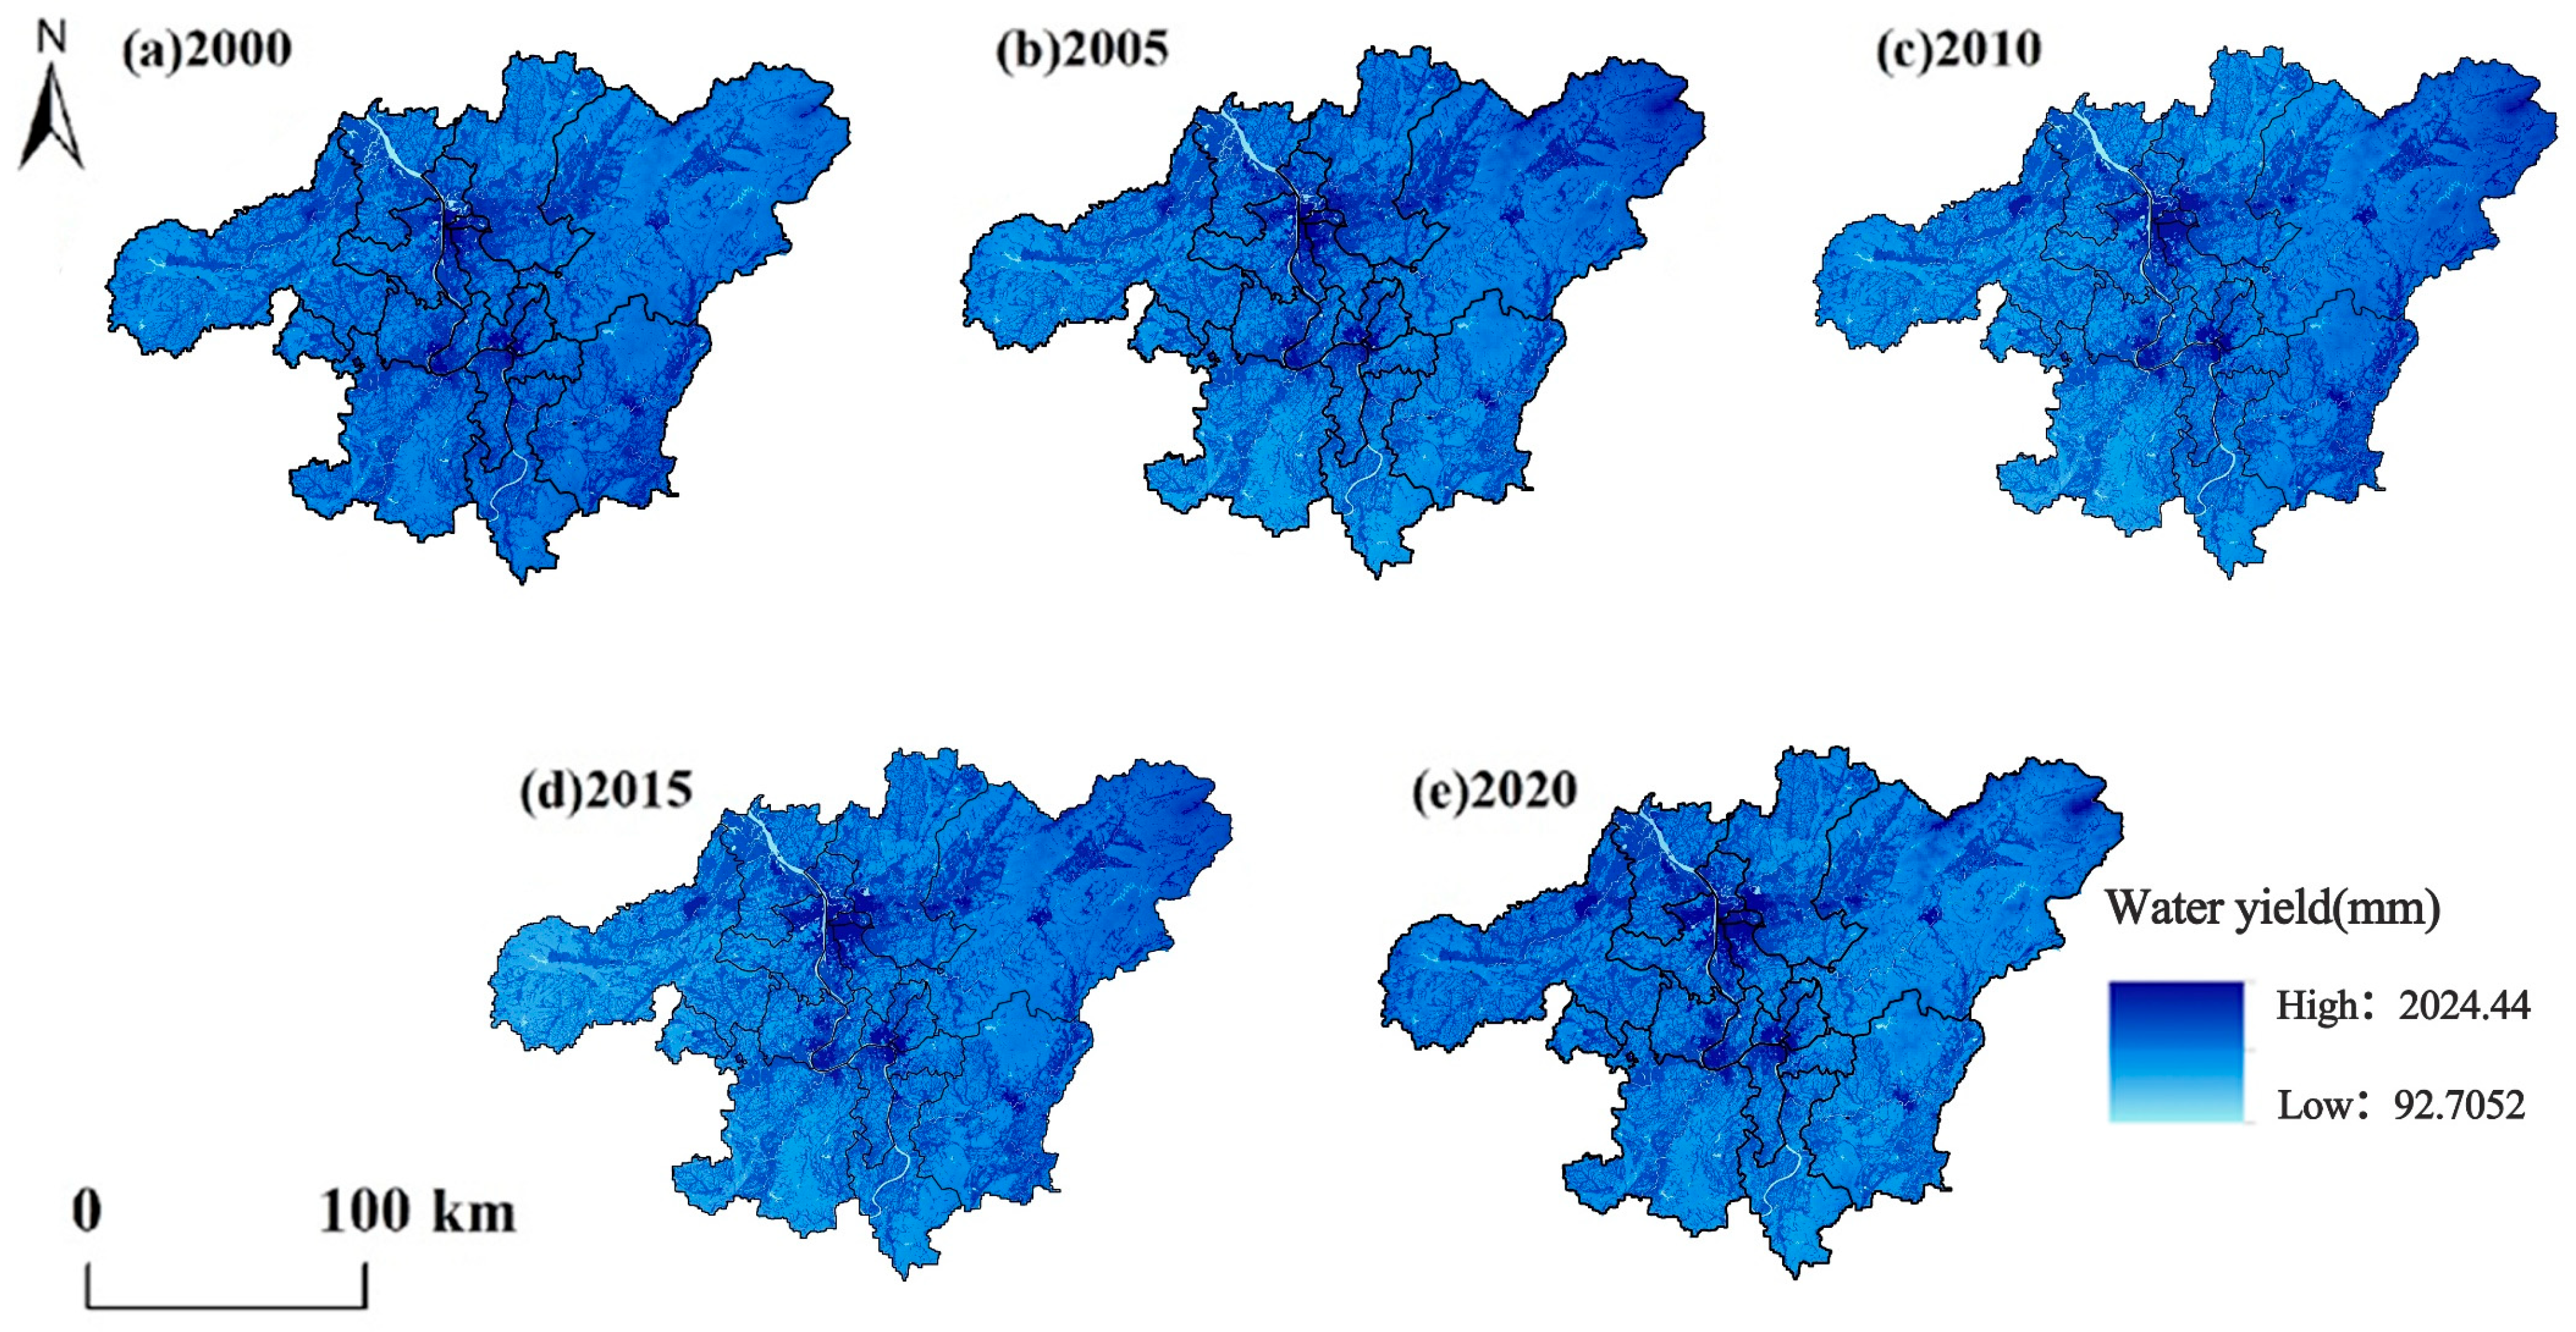
Total water yield (WY) in the CZTCC fluctuated considerably, showing an “inverted V-shaped” trend that peaked in 2010 (Table 8). This trend was strongly correlated with interannual precipitation variability (Figure 5), indicating that short-term climate variability was the primary driver of temporal WY changes.
The spatial distribution of WY was mainly influenced by LULC type, exhibiting a highly consistent pattern over time (Figure 6). A sharply delineated contrast was observed between the urban cores and the surrounding natural landscapes. High WY values were consistently concentrated in the central urban areas of Changsha, Zhuzhou, and Xiangtan. This pattern is attributable to the fact that impervious surfaces in construction areas and lower vegetation cover in cropland both reduce evapotranspiration and infiltration, leading to higher surface runoff. This mechanism resulted in a distinct “bullseye” of high-water yield centered on the urban cores of Changsha, Zhuzhou, and Xiangtan, which sharply contrasted with the low-yield “green ring” of the surrounding forested mountains. Conversely, low WY values were observed in forested, high-elevation areas, where higher rates of canopy interception, evapotranspiration, and soil infiltration combine to conserve water. To quantitatively verify the dominant role of urbanization on these spatial patterns, we analyzed the correlation between WY and the proportion of impervious surfaces over time (Figure S1). A consistent positive correlation was found in all years. More significantly, the strength of this relationship, measured by the coefficient of determination (R2), showed a clear increasing trend from 0.1967 in 2000 to 0.3759 in 2020. This trend provides strong evidence that as urbanization intensified, impervious surfaces became an increasingly dominant driver shaping the region’s hydrological patterns.

3.2.3. Spatiotemporal Characteristics of CS in CZTCC

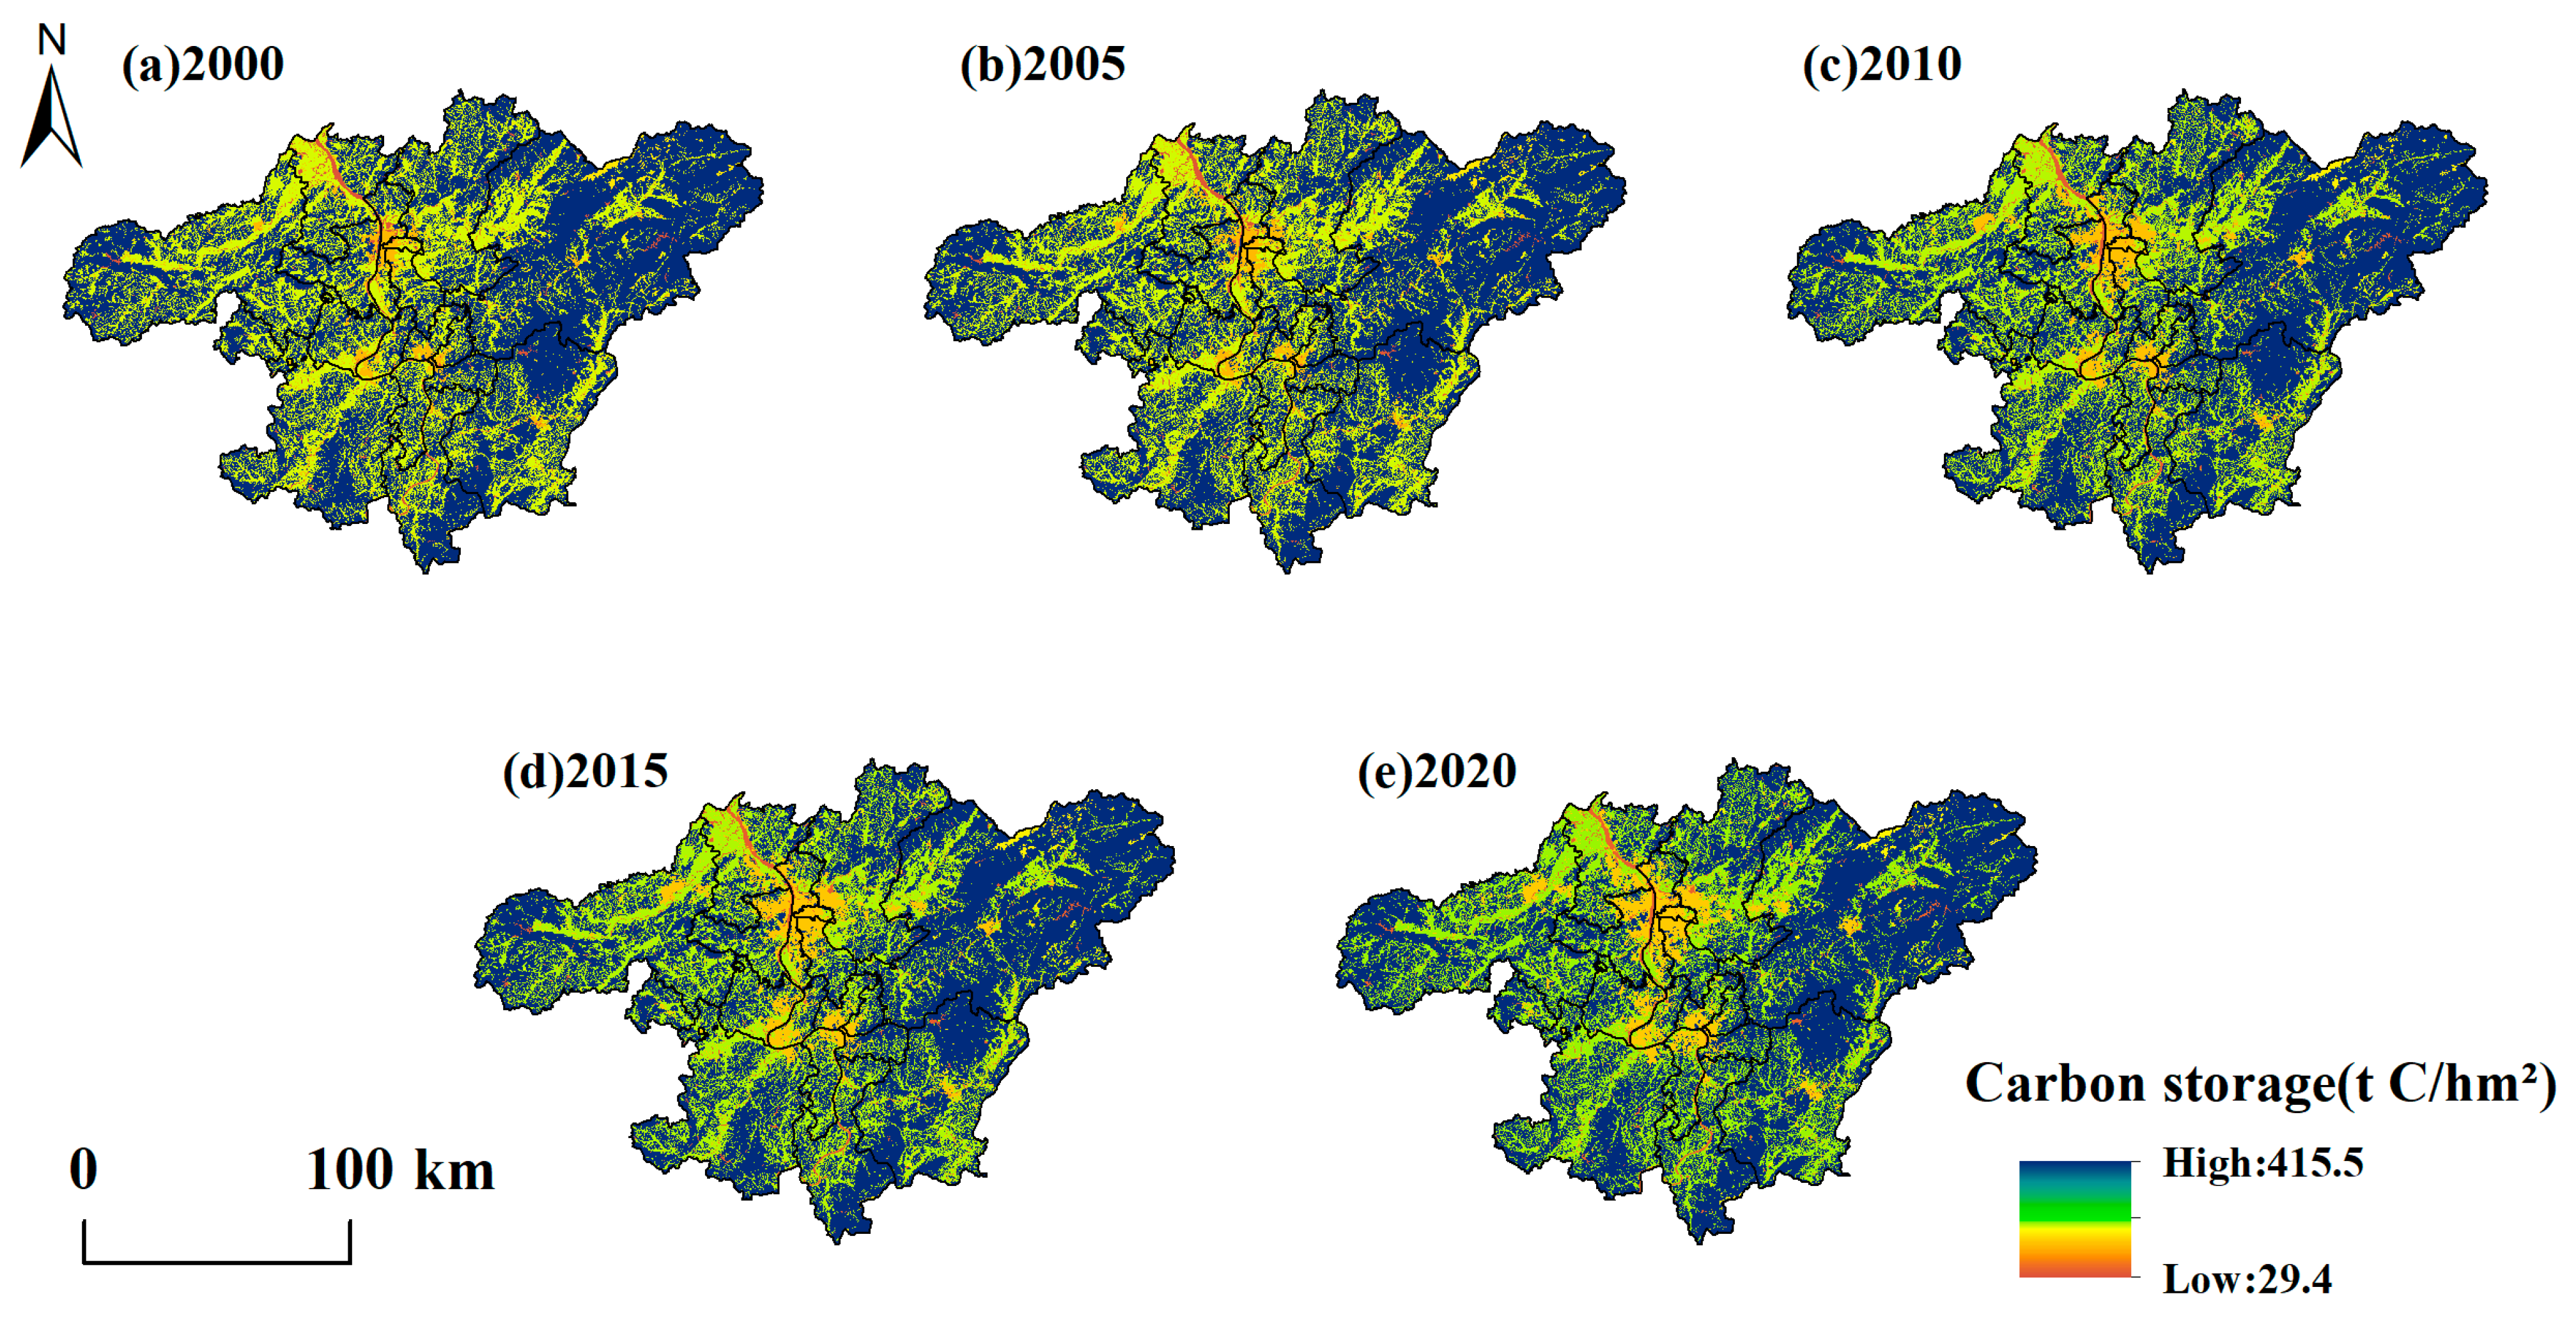
Total carbon storage (CS) in the region continuously declined, decreasing by 11.78 Tg C (a 1.83% loss) from 642.92 Tg C in 2000 to 631.14 Tg C in 2020 (Table 9). This trend reflects a weakening of the region’s carbon sequestration capacity, primarily driven by the conversion of carbon-rich forests and croplands into low-density construction land.
The spatial distribution of CS was largely shaped by LULC and closely mirrored the pattern of HQ (Figure 7). High CS densities were found in the forest-dominated eastern, southern, and western peripheries, which function as the region’s principal carbon reservoirs due to their high biomass and soil organic carbon levels. Conversely, low CS densities corresponded to the central urbanized region and surrounding cropland. While this overall pattern remained consistent, low-density zones gradually expanded outwards from urban cores. The impact of this expansion was most severe in the peri-urban zones, where the conversion of high-density forest carbon sinks to construction land drove the majority of the carbon loss. This proliferation of construction land at the expense of high-carbon ecosystems was the primary driver of the total CS loss.

3.3. Study on the Response of Ecosystem Service Functions to Land Use Change

To further elucidate the influence of LULC on ecosystem services, the temporal variations in HQ, WY, and CS across major LULC types were analyzed.

3.3.1. HQ Changes by Land Use Type

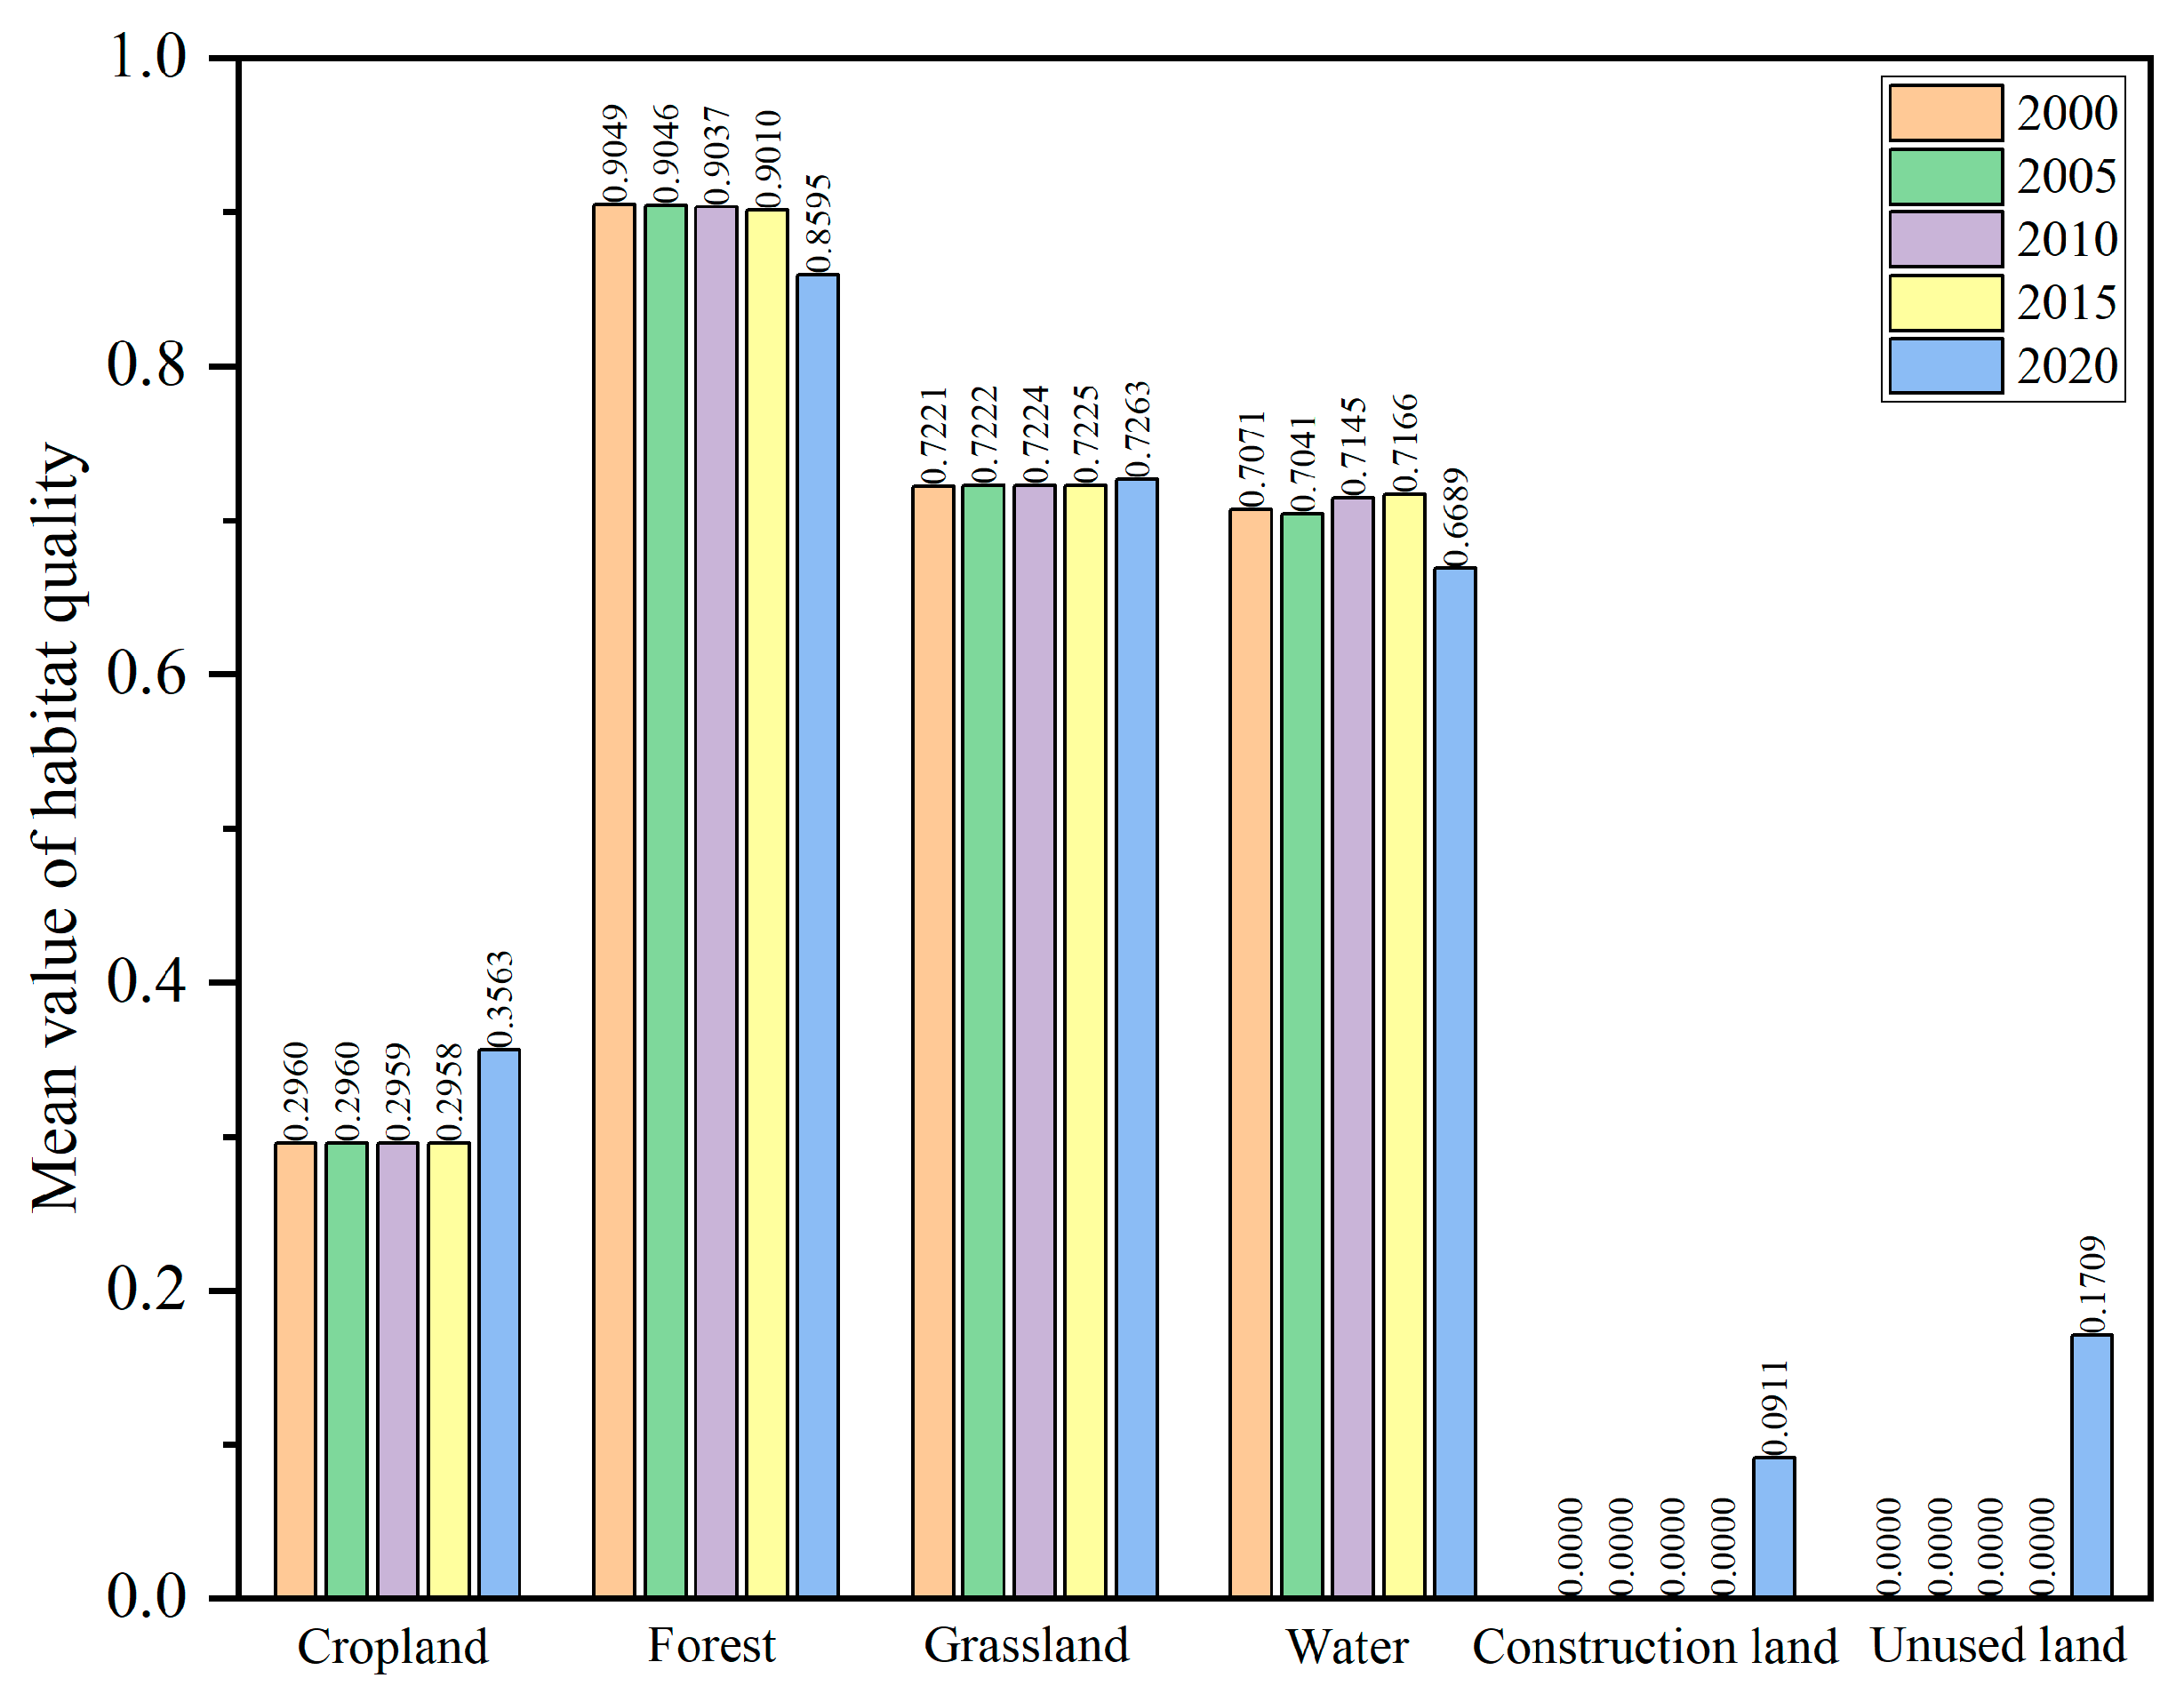
Average HQ values varied significantly among LULC types, consistently ranking from highest to lowest as: Forest > Grassland > Water > Cropland > Unused Land > Construction Land (Figure 8). Forests consistently exhibited the highest HQ values (mean > 0.9), highlighting their essential role in sustaining regional biodiversity. By contrast, cropland exhibited substantially lower HQ values (mean ≈ 0.3), reflecting the effects of intensive agriculture and landscape fragmentation. As expected, both construction and unused lands had negligible habitat quality. Although forest land experienced a slight decline in average HQ after 2015—likely due to edge effects from urban expansion—other LULC types showed modest improvements. Notably, the average HQ of construction land increased markedly after 2015. This counterintuitive trend likely reflects the positive efforts of urban greening initiatives (e.g., urban park development) and ecological restoration efforts, suggesting that targeted interventions can enhance habitat functionality even in highly modified landscapes.

3.3.2. WY Changes by Land Use Type

Average annual WY also showed significant variation across LULC types, ranking from highest to lowest as: Construction Land > Grassland > Cropland > Forest > Unused Land > Water (Figure 9). Construction land consistently exhibited the highest mean WY throughout the study period. This is attributable to its impervious surfaces, which significantly reduce evapotranspiration and infiltration, thereby maximizing surface runoff. Grassland and cropland also generated relatively high WY due to lower vegetation cover compared to forests. In contrast, forests produced lower WY as a result of high canopy interception, transpiration, and soil infiltration rates, demonstrating their strong capacity for water conservation. Temporal variations in WY across all LULC types were synchronized, closely aligned with annual precipitation fluctuations, peaking in the wet year of 2010. This reinforces the conclusion that, while LULC governs the spatial pattern of WY, inter-annual climate variability is the dominant driver of its temporal changes.

3.3.3. CS Changes by Land Use Type

Total carbon storage (CS) contributions varied greatly across LULC types, with the ranking: Forest > Cropland > Construction Land > Water > Grassland > Unused Land (Figure 10). Forests served as the primary carbon reservoir, storing an average of 474.4 Tg C—equivalent to 74.5% of the total ecosystem carbon in the CZTCC. This can be attributed to their high carbon densities in both biomass and soil organic matter pools. Cropland ranked second in carbon storage, with the majority of its carbon stored in soil organic matter. Over time, total carbon stored in forests and cropland steadily declined throughout the study period, primarily due to their conversion into construction land. Conversely, total carbon stored in construction land increased, reflecting its expanding footprint. This highlights a key dynamic: although the conversion of natural and agricultural land to urban use results in a net regional carbon loss, urban greening initiatives may offer localized and partial mitigation.

3.4. Ecosystem Service Trade-Offs and Synergies in the CZTCC

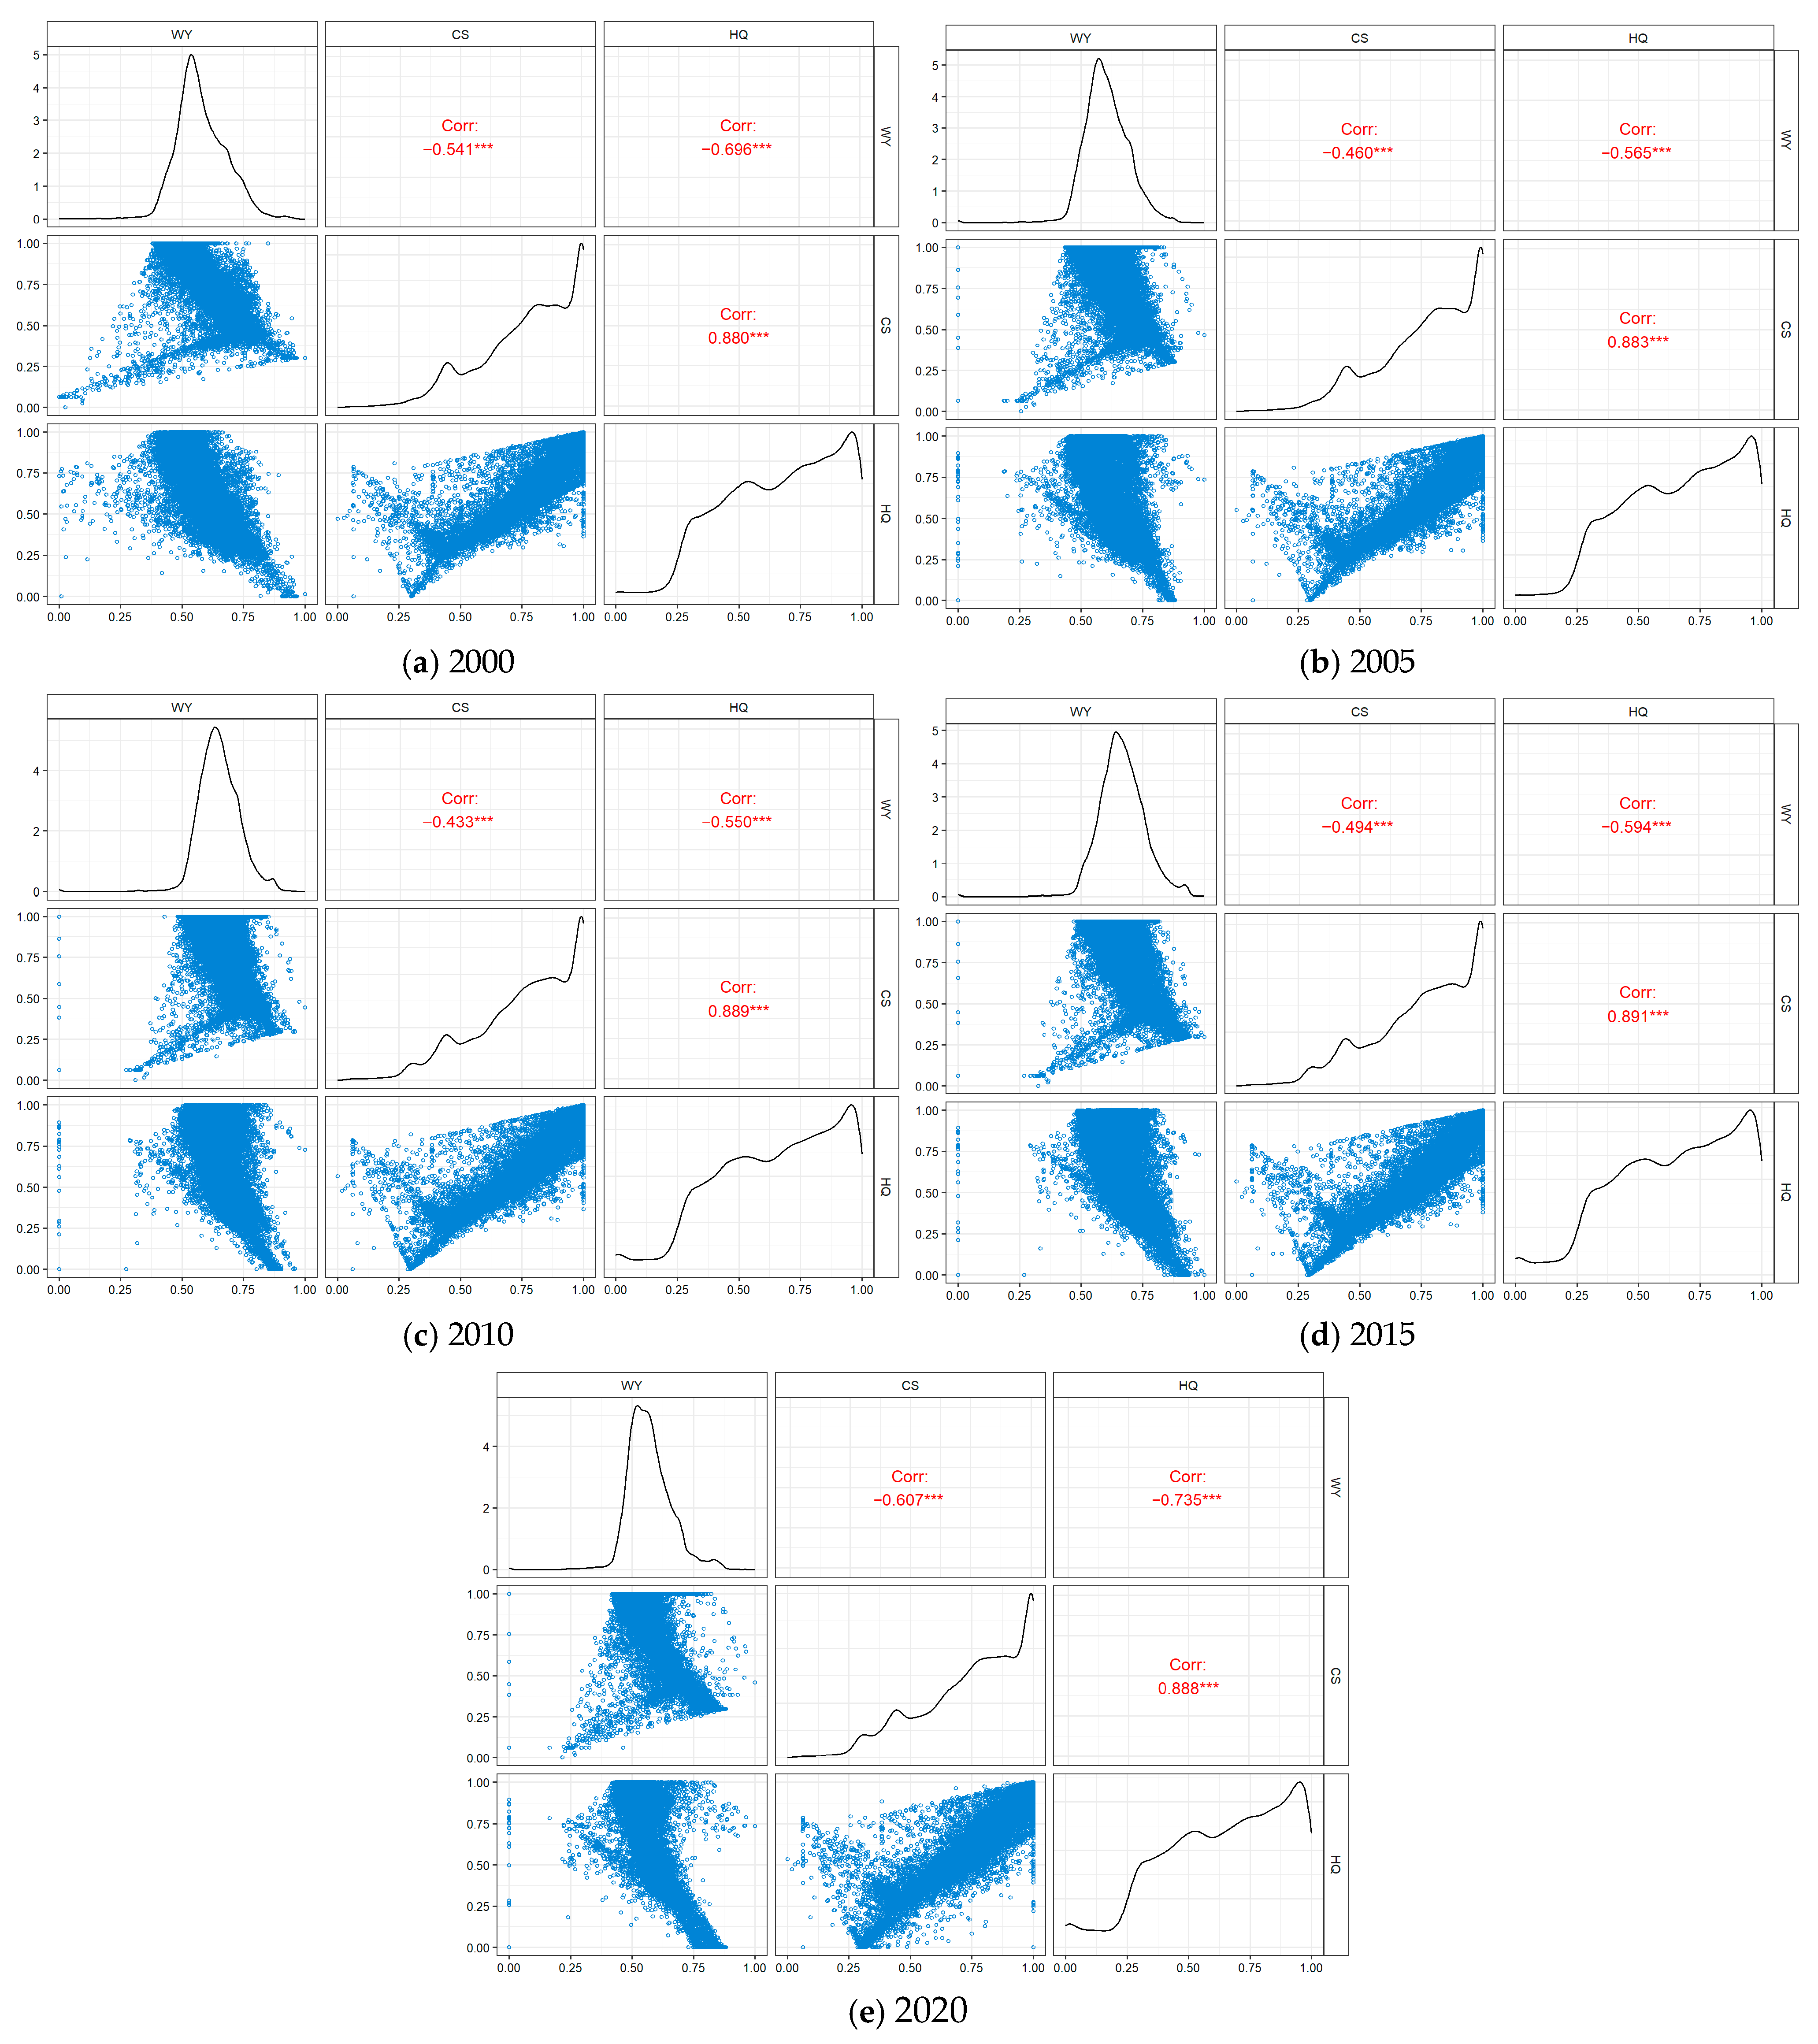
Pairwise Pearson correlation analyses were conducted to evaluate trade-offs (negative correlations) and synergies (positive correlations) among HQ, WY, and CS for each study year (Figure 11). The results revealed statistically significant and evolving relationships that highlight the escalating conflicts driven by urbanization.
A consistently strong synergistic relationship was observed between HQ and CS (R > 0.88, p < 0.001) throughout the entire study period. This positive correlation, which remained stable over two decades, indicates their shared reliance on healthy, high-biomass vegetation cover, particularly in forest ecosystems.
In contrast, the trade-off between HQ and WY showed a dynamic evolution. The negative correlation first weakened from −0.696 in 2000 to its lowest point of −0.550 in 2010, and then intensified sharply to its strongest point of −0.735 in 2020 (p < 0.001). This pattern confirms that landscapes with higher habitat quality—such as contiguous forests—tend to produce lower water yield due to increased infiltration and evapotranspiration, a conflict that became more pronounced as low-HQ urban areas with high WY expanded.
Furthermore, a persistent and significant trade-off was found between WY and CS across all years, with R values ranging from −0.433 to −0.607 (p < 0.001). This trade-off is mechanistically driven by land use: high-carbon ecosystems like forests are effective at water retention and thus have lower water yield, while low-carbon, impervious urban areas generate high runoff. The consistent presence of this trade-off underscores the inherent conflict between water regulation and carbon sequestration services in this rapidly urbanizing landscape.

4. Discussion

4.1. Evolving Ecosystem Service Relationships and Their Underlying Drivers

The analysis reveals a critical trend in the CZTCC from 2000 to 2020: the relationships between key ecosystem services became increasingly conflictual. Specifically, the results demonstrate a stable, strong synergy between habitat quality (HQ) and carbon storage (CS) but persistent and complex trade-offs between water yield (WY) and both HQ and CS. This finding points to escalating ecological pressure driven by rapid urbanization, a conclusion that aligns with studies in other metropolitan regions [40,42,44,62,63,64,65] while also demonstrating a dynamic, long-term degradation of ecosystem multifunctionality.
This evolving conflict is primarily driven by the observed land use changes. Forest ecosystems serve as the primary reservoirs of both high-quality habitat and carbon storage [66,67], contributing 74.5% of the total CS. This shared reliance on intact, high-biomass ecosystems underpins the stable HQ-CS synergy observed throughout the study period. Simultaneously, the expansion of impervious surfaces in newly constructed areas intensifies surface runoff, exacerbating the trade-off between habitat quality (high HQ in forests) and water yield. Crucially, our findings also highlight a persistent and significant trade-off between WY and CS. This conflict is mechanistically direct: high-carbon ecosystems like forests are effective at water retention (leading to low WY), while low-carbon, impervious urban areas generate high WY. The consistent presence of this trade-off underscores the fundamental challenge of simultaneously managing water regulation and climate mitigation (carbon sequestration) services in this rapidly urbanizing landscape. Furthermore, the trade-off between HQ and WY demonstrated a non-linear temporal pattern throughout the study period. The trade-off initially weakened from 2000 to 2010, a period coinciding with rising annual precipitation that culminated in the wettest year of the study in 2010 (Figure 5). This weakening suggests a climatic buffering effect, where exceptionally high water availability temporarily masked the underlying hydrological differences between land cover types by saturating even high-infiltration forest soils. However, after 2010, as precipitation returned to normal levels and urbanization accelerated, the trade-off intensified substantially, reaching its peak in 2020. This intensification reflects the cumulative and increasingly dominant impact of expanding impervious surfaces on the regional hydrology.
Notably, this trade-off is mediated by biophysical factors, a link that can be understood through our input data. For instance, the HWSD data used in this study indicates that the forested, mountainous peripheries—which correspond to the high-HQ, low-WY zones in the results—are generally characterized by soils with higher organic matter and textures conducive to infiltration. In contrast, the central plains are dominated by agricultural soils that are often more compacted, or by sealed surfaces in urban areas, both of which reduce infiltration and lead to the higher WY observed in these low-HQ. These soil properties, along with topography and vegetation root depth, are critical in explaining the mechanism behind the observed ES trade-offs. For instance, in 2010—the year with the highest recorded precipitation—the HQ-WY trade-off was weakest, suggesting that high water availability can temporarily buffer the hydrological impact of land use change. These findings emphasize that managing ecosystem services in isolation is inadequate. Instead, a holistic framework that accounts for the dynamic and interrelated nature of multiple services is essential for ensuring long-term ecosystem resilience.

4.2. The Role and Limits of Targeted Conservation Policy

The observed ES conflicts are contextualized by China’s shifting macro-policy priorities. Intensified urbanization during the study period, particularly following the 2008 global financial crisis, reflects a national focus on economic stimulus. In response, the establishment of the Chang-Zhu-Tan “Ecological Green Heart” exemplifies a targeted conservation effort, embodying the principles of the national “Ecological Civilization” initiative promoted after 2015. Although a quantitative assessment was precluded by the lack of official boundary data, spatial evidence from this study strongly suggests the policy has been effective (Figure 4). The large, contiguous forested area corresponding to the “Ecological Green Heart” consistently maintained the highest HQ levels (dark green areas) over the 20-year period, standing in stark contrast to the expanding low-HQ urban and agricultural lands surrounding it. By acting as an ecological stronghold that strictly regulates land conversion, the policy has been crucial for stabilizing regional HQ and CS. This conservation strategy of defining a core ecological zone to buffer against intense development pressure mirrors successful initiatives like London’s Green Belt and other international ecological networks [68,69].
However, the policy’s limits are also evident. A slight decline in average HQ even within the protected forests, coupled with continued degradation immediately outside the zone, indicates persistent pressure from urban expansion. This underscores that static protected areas, while essential, are insufficient on their own. They require complementary strategies, continuous monitoring, and adaptive management to ensure long-term effectiveness.

4.3. Implications for Regional Sustainable Development and Policy

The dual findings—of escalating regional ES conflicts and the partial success of targeted conservation—provide a clear mandate for future policy. The degradation of HQ and the intensification of trade-offs threaten regional biodiversity and ecosystem resilience, while the reduction in CS undermines contributions to national “Dual Carbon” climate mitigation goals. As the CZTCC is a core part of the Yangtze River Economic Belt, managing these trade-offs is fundamental to the region’s high-quality development and ecological protection mandate.
Based on these findings, several integrated recommendations can be proposed to promote sustainable development in the CZTCC and similar regions: (1) Strengthen ecological consideration in spatial planning. Integrate ecosystem service assessments into land use planning to define inviolable ecological protection boundaries. For example, based on the observed importance of large, contiguous habitats for maintaining high HQ (Figure 4), this could involve designating all existing forest patches larger than a certain threshold (e.g., 10 km2) as primary conservation zones. Promote green infrastructure (e.g., sponge cities, urban green spaces) in developed areas to enhance local services and mitigate negative impacts such as excessive runoff. (2) Build and optimize regional ecological networks. Move beyond isolated protected areas by identifying key ecological source areas and corridors based on HQ assessments. Implement restoration projects to connect fragmented habitats, particularly enhancing connectivity to the “ecological green heart” to improve landscape integrity. To counter the zones of habitat fragmentation identified in this spatial analysis, this could include establishing ecological corridors with evidence-based targets, such as a suggested minimum width of 100 m, to link core protected areas. (3) Implement differentiated ecological management. Enforce strict protection in core areas while exploring ecological compensation mechanisms in urban fringe zones to incentivize conservation. For the vulnerable urban fringe, where the results of this study show the most acute habitat degradation, policies could translate general goals into measurable suggestions, such as aiming to maintain a minimum of 40% high-quality forest cover within designated peri-urban buffer zones. Promote eco-friendly agricultural practices to improve cropland HQ and CS. (4) Strengthen cross-regional collaborative governance. Establish formal governance mechanisms among the Chang-Zhu-Tan municipalities to manage transboundary resources like the Xiangjiang River watershed and maintain regional habitat connectivity, which transcend administrative boundaries. Successful implementation requires that these ecological recommendations be integrated with rigorous assessments of economic costs and social acceptance, supported by suitable economic incentives and adaptive policy frameworks tailored to local realities.

4.4. Limitations and Future Research

This study has several limitations, presenting opportunities for future research. First, the accuracy of the results is subject to limitations from both the input data resolution and parameter localization. While the 100 m resolution is appropriate for a regional-scale trend analysis, it may fail to capture fine ecological changes in heterogeneous landscapes like urban-rural fringe areas. Likewise, the model parameters, while carefully selected from regional literature, were not locally calibrated with field-based measurements (e.g., soil sampling for carbon density and vegetation surveys for biomass) or validated against local ground station records. Future research would therefore be significantly strengthened by employing higher-resolution data and more comprehensive field-based parameter calibration. Second, the scope of this assessment was limited to three key regulating and supporting services. A more comprehensive evaluation could include other critical services, such as soil conservation, microclimate regulation, and cultural services, or provide a more detailed assessment of biodiversity maintenance beyond the proxy of habitat quality. Third, this study did not quantitatively assess the impact of specific policies on land use change. Future research could employ frameworks such as the Driver–Pressure–State–Impact–Response (DPSIR) model to better explore the complex interplay between policy drivers and ecosystem service outcomes. Fourth, this study’s regional-scale analysis did not specifically focus on ecotones (e.g., the urban-rural fringe), where trade-offs are often most pronounced. Future research employing gradient analysis could provide deeper insights into the mechanisms of ES interactions within these sensitive transitional landscapes. Fifth, while the conclusions of this study are valid for a humid, subtropical context, they are not universally applicable. The nature of ES trade-offs would likely differ in other climatic zones, such as in water-scarce northern cities where increased water yield may be a synergistic service, warranting comparative studies to explore these differences. Finally, our study is subject to certain methodological limitations. To test the stability of our conclusions against parameter uncertainty, we conducted a sensitivity analysis on the forest carbon density value (Supplementary Table S1), which confirmed our findings on CS decline are robust. However, the reliance on Pearson correlation is a key limitation. This method is susceptible to inflated significance from spatial autocorrelation and cannot capture non-linear relationships. Future research should therefore employ spatially explicit techniques, such as Geographically Weighted Regression (GWR), to account for spatial non-stationarity and control for confounding variables like precipitation and topography. A formal uncertainty analysis to generate uncertainty bands for our maps, along with methods to explore non-linearities, would also be a valuable next step.

5. Conclusions

This study assessed the spatiotemporal dynamics of habitat quality (HQ), water yield (WY), and carbon storage (CS), and their interrelationships, in the CZTCC from 2000 to 2020. The main conclusions are as follows:
(1) Urbanization drove significant ecosystem services degradation, with the rapid expansion of construction land at the expense of cropland and forests being the primary driver. This was evidenced by a sharp deterioration in overall HQ, with low-quality habitat areas expanding by 162%, a net loss of 1.83% in total CS, and a spatial redistribution of WY towards developed areas.
(2) Forest ecosystems are essential for regional ecological security. Forests play a vital role in sustaining high levels of both HQ and CS, contributing to 74.5% of the region’s total carbon storage. The encroachment of construction on forest land was identified as the primary driver of the decline in these critical services, emphasizing the need to protect remaining forest resources. Additionally, targeted urban greening can provide partial, localized mitigation for habitat loss.
(3) Ecosystem service relationships are dynamic and increasingly conflictual. A strong and stable synergy was consistently observed between HQ and CS (R > 0.88). Concurrently, persistent and significant trade-offs were identified between WY and both HQ and CS, with the trade-off between HQ and WY showing a dynamic evolution before ultimately intensifying over the study period (strengthening to R = −0.735). These evolving relationships indicate escalating ecological challenges due to continued urbanization and highlight the need for integrated management approaches that move beyond optimizing individual services. In conclusion, this study provides a robust scientific basis for land-use planning that can better address ES trade-offs and promote sustainable development in rapidly urbanizing regions.

Supplementary Materials

The following supporting information can be downloaded at: https://www.mdpi.com/article/10.3390/su172310596/s1, Table S1: Sensitivity analysis of total carbon storage loss to the forest carbon density parameter; Figure S1: Relationship between WY and impervious surface proportion from 2000 to 2020.

Author Contributions

S.T.: Conceptualization, Data curation, Software, Methodology, Writing-Reviewing and Editing, Formal Analysis, Funding Acquisition. K.L.: Methodology, Data Collection, Software, Writing—Original Draft. M.W.: Project Administration. S.W., Y.Z. and P.W.: Software, Data Curation. X.Z.: Resources, Supervision. All authors have read and agreed to the published version of the manuscript.

Funding

This work was supported by the Project of Hunan Provincial Committee for the Evaluation of Social Science Achievements (XSP25YBZ205) and the Outstanding Youth Scientific Research Project of the Hunan Provincial Department of Education (24B0543).

Institutional Review Board Statement

Not applicable.

Informed Consent Statement

Not applicable.

Data Availability Statement

The data presented in this study are available upon request from the corresponding author. The land use, DEM, and meteorological data are publicly available from the Resource and Environmental Science and Data Center (http://www.resdc.cn, accessed on 15 March 2024).

Acknowledgments

We sincerely thank the anonymous reviewers and editors for their valuable suggestions.

Conflicts of Interest

The authors declare no conflicts of interest.

References

  1. Lele, S.; Springate-Baginski, O.; Lakerveld, R.; Deb, D.; Dash, P. Ecosystem Services: Origins, Contributions, Pitfalls, and Alternatives. Conserv. Soc. 2013, 11, 343–358. [Google Scholar] [CrossRef]
  2. Aghaloo, K.; Sharifi, A. Balancing Priorities for a Sustainable Future in Cities: Land Use Change and Urban Ecosystem Service Dynamics. J. Environ. Manag. 2025, 382, 125460. [Google Scholar] [CrossRef]
  3. Jozay, M.; Zarei, H.; Khorasaninejad, S.; Miri, T. Maximising CO2 Sequestration in the City: The Role of Green Walls in Sustainable Urban Development. Pollutants 2024, 4, 91–116. [Google Scholar] [CrossRef]
  4. Wu, D.; Zheng, L.; Wang, Y.; Gong, J.; Li, J.; Chen, Q. Characteristics of Urban Expansion in Megacities and Its Impact on Water-Related Ecosystem Services: A Comparative Study of Chengdu and Wuhan, China. Ecol. Indic. 2024, 158, 111322. [Google Scholar] [CrossRef]
  5. Braun, D.; de Jong, R.; Schaepman, M.E.; Furrer, R.; Hein, L.; Kienast, F.; Damm, A. Ecosystem Service Change Caused by Climatological and Non-climatological Drivers: A Swiss Case Study. Ecol. Appl. 2019, 29, e01901. [Google Scholar] [CrossRef]
  6. WANG, K. Practicing Concept of “Lucid Waters and Lush Mountains Are Invaluable Assets” to Advance High-Quality Development of Territorial Space. Bull. Chin. Acad. Sci. (Chin. Version) 2024, 40, 1213–1221. [Google Scholar]
  7. Marsh, G.P. Man and Nature; University of Washington Press: Seattle, WA, USA, 2003. [Google Scholar]
  8. Tansley, A.G. The Use and Abuse of Vegetational Concepts and Terms. Ecology 1935, 16, 284–307. [Google Scholar] [CrossRef]
  9. Vogt, W. Food Detection by Vultures and Condors. Auk 1941, 58, 23. [Google Scholar] [CrossRef]
  10. Singer, S.F. Global Effects of Environmental Pollution. Eos Trans. Am. Geophys. Union 1970, 51, 476–478. [Google Scholar] [CrossRef]
  11. Liu, Y.; Zhang, Y.; Jia, Q. Study on the Methods of Ecosystem Services Valuation. Environ. Prot. 2017, 17, 64–68. [Google Scholar]
  12. Holdren, J.P.; Ehrlich, P.R. Human Population and the Global Environment: Population Growth, Rising per Capita Material Consumption, and Disruptive Technologies Have Made Civilization a Global Ecological Force. Am. Sci. 1974, 62, 282–292. [Google Scholar]
  13. Walter, E. How Much Are Nature’s Services Worth. Science 1977, 197, 960–964. [Google Scholar]
  14. Mooney, H.A.; Ehrlich, P.R.; Daily, G. Ecosystem Services: A Fragmentary History. Nature’s Serv. Soc. Depend. Nat. Ecosyst. 1997, 1, 11–19. [Google Scholar]
  15. Costanza, R.; d’Arge, R.; De Groot, R.; Farber, S.; Grasso, M.; Hannon, B.; Limburg, K.; Naeem, S.; O’Neill, R.V.; Paruelo, J.; et al. The Value of the World’s Ecosystem Services and Natural Capital. Nature 1997, 387, 253–260. [Google Scholar] [CrossRef]
  16. Daily, G.; Dasgupta, P.; Bolin, B.; Crosson, P.; Du Guerny, J.; Ehrlich, P.; Folke, C.; Jansson, A.M.; Jansson, B.-O.; Kautsky, N. Food Production, Population Growth, and the Environment. Science 1998, 281, 1291–1292. [Google Scholar] [CrossRef]
  17. Dong, L. Review on Evaluation of Ecosystem Services Value. J. Beijing For. Univ. (Soc. Sci.) 2011, 10, 59–64. [Google Scholar]
  18. Luan, Y.; Huang, G.; Zheng, G. Spatiotemporal Evolution and Prediction of Habitat Quality in Hohhot City of China Based on the InVEST and CA-Markov Models. J. Arid Land 2023, 15, 20–33. [Google Scholar] [CrossRef]
  19. Dashtbozorgi, F.; Hedayatiaghmashhadi, A.; Dashtbozorgi, A.; Ruiz–Agudelo, C.A.; Fürst, C.; Cirella, G.T.; Naderi, M. Ecosystem Services Valuation Using InVEST Modeling: Case from Southern Iranian Mangrove Forests. Reg. Stud. Mar. Sci. 2023, 60, 102813. [Google Scholar] [CrossRef]
  20. Li, M.; Liang, D.; Xia, J.; Song, J.; Cheng, D.; Wu, J.; Cao, Y.; Sun, H.; Li, Q. Evaluation of Water Conservation Function of Danjiang River Basin in Qinling Mountains, China Based on InVEST Model. J. Environ. Manag. 2021, 286, 112212. [Google Scholar] [CrossRef]
  21. Lei, J.-R.; Chen, Y.-Q.; Chen, Z.-Z.; Chen, X.-H.; Wu, T.-T.; Li, Y.-L. Spatiotemporal Evolution of Habitat Quality in Three Basins of Hainan Island Based on InVEST Model. Chin. J. Appl. Ecol. 2022, 33, 2511. [Google Scholar]
  22. Wu, L.; Luo, Y.; Pang, S.; Wang, G.; Ma, X. Factor Analysis of Hydrologic Services in Water-Controlled Grassland Ecosystems by InVEST Model and Geodetector. Environ. Sci. Pollut. Res. 2024, 31, 20409–20433. [Google Scholar] [CrossRef]
  23. Wang, X.; Liu, G.; Lin, D.; Lin, Y.; Lu, Y.; Xiang, A.; Xiao, S. Water Yield Service Influence by Climate and Land Use Change Based on InVEST Model in the Monsoon Hilly Watershed in South China. Geomat. Nat. Hazards Risk 2022, 13, 2024–2048. [Google Scholar] [CrossRef]
  24. Rayner, M.; Balzter, H.; Jones, L.; Whelan, M.; Stoate, C. Effects of Improved Land-Cover Mapping on Predicted Ecosystem Service Outcomes in a Lowland River Catchment. Ecol. Indic. 2021, 133, 108463. [Google Scholar] [CrossRef]
  25. Kim, S.; Jung, Y. Application of the InVEST Model to Quantify the Water Yield of North Korean Forests. Forests 2020, 11, 804. [Google Scholar] [CrossRef]
  26. Ouyang, Z.; Wang, Q.; Zheng, H.; Zhang, F.; Hou, P. National Ecosystem Survey and Assessment of China (2000–2010). Bull. Chin. Acad. Sci 2014, 29, 462–466. [Google Scholar]
  27. Zhou, B.; Yu, X.; Chen, L.; Zhang, Z.; Lü, X.; Fan, M. Soil Erosion Simulation in Mountain Areas of Beijing Based on InVEST Model. Res. Soil Water Conserv. 2010, 17, 9–13. [Google Scholar]
  28. Peng, J.; Tian, L.; Zhang, Z.; Zhao, Y.; Green, S.M.; Quine, T.A.; Liu, H.; Meersmans, J. Distinguishing the Impacts of Land Use and Climate Change on Ecosystem Services in a Karst Landscape in China. Ecosyst. Serv. 2020, 46, 101199. [Google Scholar] [CrossRef]
  29. Liu, Y.; Liu, X.; Zhang, B.; Li, M. Evaluation of Soil and Water Conservation Function of Artificial Shrub-Grassland Ecosystem in Hilly Region of the Loess Plateau. J. Soil Water Conserv. 2020, 34, 84–90. [Google Scholar]
  30. Bai, J.; Liu, J.; Yu, K.; Zhang, L.; Li, X.; Wang, D. Evaluation of Change in the Ecological Quality for Minjiang River Basin Based on the InVEST-Biodiversity Model. China Sci. 2015, 10, 1782–1788. [Google Scholar]
  31. Ren, Y.; Liu, X.; Xu, X.; Sun, S.; Zhao, L.; Liang, X.; Zeng, L. Multi-Scenario Simulation of Land Use Change and Its Impact on Ecosystem Services in Beijing-Tianjin-Hebei Region Based on the FLUS-InVEST Model. Acta Ecol. Sin. 2023, 43, 4473–4487. [Google Scholar]
  32. Zhou, Y.; Zhao, X. Spatial Relationship between Human Activity Intensities and Ecosystem Services Value in Changsha-Zhuzhou-Xiangtan Urban Agglomeration. China Environ. Sci. 2024, 44, 2948–2960. [Google Scholar]
  33. Kadaverugu, A.; Nageshwar Rao, C.; Viswanadh, G. Quantification of Flood Mitigation Services by Urban Green Spaces Using InVEST Model: A Case Study of Hyderabad City, India. Model. Earth Syst. Environ. 2021, 7, 589–602. [Google Scholar] [CrossRef]
  34. Wang, B.; Cheng, W. Effects of Land Use/Cover on Regional Habitat Quality under Different Geomorphic Types Based on InVEST Model. Remote Sens. 2022, 14, 1279. [Google Scholar] [CrossRef]
  35. Chen, H.; Zhao, Y.; Fu, X.; Wu, G. Characteristics of Spatio-Temporal Evolution and Influence Mechanism of Habitat Quality in the Upper Reaches of the West Liaohe River. Acta Ecol. Sin 2023, 43, 948–961. [Google Scholar]
  36. Chen, Z.; Yu, P.; Chen, Y.; Jiang, S.; Bai, S.; Gu, S. Spatio-Temporal Changes of Water Resources Ecosystem Services in the Hanjiang River Basin Based on the Shared Socioeconomic Pathway. Chin. J. Eco-Agric. 2021, 29, 1800–1814. [Google Scholar]
  37. Zheng, K.-J.; Li, C.; Wu, Y.-M.; Gao, B.-P.; Wu, Y.; Li, C. Spatial-Temporal Evolution of Habitat Quality and Its Influencing Factors in Ecological Conservation Area in Sichuan-Yunnan Provinces Based on Value Assessment. J. Ecol. Rural Environ. 2022, 38, 1377–1387. [Google Scholar]
  38. Yang, G.; Zhang, H.; Li, J.; Guo, D.; Zhang, X. Spatial-Temporal Evolution and Its Influencing Factors of Habitat Quality in Pingshuo Mining Area Based on RFFLUS-InVEST-Geodetector Coupling Model. J. Shaanxi Norm. Univ. Nat. Sci. Ed. 2021, 49, 106–115. [Google Scholar]
  39. Fang, L.; Wang, L.; Chen, W.; Sun, J.; Cao, Q.; Wang, S.; Wang, L. Identifying the Impacts of Natural and Human Factors on Ecosystem Service in the Yangtze and Yellow River Basins. J. Clean. Prod. 2021, 314, 127995. [Google Scholar] [CrossRef]
  40. Dai, X.; Wang, L.; Huang, C.; Fang, L.; Wang, S.; Wang, L. Spatio-Temporal Variations of Ecosystem Services in the Urban Agglomerations in the Middle Reaches of the Yangtze River, China. Ecol. Indic. 2020, 115, 106394. [Google Scholar] [CrossRef]
  41. Dadashpoor, H.; Azizi, P.; Moghadasi, M. Land Use Change, Urbanization, and Change in Landscape Pattern in a Metropolitan Area. Sci. Total Environ. 2019, 655, 707–719. [Google Scholar] [CrossRef]
  42. Shen, J.; Li, S.; Liang, Z.; Liu, L.; Li, D.; Wu, S. Exploring the Heterogeneity and Nonlinearity of Trade-Offs and Synergies among Ecosystem Services Bundles in the Beijing-Tianjin-Hebei Urban Agglomeration. Ecosyst. Serv. 2020, 43, 101103. [Google Scholar] [CrossRef]
  43. Salata, S.; Grillenzoni, C. A Spatial Evaluation of Multifunctional Ecosystem Service Networks Using Principal Component Analysis: A Case of Study in Turin, Italy. Ecol. Indic. 2021, 127, 107758. [Google Scholar] [CrossRef]
  44. Ding, T.; Chen, J.; Fang, Z.; Chen, J. Assessment of Coordinative Relationship between Comprehensive Ecosystem Service and Urbanization: A Case Study of Yangtze River Delta Urban Agglomerations, China. Ecol. Indic. 2021, 133, 108454. [Google Scholar] [CrossRef]
  45. Cui, W.; Wang, H.; Sui, G.; Feng, R.; Yang, Y.; Yu, L. Spatial-Temporal Change and Trade-off/Synergy Relationships of Ecosystem Services in the Source Region of the Yellow River. Chin. J. Eco-Agric. 2025, 33, 1012–1023. [Google Scholar]
  46. Deng, H.; Zhou, X.; Liao, Z. Ecological Redline Delineation Based on the Supply and Demand of Ecosystem Services. Land Use Policy 2024, 140, 107109. [Google Scholar] [CrossRef]
  47. Hanna, E.; Bruno, D.; Comín, F.A. The Ecosystem Services Supplied by Urban Green Infrastructure Depend on Their Naturalness, Functionality and Imperviousness. Urban Ecosyst. 2024, 27, 187–202. [Google Scholar] [CrossRef]
  48. Hunan Provincial Bureau of Statistics. Analysis of the Urbanization Status of Hunan’s Population. Available online: https://tjj.hunan.gov.cn/hntj/m/jczx_1/201507/t20150717_3788584.html (accessed on 10 October 2025).
  49. Tian, R.; Zhao, Z.-Q.; Song, D.-Y. Identification of Ecological Restoration of Territorial Space Based on Ecosystem Degradation Risk and Ecological Security Pattern: A Case Study of the Chang-Zhu-Tan Metropolitan Area. Huan Jing Ke Xue 2025, 46, 1608–1620. [Google Scholar]
  50. Ouyang, J.; Zhang, P.; Yu, H.; Zhang, N.; Liu, Y. Analysis on Coupling Coordination Degree between Livelihood Strategy for Peasant Households and Land Use Behavior in Ecological Conservation Areas—A Case Study of the Chang-Zhu-Tan Ecological Greenheart Area. Sustainability 2025, 17, 3996. [Google Scholar] [CrossRef]
  51. Bao, Y.; Liu, K.; Li, T.; Hu, S. Effects of Land Use Change on Habitat Based on InVEST Model—Taking Yellow River Wetland Nature Reserve in Shaanxi Province as an Example. Arid Zone Res. 2015, 32, 622–629. [Google Scholar]
  52. Yang, Q.; Zhang, P.; Qiu, X.; Xu, G.; Chi, J. Spatial-Temporal Variations and Trade-Offs of Ecosystem Services in Anhui Province, China. Int. J. Environ. Res. Public Health 2023, 20, 855. [Google Scholar] [CrossRef]
  53. Sun, Y.; Cai, J.; Li, T.; Zhang, L.; Lei, L.; Song, X. Evolution and prediction analysis of habitat quality in Hangzhou based on InVEST and PLUS models. J. Guizhou Norm. Univ. (Nat. Sci.) 2025, 43, 79–88+114. [Google Scholar]
  54. Li, Z.; Hu, J.; Hou, S.; Zhao, W.; Li, J. Quantifying Ecosystem Service Trade-Offs/Synergies and Their Drivers in Dongting Lake Region Using the InVEST Model. Sustainability 2025, 17, 6072. [Google Scholar] [CrossRef]
  55. Ouyang, X.; Wang, K.; Wei, X. Impacts of Urban-Rural Construction Land Linkages on Ecosystem Services: A Case Study of Dongting Lake Area. Acta Ecol. Sin. 2022, 42, 8713–8722. [Google Scholar] [CrossRef]
  56. Ouyang, X.; Tang, L.; Wei, X.; Li, Y. Spatial Interaction between Urbanization and Ecosystem Services in Chinese Urban Agglomerations. Land Use Policy 2021, 109, 105587. [Google Scholar] [CrossRef]
  57. Dai, W.; Zhao, K.; Fu, W.; Jiang, P.; Li, Y.; Zhang, C.; Gielen, G.; Gong, X.; Li, Y.; Wang, H.; et al. Spatial Variation of Organic Carbon Density in Topsoils of a Typical Subtropical Forest, Southeastern China. Catena 2018, 167, 181–189. [Google Scholar] [CrossRef]
  58. Xu, L.; He, N.; Yu, G. A Dataset of Carbon Density in Chinese Terrestrial Ecosystems (2010s). China Sci. Data 2019, 4, 86–92. [Google Scholar] [CrossRef]
  59. Hou, H.; Dai, E.; Zhang, M. A Review on InVEST Model for the Evaluation of Ecosystem Service Function. J. Cap. Norm. Univ. (Nat. Sci. Ed.) 2018, 39, 62–67. [Google Scholar]
  60. Hu, W.; Yang, R.; Jia, G.; Yin, Z.; Li, Y.; Shen, S.; Li, G. Response of Water Yield Function to Land Use Change and Its Driving Factors in the Yangtze River Basin. Acta Ecol. Sin. 2022, 42, 7011–7027. [Google Scholar] [CrossRef]
  61. Wei, J.; Hu, A.; Gan, X.; Zhao, X.; Huang, Y. Spatial and Temporal Characteristics of Ecosystem Service Trade-off and Synergy Relationships in the Western Sichuan Plateau, China. Forests 2022, 13, 1845. [Google Scholar] [CrossRef]
  62. Li, Q.; Li, D.; Wang, J.; Wang, S.; Wang, R.; Fu, G.; Yuan, Y.; Zheng, Z. Spatial Heterogeneity of Ecosystem Service Bundles and the Driving Factors in the Beijing-Tianjin-Hebei Region. J. Clean. Prod. 2024, 479, 144006. [Google Scholar] [CrossRef]
  63. Gutierrez, M.; Bekessy, S.A.; Gordon, A. Biodiversity and Ecosystem Services in Strategic Environmental Assessment: An Evaluation of Six Australian Cases. Environ. Impact Assess. Rev. 2021, 87, 106552. [Google Scholar] [CrossRef]
  64. Karimi, J.D.; Corstanje, R.; Harris, J.A. Bundling Ecosystem Services at a High Resolution in the UK: Trade-Offs and Synergies in Urban Landscapes. Landsc. Ecol. 2021, 36, 1817–1835. [Google Scholar] [CrossRef]
  65. Das, S.; Kumar Shit, P.; Bera, B.; Adhikary, P.P. Effect of Urbanization on the Dynamics of Ecosystem Services: An Analysis for Decision Making in Kolkata Urban Agglomeration. Urban Ecosyst. 2022, 25, 1541–1559. [Google Scholar] [CrossRef]
  66. Kafy, A.-A.; Saha, M.; Fattah, M.A.; Rahman, M.T.; Duti, B.M.; Rahaman, Z.A.; Bakshi, A.; Kalaivani, S.; Rahaman, S.N.; Sattar, G.S. Integrating Forest Cover Change and Carbon Storage Dynamics: Leveraging Google Earth Engine and InVEST Model to Inform Conservation in Hilly Regions. Ecol. Indic. 2023, 152, 110374. [Google Scholar] [CrossRef]
  67. Hua, F.; Bruijnzeel, L.A.; Meli, P.; Martin, P.A.; Zhang, J.; Nakagawa, S.; Miao, X.; Wang, W.; McEvoy, C.; Peña-Arancibia, J.L.; et al. The Biodiversity and Ecosystem Service Contributions and Trade-Offs of Forest Restoration Approaches. Science 2022, 376, 839–844. [Google Scholar] [CrossRef]
  68. Leal Filho, W.; Barbir, J.; Sima, M.; Kalbus, A.; Nagy, G.J.; Paletta, A.; Villamizar, A.; Martinez, R.; Azeiteiro, U.M.; Pereira, M.J.; et al. Reviewing the Role of Ecosystems Services in the Sustainability of the Urban Environment: A Multi-Country Analysis. J. Clean. Prod. 2020, 262, 121338. [Google Scholar] [CrossRef]
  69. Dai, X.; Wang, L.; Tao, M.; Huang, C.; Sun, J.; Wang, S. Assessing the Ecological Balance between Supply and Demand of Blue-Green Infrastructure. J. Environ. Manag. 2021, 288, 112454. [Google Scholar] [CrossRef]
Figure 1. Geographical location and 2020 land use map of the Chang-Zhu-Tan City Cluster (CZTCC) study area.
Sustainability 17 10596 g001
Figure 2. Schematic overview of the analytical framework employed in this study. ***, p < 0.001.
Sustainability 17 10596 g002
Figure 3. Sankey Diagram illustrating LULC transitions in the CZTCC from 2000 to 2020 (unit: km2).
Sustainability 17 10596 g003
Figure 4. Spatial distribution of HQ levels in the CZTCC from 2000 to 2020.
Sustainability 17 10596 g004
Figure 5. Temporal trends of average annual WY and average annual precipitation in the CZTCC during 2000–2020.
Sustainability 17 10596 g005
Figure 6. Spatial distribution of WY in CZTCC during 2000–2020.
Sustainability 17 10596 g006
Figure 7. Spatial distribution of CS density in the CZTCC during 2000–2020.
Sustainability 17 10596 g007
Figure 8. Temporal changes in HQ for different LULC types in the CZTCC during 2000–2020.
Sustainability 17 10596 g008
Figure 9. Temporal changes in WY for different LULC types in the CZTCC during 2000–2020.
Sustainability 17 10596 g009
Figure 10. Temporal changes in CS for different LULC Types in the CZTCC during 2000–2020.
Sustainability 17 10596 g010
Figure 11. Pairwise Pearson correlation analyses and scatter plots of HQ, WY, and CS in the CZTCC from 2000 to 2020. Statistical significance is denoted by ***, p < 0.001.
Sustainability 17 10596 g011
Table 1. Primary data sources used in this study.
Data TypeData NameData Sources
Basic Data100 m DEM dataResource and Environmental Science Data Center, Chinese Academy of Sciences (RESDC, http://www.resdc.cn, accessed on 15 March 2024)
100 m Land Use/Cover Data (2000, 2005, 2010, 2015, 2020)RESDC (http://www.resdc.cn, accessed on 15 March 2024)
Administrative boundariesRESDC (http://www.resdc.cn, accessed on 15 March 2024)
Habitat QualityHabitat threat sources and ecological sensitivity factorsInVEST model documentation and related literature [51,52,53,54]
Water YieldAnnual precipitation (2000, 2005, 2010, 2015, 2020)RESDC (http://www.resdc.cn, accessed on 15 March 2024)
Annual average potential evapotranspiration (2000, 2005, 2010, 2015, 2020)RESDC (http://www.resdc.cn, accessed on 15 March 2024)
Soil root depth and attributes (sand, silt, clay, organic matter)China Soil Dataset from World Soil Database (HWSD, https://www.fao.org/soils-portal/data-hub/soil-maps-and-databases/harmonized-world-soil-database-v20/en/, accessed on 15 March 2024)
Plant Available Water Content (PAWC)HWSD (https://www.fao.org/soils-portal/data-hub/soil-maps-and-databases/harmonized-world-soil-database-v20/en/, accessed on 15 March 2024)
Carbon StorageCarbon densities of four carbon poolsInVEST model guide and related literature [52,55,56,57,58]
Table 2. Attributes assigned to threat factor for the HQ model.
Threat FactorMaximum Influence Distance (km)WeightDecay TypeSource
Paddy field40.6Linear decay[52]
Dry land40.8Linear decay[53]
Rural settlements80.8Exponential decay[53]
Urban construction land61.0Exponential decay[54]
Other construction land30.6Linear decay[53]
Table 3. Habitat suitability and sensitivity of LULC types to threat factors used in the HQ model.
LULC TypeHabitat SuitabilityThreat FactorsSource
Paddy FieldDry LandRural SettlementsUrban Construction LandOther Construction Land
Paddy field0.301.00.50.70.6[52]
Dry land0.31.000.50.70.6[53]
Forest land1.00.80.50.50.20.8[53]
Shrub land0.90.80.50.80.20.7[53]
Sparse forest land0.70.80.91.00.70.5[53]
Other forest land0.70.80.80.850.70.5[53]
High-cover grassland0.80.80.80.40.70.4[53]
Medium-cover grassland0.70.60.60.30.60.3[53]
Low-cover grassland0.60.50.50.20.50.2[53]
Rivers and canals0.80.30.30.30.30.2[53]
Lakes0.80.30.30.30.30.2[53]
Reservoirs and ponds0.70.50.50.30.30.1[53]
Urban construction land000000[54]
Unused land000000[54]
Table 4. Biophysical parameters for different LULC types used in the WY model.
LULC TypeMaximum Root Depth (mm)Vegetation Evapotranspiration Coefficient (Kc)LULC_VegSource
Cropland21000.701[52]
Forest52000.901[54]
Grassland23000.651[54]
Water1001.000[52]
Construction land100.100[54]
Unused land3000.200[54]
Table 5. Carbon density for four carbon pools across different LULC types in the CZTCC (t C/ha).
LULC TypeCaboveCbelowCsoilCdeadSource
Cropland15.840.378.25[52]
Forest50.5151.8213.23[55,56]
Grassland22.886.599.90[55,56]
Water27.994.6108.40[55,56]
Construction land12.556.7110.80[55,56]
Unused land5.124.300[55,56]
Table 6. Changes in LULC area in the CZTCC between 2000 and 2020.
LULC Type2000 (km2, %)2005 (km2, %)2010 (km2, %)2015 (km2, %)2020 (km2, %)Change (2000–2020, km2)
Cropland6212.26 (32.82%)6139.91 (32.44%)5922.28 (31.29%)5814.25 (30.72%)5694.83 (30.08%)−517.43
Forest11,607.11 (61.32%)11,544.33 (60.99%)11,393.74 (60.19%)11,313.83 (59.77%)11,232.01 (59.34%)−375.1
Grassland169.36 (0.89%)169.16 (0.89%)165.15 (0.87%)164.35 (0.87%)164.05 (0.87%)−5.31
Water411.3 (2.17%)414.04 (2.19%)429.72 (2.27%)429.98 (2.27%)431.51 (2.28%)20.21
Construction land526.64 (2.78%)658.93 (3.48%)1010.35 (5.34%)1198.64 (6.33%)1400.15 (7.40%)873.51
Unused land2.72 (0.01%)3.09 (0.02%)8.29 (0.04%)8.38 (0.04%)7.00 (0.04%)4.28
Table 7. Changes in area proportion of HQ levels in the CZTCC, 2000–2020.
HQ LevelIndex RangeProportion of Each HQ Level in Different Years/%
20002005201020152020
Low0–0.22.943.655.526.517.70
Lower0.2–0.432.8832.4931.3530.7830.09
Medium0.4–0.61.291.301.311.341.34
Higher0.6–0.816.8416.7816.7317.1016.92
High0.8–146.0645.7845.0944.2843.95
Table 8. Temporal changes in WY in the CZTCC during 2000–2020.
Value TypeCorresponding Values in Each Year
20002005201020152020
Average (mm)966.91011.11215.31132967.7
Total (×108 m3)183191.3230214.2183.2
Table 9. Temporal changes in CS in the CZTCC during 2000–2020.
Value TypeCorresponding Values in Each Year
20002005201020152020
Average (t C/ha)339.64338.65336.08334.79333.42
Total (Tg C)642.92641.04636.18633.74631.14
Disclaimer/Publisher’s Note: The statements, opinions and data contained in all publications are solely those of the individual author(s) and contributor(s) and not of MDPI and/or the editor(s). MDPI and/or the editor(s) disclaim responsibility for any injury to people or property resulting from any ideas, methods, instructions or products referred to in the content.