Abstract
Effective governance of informal commercial spaces is a common challenge faced by cities globally. To break through the superficial governance mindset of traditional spatial regulation, this study focuses on clarifying the spatial distribution characteristics and influencing factors of such spaces. By integrating the theory of “The right to the city” with the “7D” principles of New Urbanism, and focusing on the Jinxiang Street area in Harbin, a representative zone combining traditional industrial and modern residential communities, this study constructed a multidimensional indicator framework including population factors, functional diversity of facilities, accessibility of the built environment, spatial suitability, and intensity of community management, extracting 17 significant variables. Through spatial autocorrelation analysis (Moran’s I), multiscale geographically weighted regression (MGWR), and geographic detector analysis, the results show that informal commercial spaces exhibit clustered yet uneven characteristics between aging and upscale communities; the MGWR model reveals significant spatial heterogeneity in influencing factors; and geographic detector analysis shows that the interaction between public service facilities’ proximity to main roads and enhanced community management has the most significant explanatory power for heterogeneity (q = 0.85). These findings inform differentiated governance strategies and provide scientific support for sustainable governance of informal commercial spaces.
1. Introduction
Since Keith Hart first introduced the concept of the “informal economy” in 1973, characterizing it as economic activities that circumvent formal institutional constraints [1], academic discourse has progressively clarified that it should not be equated with criminal enterprises [2]. In China, Professor Hu Angang defined the informal economy as comprising urban economic activities excluded from official statistics [3], while Liu Hong pointed out that the informal economy consists of economic activities that evade government regulations and reporting procedures [4]. This paper specifically defines it as comprising commercial activities conducted by urban entities without business licenses or planning permits, including those cases where originally demarcated formal commercial operations expand beyond their authorized boundaries and subsequently re-emerge as informal commercial spaces.
During the global rapid urbanization process, the proliferation of informal commercial spaces has become a prevalent urban phenomenon. While these spaces play a positive role in alleviating employment pressure on low-income groups and enhancing daily convenience [5], their negative externalities are often deemed illegal and challenging to regulate [6]. Urban administrators criticize such spaces for treating public areas as “common-pool resources,” thereby impeding urban modernization efforts [7].
At present, urban governance globally predominantly employs three paradigms for managing informal commerce: tolerance, eviction, and formalization. While tolerance policies permit the unregulated development of informal commerce, they often lead to disordered occupation of public space due to inadequate management. Eviction policies, enforced through stringent controls or even violent crackdowns, systematically suppress informal vending. For instance, in Dhaka, approximately 97,000 street vendors have faced prolonged severe repression [8], and in Tehran, nearly 88% of informal vendors have experienced conflicts with municipal authorities [9]. Formalization policies, exemplified by Hong Kong’s public markets and Guangzhou’s designated vending zones, attempt to integrate informal commerce into regulatory frameworks. However, by significantly constraining vendors’ livelihood earnings, these measures prove unsustainable, ultimately driving vendors back into public spaces and perpetuating a persistent “cat-and-mouse” dynamic with enforcement authorities [10]. The fundamental cause of these governance challenges lies in the fact that existing models are all built upon a linear “control–compliance” logic, which overlooks the spatial distribution characteristics and locational rationale of informal commerce [11]. Eviction policies directly deprive vulnerable groups of their “right to the city,” while formalization policies often serve gentrification-oriented urban renewal. In essence, they employ spatial discipline to exclude informal commerce from urban core areas, rather than genuinely responding to its inherent operational mechanisms [12].
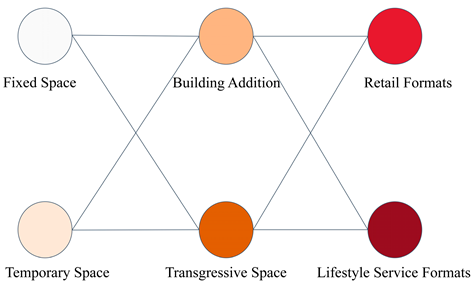
Since Henri Lefebvre first proposed the “right to the city” in 1968, this theory has consistently critiqued the “gentrification governance” logic inherent in capitalist space production, emphasizing residents’ collective rights to equally use, participate in, and shape the city [13]. Building on this foundation, David Harvey further articulated the “right to the city” as essentially a collective action claim aimed at resisting capital logic and striving for urban justice [14]. Edward Soja explicitly expanded it into the theoretical core of spatial justice, advocating that everyone should equally enjoy urban resources and have the spatial opportunity for self-development [15]. Following this theoretical lineage, informal commercial spaces can be viewed as concrete manifestations of urban vulnerable groups asserting their spatial rights and engaging in self-organizing practices. Their existence not only constitutes a use of public space but also represents an active claim to the right to participate in the urban production and experience process. Michel de Certeau’s theory of practice further elucidates the nature of such spatial practices, pointing out that they reflect the contradiction between the actual use of urban public space and governmental planning visions [16]. The spatial distribution of informal commerce is precisely the outcome of ongoing interaction between the institutionalized “strategies” of urban managers and the everyday “tactics” of informal vendors [17] (Figure 1). Through the flexible and mobile tactical use of urban space, along with implicit resistance, vendors not only challenge the established spatial order but also provide an important theoretical perspective for understanding the distributional resilience of informal commerce spaces under the influence of the built environment.
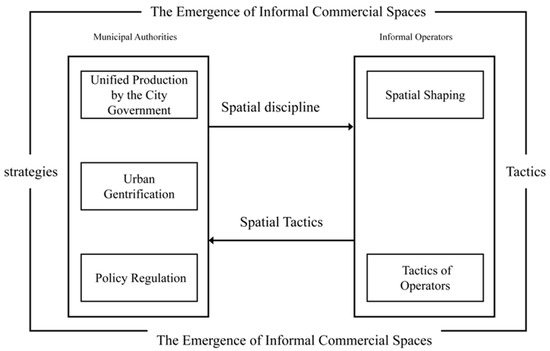
Figure 1.
The formation process of “strategies” and “tactics” in the informal commercial spaces (prepared by the author).
Empirical studies from both global and Chinese contexts reveal that the spatial distribution of informal commerce follows discernible patterns, driven primarily by three interconnected mechanisms. From a demand-side perspective, high pedestrian flow serves as the fundamental market force behind the agglomeration of informal commerce [18]. To secure sustainable customer bases, informal commercial spaces consistently concentrate in densely populated urban areas, utilizing strategic locations including street corners, alleyways, public squares, and high-traffic zones such as central business districts and tourist areas [19]. In terms of spatial adaptation, the functional characteristics of the built environment directly influence the operational feasibility and efficiency of informal commerce. The diversity of public service facilities combined with the accessibility of public transportation nodes forms the foundation for its integration into different urban functional zones [20]. Spatial compactness and a fine-grained urban fabric create favorable conditions for small-scale commercial activities [21], while wide roads inhibit pedestrian interaction and adversely affect the viability of micro-businesses [22]. Well-designed street interfaces provide essential spatial carriers and consumption scenarios for business operations, with vendors preferring locations that facilitate merchandise display, storage, and accommodate free customer movement [23]. At the institutional level, regulatory intensity and land tenure arrangements constitute critical institutional environments that shape the locational choices of informal commerce, with variations in these factors directly determining its spatial distribution patterns [24]. A dynamic interplay exists between informal and formal commerce, which may develop into complementary symbiotic relationships or result in the displacement of informal operators from core commercial areas when they are perceived as undesirable competition [25].
However, existing research predominantly remains at the stage of phenomenon description and influencing factor identification, failing to adequately reveal the geographical heterogeneity and intrinsic correlations of their operational mechanisms. Regarding demand-response mechanisms, current explanations emphasize the “market-driven” logic that informal commerce merely follows pedestrian flows [26], yet cannot explain why informal commercial spaces persist in certain low-density residential communities. In terms of institutional evasion mechanisms, while studies have focused on the tendency of informal commerce to cluster for avoiding high regulatory costs [24], they overlook the critical influence of fundamental constraints such as spatial accessibility on their actual distribution patterns. Concerning operational space suitability, research has primarily focused on small-scale suitability within the built environment [21], while neglecting the process through which informal vendors, as rights-bearing subjects, actively appropriate space through daily “tactical” practices. Consequently, existing studies predominantly select indicators based on external environmental characteristics or commercial rationality, generally lacking user-perspective considerations, resulting in theoretical superficiality and critical deficiency when their indicator systems attempt to explain the formation mechanisms of informal commercial spaces.
To address the core controversy regarding the unclear mechanisms linking the spatial distribution of informal commerce and the built environment, and to compensate for the lack of human-centered perspective in existing research on factor identification and indicator construction, this study develops an analytical framework integrating theoretical depth with practical explanatory power. However, the three aforementioned classical theories demonstrate significant limitations in explaining informal commercial spaces: while Lefebvre’s “right to the city” offers critical depth, its philosophical abstraction hinders direct application to built environment measurement; Harvey’s capital circulation theory effectively explains gentrification-driven displacement mechanisms but overlooks informal vendors’ proactive spatial production; Soja’s spatial justice framework strengthens normative orientation but lacks operational tools for causal mechanism identification. Accordingly, this study synthesizes the theoretical core of the “right to the city” with New Urbanism’s “7D” built environment framework (Density, Diversity, Design, Destination, Distance, Demand, District) [27], where the former provides value orientation and critical perspective for indicator development, while the latter supplies empirical dimensions and operational tools for theoretical implementation. This integration effectively remedies the dual deficiencies of the right to the city theory’s limited applicability and the 7D framework’s insufficient critical perspective. Guided by this theoretical synthesis, we systematically organize influencing indicators into five dimensions, with their intrinsic connections to the right to the city theory explicitly presented in Table 1 below.

Table 1.
Theoretical Integration Framework of Indicator Dimensions and Right to the City.
The methodological dilemma in existing research stems from fundamental methodological fallacies. Traditional regression models (e.g., OLS) can only provide globally averaged parameter estimates, thereby masking local-specific patterns. While traditional geographically weighted regression (GWR) can reflect spatial non-stationarity, it assumes all variables operate at the same spatial scale [28]. This methodological limitation has led to a persistent challenge, even when scholars theoretically recognize the complex spatial heterogeneity in informal commerce distribution, they remain unable to precisely quantify the unique operational scale of each driving factor, let alone capture potential effect-direction reversals of the same factor across different locations. Consequently, theoretical debates surrounding “gentrification governance” and the “right to the city” have long remained stagnant at philosophical and normative levels, struggling to transform into empirical knowledge applicable to planning and intervention. To bridge this chasm between theory and empirical evidence, this study introduces multiscale geographically weighted regression (MGWR). By allowing each variable to operate at its optimal bandwidth, MGWR enables precise identification of the true operational scales of various driving factors.
To address these research gaps, this study poses a central research question: Through what multi-scale driving mechanisms is the heterogeneous pattern of informal commercial spaces formed in Jinxiang Street, Harbin, and how can targeted governance strategies be accordingly developed? Guided by this question, the study establishes three progressive research objectives: (1) to diagnose the agglomeration characteristics and heterogeneous patterns of informal commercial spaces through spatial autocorrelation analysis; (2) to validate the multi-scale driving mechanisms using MGWR models and geographical detectors; (3) to construct a “zoning-timing-categorization” governance framework and propose specific implementation tools.
The innovative value of this study is reflected in breakthroughs at three levels: Theoretical innovation, operationalizing the “right to the city” theory by integrating the “7D” principles of New Urbanism to construct multidimensional indicators, providing a quantifiable pathway for theoretical critique. Methodological innovation, establishing a systematic analytical framework of “pattern diagnosis-mechanism analysis-interaction detection” to precisely reveal the heterogeneous effects of 17 driving factors across multiple scales for the first time. Practical innovation, creating a precision governance paradigm based on multi-scale mechanism diagnosis, forming a logical closed loop between the “zoning-timing-categorization” framework and spatial heterogeneity mechanisms, thereby providing a comprehensive solution for transitioning urban governance from extensive control to human-centered inclusivity.
2. Framework and Quantification of Influencing Indicators
2.1. Indicator Construction
This study uses the “7D” dimensions as the basic framework for measuring the urban built environment. Seventeen significant variables were initially selected for measurement, and the composition and calculation rules of each indicator are shown in Table 2.

Table 2.
Categories and calculation rules of explanatory variables.
2.2. Quantification of Indicators
2.2.1. Population Factors
This study uses dual-source data of “resident population” and “instantaneous passenger flow,” to conduct refined calculations of pedestrian flows around informal commercial spaces. In processing data of incoming visitors, Baidu Map Location-Based Service (LBS) positioning data, a web crawler system is employed to obtain heatmap data at an hourly granularity for 100 m grids, which can effectively distinguish the crowd aggregation conditions of different neighborhoods and major intersections. After standardizing the data, a spatiotemporal weight matrix was constructed. Finally, the entropy weight method was used to generate a comprehensive activity index, effectively overcoming the spatiotemporal limitations of traditional demographic statistics and providing a comprehensive reflection of the population activity levels on weekdays and weekends in the region Figure 2.
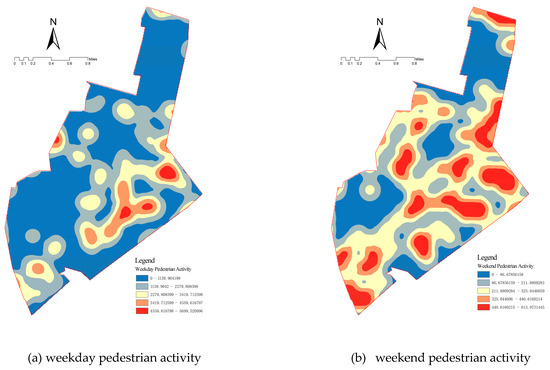
Figure 2.
Instantaneous passenger flow (prepared by the author).
2.2.2. Functional Diversity of Facilities
This study uses POI as the data source and further refines the study area into a grid based on street divisions, with grid sizes comparable to those of neighborhoods in urban planning. By calculating the diversity of POI categories within each grid, it measures the degree of mixing of different types of POI. A higher value indicates a greater variety of POI functions and smaller disparities in the quantity of each function type. The calculation method is as follows:
In the formula: represents the POI mix level of unit , represents the proportion of the number of category POIs within unit to the total number of POIs in that unit; represents the number of POI types in that unit, which is [29]. Using this method, the POI functional mix of each grid in the study area is calculated. Then, using the spatial join tool in ArcMap 10.8.1, the grids are associated with the mix scores. Finally, spatial visualization analysis is conducted based on the calculated values Figure 3.
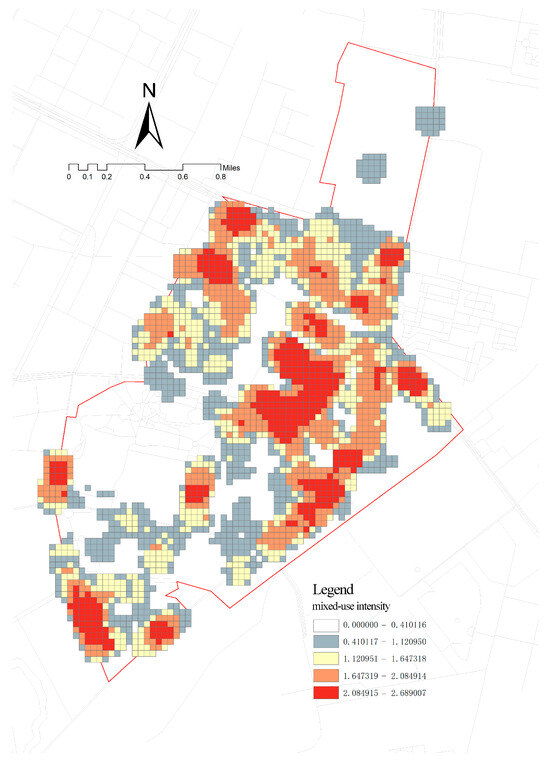
Figure 3.
Mixed-use intensity (prepared by the author).
2.2.3. Accessibility of the Built Environment
This study aims to investigate global patterns of spatial distribution and their driving mechanisms, rather than simulating precise individual movement routes. Given this objective, Euclidean distance serves as an efficient metric for measuring potential spatial interactions. Additionally, given the dense and well-connected road network within Jinxiang Street, Harbin, Euclidean distance effectively captures the fundamental trends of spatial proximity. This approach is also widely adopted in similar street-level spatial morphology studies, thus ensuring methodological comparability [30,31].
The spatial proximity between informal commercial locations and various types of facilities was quantified by calculating the Euclidean distance. Using spatial analysis techniques, for each informal commercial location within the study area, the Euclidean distance to its nearest facility of the same category was computed. The specific formula is as follows:
Here, is the total number of informal economy locations within the study area, and represents the distance from the business site to its nearest target facility. This approach enables a macro-level assessment of the spatial dependence of informal commercial spaces on this category of facilities.
2.2.4. Spatial Suitability
To investigate the occupancy preferences of informal commercial spaces for different classes of roads, this study established road buffers to extract informal commercial locations within their zones of influence. The buffer range was determined not solely based on physical width of the roads but through a comprehensive assessment of their spatial impact. Previous research by Long Ying et al. effectively analyzed the distribution of POIs along both sides of streets using a 55 m buffer, which has demonstrated the validity of this scale in measuring the spatial influence of street environments [32]. To prevent the introduction of non-sampling errors due to excessively large ranges, this study applied differentiated buffer settings for various road classes, as detailed in Table 3. All buffer radii exceeded the maximum road width to comprehensively capture informal commercial locations that, while not directly on the road surface, maintain close operational ties to the roadway, thereby effectively reducing omission errors caused by improper range setting.

Table 3.
Buffers of roads with different classification levels.
2.2.5. Intensity of Community Management
The level of property management and the degree of access control are two core indicators for measuring the intensity of community governance. Together, they determine the openness and inclusiveness of community spaces, thereby affecting the survival conditions of informal economic activities. To quantify the impact of governance intensity on the informal economy, this study classifies residential areas into three levels based on their management degree Figure 4.
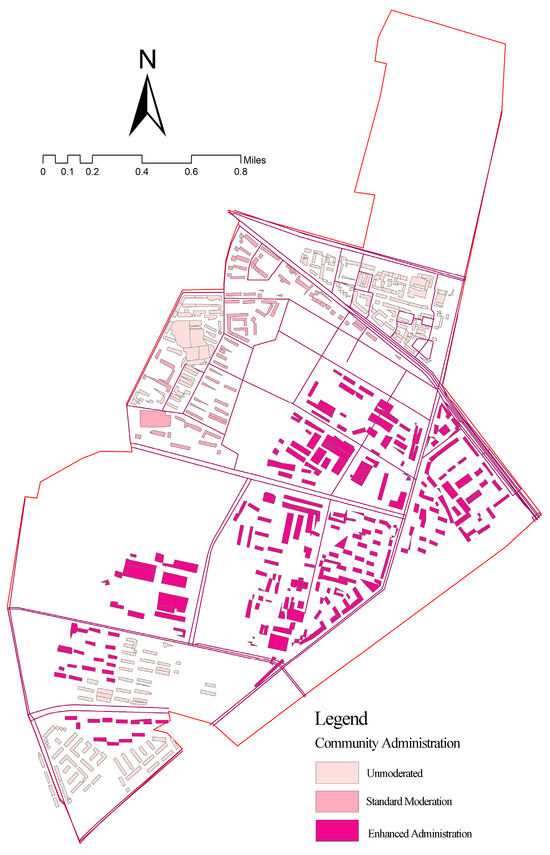
Figure 4.
Community administration (prepared by the author).
Open communities without any management, due to the lack of physical barriers and professional oversight, become the main gathering areas for informal economic activities. Basic-Level communities with basic management maintain a certain flexibility under limited control, providing survival niches for informal businesses. Closed communities with enhanced management, through a combination of physical isolation, intelligent systems, and professional strong control, systematically suppress the informal economy.
3. Materials and Methods
3.1. Research Framework
For urban managers to implement governance policies and gain acceptance from informal operators, it is necessary to ensure their income and promote their integration into community life. With these considerations in mind, this paper proposes a research framework for clarifying the spatial distribution patterns of the informal economy. As shown in Figure 5, the study consists of four modules: (1) classifying the types of informal commercial spaces based on three dimensions—business format, stability, and the way they transform the built environment—to establish a geospatial dataset of informal economic points; (2) analyzing the distribution characteristics and patterns of these informal economic points, revealing spatial distribution differences; (3) the MGWR model and geographical detector are used to quantify the influencing factors behind spatial distribution differences and the interactions among multiple factors; (4) the study summarizes the spatial distribution patterns of the informal economy, providing new ideas for achieving differentiated and efficient spatial governance.
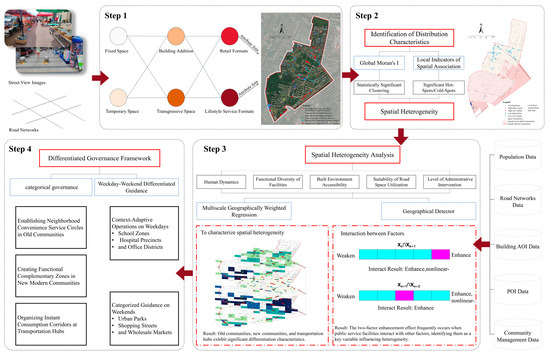
Figure 5.
Research framework (prepared by the author).
3.2. Study Area
As shown in Figure 6, this study selects Harbin in Northeast China, a cold-region immigrant city with a unique tradition of formal-informal symbiosis. The research focuses specifically on Jinxiang Sub-district within Harbin’s Xiangfang District as the empirical study area. Bordered by the Labin Railway Line to the east, Liancao Street to the west, Tianyuan New City and Locke Town to the south, and Hongqi Bridge to the north, the site covers approximately 6 square kilometers. This area exhibits typical characteristics of both traditional industrial communities and newly developed modern residential communities. It serves as a microcosm of Harbin’s transition from industrial heritage to an innovation-driven economy. It also enables horizontal comparisons across different types of communities within the city, promoting the advancement of research findings from case-specific explanations to general principles (see Table 4).
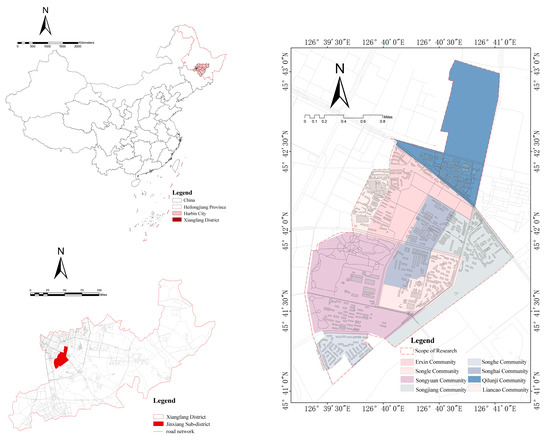
Figure 6.
Location of the study area (prepared by the author).

Table 4.
Community type.
3.3. Research Methods
3.3.1. Public Space-Public Life Survey (PSPL)
This study employs the Public Space & Public Life Survey (PSPL) methodology to identify high-frequency occurrence locations of informal commercial activities and analyze their interactive relationships with public life, thereby constructing a comprehensive geographic dataset of informal commercial spaces. The approach builds upon the theoretical core of Jan Gehl’s PSPL framework, which emphasizes direct observation and documentation of real activities in public spaces [33], while incorporating mobile geospatial information technologies to improve methodological efficiency. This integration ensures operational effectiveness in data collection, spatial accuracy in positioning, and verifiability across temporal dimensions. It should be specifically noted that the incorporation of temporal elements (such as multiple daily periods and two-phase investigations) in the survey design primarily aims to ensure comprehensive spatial identification and dataset reliability, rather than analyzing dynamic temporal variations of the locations themselves (Table 5).

Table 5.
Field Survey Design.
3.3.2. Spatial Autocorrelation Analysis (Moran’s I)
To quantitatively analyze the spatial distribution characteristics of informal commercial locations, this study employs spatial autocorrelation analysis methods. The global Moran’s I index is used as a global indicator to quantify spatial autocorrelation, describing the overall spatial distribution of the informal economy and determining whether informal commercial locations exhibit clustering characteristics within the study area. Local spatial distribution patterns are analyzed using the local spatial association indicator (Anselin’s Local Moran’s I) to identify the locations where significant clustering of informal commercial locations occurs.
The global Moran’s I index is used to analyze whether informal commercial locations within the study area exhibit clustering characteristics, with the formula as follows:
Here, is the number of informal commercial locations, represents the spatial weight between points and , and is the agglomeration evaluation of point , and is the global mean.
We calculate the Anselin Local Moran’s I value using the following formula to accurately identify the locations where informal economic agglomeration characteristics occur:
represents the local Moran’s I index at location , denotes the spatial weight between points and , is the variance of the variable , is the observed value at location , and is the global mean [34]. Through Anselin Local Moran’s I analysis, four standard categories, High-High (HH) clusters, Low-Low (LL) clusters, High-Low (HL) outliers, and Low-High (LH) outliers, which can identify statistically coherent categories of informal economic spatial clustering regions.
3.3.3. Multiscale Geographically Weighted Regression (MGWR)
This study primarily employed three models: the Ordinary Least Squares (OLS) model, the Geographically Weighted Regression (GWR) model, and the Multiscale Geographically Weighted Regression (MGWR) model to analyze the experimental data, and compared the fitting results obtained from the three models.
The ordinary least squares (OLS) model is the most basic model for studying the heterogeneity of the spatial distribution of operational informal sectors. Its model is as follows:
is the dependent variable of the -th sample point; is the intercept of the linear regression equation; is the regression coefficient of the k-th explanatory variable; is the -th explanatory variable of the -th sample point; is the random error [35].
As an extension of the OLS model, the GWR model takes into account the variation in regression coefficients across different geographic locations, embedding the geographic location of the data into the regression parameters. The GWR model is as follows:
Here, are the spatial latitude and longitude coordinates of the -th sample point; is the constant term for the i-th sample point; is the regression coefficient of the -th explanatory variable at the i-th sample point [35].
Each regression coefficient of MGWR is obtained based on local regression, and the bandwidth is variable-specific, which is the main difference from classical GWR, where all variables of share the same bandwidth. MGWR continues to use the kernel functions and bandwidth selection criteria of classical GWR. In this study, the most commonly used adaptive Gaussian kernel function and the AICc criterion are employed.
The calculation formula of the MGWR model is as follows:
In the formula: is the spatial value at sample point ; Bbwj denotes the regression coefficients of different variables at different bandwidth levels; is the observation of variable at point ; is the random error term [36].
During the construction of the Multiscale Geographically Weighted Regression (MGWR) model, this study adhered to the standard methodology proposed by Fotheringham et al. [37], utilizing an adaptive Gaussian kernel function and determining the optimal bandwidth for each variable through the AICc minimization criterion, with AICc estimation based on 10-fold cross-validation. This approach has been successfully applied by Yang et al. in urban disaster risk research to address spatial heterogeneity issues [38]. To evaluate model performance, MGWR was compared with Ordinary Least Squares (OLS) and Geographically Weighted Regression (GWR), as summarized in Table 6.

Table 6.
Results of multiple model runs.
The results demonstrate that MGWR outperforms the other models across all these key metrics: it achieves a superior Goodness-of-Fit R2 and Adj. R2, the lowest AICc and Residual Sum of Squares, rational Degrees of Freedom (n–trace(S)), and residuals free of significant spatial autocorrelation or heteroscedasticity. Furthermore, by revealing the multiscale operational mechanisms of influencing factors through variable-specific adaptive bandwidths, MGWR confirms its distinct advantage in capturing complex spatial heterogeneity.
3.3.4. Geographical Detector
The Geographical Detector method determines the existence, strength, direction, and linearity or nonlinearity of the interaction between any two factors by separately calculating and comparing the q-statistic of each individual factor and the combined q-statistic after their interaction. The integration of two factors encompasses not only multiplicative relationships but also other potential associations, allowing the model to detect any form of interaction. The explanatory power (q-statistic) of each factor can be expressed as follows:
In Equation (8), represents the degree to which an influencing factor affects the distribution density of informal economic points, with a range of [0, 1]. A higher value indicates stronger explanatory power of the factor on the distribution density of informal economic points [39]. Suppose factor is discretized into categories, then represents the number of samples in the -th level of factor ( = 1, 2, 3, …, ); is the total number of samples in the entire study area; and represent the variance across the entire region.
The purpose of the interaction detector is to examine how influencing factors X1 and X2 affect the degree of informal commercial spaces agglomeration Y; that is, whether the effect is independent or interactive. If it is interactive, it determines whether the effect is enhanced or weakened.
3.4. Data Sources
3.4.1. Typology of Informal Commercial Spaces
This study classifies informal commercial spaces into six types based on three dimensions: business format, spatial stability, and modes of built environment transformation Table 7. The classification criteria are as follows:

Table 7.
Typology of informal commercial spaces.
Business Format: As a spatial representation of community demands, it directly reflects the consumption habits and behavioral logic of specific groups. Drawing on Jane Jacobs’ theory of street vitality [40], this study proposes a “Service Base–Vitality Catalyst” framework: daily service-oriented businesses form the continuous “service base” of a community, while retail commercial activities act as “vitality catalysts” that stimulate street life.
Spatial Stability: This reflects the operators’ spatial occupation tactics and resilience to interference, serving as a key basis for formulating differentiated governance approaches. Temporary spaces are highly mobile, with flexible operational states and spatial occupancy. In contrast, fixed spaces, despite often going through formal application processes, frequently evolve into semi-permanent nodes through continuous adaptation, exhibiting significant spatial consolidation.
Adaptation to the Built Environment: As the physical manifestation of spatial practice, this is a core criterion for assessing the degree of non-compliance and establishing governance priorities. Encroaching spaces detach from the original structures, utilizing movable facilities or temporary constructions to occupy public space. Expanding spaces involve modifications or additions to existing building volumes to achieve capacity increase, consequently raising the difficulty of governance and the cost of restoration.
3.4.2. Geospatial Dataset of Informal Economy Locations
This study utilizes a Volunteered Geographic Information (VGI) survey approach, organized through the steps of “photographing—generating trajectories from photos—conversion and projection—spatial position verification—data association.” KML files containing spatial location attributes can be imported into ArcMap 10.8.1 to create point files, which are then subjected to coordinate conversion and projection, and any points with spatial deviations are verified. Finally, the photos’ filenames are used as connecting elements to associate with the number of points in informal commercial spaces recorded during the survey. Based on the initial data collection and supplementary secondary data, a total of 554 informal commercial spatial points were obtained, containing attribute fields such as latitude and longitude coordinates, business types, spatial stability, and built environment modification degrees. This dataset can be conceptualized as a specialized form of Point of Interest (POI) data. This spatial point distribution feature provides an important data foundation for subsequent research into the distribution mechanisms of informal commercial spaces and their interaction with urban space (as shown in Figure 7).
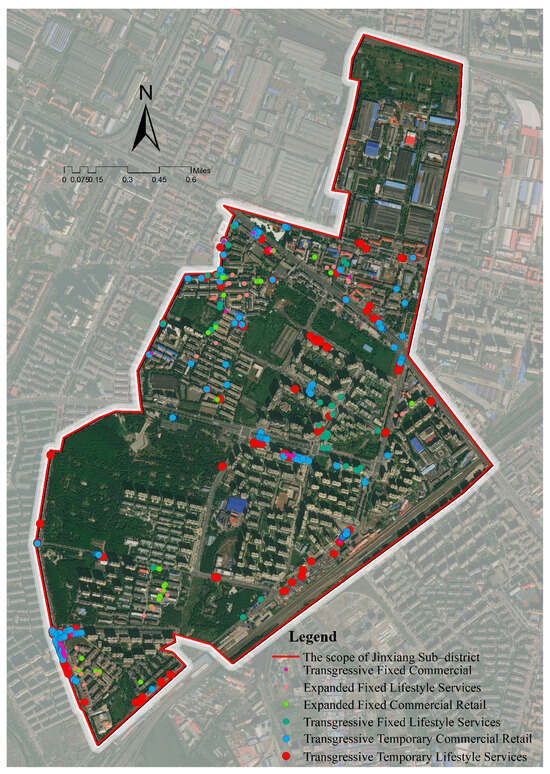
Figure 7.
Geospatial locations of informal economy sites (prepared by the author).
3.4.3. Multi-Source Data Acquisition
This study developed a reproducible system for acquiring and analyzing multi-source urban data. The construction of the system began with a rigorous selection of data sources, with criteria covering multiple dimensions, such as data accessibility, representativeness, correlation with spatial distribution patterns of the informal economy, and data timeliness. The aim was to obtain high-precision data within China, including population density, population heatmaps, road networks, transportation hubs, building outlines (AOI), and points of interest (POI) for services. Ultimately, mainstream data platforms with authority and representativeness, such as Baidu Maps Open Platform, OpenStreetMap (OSM), and the local subdistrict offices of the research area, were selected as collaborators (see Table 8 for details).

Table 8.
Explanation of research data sources.
After obtaining the raw data, they need to undergo a series of rigorous processing steps before they can be used for analysis. The core processing techniques and parameters are as follows: (1) Unified spatial reference: Convert all data to the WGS84 geographic coordinate system to establish a unified spatial reference framework. (2) Data cleaning and standardization: Based on township-level census data, the area weight method is used for spatial grid allocation. Utilize ArcGIS Network Analyst for road network topology checking and correction. Perform deduplication based on the UID field and standardize the POI data by encoding the type field uniformly. (3) Quality validation and control: Apply the dynamic time warping (DTW) algorithm to verify the continuity of population heat data, setting similarity thresholds to identify anomalies and complete spatiotemporal trajectory detection. Conduct geometric validity checks on building outlines and road network data, and repair topological errors. Through multi-source data overlay analysis, combined with high-resolution remote sensing image sampling inspection, ensure that spatial location and attribute accuracy reaches over 95%. (4) Temporal Alignment of Data: To mitigate potential spatiotemporal mismatches arising from multi-period data collection and ensure the validity of temporal relationships between multi-source data and informal commercial location records, this study established a unified temporal alignment framework. The temporal baseline for all explanatory variables was uniformly set to reflect environmental conditions prior to the first large-scale field survey (August 2024). Consequently, the time points for all explanatory variables (built environment data)—including the 2020 census, June 2024, and July–August 2024—were explicitly earlier than or concurrent with the initial large-scale recording period of the dependent variable (informal commercial locations, July–October 2024). This approach strictly adheres to the fundamental principle of causal inference that “causes must precede effects,” thereby safeguarding the reliability of subsequent analytical inferences from a temporal logic perspective.
4. Spatial Distribution Characteristics of Informal Commercial Spaces
4.1. Characteristics of High Concentration and Imbalance
4.1.1. Characteristics of High-Value Concentration
Global spatial autocorrelation analysis reveals significant spatial dependence in the distribution of informal commercial spaces (Moran’s I = 0.748, z-score = 26.448, p < 0.001), indicating a strongly positive spatial correlation pattern (Figure 8a).
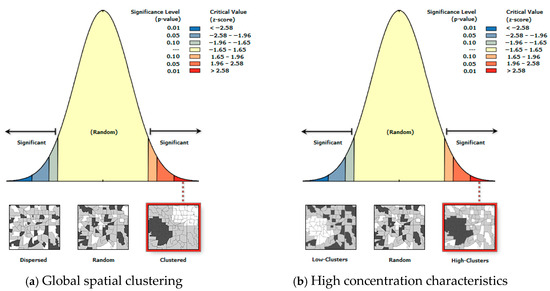
Figure 8.
Characteristics of high-value concentration (prepared by the author).
Local spatial autocorrelation analysis further identifies significant high-aggregation clusters with a z-score of 4.596 (p < 0.001), demonstrating statistical robustness in the high-value clustering pattern. These hotspots form spatially continuous structures where highly aggregated informal commercial locations cluster together and are surrounded by similar high-value areas, collectively constituting large-scale agglomeration corridors (Figure 8b).
4.1.2. Characteristics of Clustered and Uneven Distribution
Both HH-type and LL-type clusters demonstrate statistical significance with p-values below 0.05, confirming meaningful spatial correlation. Non-significant clusters show p-values exceeding 0.05, indicating no discernible spatial pattern. With HH-type clusters accounting for the largest proportion (39.3%) of all samples, the analysis reveals that informal commercial spaces in the study area are predominantly characterized by significant clustering, particularly highlighting the prominence of high-value agglomeration features (Table 9).

Table 9.
Spatial Autocorrelation Cluster Analysis Results.
Local spatial autocorrelation analysis reveals significant spatial heterogeneity in the distribution of informal commercial spaces (Figure 9). Aging residential communities predominantly exhibit low-low clustering (LL-type), with Local Moran’s I values ranging from 0.038 to 5.276 (p = 0.002–0.042). In contrast, upscale communities, transportation hubs, and areas surrounding parks demonstrate high-high clustering (HH-type), with Local Moran’s I values between 0.004 and 2.524 (p = 0.002–0.050).
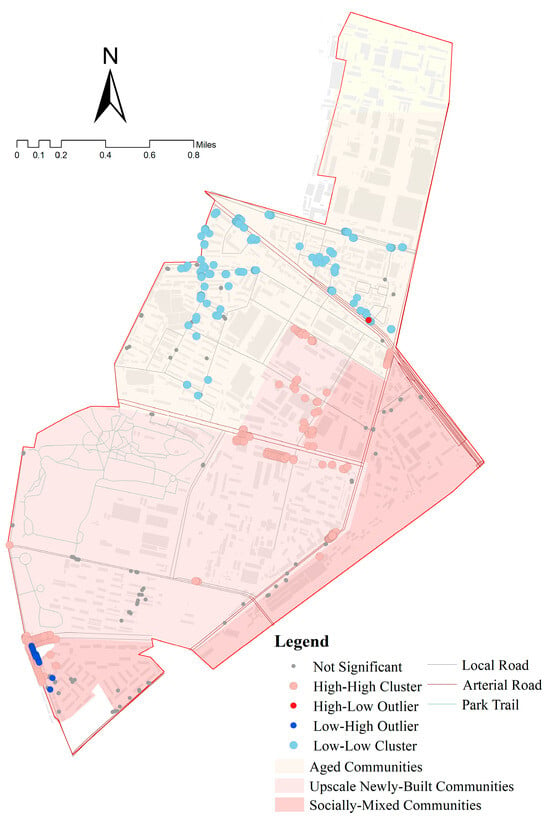
Figure 9.
Spatial agglomeration and uneven distribution characteristics (prepared by the author).
The elevated Moran’s Index values in LL clusters reflect stronger internal spatial homogeneity. This pattern correlates with two observable spatial characteristics, the discontinuous street grids and fragmented interfaces formed during the danwei period structurally constrain the development of informal commercial spaces, while the low-constraint governance model dominated by homeowner associations lacks the coordination capacity and resource integration efficiency necessary for fostering intensive commercial environments. In contrast, the formation of HH clusters closely relates to high pedestrian flows and the functional dependency of informal commerce on formal commercial districts. Spatial spillover effects from management measures further channel informal commercial activities toward locations with high visibility and accessibility.
This mechanistic divergence elucidates the formation of distinct spatial distribution patterns, LL areas exhibit homogeneity under the dominance of structural constraints, while HH areas maintain heterogeneity through dynamic combinations of multiple factors. Subsequent analysis will employ multiscale geographically weighted regression to quantify the spatial effect intensity of each factor and decode the multidimensional driving mechanisms underlying informal commercial distribution.
4.2. Development of the Multiscale Geographically Weighted Regression (MGWR) Model
4.2.1. Definition and Measurement of the Dependent Variable
This study defines the kernel density intensity at informal commercial point locations as the dependent variable, with the primary objective of precisely measuring the relative agglomeration level exhibited by each informal commercial location within its local environment. It should be specifically noted that this variable is not an areal density derived from aggregation based on grid or administrative units, but rather a continuous attribute variable directly assigned to each individual point location.
In the specific calculation process, a continuous raster surface representing the spatial distribution density was first constructed using kernel density estimation based on all informal commercial points within the study area. Subsequently, employing the “Extract Values to Points” spatial analysis tool in the ArcMap 10.8.1 platform, the precise kernel density value at the corresponding location of each point was extracted as an additional attribute field, termed “Informal Commercial Point-level Kernel Density Intensity.”
4.2.2. Multicollinearity Diagnostics
To examine multicollinearity among independent variables and determine the final variable set for modeling, this study employed ordinary least squares (OLS) regression to conduct variance inflation factor (VIF) diagnostics and statistical significance tests on all 17 initial independent variables (Table A1). The diagnostic results showed that the “Primary Management” variable under the community management intensity dimension had a VIF value of 6.38, exceeding the common tolerance threshold (VIF < 5) [41], and was therefore excluded. Ultimately, 16 built environment indicators were confirmed to meet the requirements and were retained for subsequent MGWR model construction.
Based on this optimized variable set, we executed a multiscale geographically weighted regression (MGWR) model, with detailed estimation results presented in Table 10. This table not only provides the distribution of regression coefficients for each variable but, more importantly, reveals their unique spatial operating scales through the bandwidth column. This precise quantification of multiscale characteristics represents the core advantage of the MGWR model over traditional regression methods, enabling us to deeply analyze the complex geographical mechanisms through which different built environment factors influence the spatial distribution of informal commerce.

Table 10.
Descriptive Statistics of Variables in the MGWR Model.
4.3. Impact of Spatial Heterogeneity in Informal Commercial Spaces
4.3.1. Population Factors
As shown in Figure 10a, resident population density exhibits a strong inhibitory effect in newly developed upscale communities, reflecting how high land value and stringent management compress the space available for the informal economy. In contrast, within aging communities, resident population density shifts to a positive facilitating role, particularly favoring the development of encroaching transgressive temporary commercial retail and transgressive temporary lifestyle services.
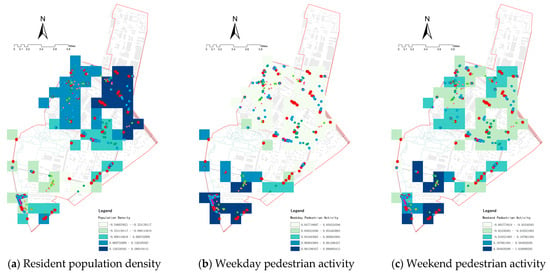
Figure 10.
Population factors (prepared by the author).
As shown in Figure 10b, the impact of weekday pedestrian activity intensity exhibits a spatial trend of increasing from the northeast to the southwest. Major commuting routes, such as Metro Line 3 and Tongxiang Street, serve as essential nodes for weekday commuters. Transgressive Temporary Commercial Retail and Transgressive Temporary Lifestyle Services tend to cluster around transportation nodes, effectively capturing the instant consumption demands of commuting populations.
As shown in Figure 10c, the heterogeneity of the impact on weekend pedestrian activity intensity has significantly increased, forming a stark contrast with positive promotion in the southwest and negative inhibition in the northeast. This indicates that the pattern of weekend population activity has altered the spatial distribution logic of the informal economy, shifting from reliance on fixed commuter flows to following leisure consumption flows.
4.3.2. Functional Diversity of Facilities
Figure 11a shows that the facility function mix index exerts a stable positive influence in aging and Socially Mixed Neighborhoods, but transitions to a significant inhibitory effect in newly developed upscale communities. Upscale communities achieve functional integration through formally planned and constructed commercial complexes, which undermines the foundation for informal economic activities. In contrast, aging communities rely on fragmented, scattered spaces to spontaneously develop expanded fixed commercial retail and expanded fixed lifestyle services. Consequently, even in aging communities with a relatively low functional mix, these types of informal activities can persist, sustained by stable neighborhood relationships and rigid demand.
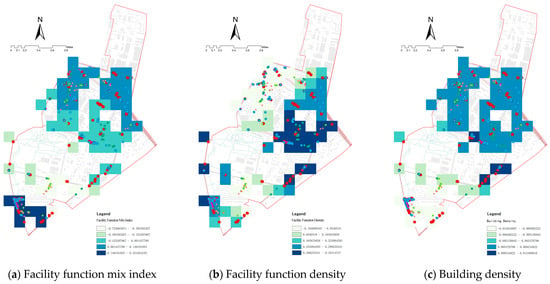
Figure 11.
Functional diversity of facilities.
As shown in Figure 11b, facility function density primarily acts as a strong positive driver in upscale communities. The commercially oriented atmosphere generated by planned facilities creates a notable “customer flow spillover effect,” which encourages the outward extension of formal street-level commercial spaces and stimulates the emergence of parasitic, encroaching Transgressive Temporary Lifestyle Services. Conversely, in aging neighborhoods, informal commercial spaces already constitute a significant component of the local service supply. An increase in service facility density introduces internal competition and can even lead to an informal space crowding-out effect on existing informal businesses, resulting in a negative impact.
As shown in Figure 11c, in aging communities with high building density, the dense building layout, combined with narrow streets and continuous interfaces, creates rich commercial spaces, making it easier for informal businesses to integrate. In contrast, low-density villa districts typically emphasize open green spaces, independent residential units, and strict community management, which, through both spatial separation and stringent regulation, limit the opportunities for informal economies to survive.
4.3.3. Accessibility of the Built Environment
As shown in Figure 12a, the informal commercial spaces most affected by residential accessibility are mainly Transgressive Temporary Lifestyle Services and Transgressive Temporary Commercial Retail forms that are attached to marginal spaces such as the ground floors and entrances of residential buildings. The closer they are to residential areas, the stronger their resilience. Conversely, this results in increased operating costs and decreased customer stability, significantly reducing the agglomeration level of informal commercial spaces.
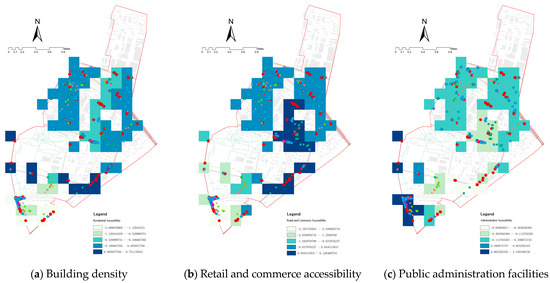
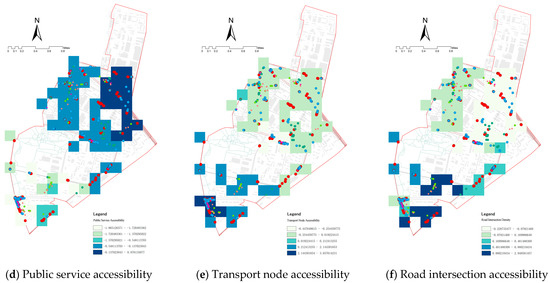
Figure 12.
Accessibility of the built environment (prepared by the author).
As shown in Figure 12b, the impact of retail and commerce accessibility demonstrates notable spatial heterogeneity and context dependence. Around to low-end markets such as morning markets and wholesale markets, accessibility exerts a negative influence, agglomeration intensity increases with distance, reflecting a spatial avoidance tactic that captures spillover customer flows while maintaining differentiation. Conversely, near upscale commercial areas including commercial streets and economic complexes, encroaching Transgressive Temporary Lifestyle Services and Transgressive Temporary Commercial Retail exhibit a complementary and symbiotic relationship with formal high-end businesses, resulting in a positive facilitative effect.
As shown in Figure 12c, accessibility to public administration facilities exhibits significant spatial heterogeneity and periodic fluctuations. The activity intensity of facilities such as hospitals, schools, and enterprises peaks on weekdays, generating concentrated pedestrian flow and high frequency, immediate consumption demand. This provides a stable market foundation for the informal economy. Differences in the user profiles served by various facilities further intensify the heterogeneity of distance effects. Informal operators show strong dependence on proximity to hospitals and schools. In contrast, government agencies are characterized by limited demand scale and a high degree of enclosure, exerting a significant negative influence on informal activity at close range.
As shown in Figure 12d, accessibility to public service facilities includes parks and squares. Although the informal commercial spaces relies on the dense flow of visitors around tourist attractions, it is constrained by strict spatial management. In core areas such as attraction entrances, strong control strongly suppresses it, while in nearby areas, it utilizes management gaps to secure opportunities for survival. As the distance increases, the decline in visitor flow weakens the survival foundation, and the heterogeneity of informal commercial spaces distribution gradually shifts to other dominant factors.
Figure 12e shows that accessibility to transport nodes, including subway and bus stations, has a stronger promoting effect on the informal economy the closer it is. As key nodes for the flow of people in the city, transportation hubs lead to a noticeable local clustering of Transgressive Temporary Lifestyle Services and Transgressive Temporary Commercial Retail, showing the most significant positive impact.
Figure 12f demonstrates that the influence intensity of road intersection accessibility on informal economy agglomeration increases progressively from northeast to southwest. 61.6% of informal economy sites are located within 50 m of road intersections. Intersections along local streets, with their pedestrian-friendly environments, represent ideal locations for informal vending, showing the strongest positive effect. In contrast, intersections along arterial roads, designed primarily for vehicular throughput with minimal public interface, exert a weaker influence.
4.3.4. Spatial Suitability
As shown in Figure 13a, as the distance from the arterial road increases, its positive facilitative effect shows an increasing trend. Although urban arterial roads are high-traffic channels, the fast-moving vehicles and lack of safe spaces for stopping together suppress the survival of informal commercial spaces.
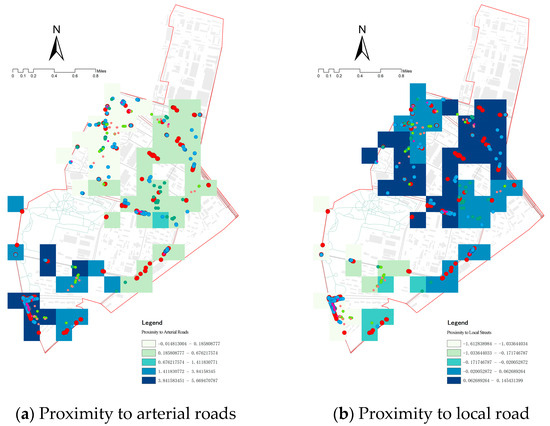
Figure 13.
Spatial suitability (prepared by the author).
As shown in Figure 13b, local street adjacency exhibits a distinct spatial differentiation in relation to the spatial clustering of the informal economy. In aging residential neighborhoods, local streets within groups are characterized by narrow widths, high network density, and low design speeds. Therefore, local street adjacency has a significant positive effect in aging residential neighborhoods. In upscale communities, the street networks are often sparse and highly closed off, lacking active living interfaces, which results in a negative impact of local street adjacency in these areas.
4.3.5. Intensity of Community Management
As shown in Figure 14a, in mixed and aging neighborhoods, lack of regulation suppresses the agglomeration of informal commercial spaces. The absence of effective regulation in these areas can easily lead to public order disorder and chaotic land use, resulting in a relatively scattered distribution of informal commercial spaces. In contrast, in newly developed upscale residential areas, lack of regulation may reduce institutional costs to some extent, thereby exhibiting a stronger positive response.
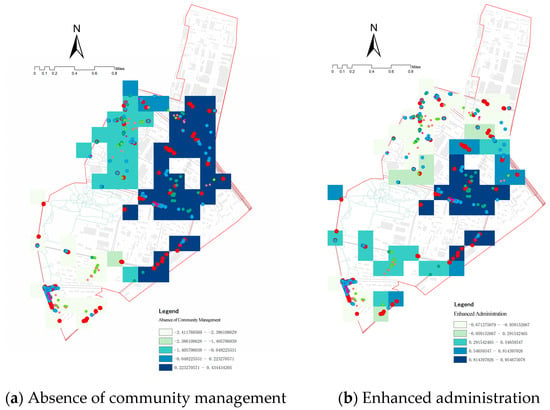
Figure 14.
Intensity of community management.
As shown in Figure 14b, Enhanced Community Management has a suppressive effect on the agglomeration of informal commercial spaces in low-end areas such as morning markets and wholesale markets. Enhanced Community Management forces informal commercial spaces in upscale residential areas to concentrate on the periphery of the residential areas, inadvertently creating higher-density agglomeration points near metro station commercial complexes, shopping streets, and other nearby areas.
4.4. Results of Factor Interaction Detection
This study, using the geographic detector method, revealed that the differences in the spatial agglomeration differences of the informal economy are the result of multiple factors acting together. The results shown in Figure 15 reveal that the explanatory power (q value) of all two-factor interactions for spatial differentiation is higher than that of any single factor, and the effects are nonlinearly enhanced, with no factors acting independently in the two-factor enhancement.
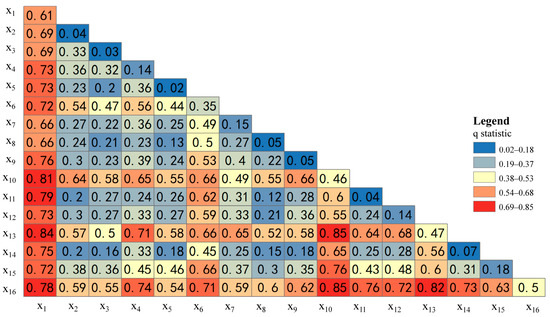
Figure 15.
Factor interaction detection (prepared by the author).
Among them, 81.67% of interaction types exhibit nonlinear enhancement. Combinations such as population density with transport hubs (q = 0.79) and public service facilities with unmanaged status (q = 0.76) have strong explanatory power. Compared with nonlinear enhancement, two-factor enhancement occurs more frequently when public service facilities interact with other factors. When public service facilities interact with factors such as proximity to main roads or Enhanced Community Management, the q value reaches 0.85, reflecting the pivotal role of facility infrastructure in strengthening the effects of other factors.
Overall, the interactive network formed by four types of factors, public services, population density, proximity to main roads, and community management, jointly governs the formation of the spatial pattern of the informal economy. This finding deepens the systematic understanding of the self-organizing logic of the informal economy at a mechanistic level and also provides a theoretical basis for differentiated governance.
4.5. Differentiated Zoning Governance Based on Spatial Heterogeneity
The “Zoning-Timing-Categorization” governance framework developed in this study achieves creative synergy between strategic planning and everyday tactics through three interconnected dimensions: “Zoning” addresses spatial heterogeneity across aging residential communities, new residential developments, and transportation hubs by proposing differentiated governance pathways; “Timing” aligns institutional arrangements with the rhythms of daily life by adapting to weekday and weekend social activity patterns; “Categorization” implements context-specific guidance strategies based on spatial functional characteristics, facilitating a shift in governance logic from unitary control to polycentric co-governance. Grounded in the practical realities of urban planning regulation in Harbin and similar cities, the framework translates theoretical concepts into an operational governance system. By precisely matching planning tools with regulatory approaches, it effectively resolves the core tension between functional needs and regulatory constraints in urban marginal space governance. As systematically detailed in Table 11, the framework’s components and implementation pathways provide institutional reference for advancing inclusive, resilient, and sustainable urban governance.

Table 11.
Governance Framework Implementation Pathway.
4.5.1. Zoning-Based Governance
In aging residential communities, planning interventions focus on creating neighborhood service zones through the strategic use of interstitial spaces between buildings and marginal areas along streets for standardized vending facilities. These installations are esthetically enhanced through micro-renewal strategies that incorporate public art and green infrastructure. The regulatory framework employs a co-management system where neighborhood committees oversee vendor licensing and daily operations while establishing community commercial agreements. A self-management approach requires vendors to maintain their immediate environment through designated responsibility zones.
In upscale communities, planning instruments emphasize “functional flexibility and complementarity” by designating elastic business zones at community entrances and within commercial setback areas, equipped with mobile container stalls and standardized municipal interfaces. Regulation implements a “flexible operation licensing” system, where sub-district offices and urban management departments jointly approve operating hours and scope, while establishing a dynamic evaluation mechanism to periodically assess impacts on formal commercial activities.
In transportation hub contexts, planning tools focus on “balancing passage and consumption” by establishing time-limited vending zones within 50 m of exits, with physical barriers clearly demarcating commercial areas from passenger flow channels. Regulation employs “time-specific precision control” technology, utilizing electronic fencing to restrict operating hours and deploying smart monitoring equipment for crowd early warning and real-time management.
4.5.2. Timing-Based Governance
During weekdays, planning tools emphasize “scenario adaptation” by establishing peak-hour service points around schools, hospitals, and office buildings for breakfast and parcel delivery, while configuring midday catering and retail in business districts. Regulation implements a “peak-hour permitting” system that issues time-specific operation licenses and enforces strict staggered management to restrict non-peak hour street vending.
On weekends, planning tools focus on “demand guidance” through landscaped markets and cultural-creative stalls in parks and squares, while organizing comprehensive services like farmers’ markets and repair services in community plazas. Regulation adopts a “categorized guidance strategy” that manages morning and evening markets in backstreets, utilizing intelligent dispatch systems to dynamically adjust service point density based on real-time pedestrian flow data.
4.5.3. Categorization-Based Governance
Categorization-based governance addresses all spatial types by establishing a systematic business format management system. At the planning level, it implements a “Business Access List” mechanism that defines encouraged and restricted business categories according to community needs, while issuing “Facility Standards Guidelines” to regulate stall design, safety, and hygiene requirements, thereby promoting the standardized operation of informal commerce. On the regulatory front, it enforces a “Credit Points System” that maintains vendor profiles, awards points for compliant behavior, and accumulates penalty points for violations. Simultaneously, it constructs a “Multi-stakeholder Collaborative Supervision” framework, forming a three-tiered oversight mechanism involving community patrols, sub-district coordination, and departmental enforcement to ensure effective implementation of governance measures.
5. Discussion and Conclusions
5.1. Discussion
5.1.1. Theoretical Interpretation of Driving Mechanisms and Deconstruction of Heterogeneous Outcomes
This study employs Multiscale Geographically Weighted Regression (MGWR) to reveal the heterogeneous effects of built environment factors on the spatial distribution of informal commerce. The key variables and core findings of this heterogeneity are summarized in Table 12. By integrating David Harvey’s theory of secondary capital circulation [42], Lefebvre’s spatial production theory [43], and de Certeau’s theory of everyday practice [17], this research further deconstructs the quantitative results through three theoretical dimensions: spatial dependency and parasitic claims under capital logic, everyday practices and tactical spatial production, and spatial negotiation and resilience strategies under power discipline. This comprehensive theoretical framework provides profound insights into the formation mechanisms underlying spatial heterogeneity.

Table 12.
Summary of Key Variables Related to the Theoretical Interpretation of Driving Mechanisms and Heterogeneity Results.
David Harvey’s theory of secondary capital circulation elucidates how informal commerce participates in capital cycles through spatial dependency [42]. The MGWR results demonstrate positive coefficients for facility function density (X5, β = 0.355) and transport node accessibility (X11, β = 2.949), confirming informal commerce’s strategy of capitalizing on spatial externalities from formal commercial facilities and transportation hubs [44]. This parasitic development model enables minimal-cost sharing of spatially created value from formal capital [45].
Lefebvre’s spatial production theory and de Certeau’s practice theory collectively explain the formation logic of informal commerce in aging neighborhoods [17,43]. Population density (X1) shows divergent effects—positive in aging communities (β = 0.290) versus negative in upscale areas (β = −0.546)—revealing residents’ spatial tactics of converting marginal spaces like ground floors to commercial use, resisting capitalist logic [17]. The synergistic effect between local road proximity (X14) and building density (X6) forms the material basis of Lefebvrian “representational space” [43].
The spatial negotiation mechanism under power discipline is verified through the distance-decay effect of arterial road proximity (X13, maximum coefficient 5.724), demonstrating how informal commerce strategically retreats to areas with weaker regulatory oversight. Community management intensity shows significant heterogeneous effects, with enhanced community management (X16, β = 0.955) and absence of management (X15, β = −0.821) forming a sharp contrast that reveals moderate regulatory flexibility as crucial for achieving inclusive governance. This complex spatial response mechanism underscores the significance of maintaining dynamic balance between formal rules and informal orders.
5.1.2. The “Zoning-Timing-Categorization” Framework: Reconstructing the Logic of Informal Commercial Space Governance
Compared to the tolerance, eviction, and formalization paradigms prevailing in global informal commerce governance, which share a top-down control logic and systematic neglect of the “right to the city,” this study’s “zoning-timing-categorization” three-dimensional governance framework achieves fundamental paradigm transformation. Grounded in protecting vulnerable groups’ “right to the city,” the framework establishes a collaborative mechanism integrating “government strategies and civic practices” through spatial precision, temporal coordination, and operational inclusivity. Zoning governance tailors strategies to distinct spatial characteristics—marginal spaces in aging neighborhoods, flexible nodes in new developments, and time-limited zones around transit hubs. Temporal governance adopts flexible management responding to weekday commuting and weekend leisure rhythms. Categorical governance incorporates diverse commercial activities into urban fabric through business catalogs and credit systems. This approach simultaneously safeguards spatial rights and operational autonomy while maintaining public order through adaptive regulation, successfully transcending the “control-stifles, chaos-follows-deregulation” dilemma of traditional models. It offers a people-centered solution for inclusive urban governance that ensures rights protection, developmental space, and sustainable vitality.
5.2. Conclusions
This study adopts a volunteered geographic information (VGI) approach to systematically identify informal commercial spaces, enabling the construction of a comprehensive dataset encompassing six distinct types of such spaces. Using Local Moran’s I (LISA) spatial clustering analysis, we reveal imbalanced patterns of spatial agglomeration. Integrating “the right to the city” theory with the 7D indicator framework, we apply Multiscale Geographically Weighted Regression (MGWR) and geographical detector analysis to explore multiscale driving mechanisms of built environment factors. Based on these findings, we innovatively propose a “zoning-timing-categorization” governance framework, supplemented by specific tools including flexible land use and registration management, thus providing a systematic solution for the sustainable governance of urban informal commercial spaces.
- (1)
- Spatial autocorrelation analysis confirms that informal commercial spaces exhibit significant clustering characteristics (Global Moran’s I = 0.748, p < 0.001). Local Moran’s I further verifies an imbalanced spatial distribution pattern: high-high (HH) clusters (Local Moran’s I: 0.004–2.524; p = 0.002–0.050) are predominantly located within 50 m radii of subway entrances and road intersections—high pedestrian flow nodes—where transgressive temporary retail and service activities concentrate; low-low (LL) clusters (Local Moran’s I: 0.038–5.276; p = 0.002–0.042) are densely distributed in old residential areas with building densities exceeding 65%, dominated by expanded fixed life-service formats. This spatial differentiation pattern fully demonstrates the profound dependence of informal commercial spaces on built environment elements.
- (2)
- Through MGWR modeling and geographical detector analysis, this study reveals the multiscale driving mechanisms and complex interaction effects underlying the formation of informal commercial spaces. The MGWR model identifies three distinct operational scales: the local scale (bandwidth < 13.18%), comprising factors such as weekend pedestrian flow, facility accessibility, and regulatory intensity; the regional scale (bandwidth: 30–50%), encompassing resident population density and the functional diversity of facilities; and the global scale (bandwidth > 70%), involving building density and weekday pedestrian flow. Analysis of driving effects reveals significant spatial heterogeneity in the influences of factors across different socio-spatial contexts. Population density exerts positive effects in old residential areas (β = 0.290) but negative effects in upscale communities (β = −0.546), while weekday pedestrian flow demonstrates consistently positive effects across the study area (β = 0.048–0.087). Particularly noteworthy is the nonlinear relationship observed in community management intensity: unregulated areas show strong inhibitory effects (β = −3.412), whereas moderate regulation promotes commercial clustering (β = 0.955), confirming the “regulation paradox.” Geographical detector results further reveal significant interaction enhancement effects. The interaction between public service facility density and public transportation accessibility exhibits the strongest explanatory power (q = 0.92), indicating that infrastructure synergy substantially amplifies impacts on commercial distribution. The interaction between weekday pedestrian flow and building density (q = 0.78) illustrates the coupling mechanism between built environment fundamentals and passenger flow demand.
- (3)
- This study develops a “zoning-timing-categorization” three-dimensional governance framework that achieves paradigm transformation in informal commerce governance—from “control-compliance” to “strategy-tactic” coordination—through systematic integration of spatial adaptation, temporal coordination, and operational guidance. The framework establishes precise spatial coupling between government strategies and civic tactics by identifying spatial heterogeneity across aging neighborhoods, newly developed communities, and transportation hubs in its zoning dimension; achieves temporal synchronization between urban spatial resources and residents’ daily needs through rhythm-based regulation in its timing dimension; and incorporates diverse informal commercial activities into standardized governance through business access lists and credit management systems in its categorization dimension. The framework’s core breakthrough lies in fundamentally transcending the binary dilemma of conventional “tolerance-eviction-formalization” approaches, establishing an inclusive governance ecology that ensures rights protection and pluralistic co-governance, thereby transforming informal commerce from a governance burden into urban development momentum. Theoretically, it advances the modernization of urban governance models, offering significant reference for Chinese and global cities pursuing people-oriented sustainable governance.
5.3. Research Limitations and Future Prospects
5.3.1. Research Limitations
This study has certain limitations in data collection, mainly constrained by the coverage and timeliness of street view images. Some informal commercial activities in backstreets, alleys, and remote areas may not have been fully identified. It is suggested that future research should construct a multi-source data fusion system, integrating information from multiple channels such as video surveillance [46], volunteer-collected street views, and location-based services [47] to improve the breadth and timeliness of data coverage. It may also consider introducing high-resolution satellite images to refine the informal commercial space database.
5.3.2. Future Prospects
Horizontally, we recommend conducting cross-regional comparative analyses by selecting industrial cities in Northeast China at different transitional stages as case studies. Employing multi-group MGWR models, future research could examine the differential impacts of institutional contexts and policy implementation on the formation of informal commercial spaces, thereby systematically clarifying the operational boundaries and regional adaptability of governance policies.
Longitudinally, it is essential to establish a medium- to long-term dynamic monitoring framework. Utilizing Geographically and Temporally Weighted Regression (GTWR), researchers may track the spatiotemporal evolution patterns of informal commerce. Combined with deep learning techniques for the automated recognition of multi-phase street-view imagery, such efforts could facilitate the development of business transition indices and policy intervention evaluation metrics, ultimately forming a scientifically rigorous framework for spatiotemporal evolution analysis and impact assessment.
Author Contributions
Conceptualization, H.W. and C.P.; methodology, H.W.; software, H.W.; validation, H.W. and C.P.; formal analysis, H.W.; investigation, H.W.; resources, C.P.; data curation, H.W.; writing—original draft preparation, H.W.; writing—review and editing, C.P.; visualization, H.W.; supervision, C.P.; project administration, C.P.; funding acquisition, Chunyu Pang. All authors have read and agreed to the published version of the manuscript.
Funding
This research received no external funding.
Institutional Review Board Statement
Not applicable.
Informed Consent Statement
Not applicable.
Data Availability Statement
Data are contained within the article.
Conflicts of Interest
The authors declare no conflicts of interest.
Appendix A

Table A1.
Multicollinearity Diagnostics Results.
Table A1.
Multicollinearity Diagnostics Results.
| Evaluation Framework | Variable X | Probability | VIF | Treatment |
|---|---|---|---|---|
| population factors | Resident Population Density | 0.056304 | 1.639970 | Retain |
| Weekday Pedestrian Activity Intensity | 0.000797 * | 2.117299 | Retain | |
| Weekend Pedestrian Activity Intensity | 0.000216 * | 1.510626 | Retain | |
| functional diversity of facilities | Facility Function Mix Index | 0.000000 * | 3.180322 | Retain |
| Facility Function Density | 0.893659 | 1.148985 | Retain | |
| Building Density | 0.838686 | 1.149264 | Retain | |
| accessibility of the built environment | Residential Accessibility | 0.000216 * | 1.974128 | Retain |
| Retail and Commerce Accessibility | 0.472400 | 2.641316 | Retain | |
| Administration Accessibility | 0.000000 * | 1.919509 | Retain | |
| Public Service Accessibility | 0.000000 * | 3.003927 | Retain | |
| Transport Node Accessibility | 0.000000 * | 3.395091 | Retain | |
| Road Intersection Density | 0.002903 * | 1.647737 | Retain | |
| spatial suitability | Proximity to Arterial Roads | 0.000000* | 3.053724 | Retain |
| Proximity to Local Streets | 0.797581 | 4.802300 | Retain | |
| intensity of community management | Absence of Community Management | 0.117155 | 4.633856 | Retain |
| Basic-Level Community Management | 0.000000 * | 6.380415 | Remove | |
| Enhanced Community Management | 0.000002 * | 4.758094 | Retain |
Note: * indicates a statistically significant p-value (p < 0.01).
References
- Hart, G.P. Disabling Globalization: Places of Power in Post-Apartheid South Africa; University of California Press: Oakland, CA, USA, 2002. [Google Scholar] [CrossRef]
- Cross, J. Street vendors, and postmodernity: Conflict and compromise in the global economy. Int. J. Sociol. Soc. Policy 2000, 20, 29–51. [Google Scholar] [CrossRef]
- Hu, A.; Zhao, L. The Development Trajectory of Informal Economy in Chinese Cities (1949–2004). J. Tsinghua Univ. Philos. Soc. Sci. 2006, 21, 111–119. [Google Scholar]
- Liu, H. Informal Economy in China; China Statistics Press: Beijing, China, 2011. [Google Scholar]
- Boonjubun, C. Conflicts over streets: The eviction of Bangkok street vendors. Cities 2017, 70, 22–31. [Google Scholar] [CrossRef]
- Peimani, N.; Kamalipour, H. Mapping the Spatiality of Informal Street Vending. J. Urban. Int. Res. Placemaking Urban Sustain. 2025, 18, 329–348. [Google Scholar] [CrossRef]
- Bhowmik, S. Street Vendors in the Global Urban Economy; Taylor & Francis: Abingdon, UK, 2010. [Google Scholar]
- Adama, O. Abuja is not for the poor: Street vending and the politics of public space. Geoforum 2020, 109, 14–23. [Google Scholar] [CrossRef]
- Anaafo, D.; Nutsugbodo, R.Y.; Agyepong, E.; Anane, G.K.; Mensah, B.A.; Bata, P.D. Place making decisions among informal street food vendors in Sunyani, Ghana. Cities 2024, 154, 10. [Google Scholar] [CrossRef]
- Taylor, J.; Song, L. Return to the Streets. Cityscape 2016, 18, 71–88. [Google Scholar]
- Gillespie, T. From quiet to bold encroachment: Contesting dispossession in Accra’s informal sector. Urban Geogr. 2017, 38, 974–992. [Google Scholar] [CrossRef]
- Seomun, G.; Kim, H.; Woosnam, K.M.; Kim, H. Commercial gentrification revisited: Social capital and community governance in regenerated neighborhoods of South Korea. Cities 2024, 149, 104970. [Google Scholar] [CrossRef]
- Lefebvre, H. The Right to the City. Prakt. Teoretyczna 2012, 5, 183–197. [Google Scholar] [CrossRef]
- Harvey, D. The right to the city. Int. J. Urban Reg. Res. 2010, 27, 939–941. [Google Scholar] [CrossRef]
- Soja, E.W. Seeking Spatial Justice in Los Angeles. In My Los Angeles: From Urban Restructuring to Regional Urbanization; University of California Press: Oakland, CA, USA, 2014. [Google Scholar]
- Mitchell, D. The Right to the City: Social Justice and the Fight for Public Space; Guilford Press: New York, NY, USA, 2003. [Google Scholar] [CrossRef][Green Version]
- Certeau, M.D. The Practice of Everyday Life; University of California Press: Oakland, CA, USA, 2011. [Google Scholar]
- Peng, J.; Peng, X.; Zhang, J. Identifying Key Influencing Factors of Street Vending Economy Integration into Urban Governance—An Empirical Study Based on the DEMATEL Method. Mod. Urban Res. 2021, 8–13. [Google Scholar] [CrossRef]
- Bandauko, E.; Arku, G. “It is no longer the sunshine city, it is now a dump site city”: Discursive construction of urban space and street trading in Harare, Zimbabwe. Cities 2024, 155, 105488. [Google Scholar] [CrossRef]
- Thinh, N.K.; Peimani, N.; Kamalipour, H. Forms and spatiality of street vending in informal settlements: The case of in-between spaces in Hanoi. Cities 2025, 161, 105870. [Google Scholar] [CrossRef]
- Cho, G.H.; Rodriguez, D. Location or design? Associations between neighbourhood location, built environment and walking. Urban Stud. 2015, 52, 1434–1453. [Google Scholar] [CrossRef]
- Zhao, P. The Impact of the Built Environment on Bicycle Commuting: Evidence from Beijing. Urban Stud. 2014, 51, 1019–1037. [Google Scholar] [CrossRef]
- Beckers, P.; Kloosterman, R.C. Business spaces between entrepreneurs and opportunities. The impact of the local built environment and zoning regulations on businesses in Dutch cities. Urban Stud. 2014, 51, 153–169. [Google Scholar] [CrossRef]
- Zhang, Y.; Zhang, L.; Wu, N. The Impact of Urban Built Environment on the Spatial Distribution of Itinerant Vendors—A Discussion on the Planning and Site Selection of Vendors’ Guidance Zones. Hum. Geogr. 2017, 32, 7. [Google Scholar]
- Kim, A.M. The Mixed-Use Sidewalk. J. Am. Plan. Assoc. 2012, 78, 225–238. [Google Scholar] [CrossRef]
- Pang, Y.-Q.; Xue, D.-S.; Wang, D. THE DISTRIBUTION AND SPATIAL IMPACT FACTORS OF STREET HAWKER—A Case Study of Street Hawers on West Zhongshan Road. Hum. Geogr. 2012, 27, 56–61. [Google Scholar]
- Sung, H.; Eom, S. Evaluating transit-oriented new town development: Insights from Seoul and Tokyo. Habitat Int. 2024, 144, 18. [Google Scholar] [CrossRef]
- Wang, H.; Xu, Y.; Wei, X. Rural Resilience Evaluation and Influencing Factor Analysis Based on Geographical Detector Method and Multiscale Geographically Weighted Regression. Land 2023, 12, 1270. [Google Scholar] [CrossRef]
- Xiang, Z.; Sheng, J.; Ban, P.; Li, Q. The Spatiotemporal Characteristics of the Impact of the Built Environment in the Main Urban Area of Wuhan on Street Vitality—Based on Multi-Scale Geographically Weighted Regression. Mod. Urban Res. 2024, 39, 7–16. [Google Scholar]
- Liu, Y.; Liu, X.; Gao, S.; Gong, L.; Kang, C.; Zhi, Y.; Chi, G.; Shi, L. Social Sensing: A New Approach to Understanding Our Socioeconomic Environments. Ann. Am. Assoc. Geogr. 2015, 105, 512–530. [Google Scholar] [CrossRef]
- Ewing, R.; Cervero, R. Travel and the Built Environment. J. Am. Plan. Assoc. 2010, 76, 265–294. [Google Scholar] [CrossRef]
- Hao, X.; Long, Y.; Shi, M.; Wang, P. Beijing Street Vitality: Measurement, Influencing Factors and Planning and Design Implications. Shanghai Urban Plan. 2016, 2016, 9. [Google Scholar] [CrossRef]
- Zhao, C.; Yang, B.; Liu, D. PSPL Survey Method: An Evaluation Method for Urban Public Space and Public Life Quality—A Study on Jan Gehl’s Theory and Method of Urban Public Space Design (3). Chin. Landsc. Archit. 2012, 28, 34–38. [Google Scholar] [CrossRef]
- Zhu, C.; Zheng, L.; Zhang, Y. Analysis of the Spatial Heterogeneity of Shared Bicycles Based on MGWR. Logist. Sci. Technol. 2024, 47, 72–77. [Google Scholar]
- Wang, X.; Hu, J.; Qiu, B. The Impact of Public Service Facilities on Housing Prices from the Perspective of Space-Time Accessibility—A Study Based on Multi-Scale Geographically Weighted Regression (MGWR). Mod. Urban Res. 2024, 39, 116–122. [Google Scholar]
- Shen, T.; Yu, H.; Zhou, L.; Gu, H.; He, H. The Impact Mechanism of Second-Hand Housing Prices in Beijing—A Study Based on the Multi-Scale Geographically Weighted Regression Model (MGWR). Econ. Geogr. 2020, 40, 9. [Google Scholar]
- Fotheringham, A.S.; Yang, W.; Kang, W. Multiscale Geographically Weighted Regression (MGWR). Ann. Am. Assoc. Geogr. 2017, 107, 1247–1265. [Google Scholar] [CrossRef]
- Yang, X.; Zhang, X.; Li, S.; Tian, Y.; Tan, C.; Ding, S.; Kalonji, G.; Xu, L. Increasing urban flooding facing metro system: Evidence from Internet media records in China from 2001 to 2021. Int. J. Disaster Risk Reduct. 2025, 124, 105551. [Google Scholar] [CrossRef]
- Wang, J.F.; Zhang, T.L.; Fu, B.J. A measure of spatial stratified heterogeneity. Ecol. Indic. 2016, 67, 250–256. [Google Scholar] [CrossRef]
- Jacobs, J. The Death and Life of Great American Cities; Vintage Books: Vancouver, WA, USA, 2012. [Google Scholar]
- Kalnins, A.; Praitis Hill, K. The VIF Score. What is it Good For? Absolutely Nothing. Organ. Res. Methods 2025, 28, 58–75. [Google Scholar] [CrossRef]
- Harvey, D. The urban process under capitalism: A framework for analysis. Int. J. Urban Reg. Res. 1978, 2, 101–131. [Google Scholar] [CrossRef]
- Lefebvre, H. The Production of Space; Basil Blackwell: Oxford, UK, 1991; ISBN 978-0-631-18177-4. [Google Scholar]
- David, H. From Managerialism to Entrepreneurialism: The Transformation in Urban Governance in Late Capitalism. Geogr. Ann. Ser. B Hum. Geogr. 1989, 71, 3–17. [Google Scholar] [CrossRef]
- Harvey, D. The Limits to Capital: New and Fully Updated Edition; Basil Blackwell: Oxford, UK, 1982. [Google Scholar]
- Mahabir, R.; Schuchard, R.; Crooks, A.; Croitoru, A.; Stefanidis, A. Crowdsourcing Street View Imagery: A Comparison of Mapillary and OpenStreetCam. Int. J. Geo-Inf. 2020, 9, 341. [Google Scholar] [CrossRef]
- Zhang, F.; Zu, J.; Hu, M.; Zhu, D.; Kang, Y.; Gao, S.; Zhang, Y.; Huang, Z. Uncovering inconspicuous places using social media check-ins and street view images. Comput. Environ. Urban Syst. 2020, 81, 101478. [Google Scholar] [CrossRef]
Disclaimer/Publisher’s Note: The statements, opinions and data contained in all publications are solely those of the individual author(s) and contributor(s) and not of MDPI and/or the editor(s). MDPI and/or the editor(s) disclaim responsibility for any injury to people or property resulting from any ideas, methods, instructions or products referred to in the content. |
© 2025 by the authors. Licensee MDPI, Basel, Switzerland. This article is an open access article distributed under the terms and conditions of the Creative Commons Attribution (CC BY) license (https://creativecommons.org/licenses/by/4.0/).

