Article

Research on the Improvement of Water Retention, Anti-Erosion and Mechanical Properties of Aeolian Sand Slopes Under the Synergistic Effect of Xanthan Gum and Water Retention Agents

1
College of Geology and Environment, Xi’an University of Science and Technology, Xi’an 710054, China
2
Xi’an Botanical Garden of Shaanxi Province, Institute of Botany of Shaanxi Province, Xi’an 710061, China
3
Medical College, Huanghe Science and Technology University, Zhengzhou 450006, China
4
Fugu Yifeng Coal Mine Co., Ltd. of Shaanxi Province, Fugu 719499, China
*
Author to whom correspondence should be addressed.
Sustainability 2025, 17(23), 10441; https://doi.org/10.3390/su172310441
Submission received: 9 October 2025 / Revised: 5 November 2025 / Accepted: 18 November 2025 / Published: 21 November 2025

Abstract

Aeolian sand slopes in the Fugu area of Yulin, Shaanxi Province, China, are prone to rainfall-induced erosion because of the loose structure and low water-holding capacity of the sand, which constrains long-term, sustainable ecological restoration. To address this, aeolian sand was amended with xanthan gum (XG) and a superabsorbent polymer (SAP) and combined with a honeycomb confinement system; evaporation, 70 mm·h−1 rainfall–erosion, and direct shear tests were carried out. SAP increased the 24 h water content of untreated sand from 1.8% to about 20–22%, while excessive SAP led to surface cracking. XG strengthened interparticle bonding and reduced 60 min cumulative erosion from about 53 kg to <0.5 kg (reduction > 99%) and improved shear strength. Within the practically recommended range (XG 0.5–1.0%, SAP ≤ 0.25%), XG and SAP showed water-supply-improving and surface-strengthening effects that effectively covered the early-stage vegetation protection gap, i.e., the period before vegetation becomes dense enough to resist raindrop impact and runoff erosion. The results provide laboratory support for sustainable, nature-based stabilization of aeolian sand slopes in semi-arid engineering areas.

1. Introduction

Aeolian sand slopes in semi-arid regions like the Fugu area of Yulin, China, are highly vulnerable to rainfall-induced erosion due to their loose structure and low water-holding capacity [1,2]. This not only accelerates land desertification but also poses significant threats to the safety of infrastructure projects and regional ecological security [3,4]. Achieving long-term, sustainable stabilization of these slopes remains a critical challenge.
Traditional slope protection methods, such as concrete lattices and grouted riprap, often lack ecological compatibility and long-term effectiveness [4,5]. While single soil amendments like cement or lime can improve strength, they tend to cause soil hardening and cracking in arid environments, adversely affecting vegetation growth [6,7,8,9,10]. The honeycomb confinement system offers a “flexible soil fixation-rigid confinement” advantage [11,12,13], yet its high-permeability pores may accumulate water pressure after rainfall, and its synergy with vegetation requires further investigation.
Ecological slope protection, which integrates engineering reinforcement with ecological restoration, presents a promising alternative. However, its success is often hampered during the early stages of vegetation establishment. Before a complete turf is formed, the slope surface lacks protection against raindrop impact and runoff scouring, creating a critical “protection gap” [14,15,16,17]. During this period, the barren slope is susceptible to erosion, and young vegetation can be easily washed away by extreme rainfall, leading to restoration failure.
To bridge this gap, a combination of soil amendments that simultaneously enhance water availability and surface strength is needed. Xanthan gum (XG), a natural polysaccharide, can form a stable cementing network between soil particles, significantly improving cohesion and erosion resistance while being biocompatible [18,19,20]. Superabsorbent polymers (SAP) can absorb and retain large amounts of water, releasing it gradually during droughts to prolong soil moisture availability [21,22,23,24]. Individually, XG and SAP address structural stability and water retention, respectively. However, research on their synergistic application for aeolian sand slope protection is still scarce. The coupling mechanism governing their joint effect on water retention, anti-erosion, and mechanical properties has not been systematically elucidated.
Therefore, this study is designed to investigate the comprehensive effect of XG and SAP on the stabilization of aeolian sand slopes. A series of experiments, including evaporation, scouring, and direct shear tests, were conducted to achieve the following: quantify the improvements in water retention, anti-erosion capacity, and shear strength of the amended sand; elucidate the synergistic mechanisms between XG and SAP in mitigating the early-stage “protection gap”; and provide a theoretical basis and a sustainable, nature-based solution for ecological slope restoration in arid, wind-blown sandy regions.

2. Materials and Methods

2.1. Experimental Design

In this study, an orthogonal experimental design was employed. The concentration of xanthan gum (XG) in the improved soil was set at 0%, 0.5%, and 1% (w/w, based on the dry soil mass), while the concentration of superabsorbent polymer (SAP) was set at 0%, 0.25%, and 0.5% (w/w). A total of nine treatment groups were established, with each group having three replicates. Thus, a total of 27 samples were prepared, as presented in Table 1.
The concentration ranges of xanthan gum (XG: 0.5–1.0%) and superabsorbent polymer (SAP: 0.25–0.5%) adopted in this study were primarily determined based on relevant literature and experimental observations reported in previous studies.
For XG, the adopted range refers to Tran et al. (2019), who investigated the effect of xanthan gum on sandy soil under arid conditions and demonstrated that a 0.5% biopolymer-to-soil ratio effectively enhanced soil cohesion, water retention, and vegetation survivability, whereas higher concentrations could induce surface crusting and reduced aeration [25]. Accordingly, the upper limit of 1.0% in this study was selected to explore the potential enhancement beyond the optimal literature value while maintaining workability.
For SAP, the selected range (0.25–0.5%) was based on Ostrand et al. (2020), who comprehensively reviewed SAP characteristics and applications and concluded that optimal soil amendment dosages typically range between 0.1% and 0.5% by mass, beyond which infiltration reduction and surface sealing may occur [26].
In addition, a small-scale preliminary feasibility test was conducted at the Yifeng Coal Mine slope site, where these concentration ranges showed satisfactory mixing uniformity and soil surface integrity. Although detailed data were not preserved, the results were consistent with the performance trends reported in the cited literature. Therefore, the selected concentration intervals are considered scientifically reasonable and technically applicable for aeolian sand slope stabilization in arid environments.
To control time- and batch-related nuisance variation, we adopted a randomized complete block design (RCBD) on top of the orthogonal treatment structure. Specifically, three blocks (e.g., three temporal/batch sessions) were defined, and each block contained all nine treatment combinations (XG × SAP). Within every block, the execution order of the nine runs was fully randomized using Microsoft Excel’s RAND() function. This RCBD + within-block randomization converts potential time trends into a block effect and balances unforeseen confounders across treatments, thereby reducing residual variance and improving the power to detect the main and interaction effects of XG and SAP.

2.2. Experimental Materials

2.2.1. Experimental Soil

The soil samples employed in this study were collected from the aeolian sand slope of Yifeng Coal Mine in Fugu County, Yulin City, Shaanxi Province, China (latitude 39°18′14′′–39°20′11′′, longitude 110°22′55′′–110°25′46′′). The sampling depth was from 0 to 20 cm of the surface layer. The soil mass was the sandy soil on the surface of the slope. The basic physical properties of sand are shown in Table 2. The soil samples were transported to the laboratory in sealed containers to prevent moisture loss or contamination. Upon arrival, the samples were processed by manual sieving through a standard 2 mm aperture soil sieve to remove particles exceeding 2 mm in diameter, including gravel and organic debris.

2.2.2. Sample Preparation and Curing Process

The aeolian sand samples were oven-dried at 105 ± 2 °C for 24 h until a constant mass was reached (Δm < 0.1%per hour). After cooling to room temperature, the samples were manually sieved through a 2 mm mesh to remove coarse debris. For each treatment, the required amounts of XG and SAP were weighed according to the design ratios and thoroughly mixed with the dry sand. Mixing was carried out by gradually sprinkling the amendment while stirring with a stainless-steel spatula for 5 min to ensure homogeneity. The moisture content of the mixture was adjusted to the optimum water content (13.1%) and sealed in polyethylene bags for 24 h of pre-curing to achieve moisture equilibration.

2.2.3. Xanthan Gum and Water-Retaining Agents

  • Xanthan gum
In this experiment, the xanthan gum (Xanthan Gum, XG) employed is a natural polymeric polysaccharide fermented by Xanthomonas campestris. The xanthan gum used in this study is a white to pale yellow powder. Its purity is ≥99%, viscosity is ≥1500 cP, and the pH value of a 1% aqueous solution ranges from 6.0 to 8.0. The molecular structure of the xanthan gum consists of D-glucose, D-mannose, and D- glucuronic acid, which form a pentasaccharide-repeating unit in a ratio of 2:2:1. It exhibits a branched-chain structure, with the chemical formula of (C35H49O29)n. Moreover, it demonstrates strong water solubility and adhesiveness. Once incorporated into the soil, the xanthan gum reacts with water to form a viscous gel, thereby enhancing the cohesion among soil particles. This makes it suitable for soil amelioration and slope anti-erosion applications across a wide range of environmental conditions.
2.
Water-Retention Agents
The water-retaining agent used in this experiment is superabsorbent polymer (SAP), a type of polymer material capable of absorbing and retaining a large amount of water. This water-retaining agent is a white powder solid, with the main component being sodium polyacrylate, and its purity is no less than 98%. Its water absorption rate in distilled water is approximately 200–500 times (g/g). The primary constituent of this material is sodium polyacrylate, a polymer that absorbs several hundred times its own weight in water through the formation of hydrogen bonds between its hydrophilic carboxyl groups (-COONa) and water molecules. This hydration process leads to the development of a three-dimensional gel-like structure, which significantly enhances the soil’s capacity for water retention.

2.3. Experimental Methods

2.3.1. Evaporation Experiment

The evaporation experiment aims to assess the water-retaining and anti-cracking properties of XG- and SAP-amended soils by mimicking water evaporation in arid environments. Following the completion of sample preparation, the specimens were placed in an oven set at a temperature of 55 °C for a duration of 24 h (A drying temperature of 55 °C was adopted to simulate the 50–60 °C surface temperature that aeolian sand slopes may experience under summer insolation in Northern Shaanxi, while avoiding thermal degradation or over-shrinkage of SAP/XG amended specimens). Every hour, the mass of each sample was measured using a precision electronic balance (Model BSA224S-CW, accuracy ±0.01 g). Subsequently, the moisture content and evaporation rate were calculated.
Following the evaporation process, the surface morphology of all specimens was photographed. To quantitatively evaluate the development of surface desiccation cracks, representative specimens from each treatment group were selected. The crack boundaries were manually identified and delineated using computer-aided design (AutoCAD 2021) software, and parameters including total crack area, crack area ratio, maximum width, and maximum length were calculated.

2.3.2. Erosion Experiment

A laboratory-scale erosion experiment was conducted to evaluate the effectiveness of xanthan gum (XG) and superabsorbent polymer (SAP) in enhancing the erosion resistance of aeolian sand slopes reinforced with a honeycomb confinement system. The tests employed a custom-built rainfall simulation system (Figure 1), designed to replicate heavy rainfall conditions typical of Northern Shaanxi. The system comprised a steel frame, a 0.75 kW centrifugal pump, a flow-stabilizing tank, a pressure gauge, and four full-cone nozzles (Spraying Systems Co., Wheaton, IL, USA, model, with a standard 60° spray angle, 3.2 mm orifice diameter, ensuring uniform droplet distribution and a consistent spray pattern) fixed at a height of 2.0 m above the slope surface.
The slope model, with dimensions of 0.75 m (length) × 0.5 m (width) × 0.3 m (height) and a gradient of 1:1 (45°), was set up in the test area where the environmental conditions were maintained at 25 ± 2 °C and 30 ± 2% relative humidity. The rainfall intensity was calibrated to 70 mm·h−1. Prior to each test, rainfall uniformity was verified using a grid of 18 collection cups. The rainfall intensity was calibrated to 70 mm·h−1, and the Christiansen’s uniformity coefficient (Cu) was confirmed to be greater than 85% during pre-tests, ensuring adequate spatial distribution of rainfall. The median droplet size was approximately 3.1 mm, representative of natural high-intensity rainfall.
The simulated rainfall lasted for one hour. Runoff was collected at 10 min intervals using a calibrated container. After sedimentation, the supernatant was carefully decanted. The remaining sediment was then oven-dried at 55 °C for 24 h, and the dry sediment mass was determined to calculate the erosion volume.

2.3.3. Direct Shearing Experiment

The direct shear tests were conducted using a ZLB-1 triple direct shear apparatus. The test specimens were remolded soil samples with a dry density of 1.75 g·cm−3 and an initial water content of 13.1%. After mixing to the target water content (13.1%) the material was sealed and cured for 24 h at 25 ± 2 °C and 30 ± 2% RH to allow moisture equilibration and polymer hydration. The samples were statically compacted into ring cutters (diameter: 6.18 cm; height: 2 cm) to ensure uniform density, and the inner walls of the cutters were lubricated with Vaseline to minimize side friction (degree of compaction: 83 ± 1%).
The tests were performed at room temperature (25 ± 2 °C, humidity: 30 ± 2%). Normal stresses of 50, 100, and 200 kPa were applied sequentially, and shearing was carried out at a constant rate of 0.8 mm·min−1 under each stress level. The test was terminated either when the shear stress peaked or when the shear displacement reached 6 mm, with simultaneous recording of the shear stress and displacement data.
The cohesion (c) and internal friction angle (φ) were determined according to the Mohr–Coulomb criterion. Subsequently, a two-way analysis of variance (Two-Way ANOVA, p < 0.05) was employed to assess the main effects of XG and SAP, as well as their interaction effect, on the shear strength parameters.

2.3.4. Statistical Analysis

All statistical analyses were performed using IBM SPSS Statistics 27. Prior to ANOVA, all datasets were tested for normality using the Shapiro–Wilk test and for homogeneity of variances using Levene’s test. A two-way analysis of variance (Two-Way ANOVA) was conducted to evaluate the main effects of xanthan gum (XG) and superabsorbent polymer (SAP), as well as their interaction, on all measured parameters. For parameters that showed significant effects (p < 0.05), post hoc comparisons were carried out using Tukey’s honest significant difference (HSD) test.
In all tables and bar graphs, for a given level of one factor (e.g., within the same XG concentration), values that share a common lowercase letter are not significantly different (p > 0.05) according to the Tukey HSD test. The absence of a common letter indicates a statistically significant difference. The overall main effects of XG and SAP, as well as their interaction, are assessed by the F and p values from the two-way ANOVA and are reported separately in the ANOVA tables. Data are presented as mean ± standard deviation (SD) from three independent replicates (n = 3).

3. Results

3.1. Results and Analyses of the Evaporation Experiment

3.1.1. Desiccation Crack Development

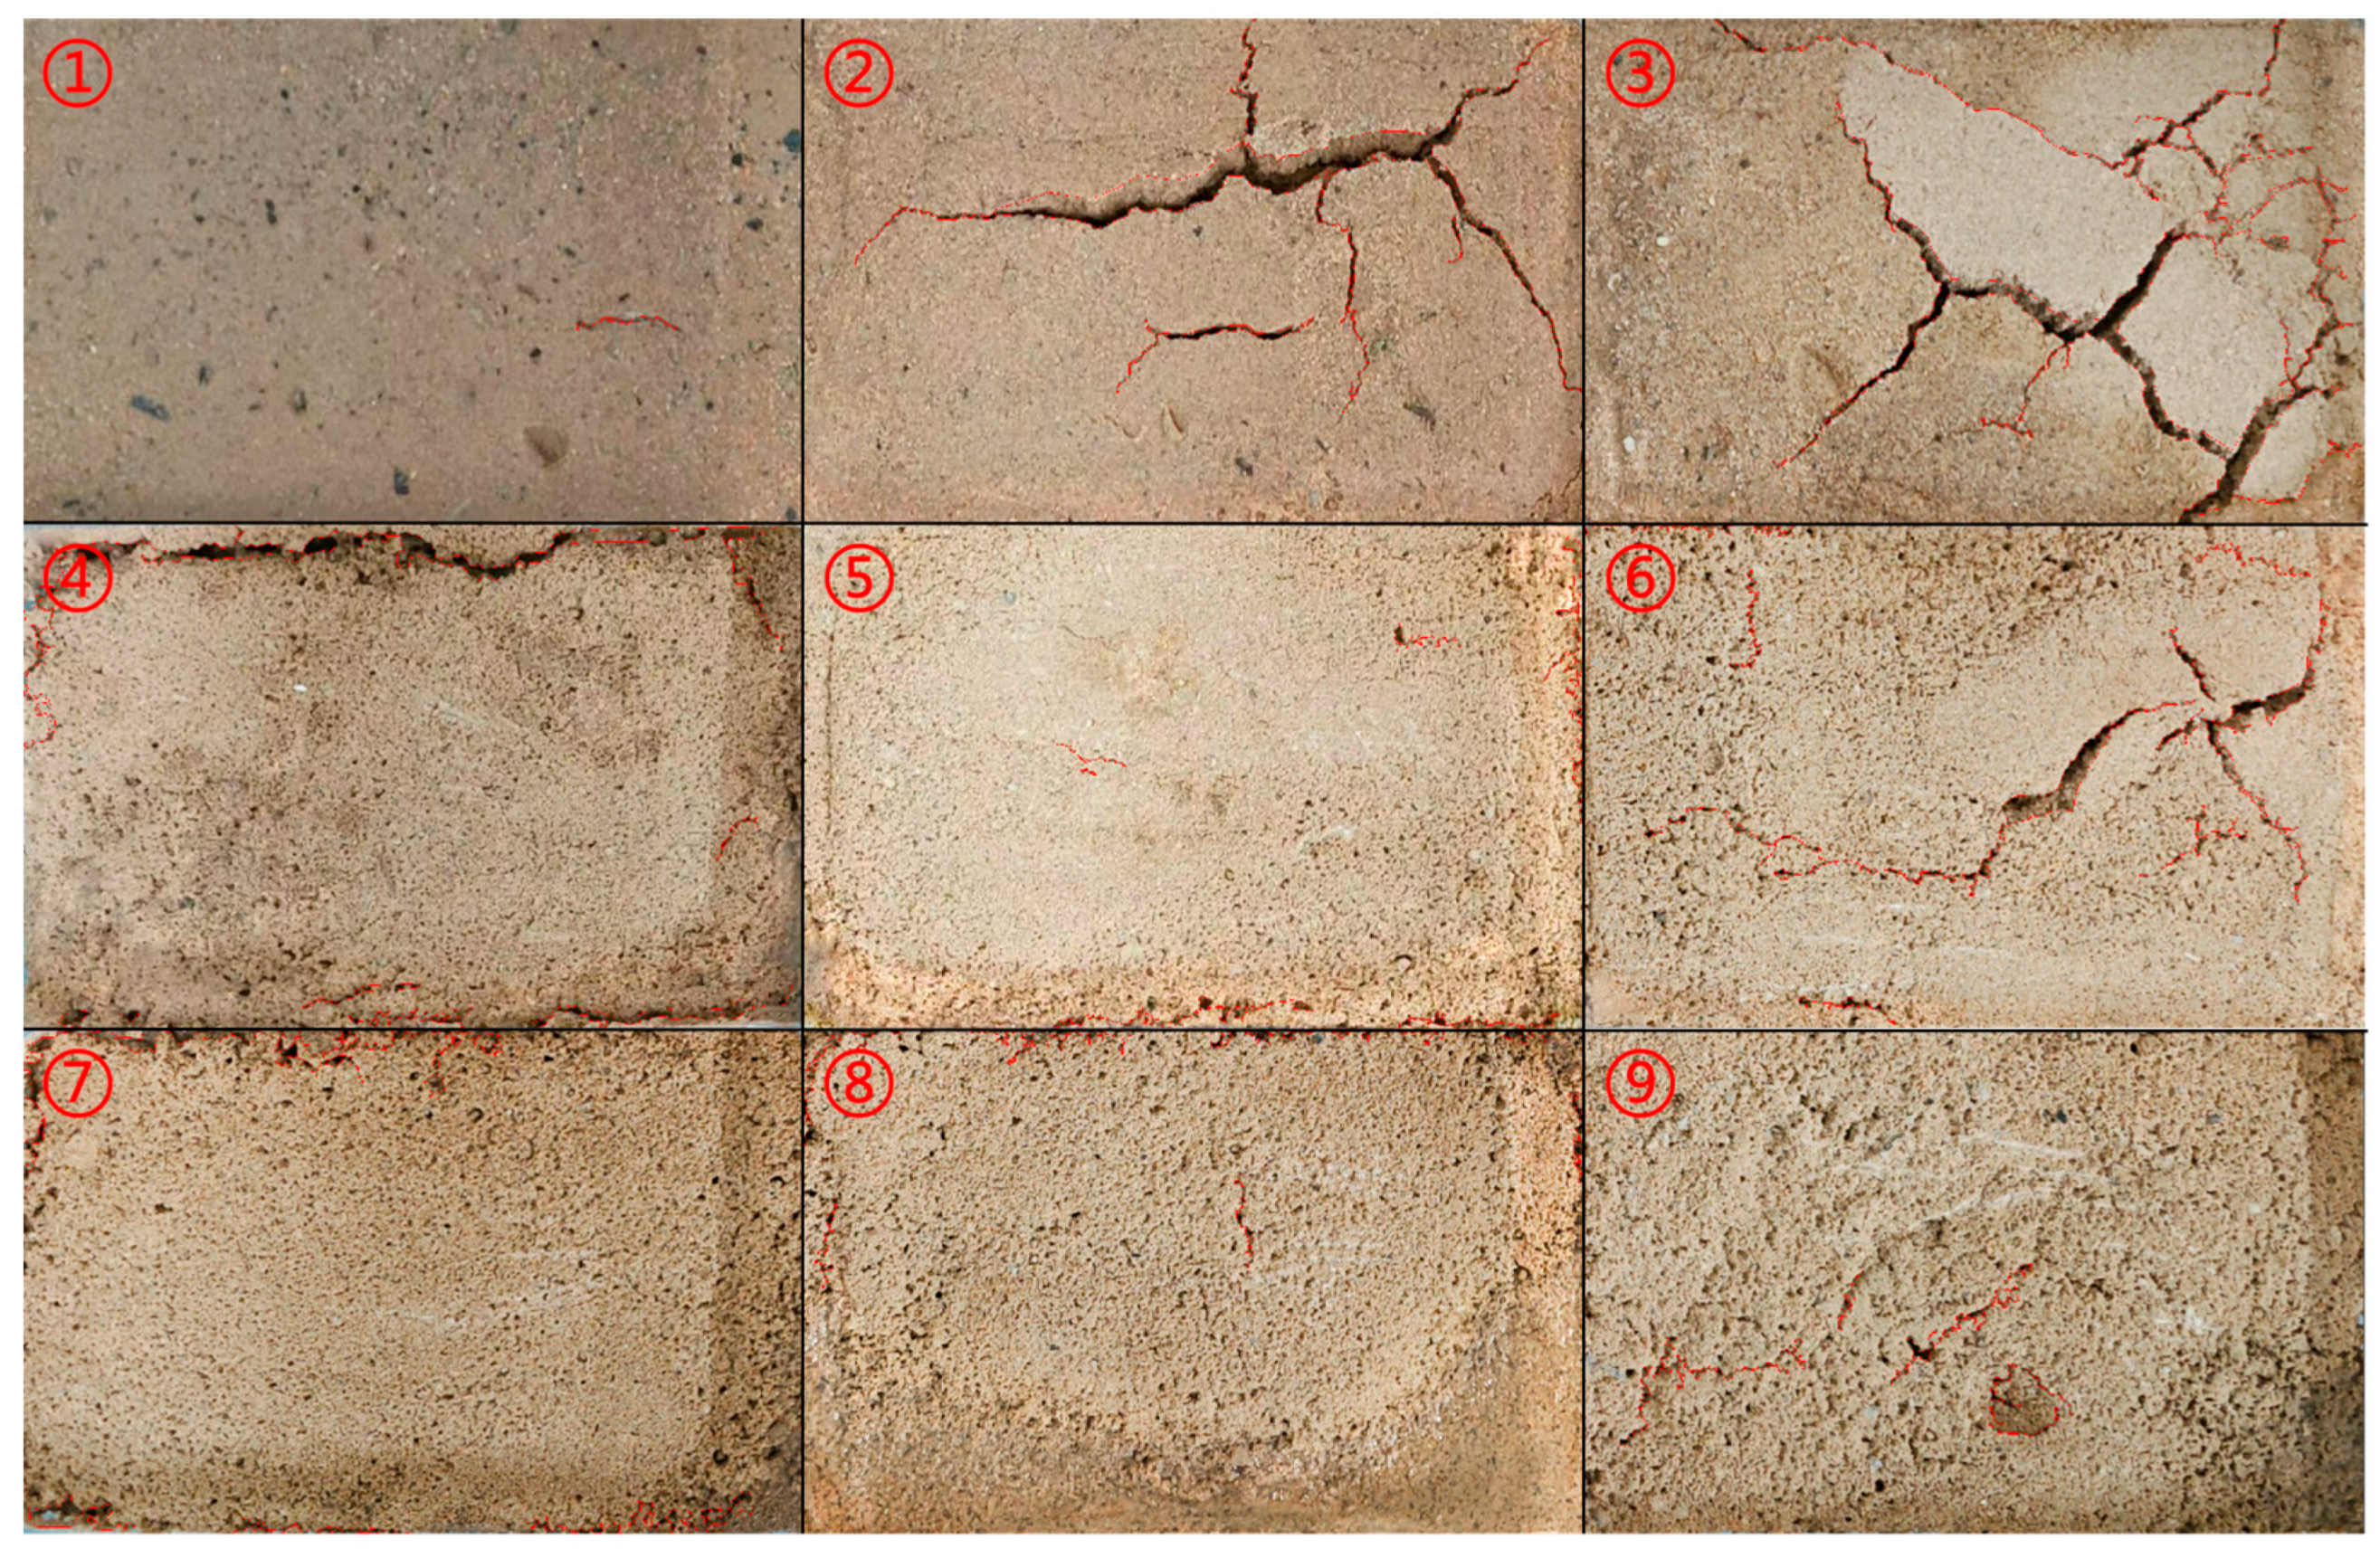
The results of the evaporation experiment are depicted in Figure 2. This figure illustrates the states of the improved soil specimens after 24 h of evaporation under various XG-SAP ratios. The development of surface desiccation cracks varied significantly among different treatments (Figure 2).
Quantitative analysis results (Table 3) demonstrated that treatments with SAP alone (Treatments 2 and 3) developed the most severe cracks, with crack area ratios as high as 4.29% and 4.91%, respectively. Among the treatments with combined XG and SAP, obvious cracks (area ratio of 2.86%) were still observed when the SAP content was 0.5% (Treatment 6). In contrast, the addition of XG effectively suppressed crack development, especially at the high concentration of 1.0% (Treatments 7, 8, 9), where the crack area ratios were all below 2.54%. These results quantitatively confirm that SAP, particularly at high concentrations, induces soil cracking, while the incorporation of XG can significantly mitigate this phenomenon. With the increase in xanthan gum content, surface cracks can be significantly reduced or even completely eliminated. However, when only xanthan gum exists at a low concentration, cracks may still occur along the container wall. As its own concentration and moisture content increase, the development of cracks is inhibited.

3.1.2. Water Evaporation

The final moisture contents of different treatments after 24 h of drying are presented in Table 4. The final moisture content of the pure aeolian sand control group (Treatment 1) was merely 1.8%. In contrast, all treatments incorporating improvement materials exhibited significantly higher moisture contents, spanning from 14.91% to 21.68%.
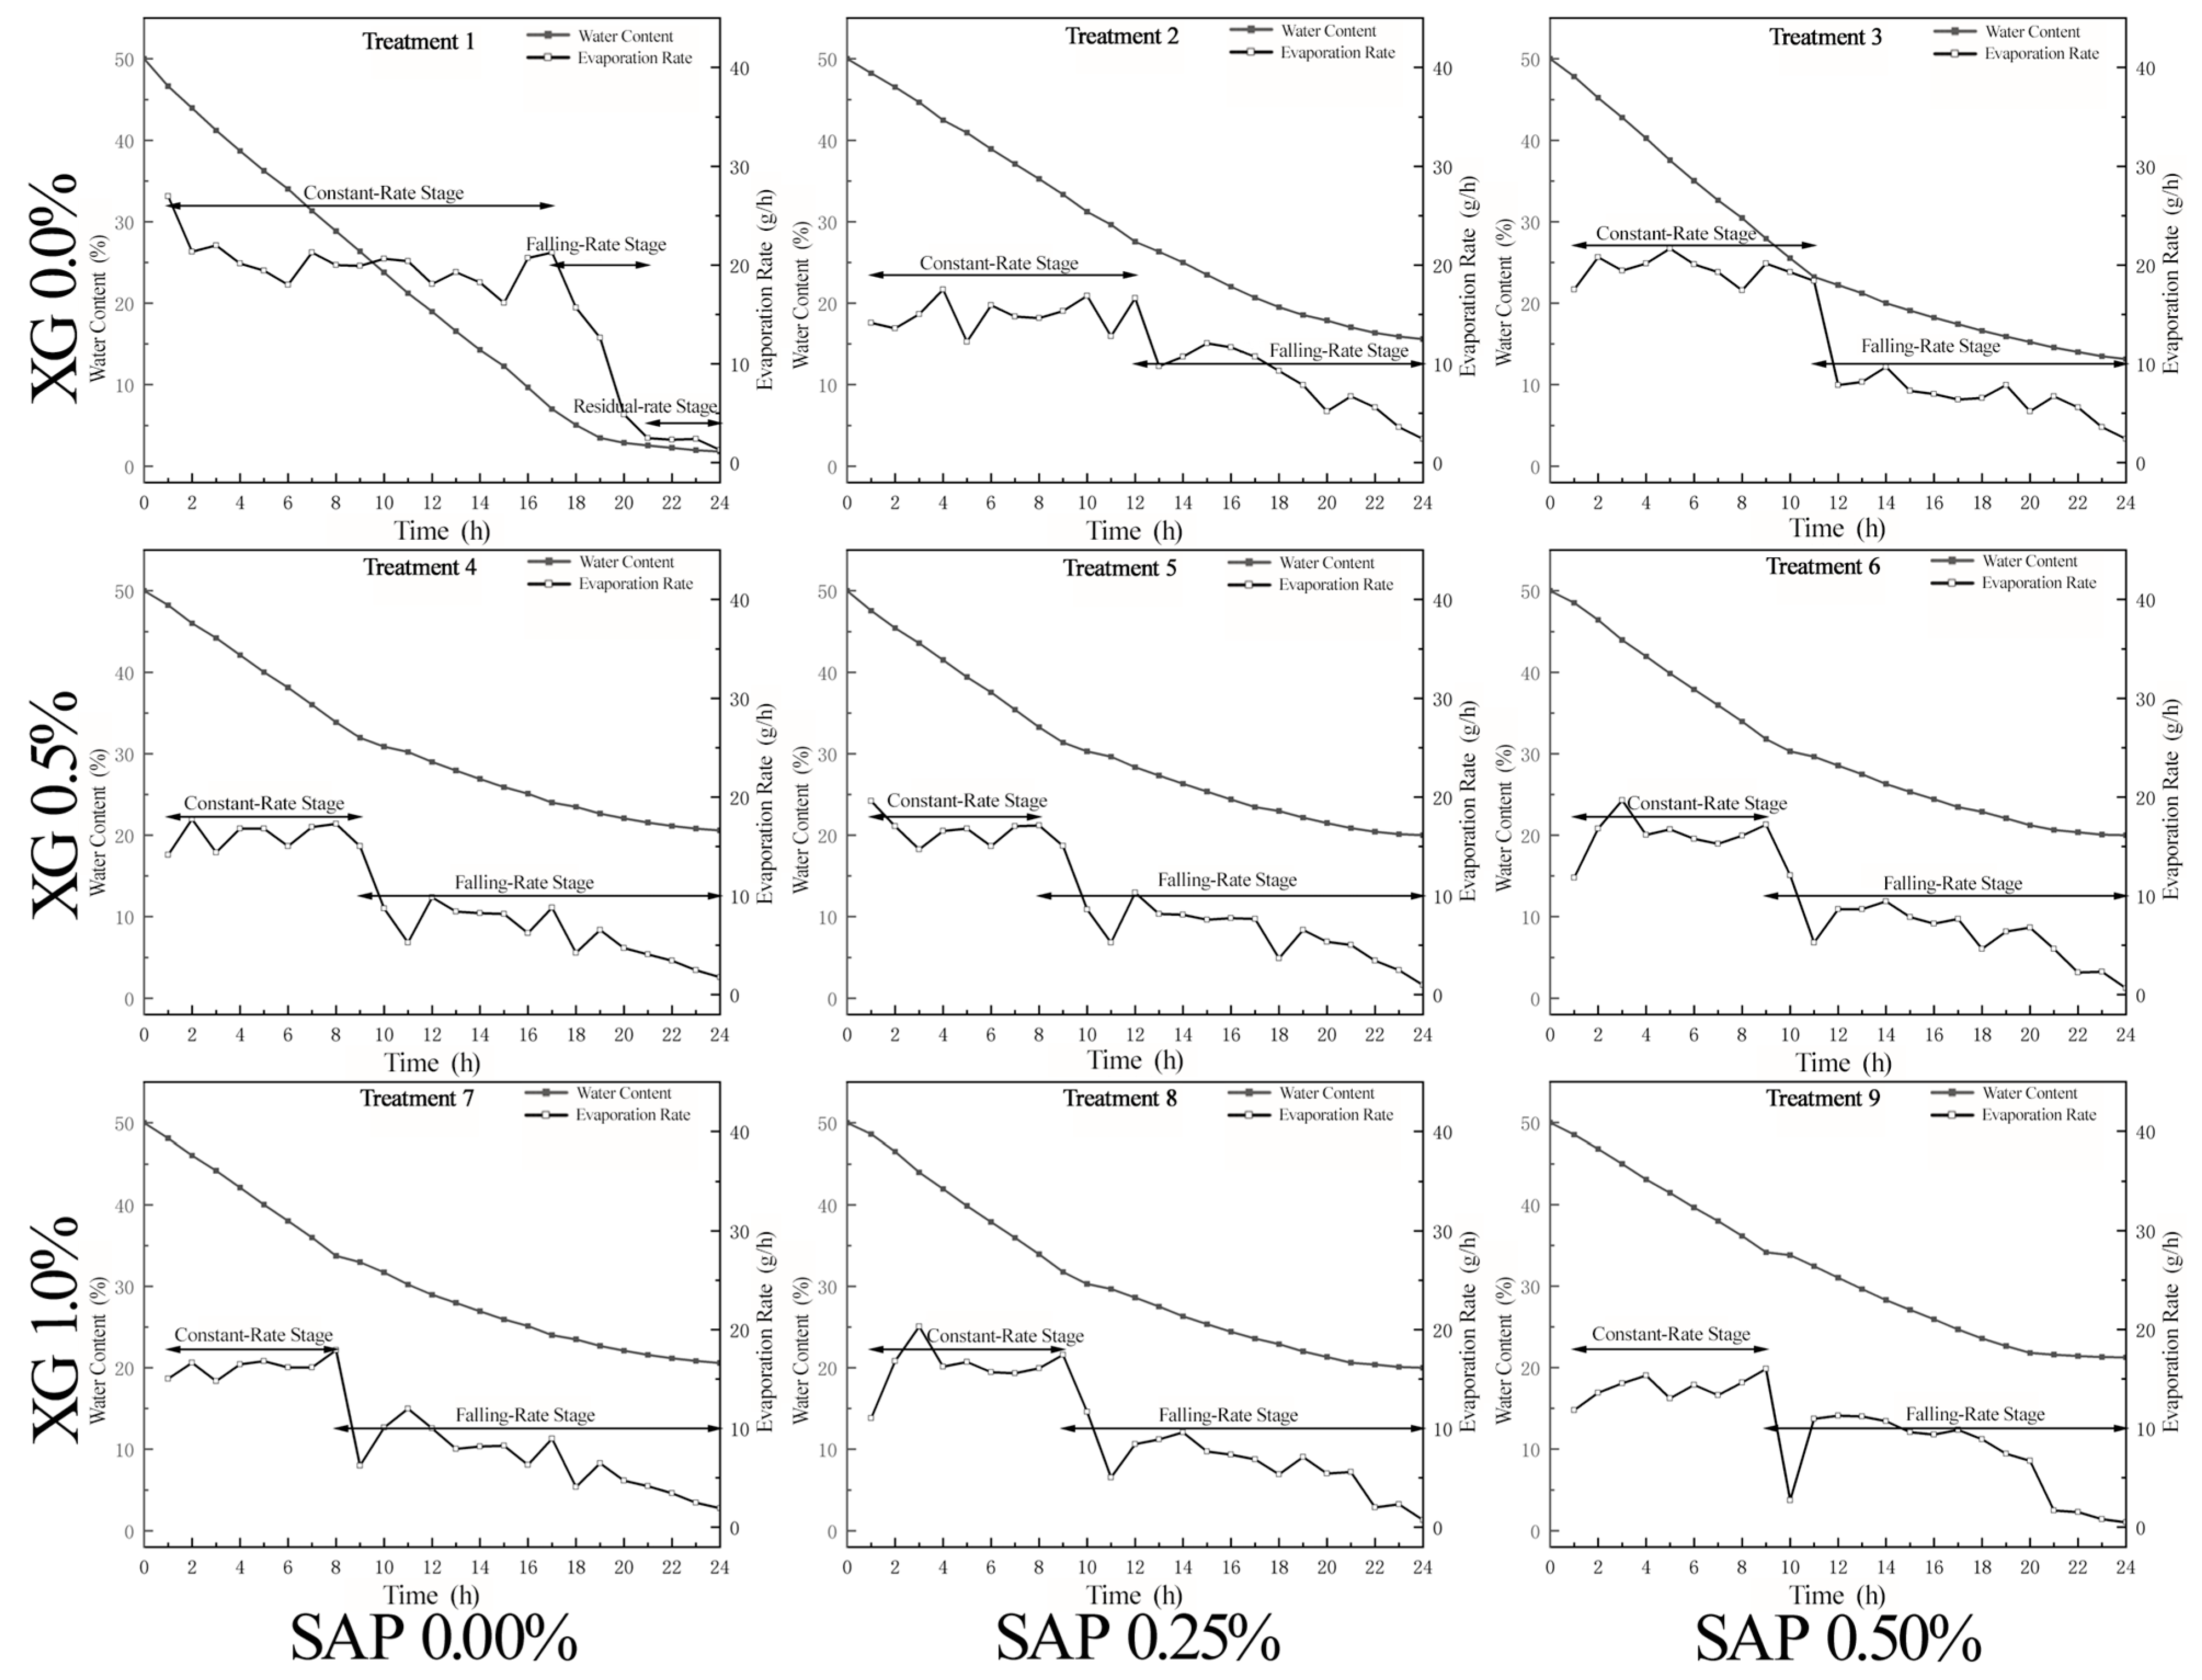
The temporal variations in water content and evaporation rate for each treatment are illustrated in Figure 3. According to the distinct characteristics of the evaporation rate, the overall evaporation process can be divided into three sequential stages: the constant-rate period, the falling-rate period, and the residual-rate period.
The evaporation process was divided into stages based on the following quantitative criteria: Let the time point be n (n ∈ Z+, 1 ≤ n ≤ 24), with evaporation rates X1, X2, …, X24 at time points 1 to 24, respectively. The reference value Yn = average (X1, X2, X3, …, Xn−1), and the reference difference Zn = |Xn/Yn − 1|.
Constant-rate stage: Starting from the experiment onset, the average evaporation rate of the first 3 h was used as the reference. If the reference difference Zn for subsequent time points (X4, X5, …, X24) was <25%. The process was determined to remain in the constant-rate stage.
Falling-rate stage: If at time point m (m ∈ n), the reference difference Zm ≥ 25%, the process was determined to enter the falling-rate stage, with time point m − 1 as the stage starting point, and the reference value for all subsequent time points was fixed as Ym.
Residual-rate stage: If at three consecutive time points i, i + 1, i + 2 (i ∈ n), the reference differences Zi, Zi+1, Zi+2 were all ≥80% (where Zi,i+1,i+2 = |Xi,i+1,i+2/Ym − 1|), the process was determined to enter the residual-rate stage, with time point i as the stage starting point.
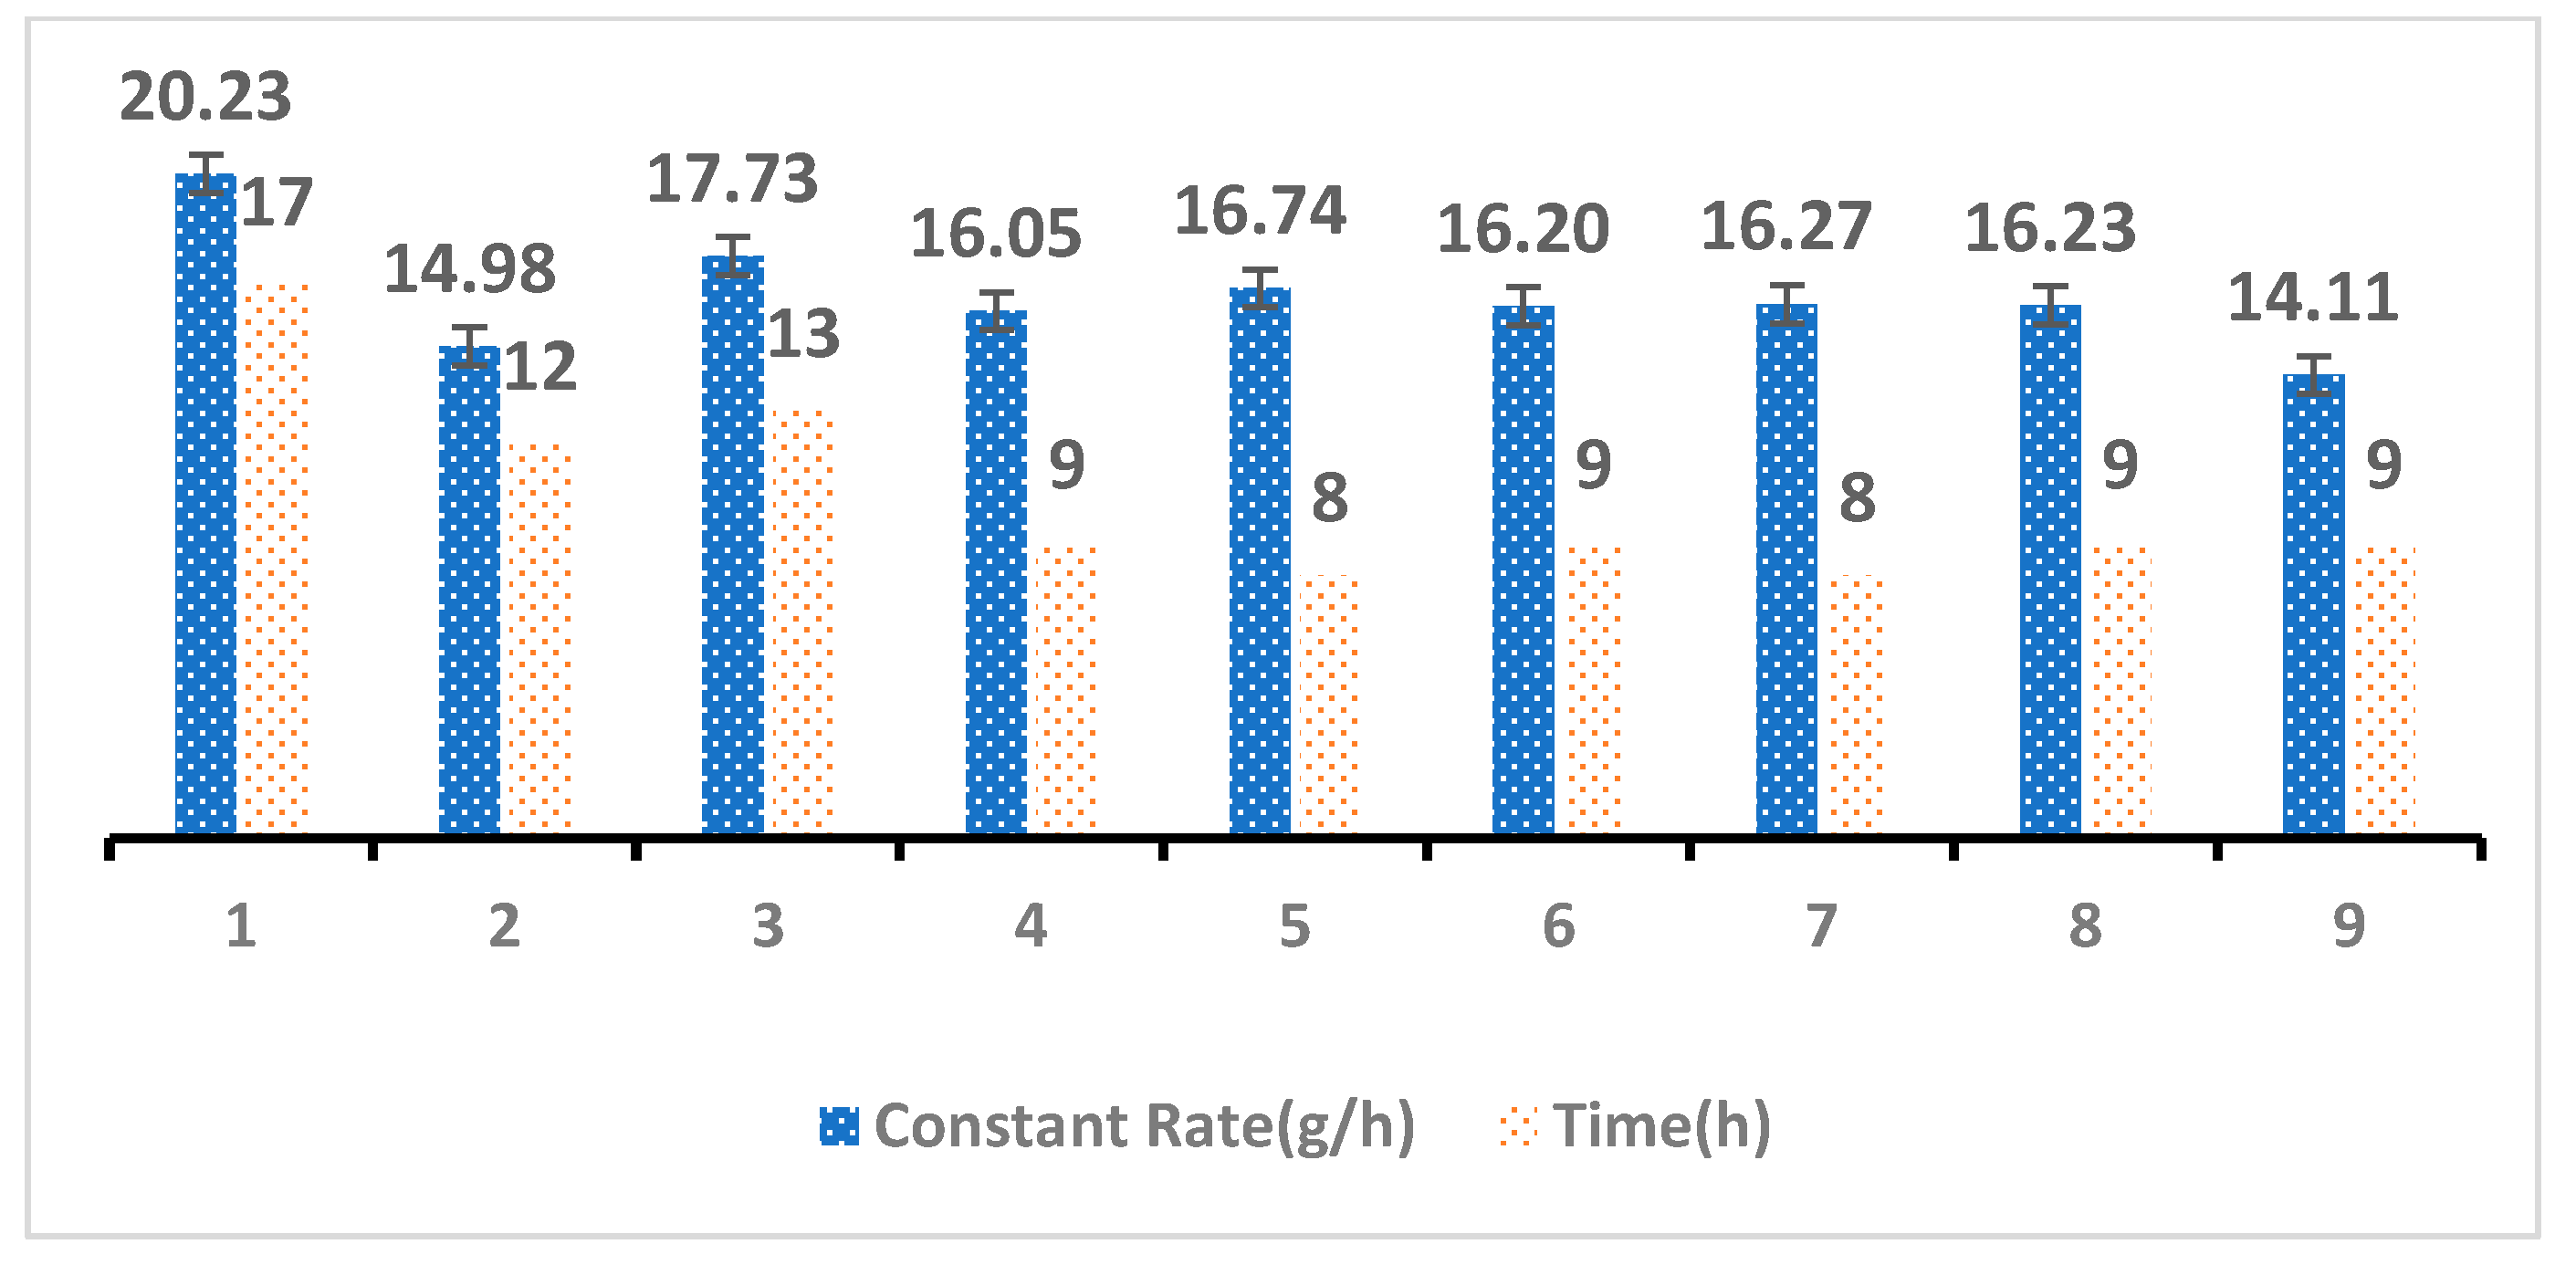
There are obvious differences in the duration of each stage among different treatments (Figure 4). The constant-rate stage of treatment 1 (original aeolian sand) is the longest, lasting approximately 17 h. The constant-rate phase was shortened to varying extents in all improved treatments, with durations generally stabilized around 10 h. SAP and XG primarily reduce total evaporation by shortening the constant-rate stage and extending the deceleration-rate stage of aeolian sand.
The duration of the deceleration-rate stage increases with higher SAP and XG concentrations; however, the rate of evaporation decline during this stage progressively diminishes. In the constant-rate stage, the presence of SAP and xanthan gum led to a reduction in the duration of this stage. Simultaneously, with the increase in the contents of SAP and XG, the evaporation rates of the specimens in this stage decreased to varying extents.
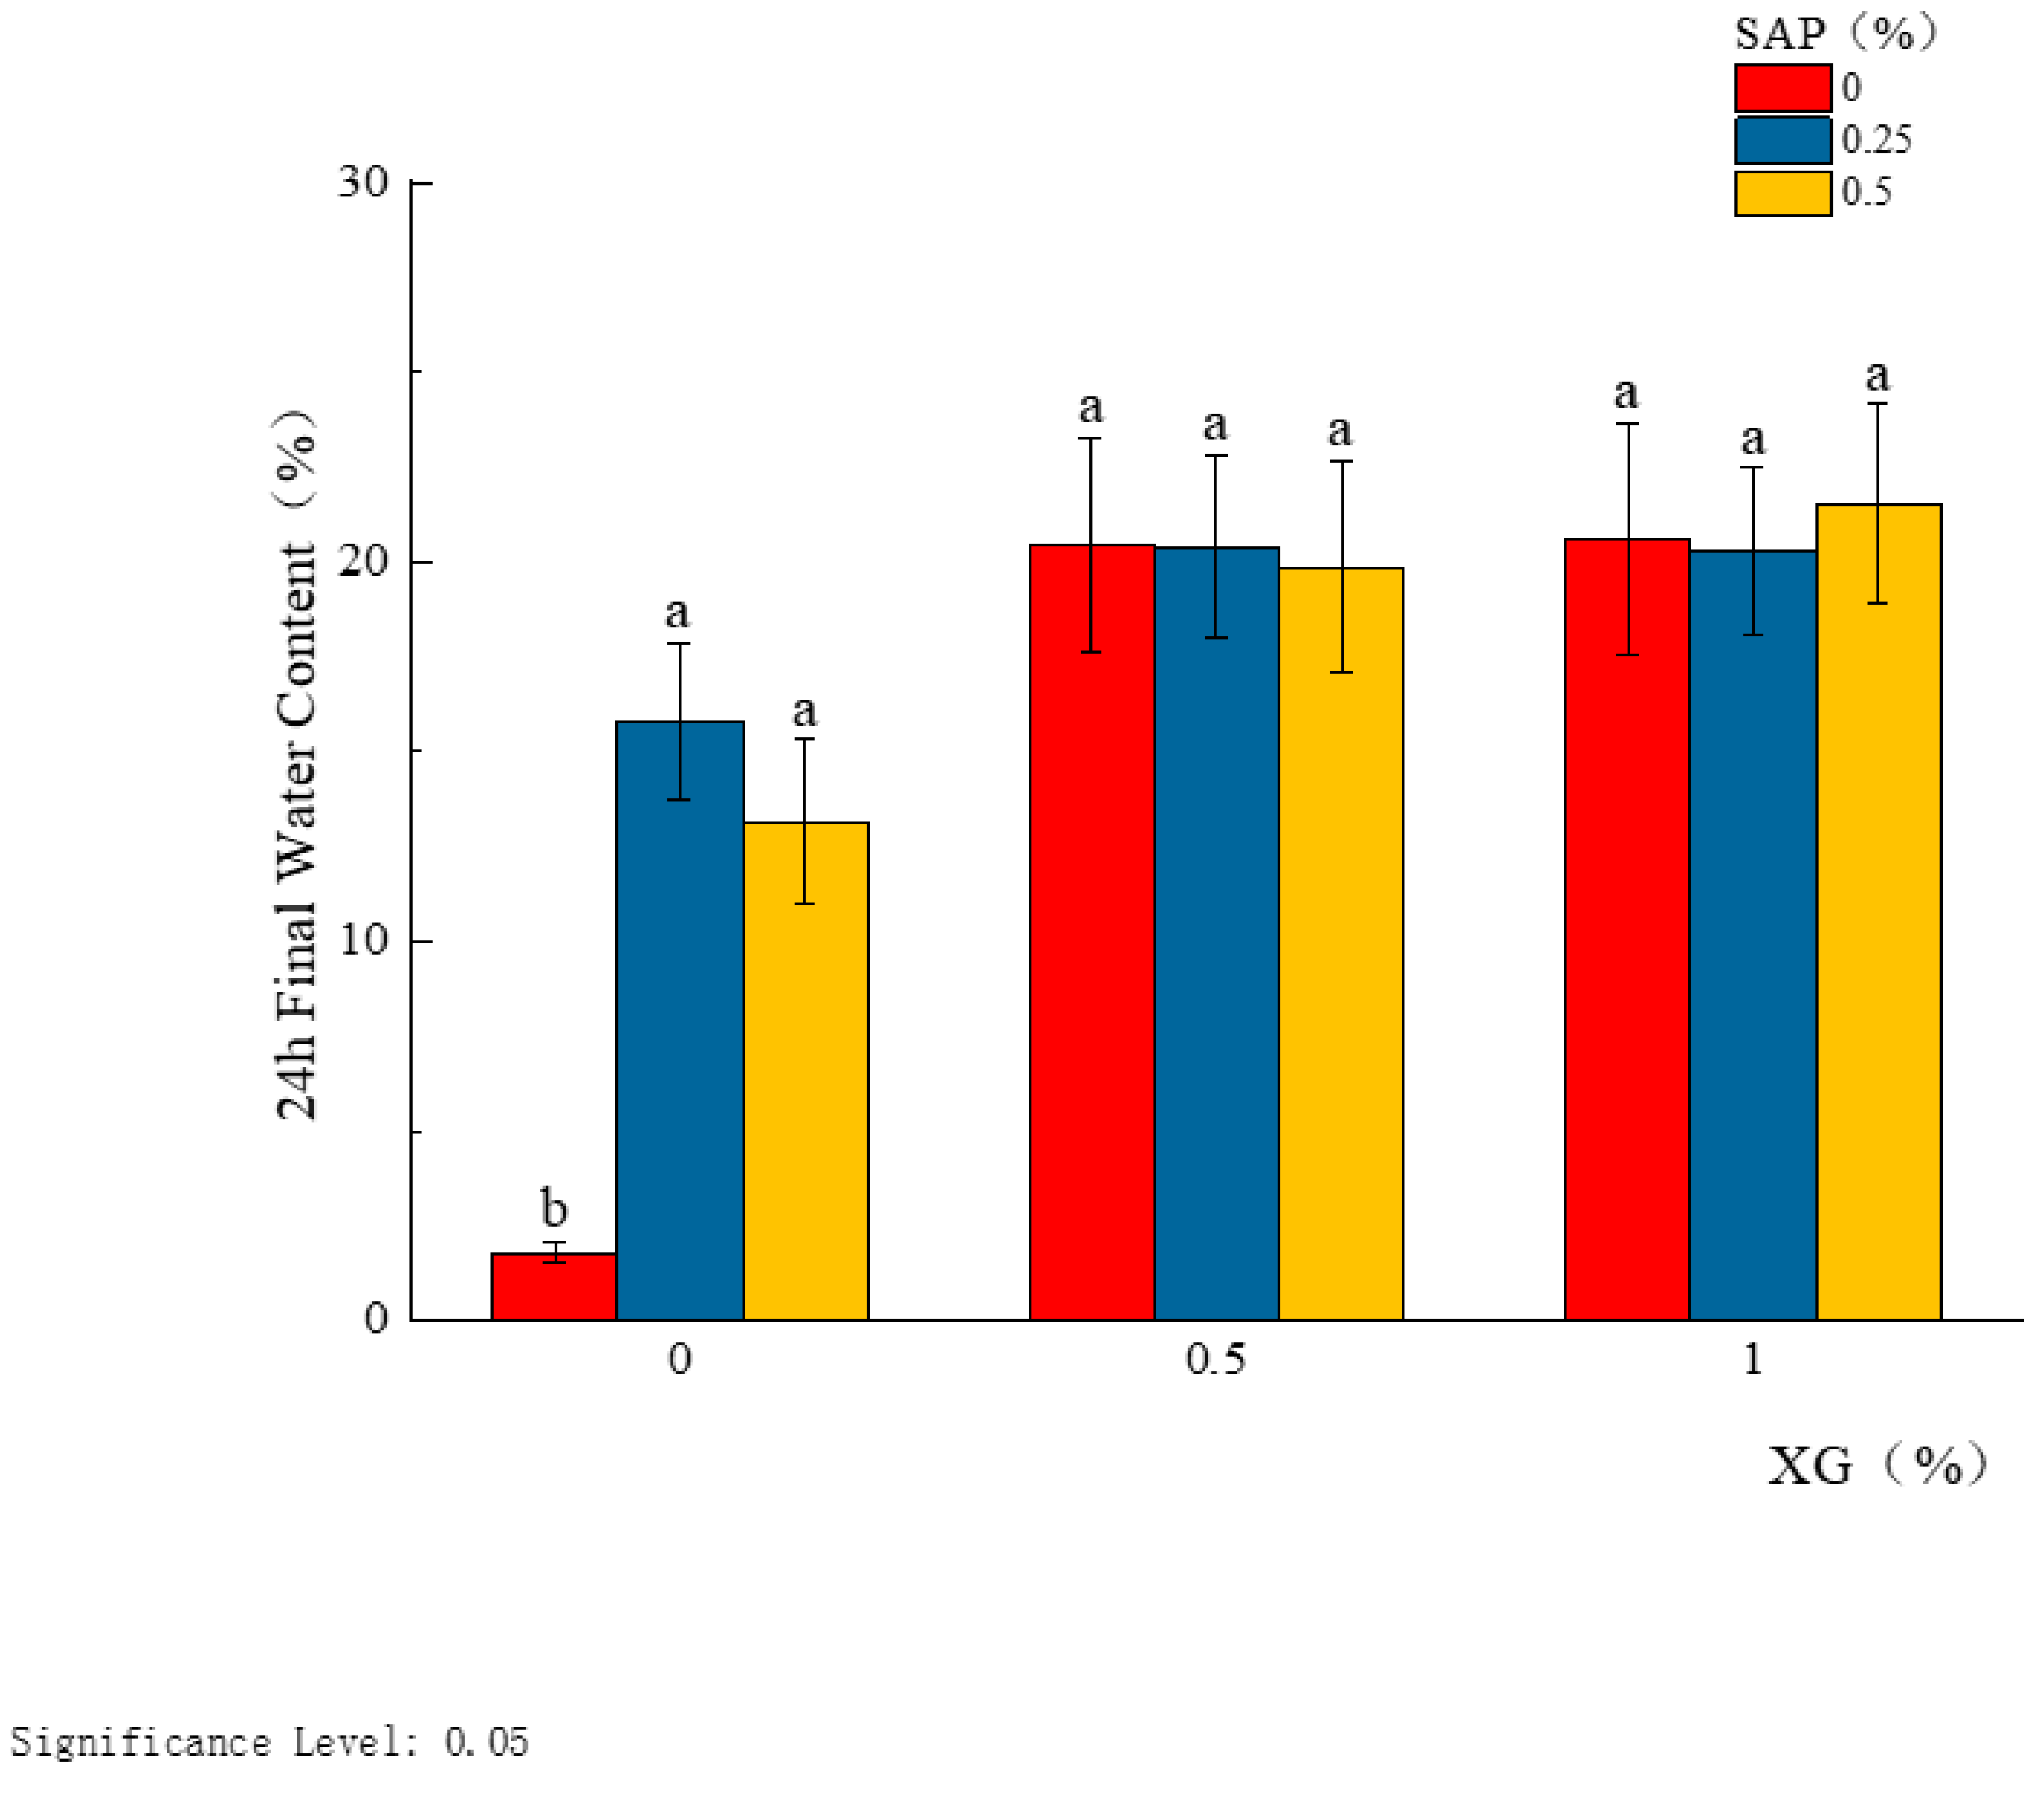
The significance of the impacts of XG and SAP concentrations on the final moisture content of the specimens after 24 h was examined via two-way analysis of variance (Two-Way ANOVA), as presented in Table 5. The results indicate that SAP concentration exerts a highly significant effect on the final moisture content (F = 54.817, p < 0.01). As the SAP concentration increases from 0% to 0.5%, the 24 h moisture content rises from 1.80 ± 0.22% to 20.59 ± 2.51%, corresponding to an increase of 18.79 percentage points (approximately 10.4-fold). Meanwhile, XG concentration also exhibits a statistically significant influence (F = 9.442, p < 0.01). Compared with treatment 4 (0.5% XG, 0% SAP), treatment 1 (0% XG, 0% SAP) shows an 18.1% increase in average moisture content. Notably, the interaction between SAP and XG attained a highly significant level (F = 9.77, p < 0.01), suggesting the existence of a synergistic water-retention mechanism. When the SAP concentration was 0.5%, the addition of 1.0% xanthan gum could further elevate the water content by 4.6%. Even in the absence of SAP, the water-retention effect of xanthan gum remained remarkable (with an increase of 14.00 percentage points (about 7.8-fold)). The findings demonstrated that both the main effects of XG and SAP on the final water content and their interaction were highly significant (p < 0.01) (Figure 5).
Although the two-way ANOVA showed highly significant effects of XG, SAP and their interaction on 24 h moisture content (p < 0.01), Tukey’s HSD (letters in Table 5) did not separate many amended treatments. This is mainly because moisture was already lifted to a narrow high range (≈19–21%) once SAP reached 0.25%, so raising SAP or XG further produced only 1–1.5%-point differences. At the same time, SAP-induced cracking in the high-SAP mixes (see Table 3) made evaporation more uneven, increasing within-group variance and weakening the post hoc test. ANOVA can still detect the overall contrast between “no SAP” and “SAP added”, but a conservative pairwise test with n = 3 cannot label every small contrast as significant. In practice this means: SAP is the main driver of water holding (0.25% is already effective), and XG mainly helps keep that water by limiting cracking.

3.2. The Anti-Scour Performance of the Slope Under Different Treatments

Dynamic Characteristics During the Scouring Process

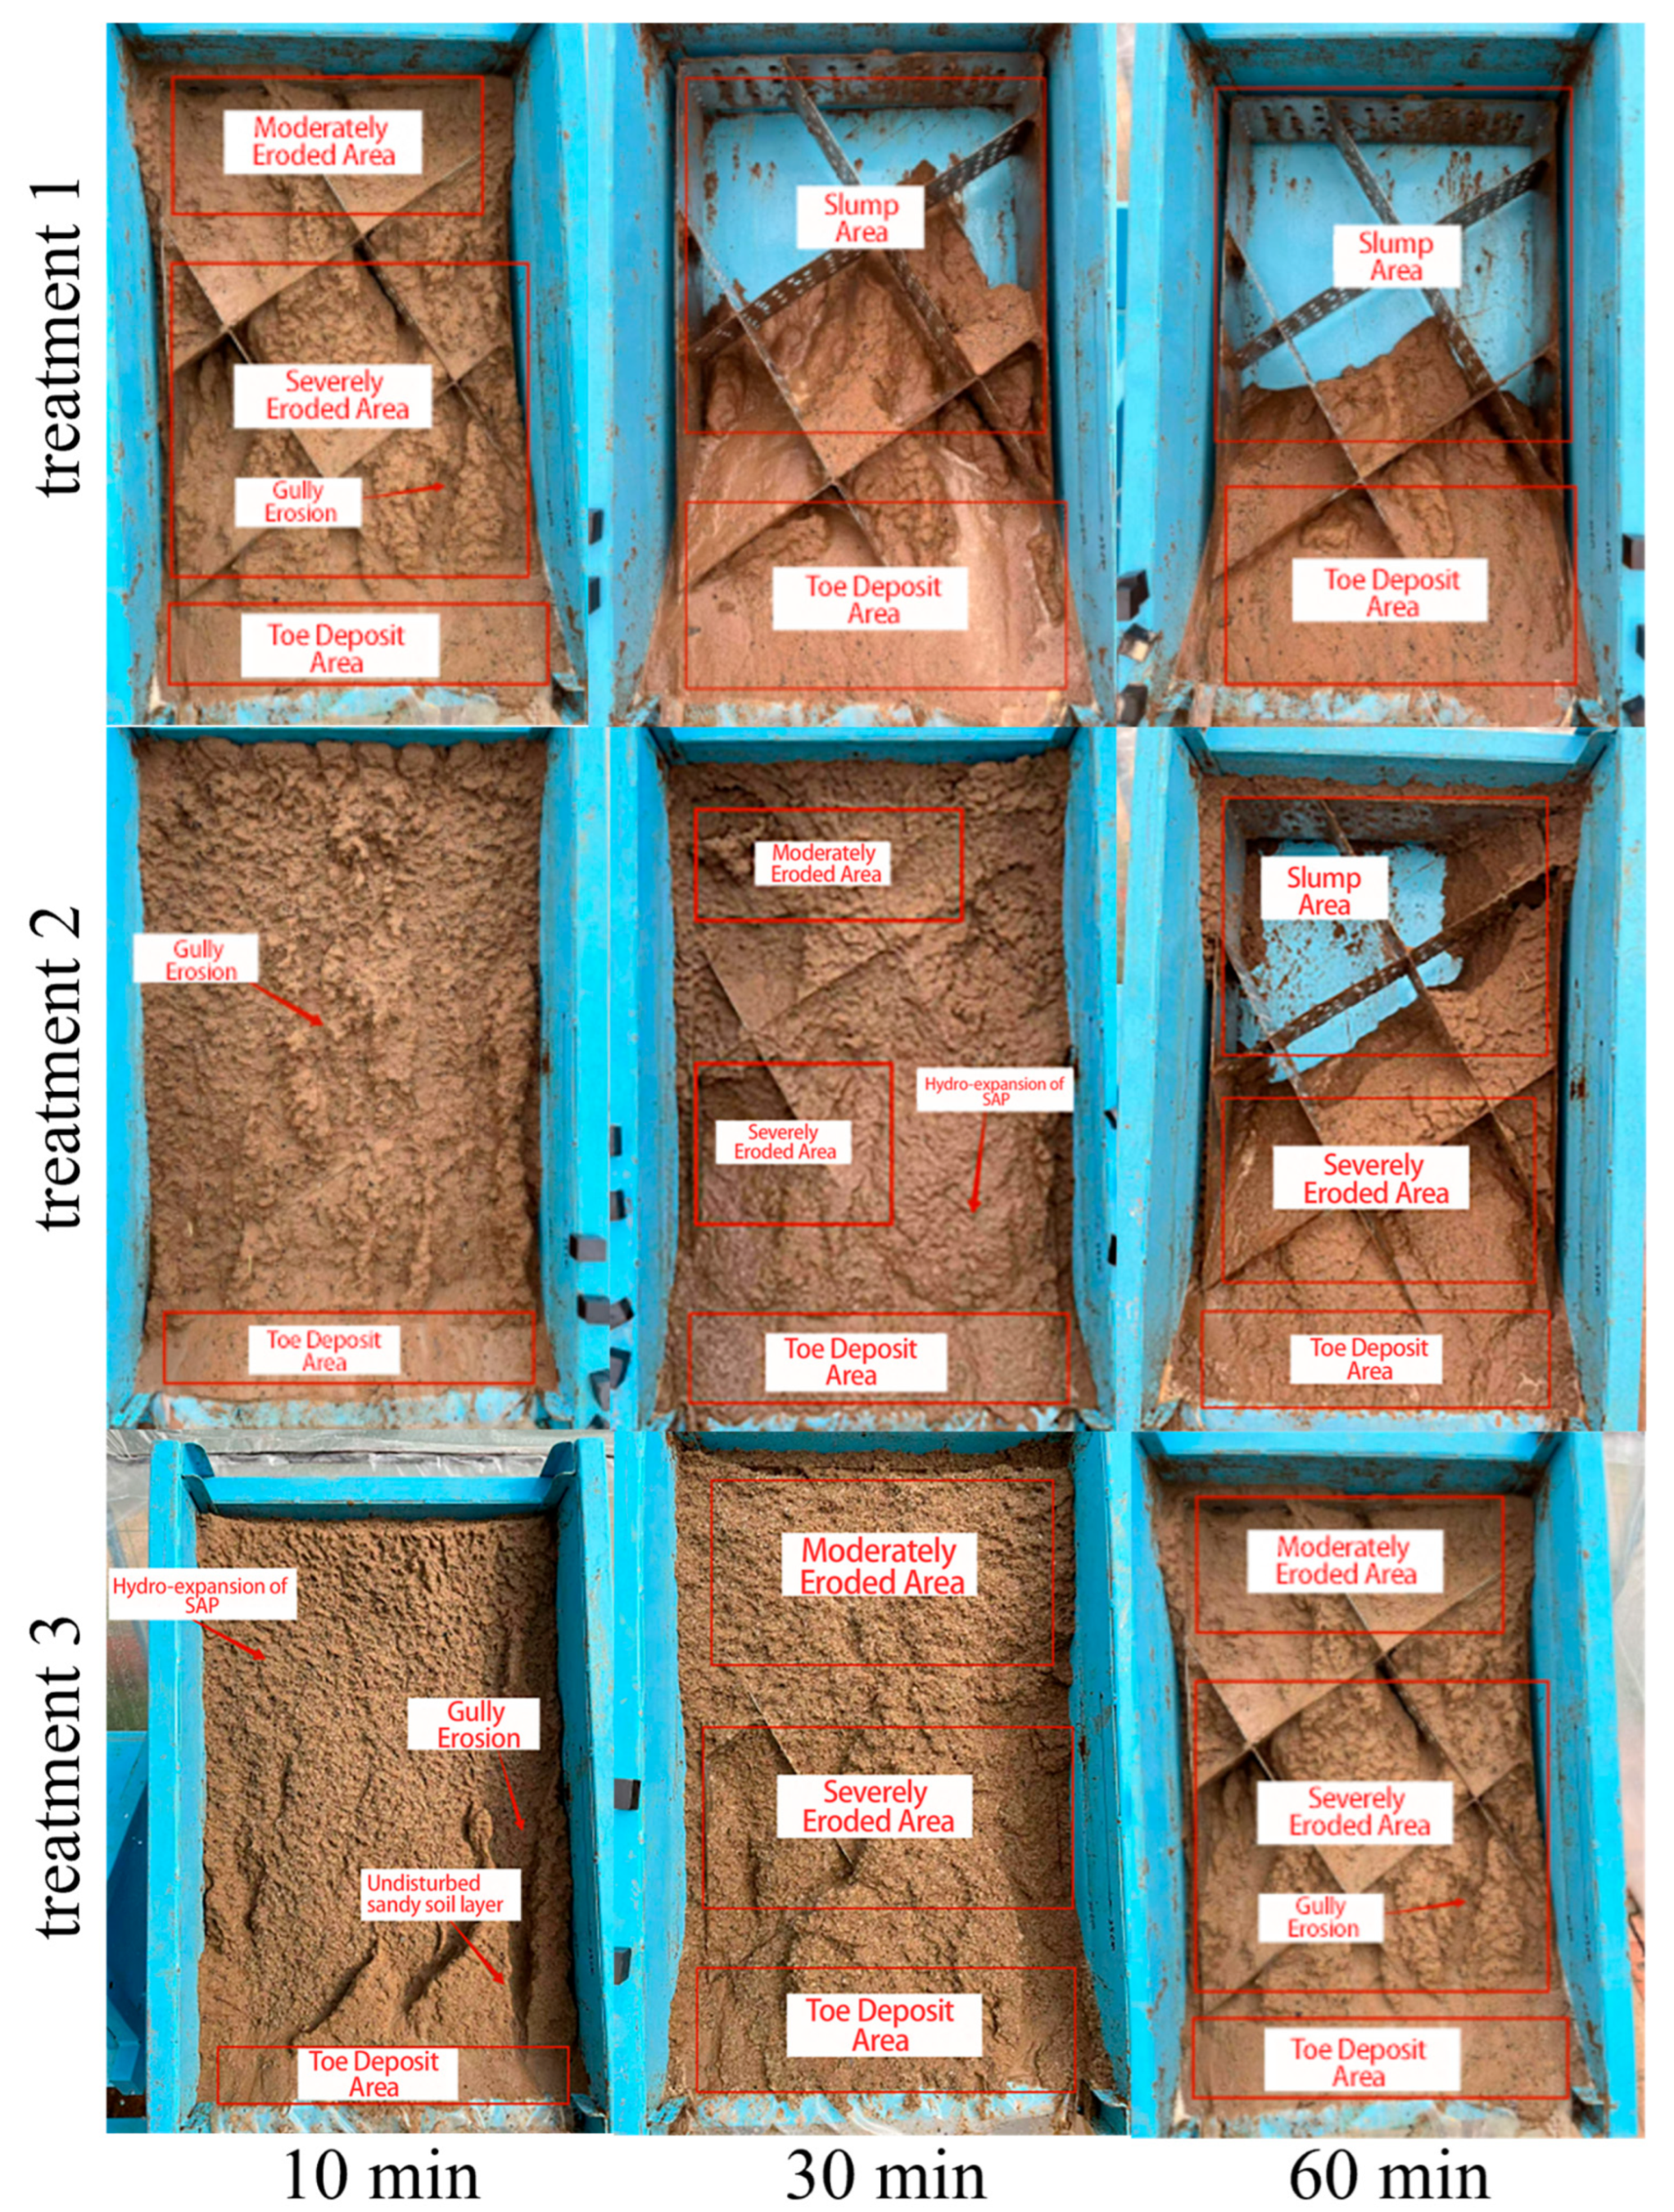
Under the rainfall intensity of 70 mm·h−1, the three treatments without xanthan gum (Treatments 1–3) showed clearly different scour responses (Figure 6). The treatment 1 (XG 0%, SAP 0%) experienced rapid rill formation within the first 10 min, followed by large-scale slumping of the upper slope by 30 min, and almost complete failure by 60 min. The treatment 2 (XG 0%, SAP 0.25%) still had a high initial erosion rate, but as SAP swelled and the honeycomb cells intercepted part of the runoff-transported sand, the scour rate decreased; nevertheless, the collapsed area at 60 min was about 81.6% of Treatment 1. Treatment 3 (XG 0%, SAP 0.5%) showed the best performance among the SAP-only groups, as shown in Figure 6.
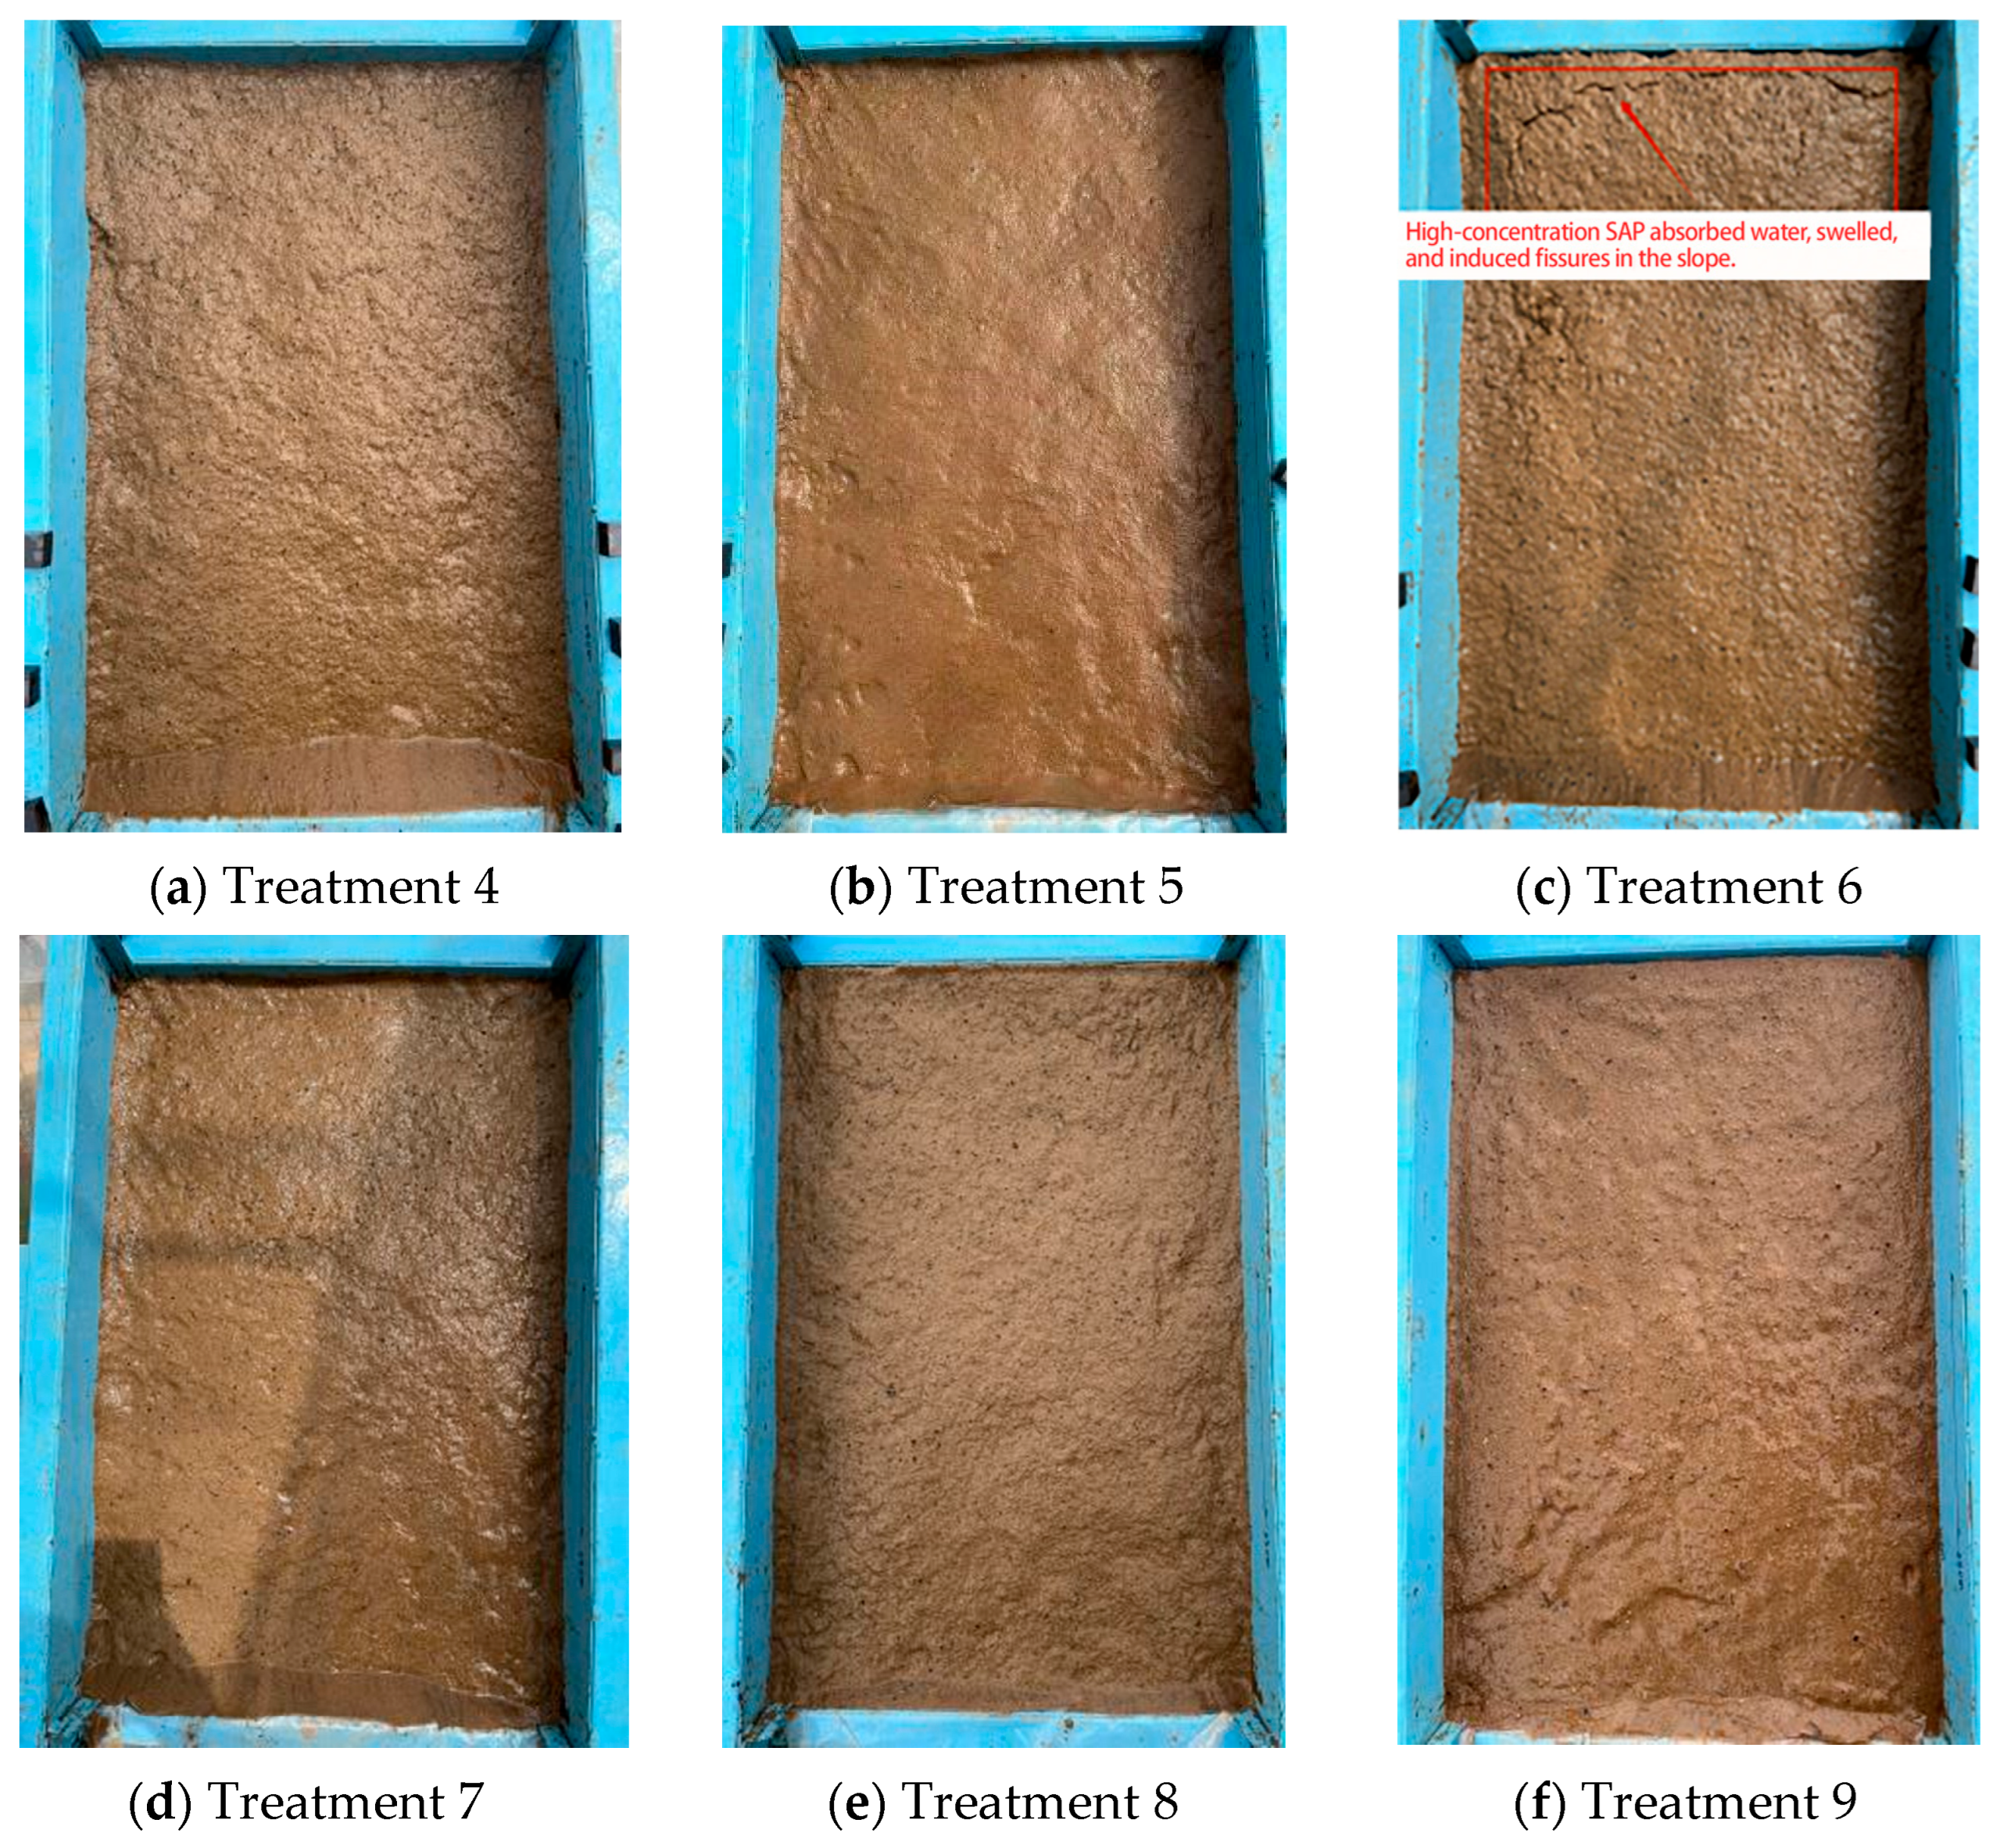
The treatments containing XG (Treatments 4–9) exhibited no significant surface erosion or slope failure within 60 min (Figure 7). Only in Treatment 6 (0.5% SAP, 0.5% XG) were cracks observed at the upper part of the slope, and its total erosion volume was slightly higher than those of Treatments 4 and 5.
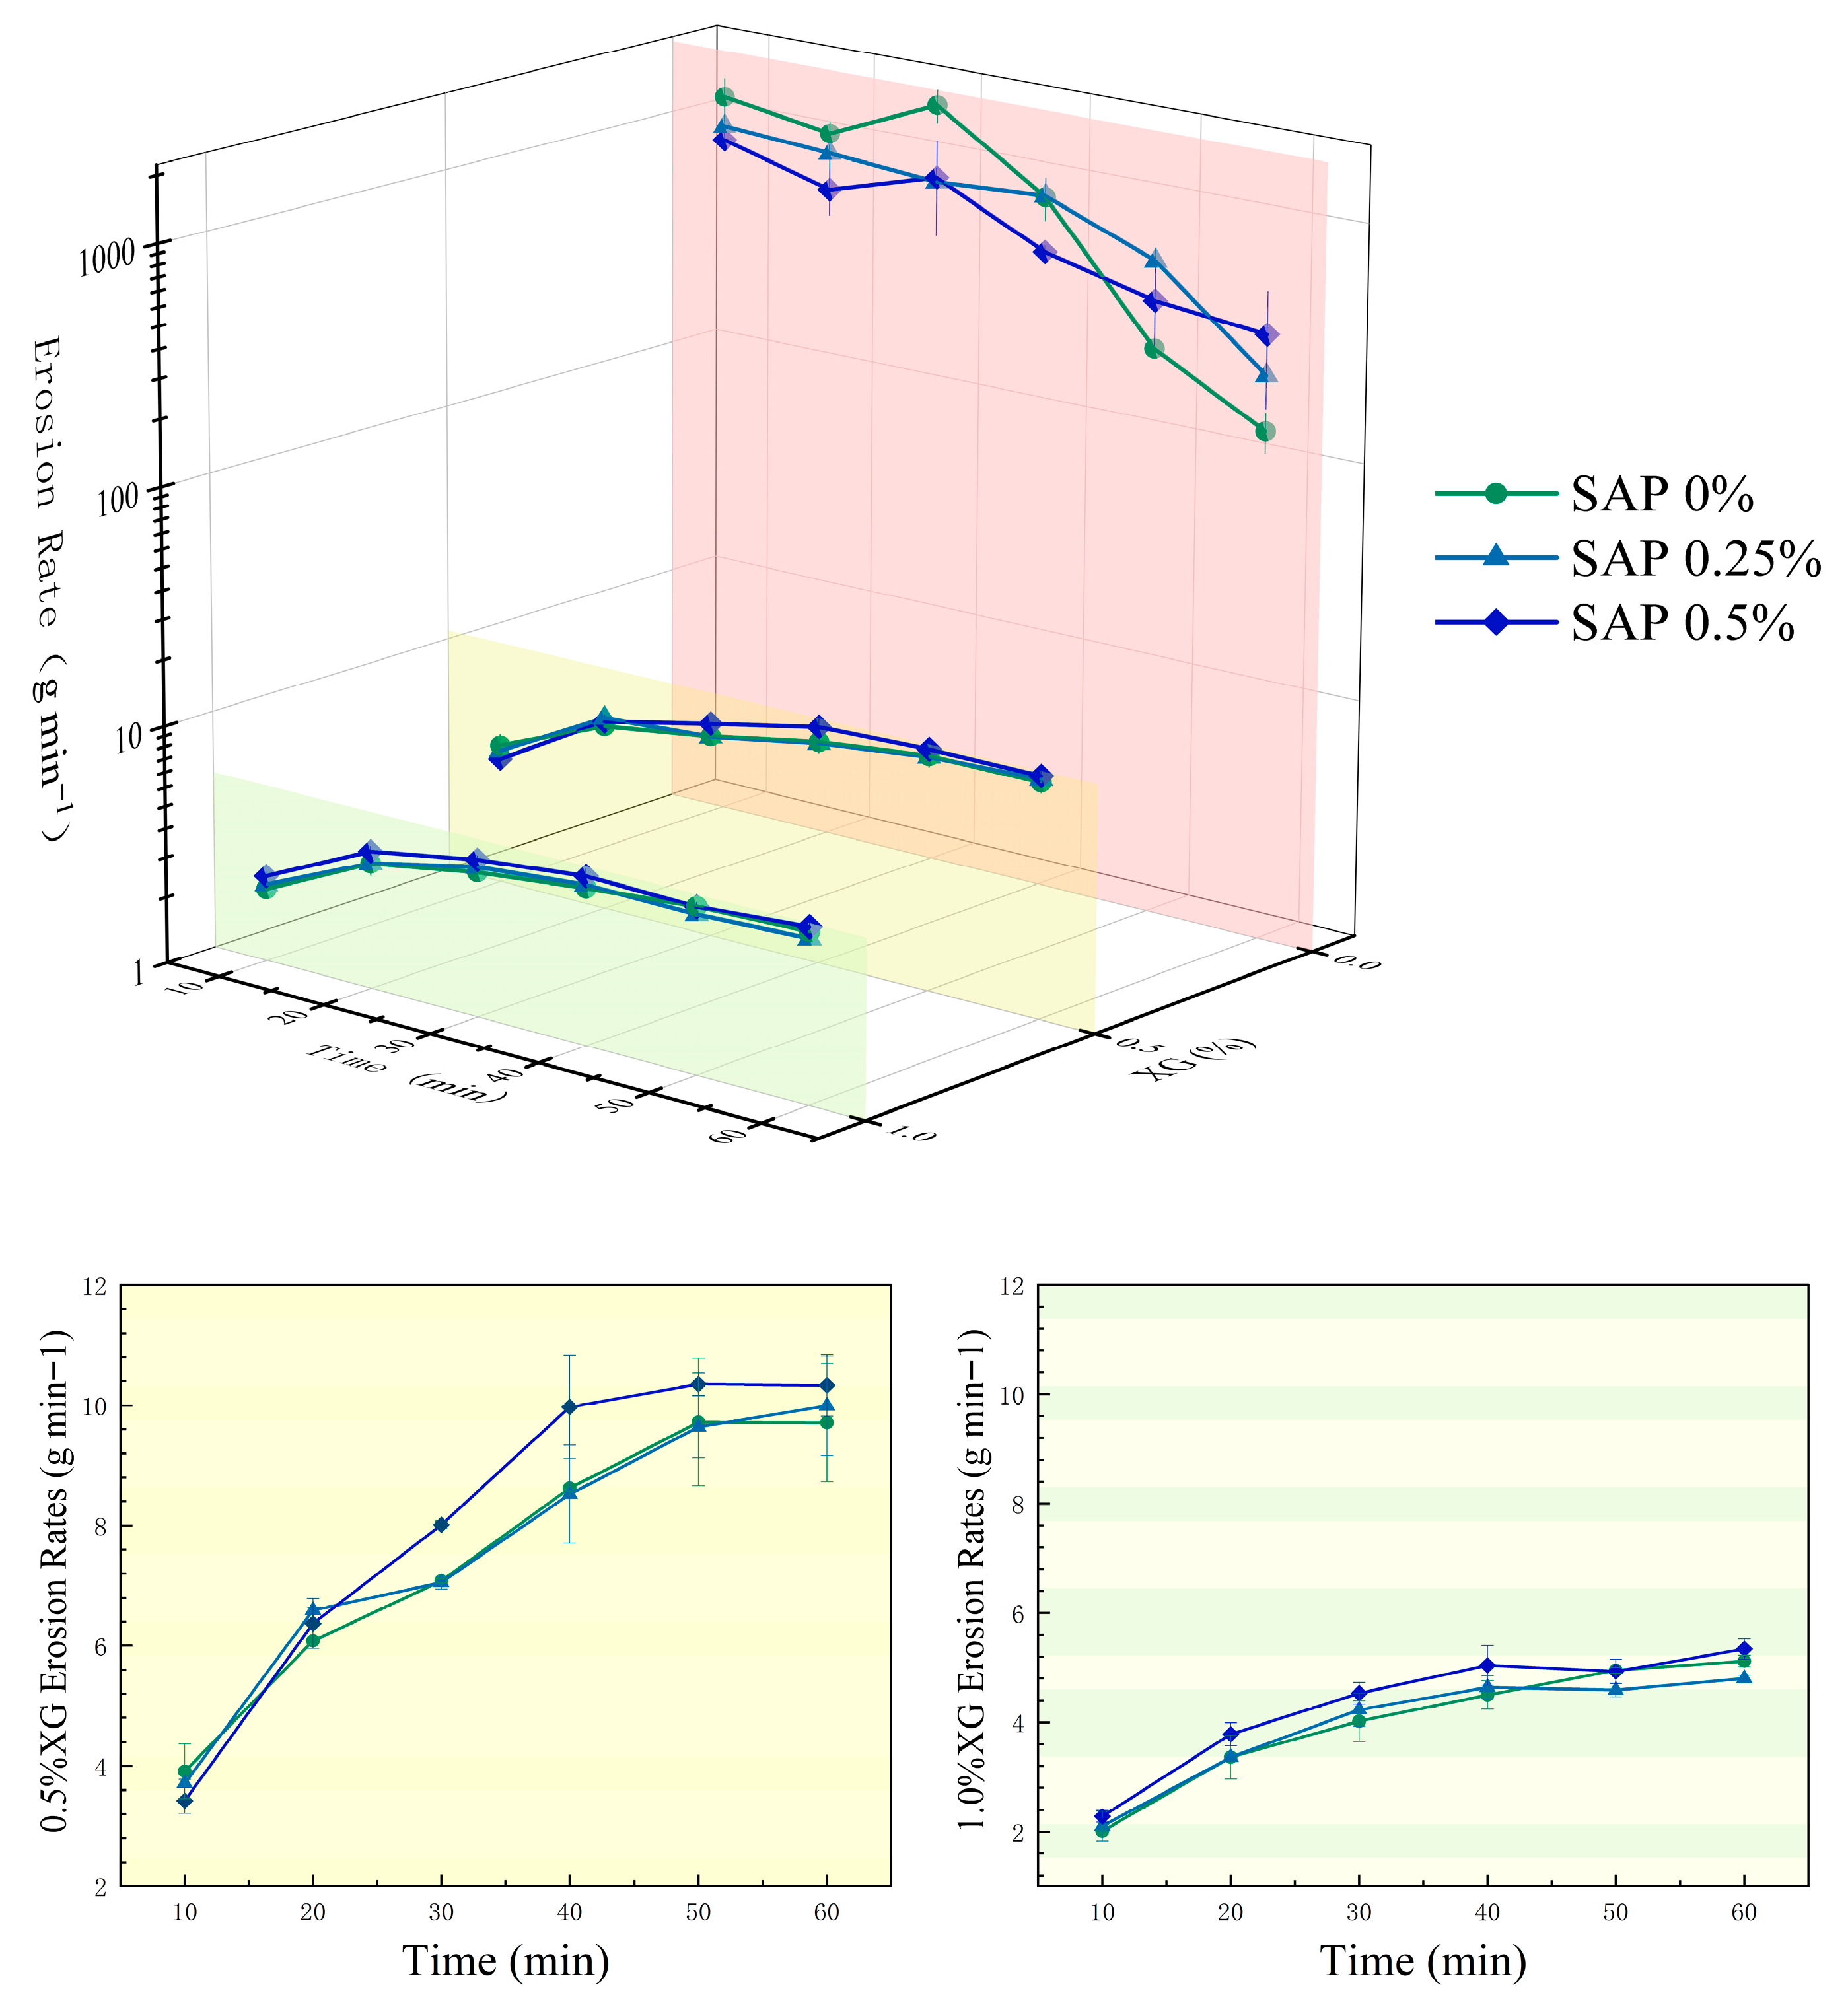
To visually demonstrate the dynamic characteristics of the erosion process, erosion rate line graphs were plotted based on the erosion rate every 10 min under different XG and SAP ratios (Figure 8). As the erosion rate of the group without XG was much higher than that of the other groups, a semi-logarithmic coordinate was adopted for the z-axis, and two line graphs were drawn to clearly present the changes in erosion rate over time under different SAP concentrations when the XG concentrations were 0.5% and 1%.
Erosion rate trends over time (Figure 8) were visualized using a semi-logarithmic scale to clearly display the wide range of values—from >50 kg in XG-free groups to <0.5 kg in XG-amended groups. Statistical analysis (Two-Way ANOVA) confirmed that XG had a highly significant effect on scour volume, while SAP and the XG × SAP interaction were also significant but secondary to XG (Table 6).
These results indicate that XG plays a critical role in stabilizing the slope surface against raindrop impact and runoff, while SAP contributes moderately to water retention and swelling, with optimal performance at 0.25% under XG stabilization.
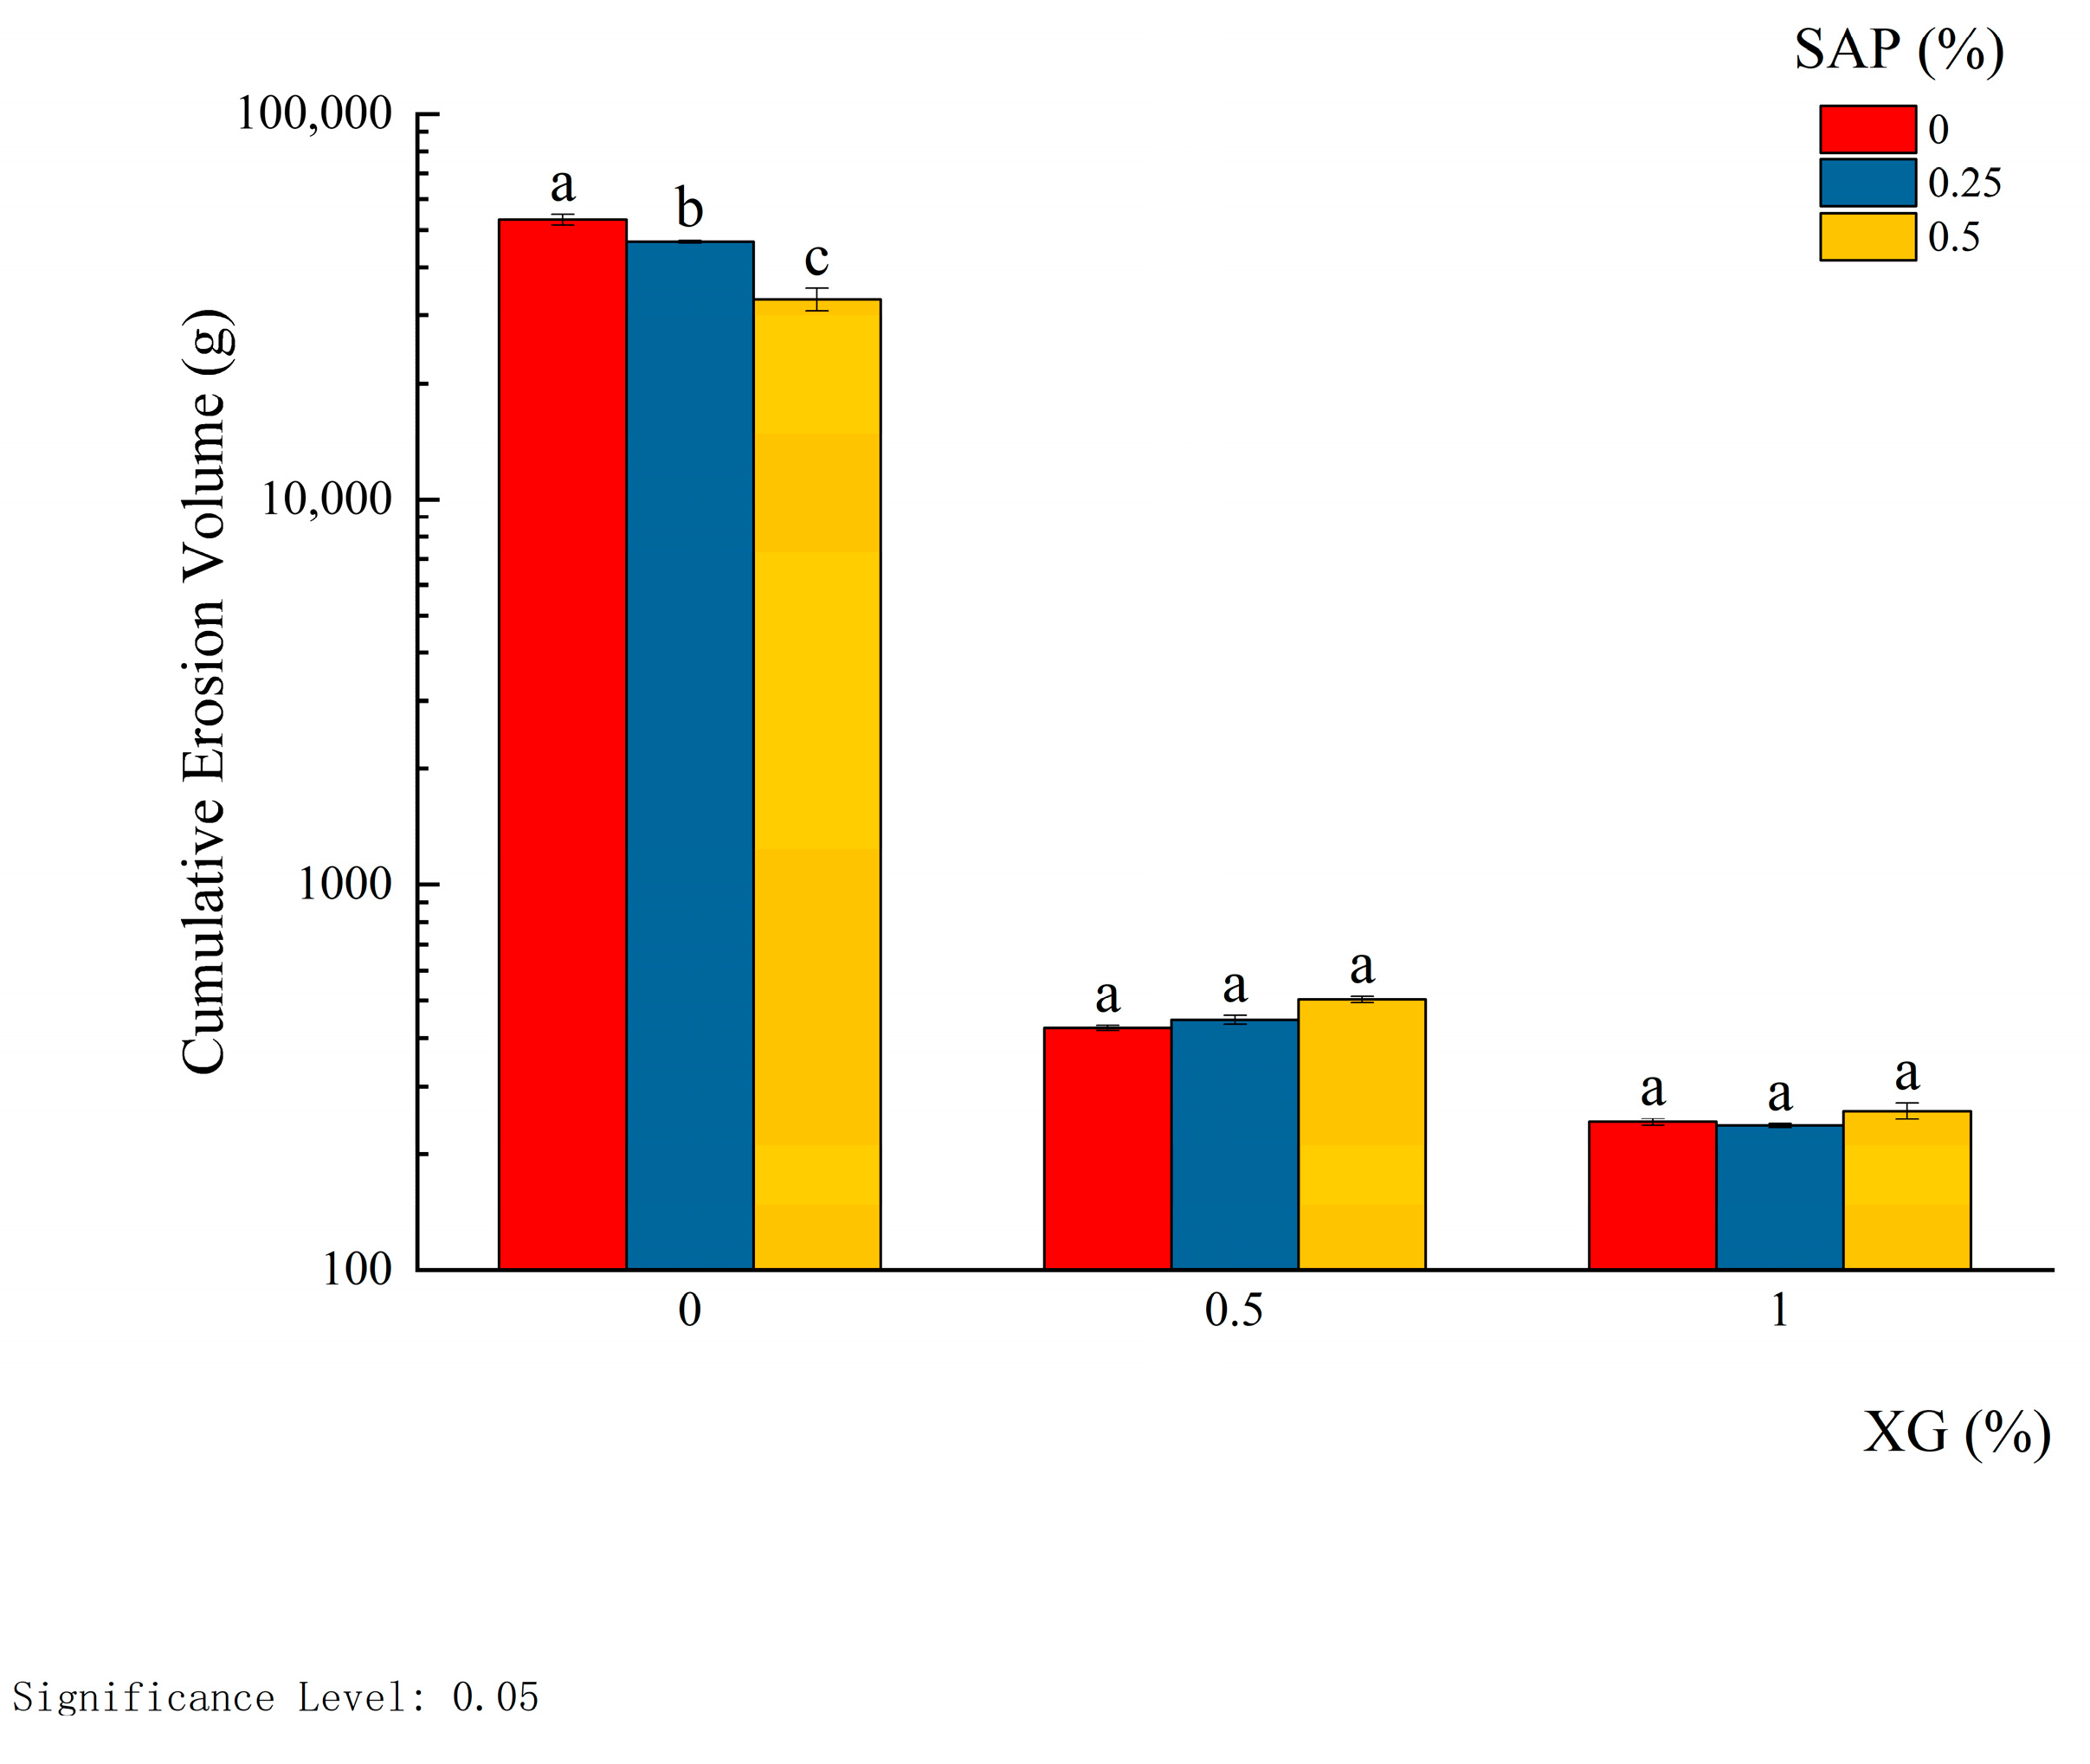
Without XG, the SAP concentration had a measurable influence on erosion volume (Table 6). As the SAP addition ratio increased from 0% (Treatment 1) to 0.5% (Treatment 3), cumulative erosion showed a decreasing trend; however, multiple comparisons revealed that only the 0.5% SAP group (Treatment 3) exhibited a statistically significant reduction compared to the control (p < 0.05). In contrast, when XG (≥0.5%) was introduced, variations in SAP concentration (0–0.5%) did not significantly affect cumulative erosion (p > 0.05), and all treatment groups maintained similarly low erosion levels.
Significant differences in cumulative scouring volume over 60 min were observed across treatments (Figure 9). The groups without XG (Treatments 1–3) showed substantially higher scouring volumes than those with XG (Treatments 4–9). Specifically, in the absence of XG, even with 0.5% SAP (Treatment 3), erosion reached 35.63 ± 2.94 kg. In contrast, the addition of 0.5% or 1% XG reduced erosion to between 0.45 ± 0.019 kg and 0.25 ± 0.004 kg—more than 99% lower than the XG-free control (Treatment 1, 53.36 ± 5.413 kg), with all ratios below 0.01. These results indicate that XG introduction markedly enhances slope scouring resistance, with an effect substantially surpassing that of SAP alone.

3.3. Changes in Shear Strength of Improved Soil

3.3.1. Influence of Additive Proportions on Shear Strength

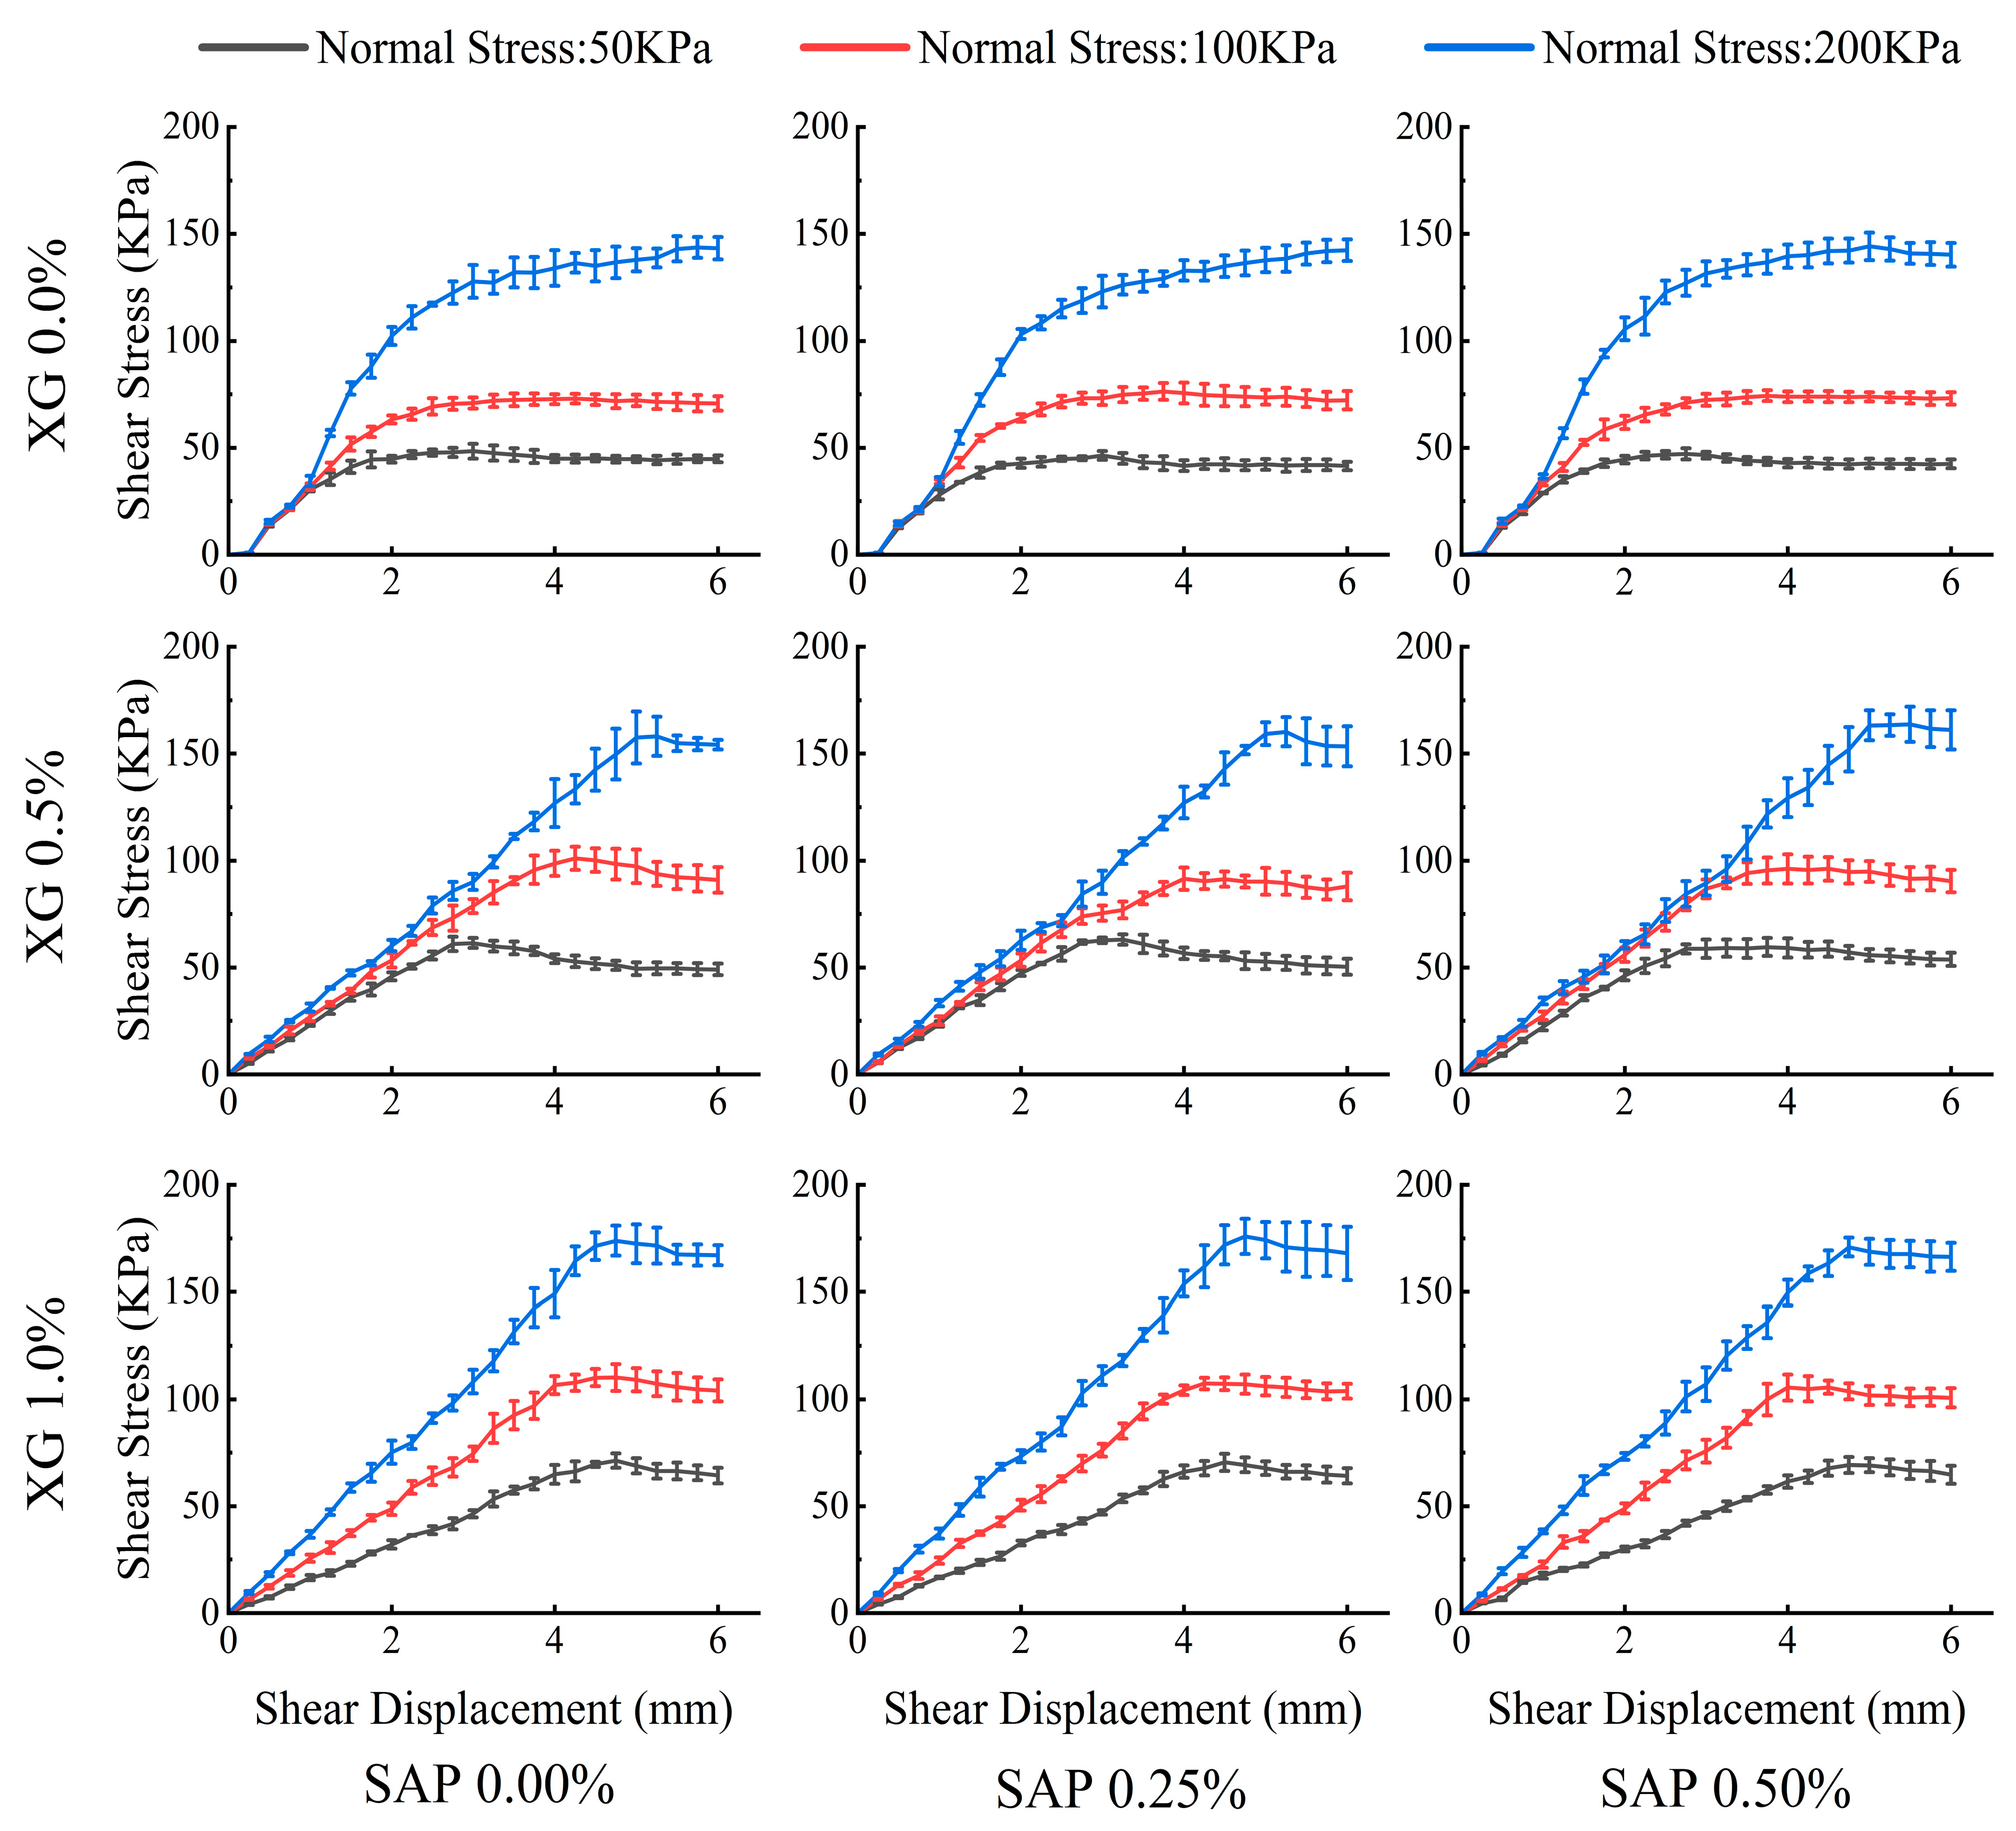
Based on the experimental results, shear stress-shear displacement curves of the improved soil under normal stresses of 50, 100, and 200 kPa were obtained for different treatments (Figure 10). The groups without XG treatment (Treatments 1–3, XG: 0%, SAP: 0–0.5%) primarily exhibited strain hardening behavior as the normal stress increased. This behavior was characterized by an initial rapid increase in shear stress, which then gradually transitioned to a slower rate of increase with further displacement, without showing a distinct peak strength followed by a drop. For example, in Treatment 1 under a normal stress of 200 kPa, the rate of increase began to slow when the displacement reached 2–3 mm. In contrast, the treatments containing xanthan gum (Treatments 4–9, XG: 0.5–1%, SAP: 0–0.5%) generally displayed behavior intermediate between hardening and softening. After reaching a distinct peak shear stress, the stress did not decrease rapidly (strain softening typically exhibits a rapid drop after the peak) but declined gradually. For instance, in Treatments 7–9 under a normal stress of 200 kPa, the peak shear stress was generally attained at a displacement of 4–5 mm, after which the shear stress began to decrease gradually.
As shown in Figure 10, under identical normal stresses and XG ratios, variations in SAP content had a relatively minor influence on the overall magnitude and shape of the shear stress-displacement curves. However, under the same normal stress and SAP ratio, increasing the xanthan gum content not only altered the soil’s behavior, transforming the response from strain hardening to one with a defined peak strength followed by gradual softening, but also significantly enhanced the peak shear stress. For example, under a normal stress of 200 kPa, Treatment 1 (0% XG, 0% SAP) exhibited a continuous hardening response, reaching a peak strength of 137.59–150.53 kPa at a displacement of 5.5–6 mm. In contrast, Treatment 7 (1% XG, 0% SAP) reached a peak shear strength of 167.42–184.71 kPa at a displacement of 4.75–5 mm, after which it entered a gradual softening stage, decreasing to 161.01–172.35 kPa by 6 mm displacement. Despite this softening, the shear strength during the softening phase remained higher than the peak shear strength of Treatment 1. This pattern of XG inducing higher shear strength was consistent across all normal stress levels.

3.3.2. Regression Analysis and Significance Test of Shear Strength Parameters

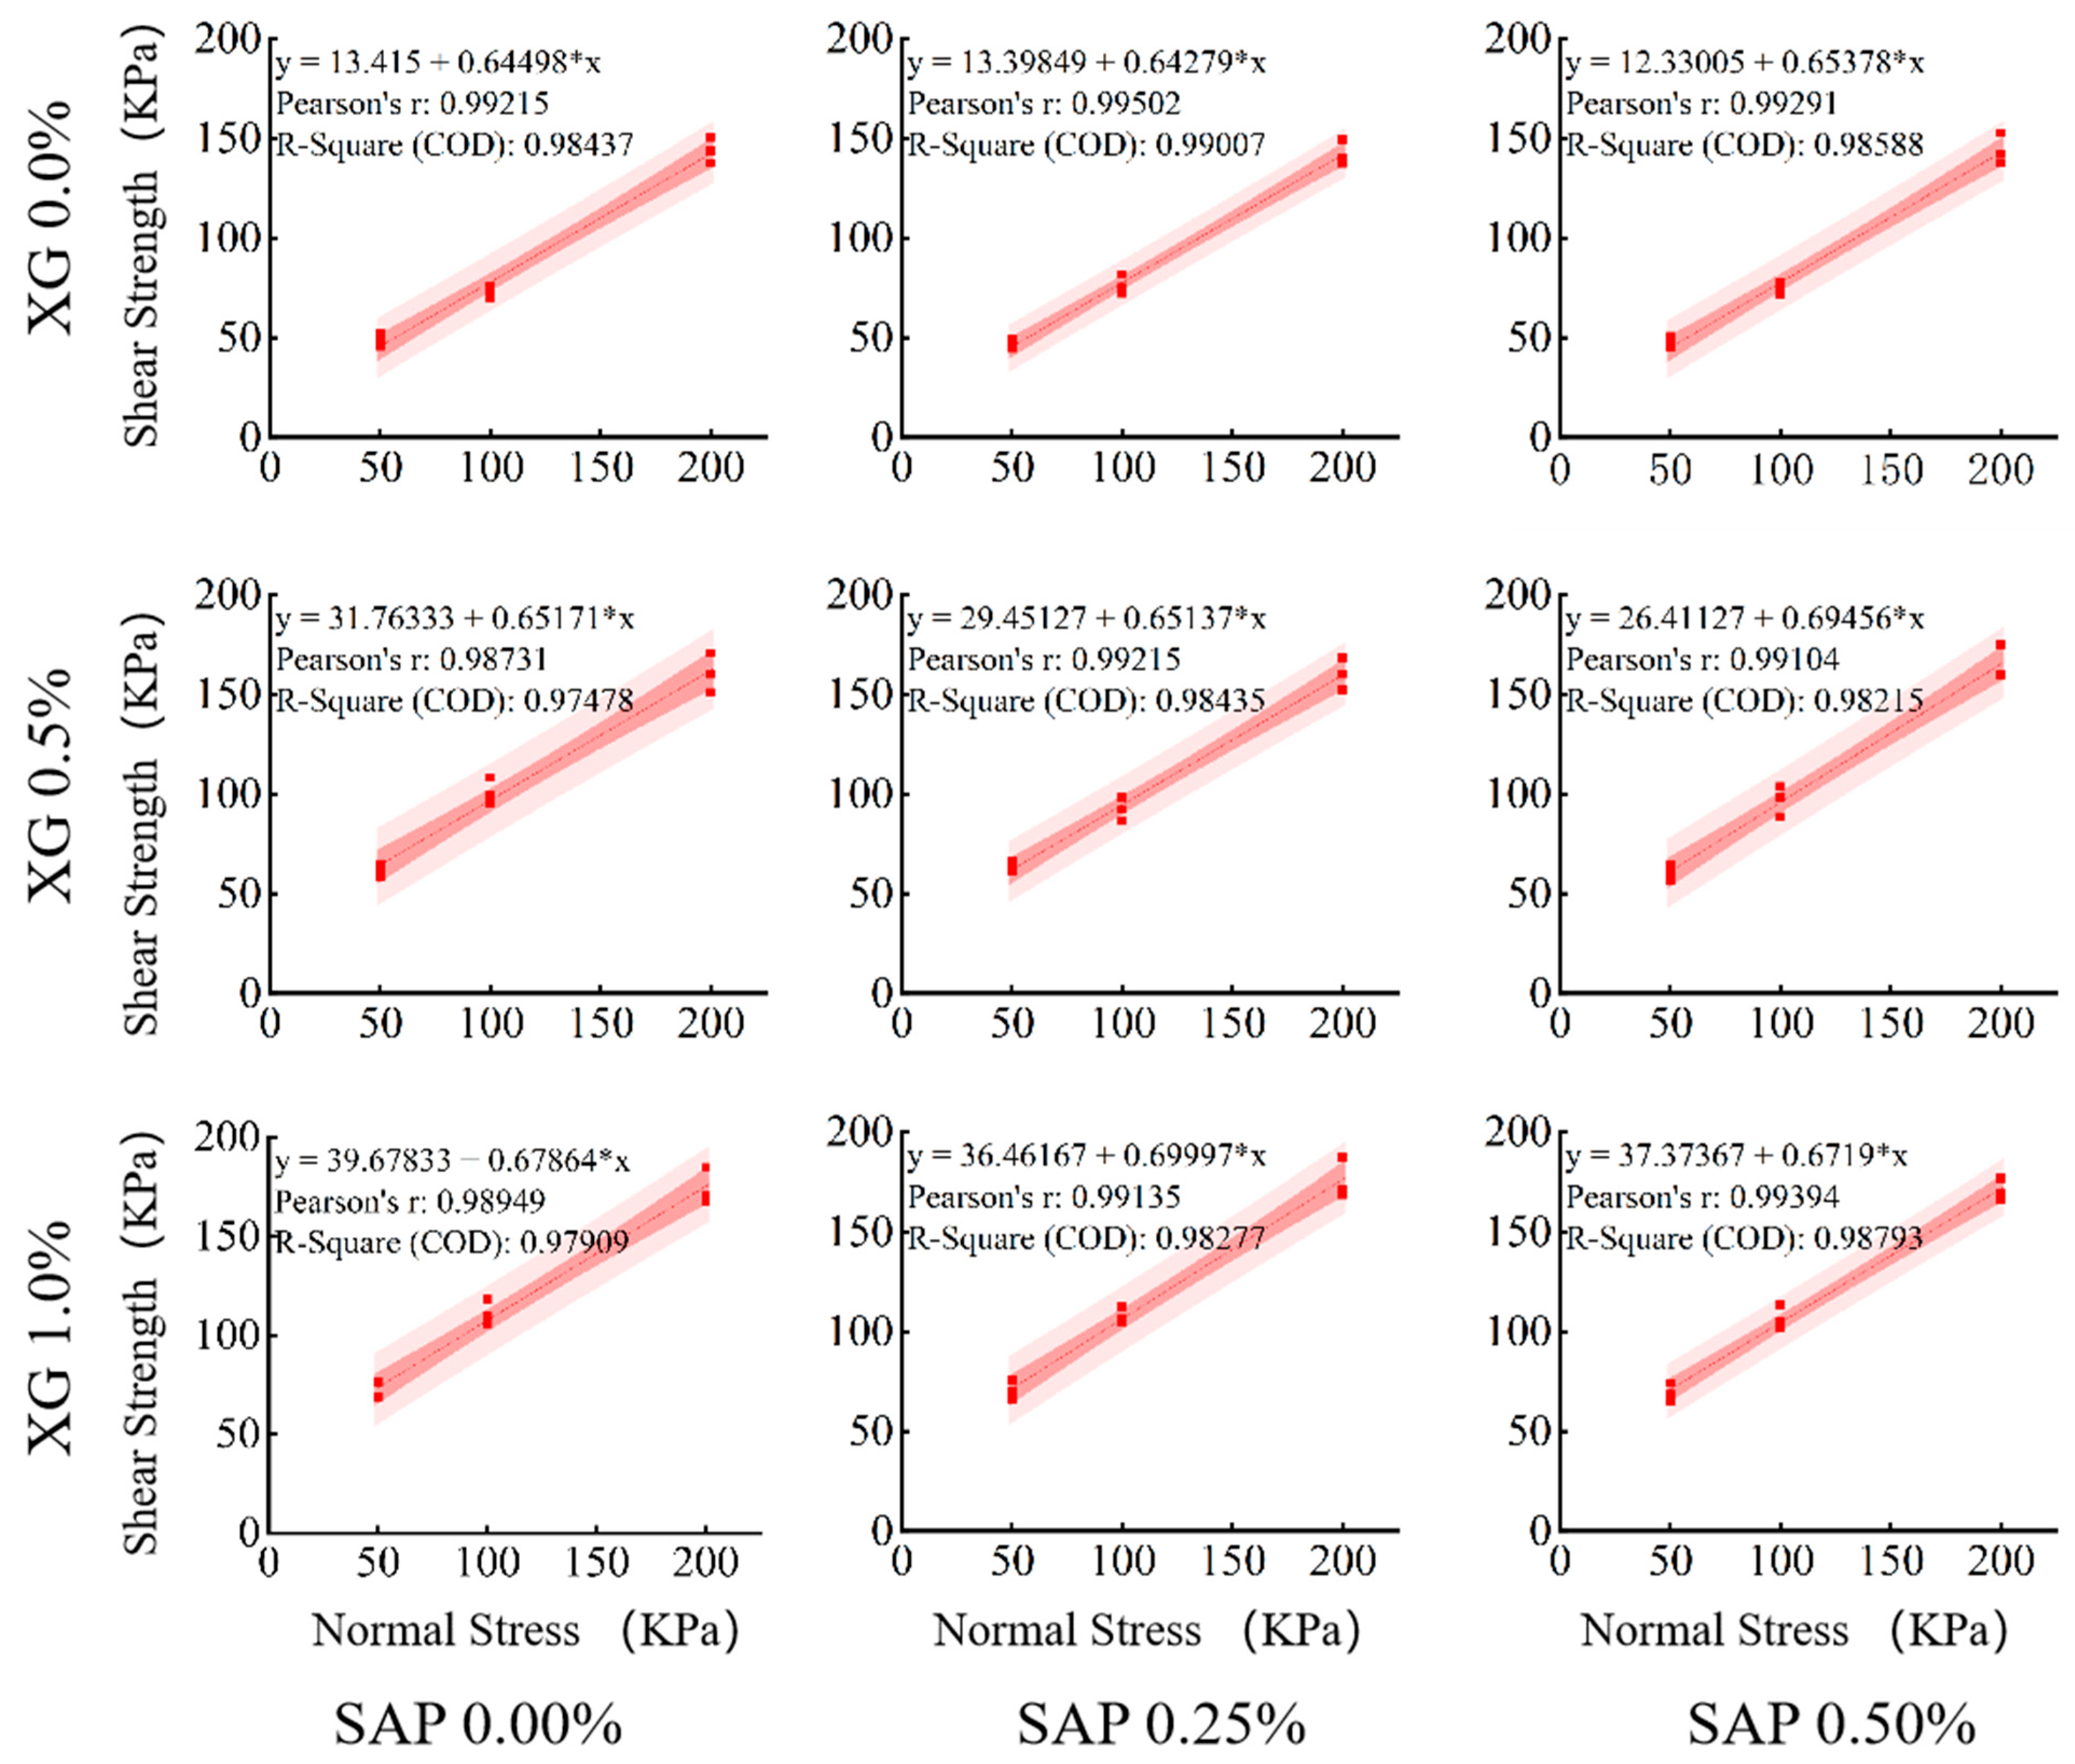
The primary shear strength indicators of soil include cohesion (c) and the internal friction angle (φ). The peak shear strength of the nine treatment groups under different normal stresses was recorded, with three sets of parallel tests conducted for each. Based on the nine data points obtained for each treatment (combining the three normal stresses and the three parallel tests), scatter plots of peak shear strength (τ) against normal stress (σ) were drawn, and regression analysis was performed on the data. As shown in Figure 11, the intercept of the fitted line represents the cohesion (c) of the soil, and the slope represents the internal friction angle (φ).
Through this regression analysis (Figure 11), the shear strength parameters (cohesion c and internal friction angle φ) of the improved soil under different XG and SAP ratios were obtained, and the results are presented in Table 7. The data indicate that without the addition of any modifier, the soil’s cohesion was 13.42 kPa and the internal friction angle was 32.82°. As the XG concentration increased, the c value rose significantly: when XG was 0.5% (Treatment 4), the c value reached 31.76 kPa (an increase of 136.77%); when XG was increased to 1% (Treatment 7), the c value further increased to 39.68 kPa (an increase of 195.78%). This remarkable improvement in cohesion suggests a potential enhancement in slope stability and erosion resistance, as higher cohesion reduces the risk of shear failure. In contrast, SAP had a relatively weak effect on the c value, and its sole addition (0.25–0.5%) did not cause significant changes. The internal friction angle φ fluctuated slightly among the treatments, with the maximum value of 34.99° observed in Treatment 8 (1% XG, 0.25% SAP), representing only a 6.61% increase compared to the control group.
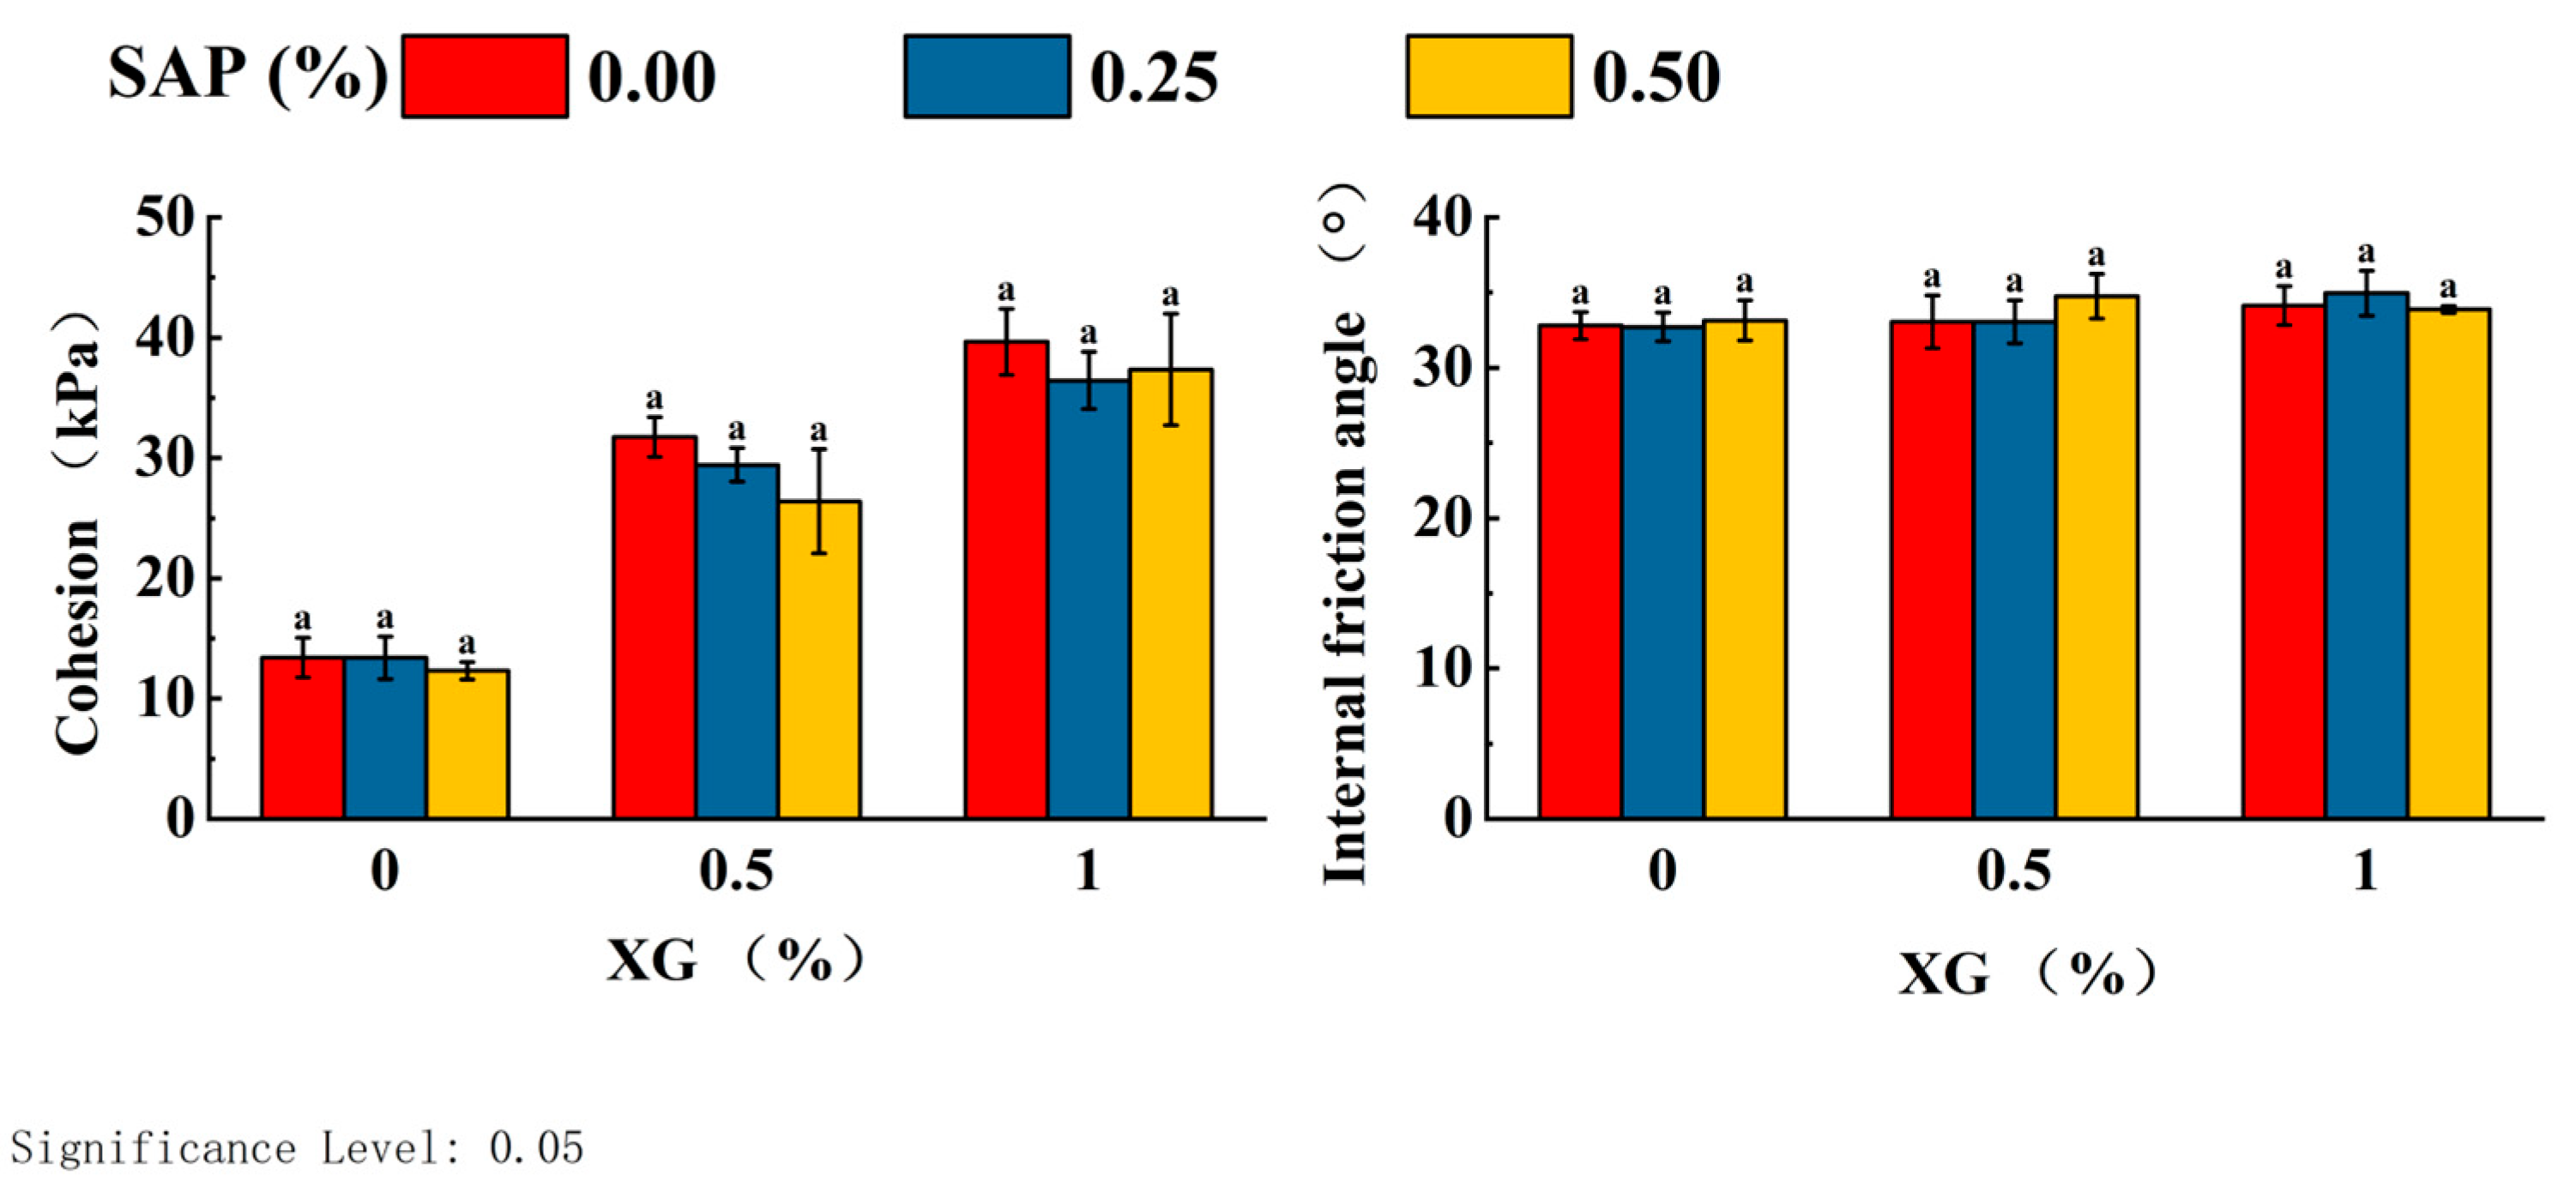
To further quantify the effect of mixture proportions, a two-way analysis of variance (ANOVA) was performed on the internal friction angle and cohesion. Notably, these parameters were derived from three separate regressions per treatment (each using the peak strengths from the three normal stresses for one replicate), resulting in three independent c and φ values per treatment group for the ANOVA. The results (Figure 12) revealed that the overall trends were consistent with those obtained from the previous regression based on nine pooled data points per treatment. Cohesion (c) was highly significantly influenced by XG content (F = 198.687, p < 0.001). As the XG addition ratio increased from 0% to 1%(SAP:0%), the mean cohesion exhibited a stepwise increase, rising from 13.42 kPa to 39.68 kPa (Table 8). In contrast, the effect of SAP content (F = 2.727, p = 0.092) and its interaction with XG (F = 0.798, p = 0.542) were not statistically significant.
However, XG and SAP have a relatively minor impact on the internal friction angle (φ). Statistical analysis shows that neither the addition ratio of XG (F = 2.832, p = 0.085), nor that of SAP (F = 0.492, p = 0.619), nor their interaction (F = 0.967, p = 0.450) has a statistically significant effect on the internal friction angle (Table 8). The internal friction angle values of all sample groups are basically stable within the range of 32.73° to 34.97°, and no significant differences were detected among all treatment groups.
In conclusion, the addition of XG is a key factor in regulating the cohesion of the samples, and its addition ratio can significantly enhance the cohesion. However, the internal friction angle remains relatively stable within the range of variations in the dosages of XG and SAP, without showing significant changes. The detailed comparisons of cohesion and internal friction angle under different addition ratios and their variance analysis results are shown in Table 8.

4. Discussion

4.1. Mechanisms of Enhancing Soil Moisture Retention and Crack Resistance

4.1.1. Synergistic Mechanism of Water Retention and Cementation

Evaporation tests and crack quantification reveal that XG and SAP do not function independently but form a continuous, water-mediated chain of interactions. SAP rapidly absorbs excess pore water during rainfall or irrigation, storing it for later release during dry periods. This process improves moisture availability in sandy soil and delays desiccation cracking, aligning with previous findings on SAP’s water retention capabilities [21,27]. However, increasing SAP from 0.25% to 0.5% raised the total crack area from 686.82 mm2 to 785.76 mm2 and the crack area ratio from 4.29% to 4.91% (Treatment 2 → Treatment 3, Table 3), indicating that unrestrained SAP swelling can compromise surface integrity. Add XG at the same SAP level (0.5%) significantly reduced cracking: the crack area ratio decreased to 2.86% with 0.5% XG (Treatment 6) and further to 0.92% with 1.0% XG (Treatment 9). This demonstrates that XG enhances soil crack resistance through its unique cementation effect, which strengthens particle interactions—this is consistent with the direct shear test results, showing improved soil cohesion. Studies indicate that functional groups in XG form a spatial network with soil particles via electrostatic interactions, hydrogen bonding, and cation bridges. The resulting polymeric emulsion and biogel network disperse stress, restrict water movement, and suppress crack initiation and propagation [28,29,30]. The combination of SAP and XG establishes a synergistic “absorption–storage–release–cementation” mechanism. A significant interaction effect (F = 9.77, p < 0.01, Table 5) confirms that their co-application enhances final moisture content beyond their individual effects. SAP absorbs, stores, and gradually releases water to maintain soil moisture, while XG’s gel network provides structural integrity, resists swelling stress, and reduces evaporation. Together, they improve soil water dynamics, minimize evaporation, promote moisture uniformity, and stabilize soil structure under varying conditions.

4.1.2. Dynamic Processes of Water Regulation and Structural Stabilization

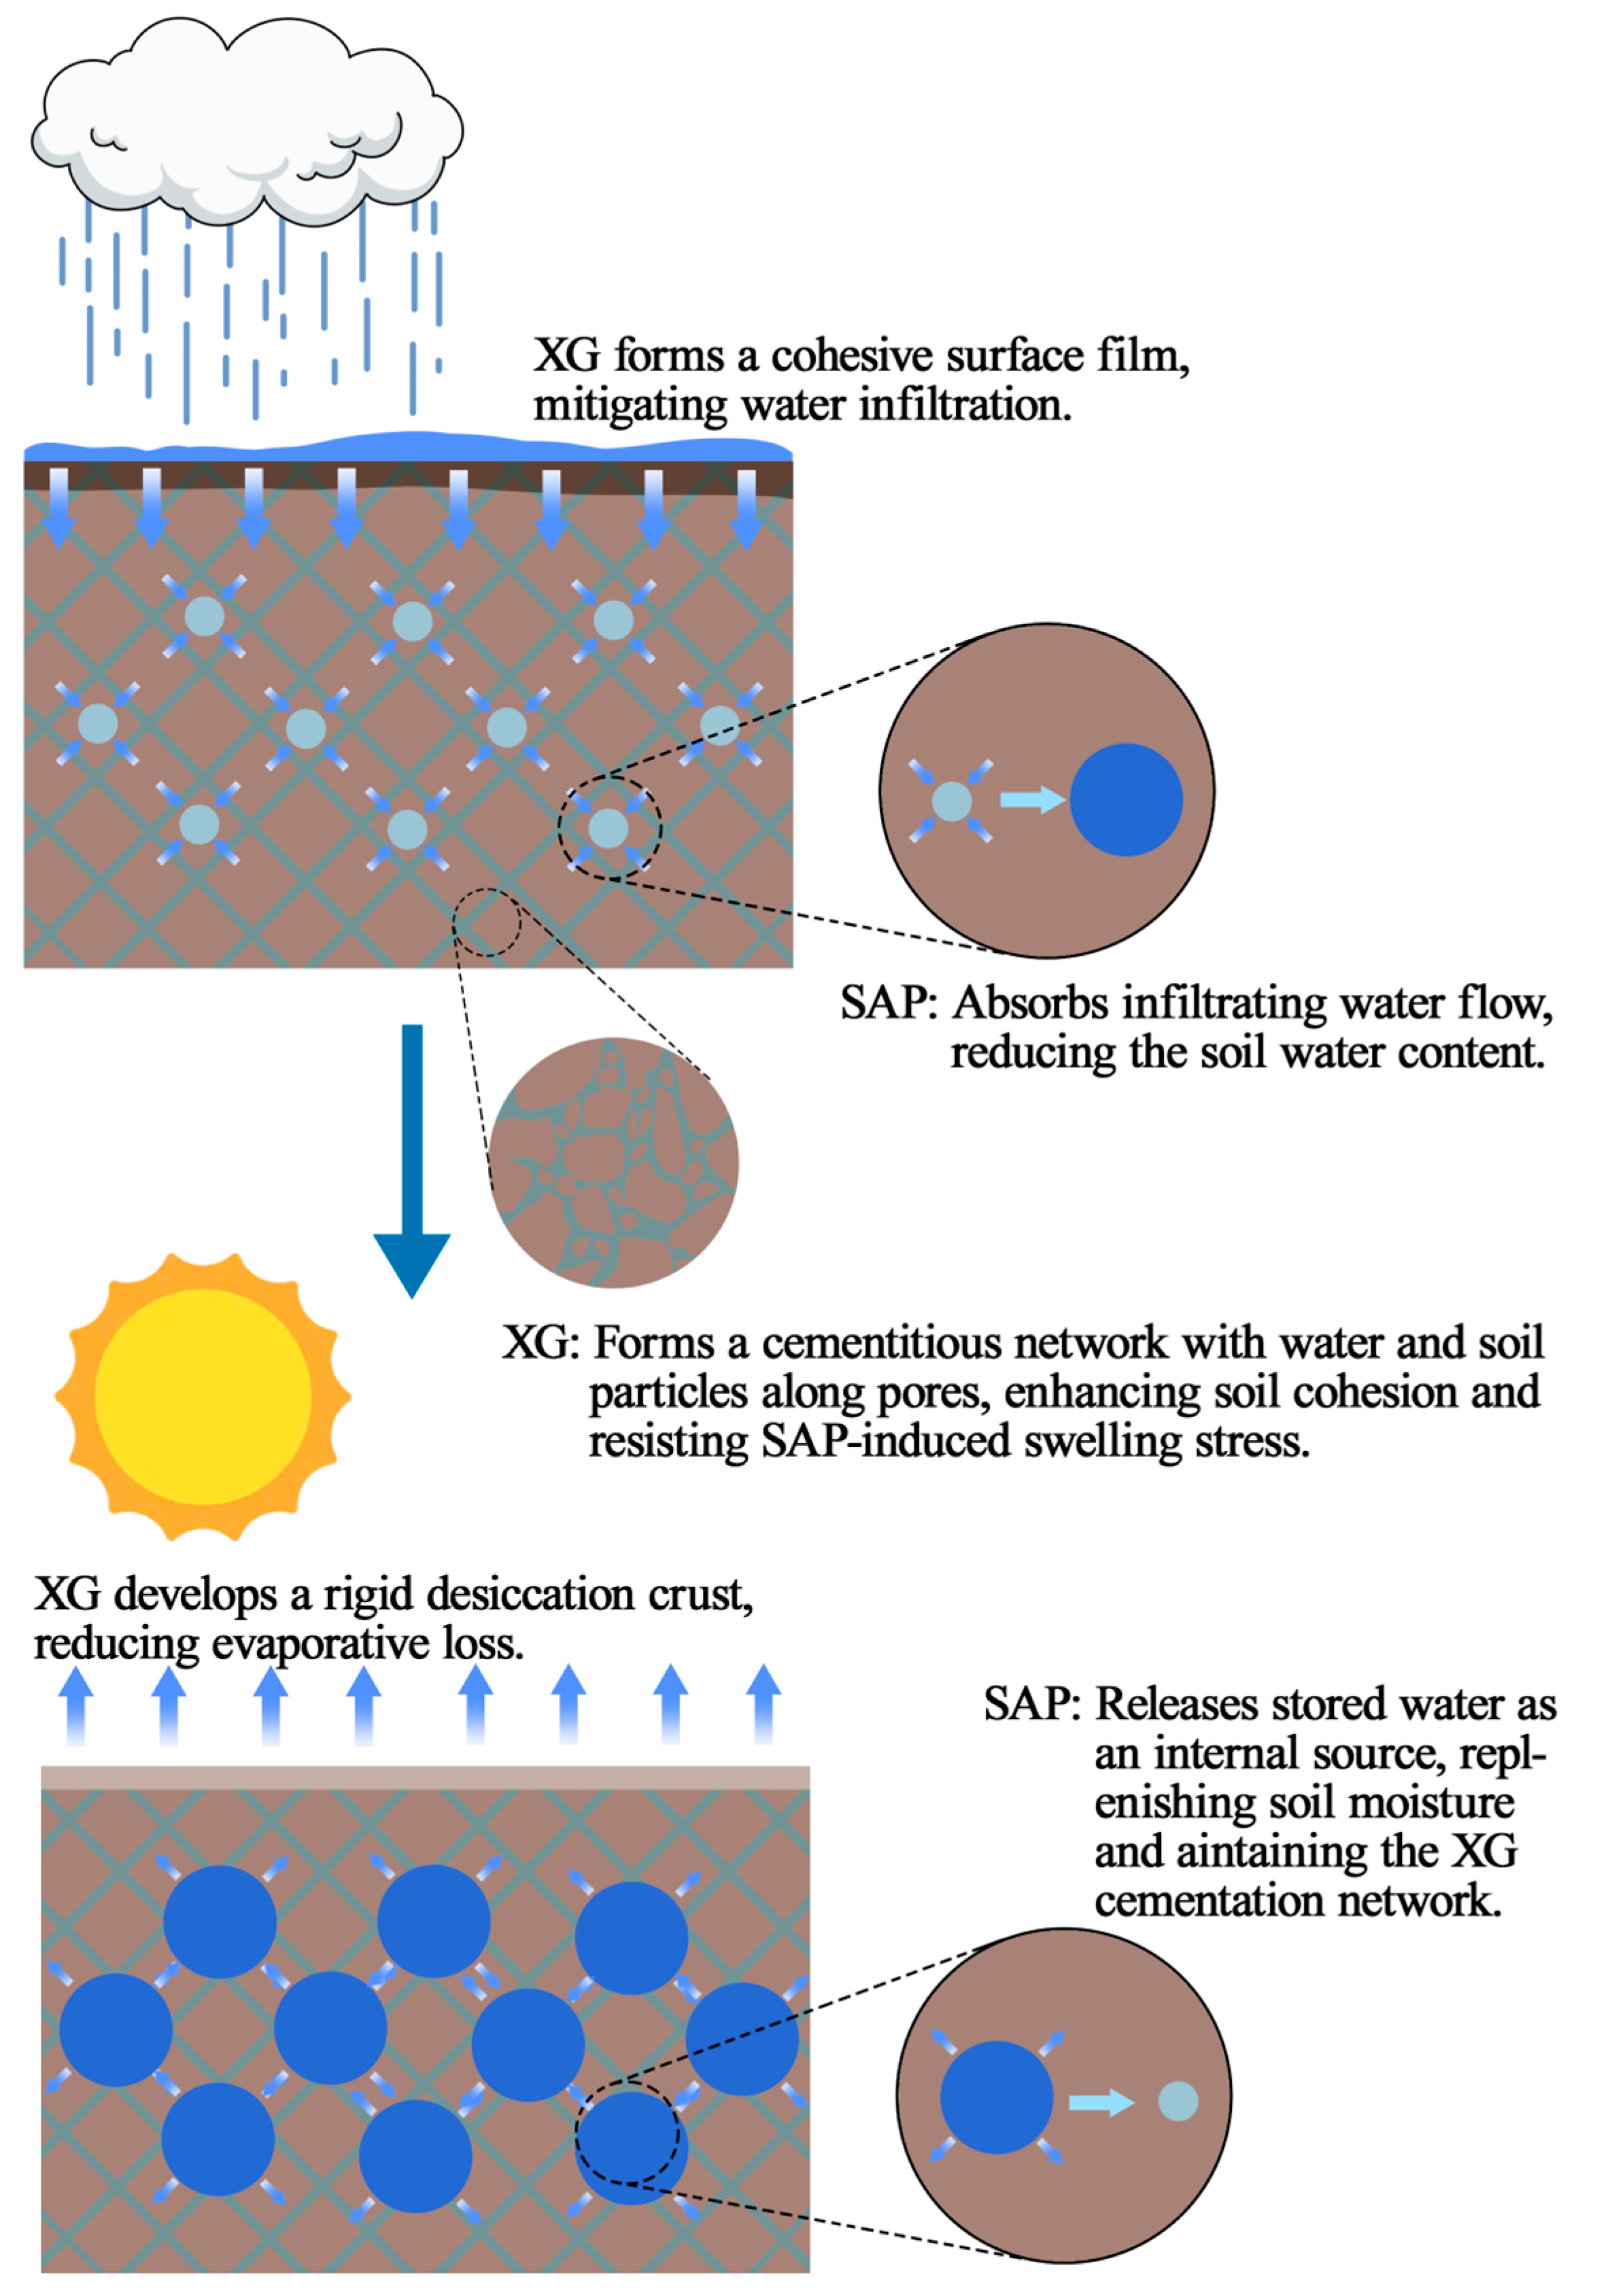
The synergy described above operates through interconnected dynamic processes during wet–dry cycles (Figure 13). During rainfall or irrigation, SAP particles rapidly absorb infiltrating water, swelling to form micro-reservoirs within the soil. This absorption reduces excess free water in soil pores and the XG gel network. Simultaneously, XG hydrates and develops a cohesive gel matrix throughout the soil, enhancing cohesion and resisting SAP-induced swelling stress—thereby maintaining structural integrity and preventing heaving or cracking.
As conditions become dry and sunny, the process reverses: SAP gradually releases stored water back into the soil matrix. This controlled release acts as an internal water source, uniformly replenishing moisture lost through evaporation and uptake by both soil particles and the XG gel network. Sustained moisture from SAP is essential for maintaining the stability and function of the XG-formed biogel. By preventing excessive drying, this process effectively delays shrinkage, preserves soil aggregation, and suppresses crack formation, leading to a more stable soil structure under alternating dry–wet conditions.

4.2. Mechanisms of Slope Resistance to Erosion

4.2.1. Synergistic Roles of XG and SAP and Quantitative Performance Comparison

XG and SAP improve soil moisture retention and crack resistance through complementary mechanisms. XG acts as a soil binder, forming a fibrous matrix between particles via hydrogen bonding and electrostatic interactions. This significantly enhances interparticle cohesion, improves aggregate stability, and reduces macropore connectivity—leading to a denser soil fabric that delays infiltration, mitigates runoff, and reduces erosive force [31,32]. As shown in Table 6, the addition of XG (≥0.5%) reduced cumulative scouring to only 0.24–0.48 kg (0.44–0.91% of the control), demonstrating substantial erosion resistance. External XG-only studies under slope conditions (30°, 20 min) reported an anti-scour coefficient (Er) of 12.47 at 0.15% XG [33], equivalent to a 92% reduction in scour rate relative to the control. Although the XG concentration was lower than in our tests, the scour rate approached that of our 0.5% XG treatment (Treatment 4: 0.85% scouring rate), with a similar trend of diminishing returns. Despite differences in geometry and rainfall representation, these dimensionless metrics support consistent concentration-dependent performance trends.
SAP functions primarily as a water reservoir. By absorbing water and swelling, it inhibits runoff generation, retains soil moisture, and gradually releases water—thereby extending moist conditions, reducing wet–dry cycling effects, and supporting vegetation, which further aids erosion control [22]. A field study on Loess Plateau terraces reported that 0.25% SAP reduced sediment yield by 58.8% [27]. Although conducted under milder rainfall and slope conditions with potential micro-depressions and vegetative cover delaying runoff—thus showing stronger retention effects—the overall reduction trends align with our findings, supporting the efficacy of SAP across varying environmental settings.

4.2.2. Mechanistic Interpretation Using the Universal Soil Loss Equation (USLE) Framework

The erosion resistance imparted by XG and SAP can be systematically explained through the lens of the Universal Soil Loss Equation (USLE), particularly via their influence on the soil erodibility factor (K) [34,35]. This factor is governed by soil properties such as texture, structure, and permeability, each modified distinctly by the two amendments:
Soil Texture and Structure: XG enhances soil shear strength and aggregate stability by forming a gel-network that binds soil particles. This strengthens the soil matrix against raindrop impact and runoff shear forces, directly reducing particle detachment and transport.
Soil Permeability: XG and SAP jointly alter hydraulic conductivity through different pathways. XG creates a gel-coated surface and pore linings that retard water infiltration, while SAP absorbs percolating water, lowering saturation and preventing surface liquefaction. Together, they minimize excess pore pressure and surface erosion by maintaining soil suction and reducing runoff-driven particle loss.
It should be noted that this study has certain limitations related to scale and boundary conditions. The findings were obtained under a specific, relatively narrow range of rainfall intensities and slope geometries. The effectiveness and synergistic mechanisms of XG and SAP under extreme rainfall events, long-term field weathering, or across a broader variety of soil types require further investigation. Furthermore, translating these laboratory-scale results to large-scale field applications may be influenced by factors such as spatial heterogeneity and construction practicality, which should be carefully considered in engineering practice. For instance, in rainfall simulation studies of polymer-modified Okinawan red soil, the reduction in erosion was mapped to equivalent parameter reductions in the WEPP model through calibrated measurements of rill erodibility. This approach can serve as a reference for extrapolating the present laboratory findings to hillslope-scale applications [35].

4.3. Mechanisms of Shear Strength Improvement

4.3.1. Combined Effect of XG and SAP on Shear Strength

The improvement in shear strength is primarily reflected in a significant increase in cohesion, while the internal friction angle remains largely stable. Without polymers, the soil exhibits c = 13.42 kPa and φ = 32.81°. With XG alone, cohesion increases to 31.76 kPa and 39.68 kPa at 0.5% and 1% XG content, respectively, while φ stays within a narrow range of 33–34° (Two-way ANOVA also shows a highly significant main effect of XG on c, p < 0.001). This aligns with existing research indicating that XG forms a stable network structure between soil particles through polymer chain cross-linking, thereby enhancing cohesion [36].
Related studies show that after water evaporation in high-temperature environments, XG’s colloidal state enhances, improving sand particle adhesion and significantly increasing shear strength. In one study, sand dried to 33% water content achieved cohesion of approximately 39.01 kPa and 49.86 kPa with 0.25% and 0.5% XG, respectively, while φ remained around 34–37° [37]. Experimental differences mainly lie in soil type (clean sand vs. the aeolian sand in this study), water content (33% vs. 13.1% in this study), and loading conditions (normal stress and rate). These differences tend to raise the upper limit of c in the literature but do not affect support for this study’s conclusion: both indicate XG primarily enhances c while φ remains relatively stable.
In XG-SAP combinations, XG = 1% with SAP = 0.25–0.5% yields c = 36.46–37.37 kPa, slightly lower than XG = 1% alone (39.68 kPa). This suggests SAP mainly provides indirect benefits through moisture buffering and post-peak stabilization within this study’s parameter range, rather than further increasing c. Excessive SAP (0.25%) reduces cohesion improvement due to swelling stress interfering with XG’s cementation network. Macroscopically, XG dominates cohesion improvement, while SAP helps maintain XG cementation structure’s long-term stability by mitigating rapid moisture changes during wet–dry cycles. Song Zezhuo et al. found that XG-modified sand’s shear strength gradually decreases with increasing wet–dry cycles, with significant declines in peak deviatoric stress and cohesion after four cycles [38].

4.3.2. Mechanism Extension Based on Soil Rheology and Polymer-Soil Interaction Models

From the perspective of soil-polymer interaction, modified sand can be considered a three-phase composite system consisting of “sand skeleton—XG cementation layer—SAP gel phase”. In this system, XG enhances soil structure stability and deformation resistance through viscoelastic cementation layer formation. SAP fills pores through water absorption and swelling, with its gel structure helping maintain soil stability under wet conditions [21] and reducing drying cracks by maintaining soil moisture [28].
The two polymers show synergistic effects at specific ratios: appropriate SAP regulates moisture distribution, providing a stable water environment for XG’s cementation network. Simultaneously, XG’s network structure confines SAP’s expansion space, preventing structural damage from over-swelling. This interaction creates a synergistic window “dominated by XG with SAP assistance”, enabling higher peak strength and better toughness during shearing. However, when SAP content exceeds a critical value (≥0.5%), over-swelling generates microcracks, disrupting XG’s cementation effect and causing strength reduction.
During wet–dry cycles, SAP’s water retention function slows moisture changes, reducing damage to the cementation network [27,38]. This mechanism reasonably explains the observed significant cohesion increase with stable internal friction angle, providing theoretical basis for translating laboratory strength results to engineering applications.

4.3.3. Engineering Implications and Lab-Field Correlation Summary

This study identifies an optimal synergistic ratio window of “XG-dominated with appropriate SAP”, with the 1% XG and 0.5% SAP combination providing the best balance between cohesion improvement and structural toughness. This ratio increases cohesion by 178.6% while maintaining good deformation recovery capacity, making it suitable for engineering applications such as slope stabilization and erosion control where both water retention and cementation are required. For example, in a full-scale earth dam field trial, XG treatment significantly mitigated internal erosion, as confirmed by in situ monitoring [39].
Strength parameters obtained from laboratory direct shear tests can be translated to field stability assessment through systematic correction methods. Key correction aspects include: moisture condition differences (considering actual rainfall infiltration and evaporation processes), scale effects (specimen vs. field soil size differences), boundary conditions (field structural constraints and lateral confinement), and time effects (wet–dry cycles and material aging). Establishing a correction system considering these factors enables the transformation of laboratory-measured cohesion and the internal friction angle into equivalent strength parameters suitable for field analysis.
Emphasis should be placed on the fact that this study is based on specific soil types and laboratory conditions, requiring necessary caution when extending to complex field environments. A phased implementation strategy is recommended for practical engineering applications. First, verification tests should be conducted in typical sections to optimize mix ratios and processes based on monitoring data feedback. For example, in the field application of alkali-induced cationically crosslinked biopolymers for slope spraying, long-term monitoring of penetration/rebound indicators and surface erosion resistance was performed, ultimately confirming the constructability and short-to-medium-term durability of the method [40]. Second, necessary drainage and surface protection measures should be considered to prevent performance degradation under extreme conditions. For instance, under high-water-content scenarios such as heavy rainfall, the material properties of trivalent chromium–xanthan gum crosslinked systems can undergo significant changes [41]. Finally, laboratory-obtained strength improvements should be treated as upper limits of material performance, and appropriate reduction factors should be incorporated into the design to ensure adequate engineering safety margins.

4.4. Implications for Slope Stability

The comprehensive evaporation, shear, and scouring test results demonstrate that SAP and XG play significant roles in improving soil water retention, structural stability, and mechanical performance. The enhancement of slope stability is primarily attributed to the dominant mechanism of XG significantly increasing soil cohesion, while the moisture regulation by SAP serves as a key synergistic factor for maintaining long-term performance. The optimal combination of the two (1% XG, 0.5% SAP), compared to the control group (0% XG, 0% SAP), increased water content by 19.73%, enhanced cohesion by 178.6%, and reduced scour loss by over 99%.
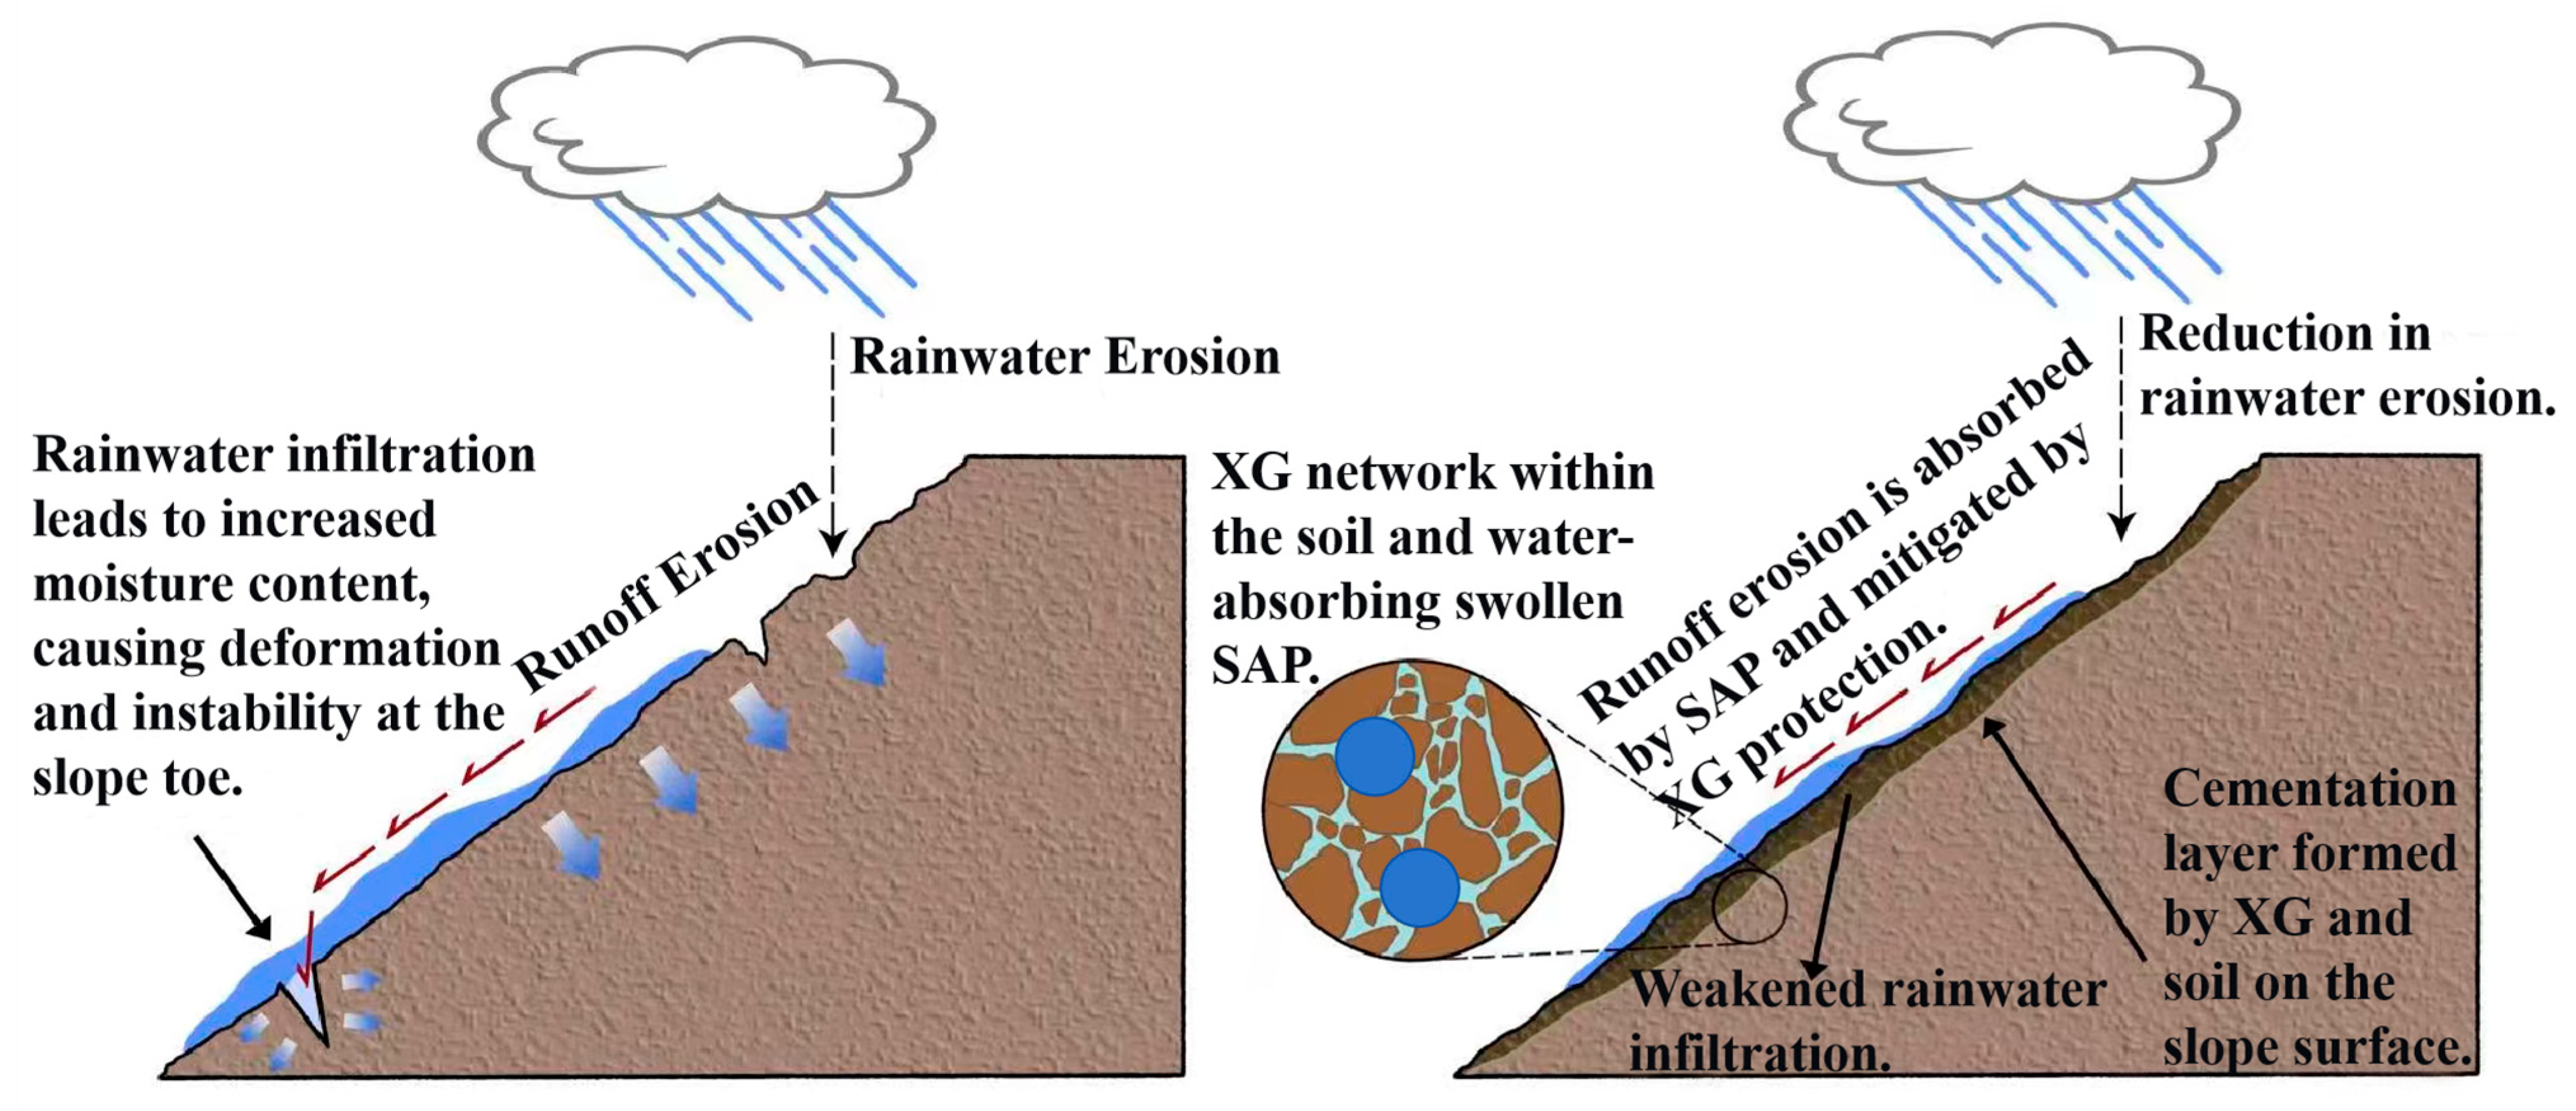
XG improves soil cohesion and structural density through chemical bonding and physical cementation. This effectively mitigates runoff erosion, particle detachment, and rainwater infiltration under rainfall scouring, thereby delaying the onset of slope instability. SAP enhances soil moisture conditions via high water absorption and swelling capacity, prolonging wetness duration and reducing structural degradation from drying-wetting cycles. An optimal SAP dosage (<0.5%) helps fill voids, homogenize pore distribution, and reduce hydraulic conductivity, synergistically enhancing stability with XG’s (1%) cementation (Figure 14).
However, excessive SAP (≥0.5%) generates substantial swelling pressure, disrupting the cementation matrix, promoting crack propagation, and reducing shear strength, which increases instability risk. To mitigate these side effects, the SAP-to-XG ratio must be optimized based on soil texture and climate conditions. Gradient tests are recommended to determine the optimal mix. For instance, sandy soils may require a higher XG proportion to strengthen the skeleton. Layered mixing and in situ blending ensure uniform material distribution and avoid localized swelling stress. Combining with vegetation can establish a “cementation–moisture retention–root anchoring” composite system, further dispersing swelling stress and enhancing long-term durability.
In field applications, challenges such as material cost, mixing homogeneity, and long-term durability under wet–dry cycles must be addressed. Therefore, engineering design should include specific mix proportion tests and cost-effectiveness analysis based on the target slope’s soil properties and hydrological conditions, to achieve both structural stability and ecological restoration.

5. Conclusions

This study clarifies the synergistic effects and dominant mechanisms of xanthan gum (XG) and superabsorbent polymer (SAP) in aeolian sand slope improvement. XG was identified as the primary agent for structural stability. At a dosage ≥ 0.5%, it increased soil cohesion by over 136% and reduced heavy rainfall erosion by more than 99%, effectively bridging the vegetation establishment phase. SAP primarily regulated soil moisture, raising the water content from 1.8% to approximately 20%, but its dosage required limitation to <0.5% to prevent adverse swelling and cracking.
At optimal ratios (XG 0.5–1.0%, SAP ≤ 0.5%), a “water retention–consolidation” synergy was achieved: SAP secured water supply and maintained a humid microenvironment for stable XG cementation, while the XG network confined excessive SAP swelling. This combination enhanced slope erosion resistance and long-term stability. Our findings provide a nature-based theoretical and technical pathway for ecological slope stabilization in semi-arid regions.
Future work should focus on scaling up for practical applications, including field validation and long-term monitoring. Key research priorities include: durability under wet–dry and freeze–thaw cycles, UV aging, and their impact on the evolution of cohesion; environmental assessments of Super Absorbent Polymers (SAPs), focusing on leachate, potential microplastic formation, and microbial response—recent findings on the environmental fate of SAPs in soil suggest that their aging and residues may pose a “microplastic-like” problem [42]; and the optimization of application techniques (e.g., spraying/mixing protocols, homogeneity control) alongside cost-effectiveness analyses. These efforts are essential in establishing replicable field implementation and maintenance guidelines for sustainable soil improvement and slope protection.

Author Contributions

Conceptualization, X.B., N.D., C.X. and Z.M.; methodology, X.B., N.D., C.X. and Z.M.; software, Y.L.; Validation, N.D., C.X. and Y.L.; formal analysis, C.X. and Y.L.; investigation, X.B., C.X. and Y.L.; resources, C.X., Z.M. and M.B.; data curation, N.D. and Z.M.; writing—original draft, X.B.; writing—review and editing, X.B. and Z.M.; visualization, X.B.; supervision, N.D. and Z.M.; funding acquisition, N.D. and M.B. All authors have read and agreed to the published version of the manuscript.

Funding

This research was funded by “Natural Science Foundation of Science and Technology Department of Shaanxi Province” (S2024-JC-YB-2574) and “Xi’an Science Technology Bureau Fund” (23NYGG0050).

Institutional Review Board Statement

Not applicable.

Informed Consent Statement

Not applicable.

Data Availability Statement

The original contributions presented in this study are included in the article. Further inquiries can be directed to the corresponding author.

Conflicts of Interest

Author Ming Bai was employed by the company Fugu Yifeng Coal Mine Co., Ltd. The remaining authors declare that the research was conducted in the absence of any commercial or financial relationships that could be construed as a potential conflict of interest.

References

  1. Sun, J.G.; Wang, T.; Yan, C.Z. The Relative Roles of Climate Change and Human Activities in the Desertification Process of Yulin City. J. Desert Res. 2012, 32, 625–630. [Google Scholar]
  2. Liu, Y.C.; Wang, M.; Tao, Z.; Hu, X. Analysis of Desertification Evolution and Its Driving Forces in Yulin City. Sci. Soil Water Conserv. (Chin. Engl.) 2024, 22, 9–16. [Google Scholar]
  3. Zan, G.S.; Wang, C.P.; Li, F.; Liu, Z.; Sun, T. Main Results and Analysis of the Sixth National Survey on Desertification and Sandy Land. For. Resour. Manag. 2023, 1, 1–7. Available online: https://www.cnki.com.cn/Article/CJFDTotal-LYZY202301001.htm (accessed on 17 November 2025).
  4. Wang, Y.M.; Tao, Y.C.; Cheng, Z.Y.; Li, B. Long-term protective effect of soil spraying on highway cutting slopes. J. Ecol. Environ. 2021, 30, 1724–1731. [Google Scholar]
  5. Gao, L.P.; Qi, X.F. Research on the Stability Analysis of Windblown Sand Roadbed Slope. J. Inn. Mong. Agric. Univ. (Nat. Sci. Ed.) 2009, 30, 212–215. [Google Scholar]
  6. Wang, Z.; Li, Q.; Zhang, N.; Jin, Y.; Qin, H.; Ding, J. Slope failure of biotreated sand embankments under rainfall conditions: Experimental investigation and numerical simulation. Bull. Eng. Geol. Environ. 2020, 79, 4683–4699. [Google Scholar] [CrossRef]
  7. Eades, J.L.; Grim, R.E. Reaction of hydrated lime with pure clay minerals in soil stabilization. Highw. Res. Board Bull. 1960. Available online: https://api.semanticscholar.org/CorpusID:55002825 (accessed on 17 November 2025).
  8. Ramana Murty, V.; Hari Krishna, P. Amelioration of expansive clay slopes using calcium chloride. J. Mater. Civ. Eng. 2007, 19, 19–25. [Google Scholar] [CrossRef]
  9. Mahedi, M.; Cetin, B.; White, D.J. Performance evaluation of cement and slag stabilized expansive soils. Transp. Res. Rec. 2018, 2672, 164–173. [Google Scholar] [CrossRef]
  10. Khayat, K.H. Viscosity-enhancing admixtures for cement-based materials—An overview. Cem. Concr. Compos. 1998, 20, 171–188. [Google Scholar] [CrossRef]
  11. Rezende, J.C.V.; Neto, J.O.A.; Zornberg, J.G. Shear Strength Characterization of the Interface Between Geocell Walls and Infill. Indian Geotech. J. 2025, 55, 3119–3130. [Google Scholar] [CrossRef]
  12. Song, G.; He, S.; Song, X.; Duan, Z.; Zhang, Y.; Kong, D.; Huang, M. The use of geocell as soil stabilization and soil erosion countermeasures. Geomatics. Nat. Hazards Risk 2021, 12, 2155–2169. [Google Scholar] [CrossRef]
  13. Hegde, A. Geocell reinforced foundation beds-past findings, present trends and future prospects: A state-of-the-art review. Constr. Build. Mater. 2017, 154, 658–674. [Google Scholar] [CrossRef]
  14. Lann, T.; Bao, H.; Lan, H.; Zheng, H.; Yan, C.; Peng, J. Hydro-mechanical effects of vegetation on slope stability: A review. Sci. Total Environ. 2024, 926, 171691. [Google Scholar] [CrossRef]
  15. Wang, J.; Zhao, W.W.; Liu, Y.; Jia, L.Z. Review on the effects of plant functional traits on soil conservation. Acta Ecol. Sin. 2019, 39, 3355–3364. [Google Scholar]
  16. Cammeraat, E.; Van Beek, R.; Kooijman, A. Vegetation succession and its consequences for slope stability in SE Spain. Plant Soil 2005, 278, 135–147. [Google Scholar] [CrossRef]
  17. Carroll, C.; Merton, L.; Burger, P. Impact of vegetative cover and slope on runoff, erosion, and water quality for field plots on a range of soil and spoil materials on central Queensland coal mines. Soil Res. 2000, 38, 313–328. [Google Scholar] [CrossRef]
  18. Chang, I.; Kwon, Y.-M.; Im, J.; Cho, G.-C. Soil consistency and interparticle characteristics of xanthan gum biopolymer–containing soils with pore-fluid variation. Can. Geotech. J. 2019, 56, 1206–1213. [Google Scholar] [CrossRef]
  19. Lee, S.; Chung, M.; Park, H.M.; Song, K.-I.; Chang, I. Xanthan gum biopolymer as soil-stabilization binder for road construction using local soil in Sri Lanka. J. Mater. Civ. Eng. 2019, 31, 06019012. [Google Scholar] [CrossRef]
  20. Mendonça, A.; Morais, P.V.; Pires, A.C.; Chung, A.P.; Oliveira, P.V. A review on the importance of microbial biopolymers such as xanthan gum to improve soil properties. Appl. Sci. 2020, 11, 170. [Google Scholar] [CrossRef]
  21. Maghchiche, A.; Haouam, A.; Immirzi, B. Use of polymers and biopolymers for water retaining and soil stabilization in arid and semiarid regions. J. Taibah Univ. Sci. 2010, 4, 9–16. [Google Scholar] [CrossRef]
  22. Yang, Q.; Pei, X.; Huang, R. Impact of polymer mixtures on the stabilization and erosion control of silty sand slope. J. Mt. Sci. 2019, 16, 470–485. [Google Scholar] [CrossRef]
  23. Malik, S.; Chaudhary, K.; Malik, A.; Punia, H.; Sewhag, M.; Berkesia, N.; Nagora, M.; Kalia, S.; Malik, K.; Kumar, D.; et al. Superabsorbent polymers as a soil amendment for increasing agriculture production with reducing water losses under water stress condition. Polymers 2022, 15, 161. [Google Scholar] [CrossRef] [PubMed]
  24. Yang, L.; Yang, Y.; Chen, Z.; Guo, C.; Li, S. Influence of super absorbent polymer on soil water retention, seed germination and plant survivals for rocky slopes eco-engineering. Ecol. Eng. 2014, 62, 27–32. [Google Scholar] [CrossRef]
  25. Tran, A.T.P.; Chang, I.; Cho, G.C. Soil water retention and vegetation survivability improvement using microbial biopolymers in drylands. Geomech. Eng. 2019, 17, 475–483. [Google Scholar]
  26. Ostrand, M.S.; Desutter, T.M.; Daigh, A.L.M.; Limb, R.F.; Steele, D.D. Superabsorbent polymer characteristics, properties, and applications. Agrosystems. Geosci. Environ. 2020, 3, e20074. [Google Scholar]
  27. Cao, Y.; Wang, B.; Guo, H.; Xiao, H.; Wei, T. The effect of super absorbent polymers on soil and water conservation on the terraces of the loess plateau. Ecol. Eng. 2017, 102, 270–279. [Google Scholar] [CrossRef]
  28. Ji, B.; Zhao, C.; Wu, Y.; Han, W.; Song, J.; Bai, W. Effects of different concentrations of super-absorbent polymers on soil structure and hydro-physical properties following continuous wetting and drying cycles. J. Integr. Agric. 2022, 21, 3368–3381. [Google Scholar] [CrossRef]
  29. Ouyuan, M.; Zhang, H.G.; Deng, R.T.; Wang, G.; Xiao, J.; Zhao, Y. Study on the Evolution Law of Cracks in Expansive Soil Modified by Xanthan Gum Biopolymer. Chin. J. Geotech. Eng. 2025, 47, 106–114. [Google Scholar]
  30. Berkane, H.A.; Della, N.; Benziane, M.M.; Denine, S.; Elroul, A.B.; Feknous, H. Laboratory investigation on the effect of a combination of xanthan gum and clay on the behavior of sandy soil. Innov. Infrastruct. Solut. 2022, 7, 269. [Google Scholar] [CrossRef]
  31. Joga, J.R.; Varaprasad, B.J.S. Effect of xanthan gum biopolymer on dispersive properties of soils. World J. Eng. 2020, 17, 563–571. [Google Scholar] [CrossRef]
  32. Liu, J.; Che, W.Y.; Hao, S.F.; Ma, X.; Yu, Y.; Wang, Y.; Chen, Z.; Li, W.; Qian, W. Study on the mechanical properties and microstructure deterioration mechanism of xanthan gum-stabilized soil under dry-wet cycles based on CT technology. Chin. J. Geotech. Eng. 2024, 46, 1119–1126. [Google Scholar]
  33. Ma, X.F.; Zhang, C.Y.; Liu, J.; Huang, L.H.; Bu, F.; Dai, C.J. Effect of sand content on anti-crack and anti-scour property of xanthan gum composite silty clay. Adv. Sci. Technol. Water Resour. 2023, 43, 1006–7647. [Google Scholar]
  34. Todisco, F.; Vergni, L.; Ortenzi, S.; DIMatteo, L. Soil Loss Estimation Coupling a Modified USLE Model with a Runoff Correction Factor Based on Rainfall and Satellite Soil Moisture Data. Water 2022, 14, 2081. [Google Scholar] [CrossRef]
  35. Pampalone, V.; Nicosia, A.; Palmeri, V.; Serio, M.A.; Ferro, V. Rill and Interrill Soil Loss Estimations Using the USLE-MB Equation at the Sparacia Experimental Site (South Italy). Water 2023, 15, 2396. [Google Scholar] [CrossRef]
  36. Cabalar, A.F.; Canakci, H. Direct shear tests on sand treated with xanthan gum. Proc. Inst. Civ. Eng.—Ground Improv. 2011, 164, 57–64. [Google Scholar] [CrossRef]
  37. Chen, C.; Wu, L.; Perdjon, M.; Huang, X.; Peng, Y. The drying effect on xanthan gum biopolymer treated sandy soil shear strength. Constr. Build. Mater. 2019, 197, 271–279. [Google Scholar] [CrossRef]
  38. Song, Z.Z.; Hao, S.F.; Mei, H.; Liu, J.; Ren, J.; Bu, F.; Wang, Z. Strength Characteristics of Sand Modified by Biopolymers under Dry-Wet Cycles. Acta Mater. Compos. Sin. 2023, 40, 2285–2295. [Google Scholar]
  39. Kwon, Y.M.; Moon, J.H.; Cho, G.C.; Kim, Y.U.; Chang, I. Xanthan gum biopolymer-based soil treatment as a construction material to mitigate internal erosion of earthen embankment: A field-scale study. Constr. Build. Mater. 2023, 389, 131716. [Google Scholar] [CrossRef]
  40. Lee, M.; Chang, I.; Kang, S.J.; Lee, D.H.; Cho, G.C. Alkaline induced-cation crosslinking biopolymer soil treatment and field implementation for slope surface protection. Geomech. Eng. 2023, 33, 29–40. [Google Scholar]
  41. Lee, M.; Chang, I.; Cho, G.C. Advanced biopolymer-based soil strengthening binder with trivalent chromium–xanthan gum crosslinking for wet strength and durability enhancement. J. Mater. Civ. Eng. 2023, 35, 04023360. [Google Scholar] [CrossRef]
  42. Buchmann, C.; Neff, J.; Meyer, M.; Bundschuh, M.; Steinmetz, Z. Superabsorbent polymers in soil: The new microplastics? Camb. Prism. Plast. 2024, 2, e3. [Google Scholar] [CrossRef]
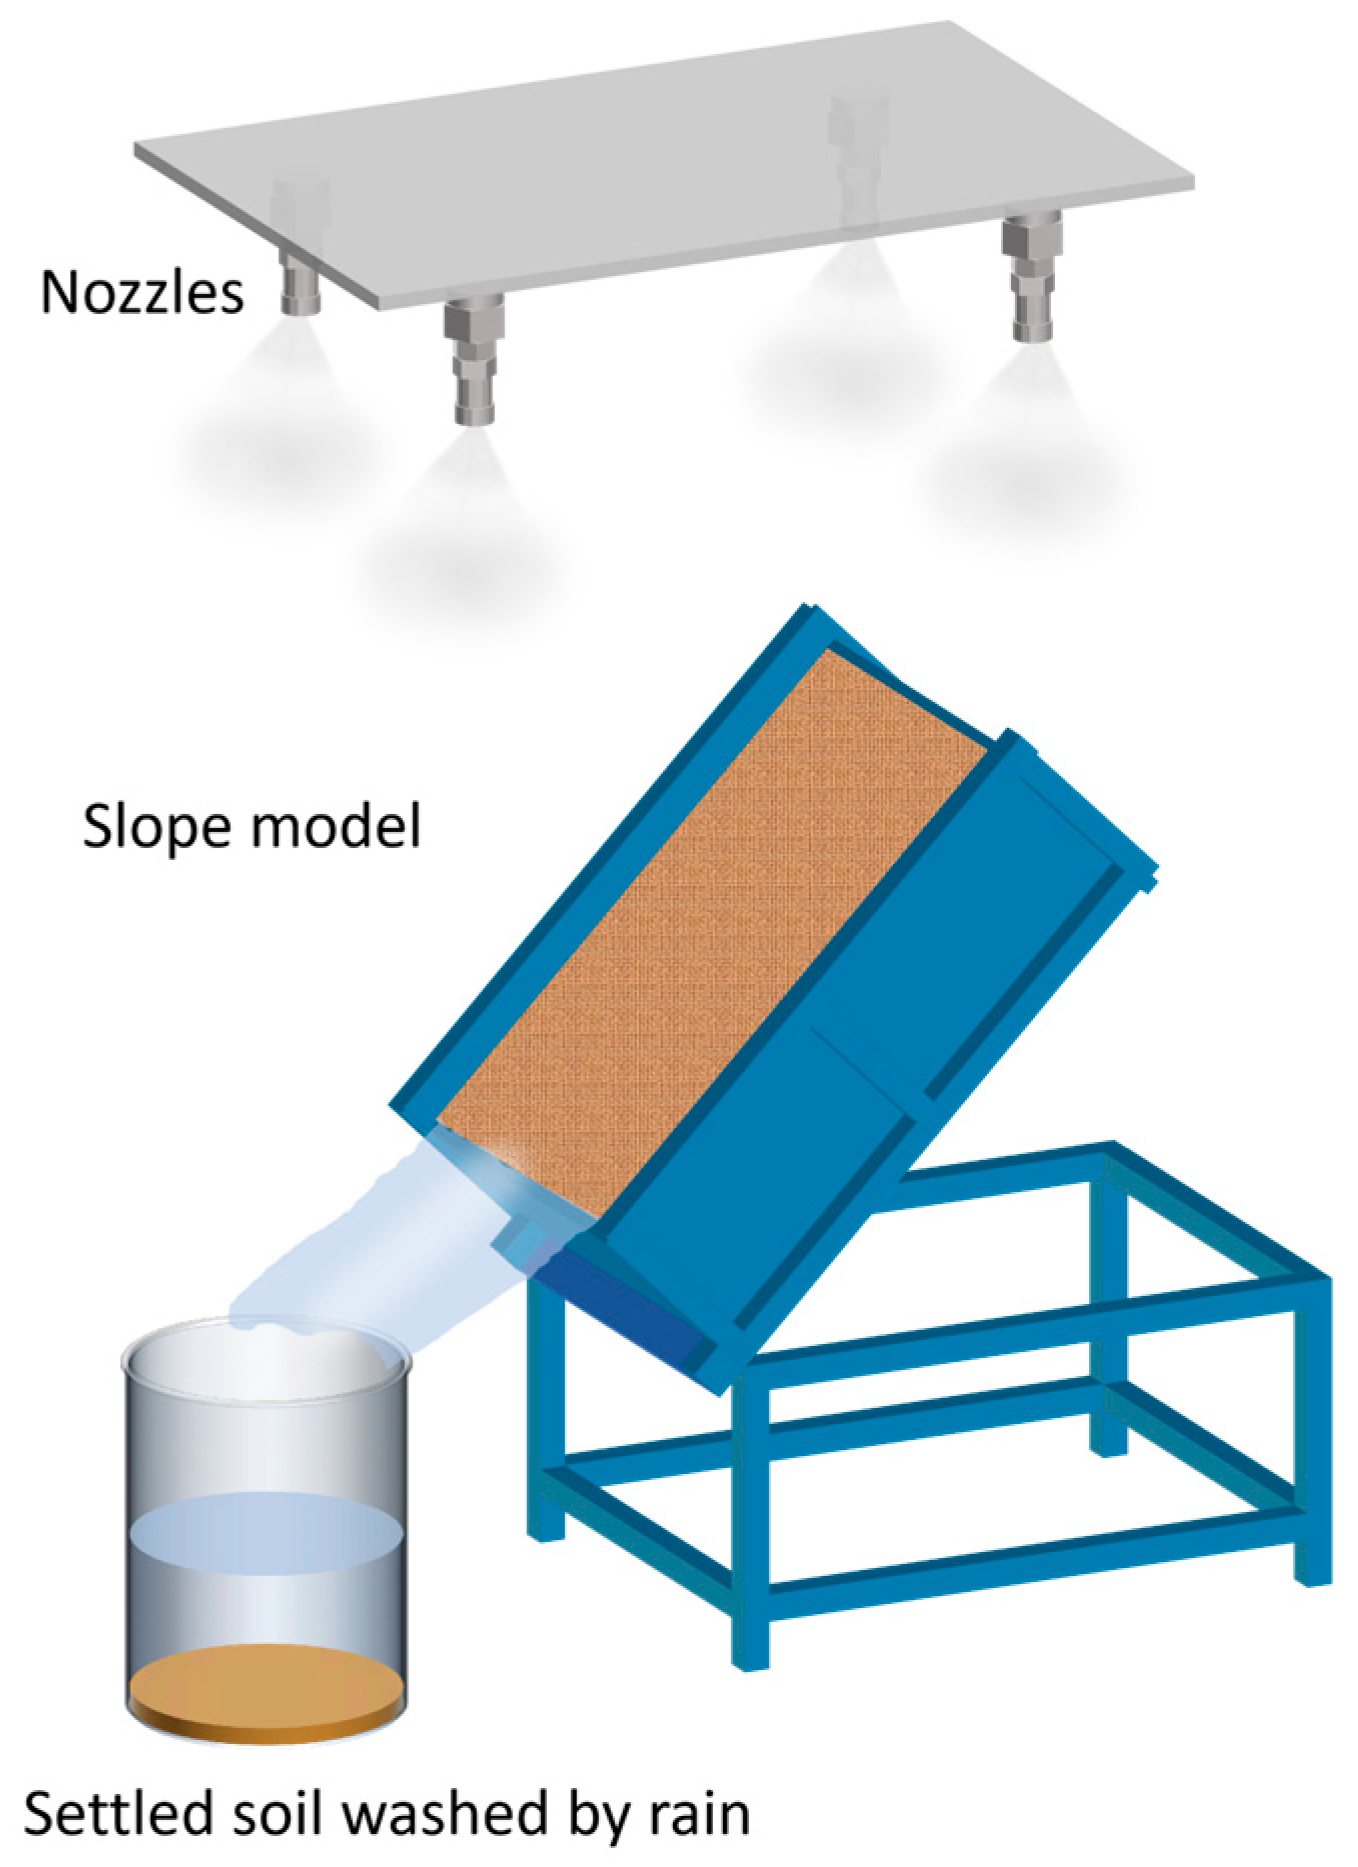
Figure 1. Schematic diagram of the rainfall simulation system.
Sustainability 17 10441 g001
Figure 2. Representative morphology of soil specimens from each treatment group after 24 h of drying under controlled conditions. Numbers ①–⑨ represent treatments 1 to 9, respectively. The red lines in the schematic diagram (inset) outline the identified crack areas for quantitative analysis.
Sustainability 17 10441 g002
Figure 3. Changes in moisture content and evaporation rate under different treatments.
Sustainability 17 10441 g003
Figure 4. Comparison of the durations of the constant evaporation stages and average evaporation rates across different treatment groups.
Sustainability 17 10441 g004
Figure 5. Two-factor ANOVA bar chart of the final moisture content after 24 h in different treatment groups. Note: Error bars represent ±1 standard deviation from three replicates. Different letters (a, b) above the bars indicate statistically significant differences among treatments according to Tukey’s HSD post hoc test (p < 0.05). Bars with the same letter are not significantly different.
Sustainability 17 10441 g005
Figure 6. Progressive scour evolution of Treatments 1–3 under a rainfall intensity of 70 mm h−1. surface washing and SAP swelling were observed at 30 min, and no full-slope collapse occurred at 60 min; its 60 min cumulative scour volume was 33.23% lower than that of Treatment 1.
Sustainability 17 10441 g006
Figure 7. Effects after 1 h of different treatments with xanthan gum added under a rainfall intensity of 70 mm/h.
Sustainability 17 10441 g007
Figure 8. Line chart of erosion rates under different proportions. Note: where x: time (min); y: XG concentration (g·min−1); z: erosion rate (g·min−1). Error bars represent ±1 standard deviation from three replicates. Because the y-axis is logarithmic, some error bars may appear visually compressed.
Sustainability 17 10441 g008
Figure 9. Two-factor ANOVA of erosion volume under different mix ratios. Note: Error bars represent ±1 standard deviation from three replicates. Different letters (a, b, c) above the bars indicate statistically significant differences among treatments according to Tukey’s HSD post hoc test (p < 0.05). Bars with the same letter are not significantly different. Because the y-axis is logarithmic, some error bars may appear visually compressed.
Sustainability 17 10441 g009
Figure 10. Curves of shear stress as a function of shear displacement under different treatments.
Sustainability 17 10441 g010
Figure 11. Regression relationship between peak shear stress and normal stress under different conditions.
Sustainability 17 10441 g011
Figure 12. Bar chart of two-factor ANOVA of cohesion and internal friction angle under different mix proportions. Note: Error bars represent ±1 standard deviation from three replicates. Different letters (a) above the bars indicate statistically significant differences among treatments according to Tukey’s HSD post hoc test (p < 0.05). Bars with the same letter are not significantly different.
Sustainability 17 10441 g012
Figure 13. Rainfall–drying cycle of the XG–SAP system: from absorption and storage to release and gel-cementation.
Sustainability 17 10441 g013
Figure 14. Synergistic effects of XG cementation and SAP water retention in reducing rainfall-induced runoff erosion and infiltration, thereby enhancing slope stability.
Sustainability 17 10441 g014
Table 1. Combinations of different substrate ratios.
Treatment NumberXG Concentration
(% w/w)
SAP Concentration
(% w/w)
Number of Replicates
1003
200.253
300.53
40.503
50.50.253
60.50.53
7103
810.253
910.53
Table 2. Fundamental physical properties of the experimental soil.
Plastic Limit (%)Liquid Limit (%)Plasticity IndexOptimum Moisture Content (%)Natural Density (g/cm3)Maximum Dry Density (g/cm3)
12.1614.552.3913.101.752.1
Table 3. Quantitative parameters of desiccation cracks developed after 24 h evaporation for different treatments.
TreatmentTotal Crack Area (mm2)Crack Area Ratio (%)Maximum Width (mm)Maximum Length (mm)
113.300.08%0.0925.86
2686.824.29%6.38185.26
3785.764.91%4.22187.80
4599.003.74%3.96247.85
5161.121.01%1.5958.77
6458.042.86%4.82193.50
7406.472.54%3.7994.67
8179.661.12%2.2672.57
9147.660.92%1.6157.38
Table 4. Final moisture contents of different treatments after 24 h.
Treatment123456789
Water content %1.80 ± 0.2215.80 ± 1.6713.14 ± 1.7720.43 ± 2.3220.40 ± 1.9819.87 ± 2.2920.59 ± 2.5120.27 ± 1.8121.53 ± 2.15
Table 5. Analysis of variance of final moisture content after 24 h of different treatments.
SAP Concentration (%)Water Content (%)
XG 0.0%0.001.80 ± 0.22 b
0.2515.80 ± 1.67 a
0.5013.14 ± 1.77 a
XG 0.5%0.0020.43 ± 2.32 a
0.2520.40 ± 1.98 a
0.5019.87 ± 2.29 a
XG 1.0%0.0020.59 ± 2.51 a
0.2520.27 ± 1.81 a
0.5021.53 ± 2.15 a
XGF54.817
p<0.01 **
SAPF9.442
p0.02 *
XG × SAPF9.77
p<0.01 **
Note: Values for Water content are presented as mean ± standard deviation. Different lowercase letters (a, b) within the same column indicate statistically significant differences among treatment groups based on a one-way ANOVA followed by Tukey’s HSD post hoc test at a significance level of p < 0.05. Treatments that share the same letter are not significantly different from each other. * p < 0.05, ** p < 0.01.
Table 6. Comparison of erosion volumes under different treatments and analysis of variance table.
TreatmentXG (%)SAP (%)Cumulative Scouring Volume (kg)Relative to the Proportion in Treatment 1 (%)
10053.36 ± 5.4130 a100.00
20.2543.56 ± 6.3927 b81.62
30.535.63 ± 2.9440 c66.77
40.500.45 ± 0.0192 a0.85
50.250.45 ± 0.0194 a0.85
60.50.48 ± 0.0080 a0.91
7100.24 ± 0.0040 a0.45
80.250.24 ± 0.0078 a0.44
90.50.25 ± 0.0037 a0.47
XGF484.654
p<0.001 ***
SAPF6.411
p0.008 **
XG*SAPF6.459
p0.002 **
Note: Values for Cumulative scouring volume are presented as mean ± standard deviation. Different lowercase letters (a, b, c) within the same column indicate statistically significant differences among treatment groups based on a one-way ANOVA followed by Tukey’s HSD post hoc test at a significance level of p < 0.05. Treatments that share the same letter are not significantly different from each other. ** p < 0.01, *** p < 0.001.
Table 7. Comparison of cohesion and internal friction angle under different treatments.
TreatmentXG%SAP%Cohesion (c)
kPa
Internal Friction Angle (φ)Increase Rate of c Value %Increase Rate of φ Value %
10013.4232.820.00%0.00%
20.2513.4032.73−0.12%−0.27%
30.512.3333.18−8.09%1.08%
40.5031.7633.09136.77%0.83%
50.2529.4533.08119.54%0.79%
60.526.4134.7896.88%5.98%
71039.6834.16195.78%4.09%
80.2536.4634.99171.80%6.61%
90.537.3733.90178.60%3.28%
Note: Cohesion and internal friction angle obtained through regression analysis based on three sets of parallel data points, totaling nine points.
Table 8. Comparison of cohesion and internal friction angle under different treatments and analysis of variance table.
TreatmentXG%SAP%Cohesion (c) kPaInternal Friction Angle (φ)°
10013.42 ± 1.352 a32.81 ± 0.747 a
20.2513.40 ± 1.444 a32.73 ± 0.776 a
30.512.33 ± 0.601 a33.16 ± 1.100 a
40.5031.76 ± 1.340 a33.07 ± 1.440 a
50.2529.45 ± 1.150 a33.06 ± 1.158 a
60.526.41 ± 3.550 a34.76 ± 1.204 a
71039.68 ± 2.244 a34.15 ± 1.048 a
80.2536.46 ± 1.941 a34.97 ± 1.226 a
90.537.37 ± 3.773 a33.90 ± 0.191 a
CohesionXGF198.687Internal friction angleXGF2.832
p<0.001 ***p0.085
SAPF2.727SAPF0.492
p0.092p0.619
XG × SAPF0.798XG × SAPF0.967
p0.542p0.450
Note: The average cohesion and internal friction angle are obtained from regression analysis of three-point data and through three sets of parallel experiments. Values for Cohesion (c) and Internal Friction Angle (φ) are presented as mean ± standard deviation (n = 3 for the mean values derived from triplicate regressions). Different lowercase letters (a) within the same column indicate statistically significant differences among treatment groups based on a two-way ANOVA followed by Tukey’s HSD post hoc test at a significance level of p < 0.05. Treatments sharing the same letter are not significantly different from each other. *** p < 0.001.
Disclaimer/Publisher’s Note: The statements, opinions and data contained in all publications are solely those of the individual author(s) and contributor(s) and not of MDPI and/or the editor(s). MDPI and/or the editor(s) disclaim responsibility for any injury to people or property resulting from any ideas, methods, instructions or products referred to in the content.