1. Introduction
Accurately assessing humanity’s demand on the biosphere relative to its regenerative capacity is a cornerstone of sustainability science. To this end, the concepts of biocapacity and the ecological footprint have emerged as pivotal metrics [
1,
2]. Biocapacity quantifies the capacity of ecosystems to produce biological materials, provide essential services, regulate climate, and absorb waste, given prevailing management practices and technological conditions [
3]. Its counterpart, the ecological footprint, aggregates the demand for renewable resources and waste assimilation, expressing it as the area of biologically productive land and water required to support a given population or activity [
4]. This direct comparison between demand and supply provides a powerful, communicable metric for evaluating ecological overshoot at various scales.
The theoretical underpinnings of these concepts are rooted in ecological economics and the paradigm of strong sustainability, which emphasizes the preservation of critical natural capital [
5]. The standardization of the National Footprint and Biocapacity Accounts [
3] enabled robust, global assessments that consistently show humanity’s aggregate demand exceeding the planet’s regenerative capacity since the 1970s—a state known as ecological overshoot [
6,
7]. Calculation methodologies vary, ranging from land-area aggregation to approaches based on energy consumption, each with specific applications and limitations [
8,
9]. While these measures provide a critical approximation of environmental constraints, they are inherently approximations. They underscore fundamental limitations in the planet’s ability to sustain consumption-intensive societies, highlighting risks of resource shortages and waste saturation that threaten intergenerational equity—a core concern of sustainable development [
9].
A critical characteristic of biocapacity is its dynamic nature. It is not a static endowment but fluctuates due to natural processes like climate change and ecological succession, as well as anthropogenic forces such as agricultural intensification, deforestation, urbanization, and technological innovation [
10]. Despite methodological critiques—notably its primary focus on renewable resource flows while underrepresenting qualitative degradation and non-renewable resource depletion [
11]—biocapacity remains one of the most widely applied tools for synthesizing human pressure on natural systems [
12,
13].
Recent methodological advances are enhancing the precision and scope of biocapacity assessment. The field is moving beyond static comparisons through frameworks designed to quantify the dynamic balance between human demand and ecosystem supply. The integration of high-resolution remote sensing data and geospatial analysis is also improving the monitoring of ecosystem regenerative capacity at finer scales [
14]. Empirical applications consistently reveal pronounced spatial inequalities in biocapacity distribution, characterized by core–periphery disparities where developed nations often operate in ecological deficit, relying on the biocapacity of developing regions that frequently maintain reserves [
15]. Furthermore, contemporary global challenges have tested the metric’s robustness; the COVID-19 pandemic served as a natural experiment, revealing complex, short-term dynamics between economic activity and ecological pressure [
16], while climate change impacts are increasingly manifested through measurable biocapacity reductions linked to extreme weather events [
17].
Notwithstanding these advancements and empirical insights, a significant methodological limitation persists: the field remains dominated by cross-sectional and short-term time-series analyses that capture static snapshots rather than long-term evolutionary pathways. This reliance on point-in-time comparisons impedes a deeper understanding of the path dependencies, institutional influences, and transition dynamics that shape national and regional sustainability trajectories over extended temporal horizons [
14].
This study directly addresses this gap by introducing a novel, dynamic approach to analyzing biocapacity pathways across European nations. We argue that understanding the trajectories of biocapacity—how it evolves over time—is as crucial as comparing its absolute values. Our primary objective is to identify and characterize clusters of European countries that have followed the most similar trends in total biocapacity per capita over recent decades. To achieve this, we develop and apply a proprietary hybrid algorithm that integrates Dynamic Time Warping (DTW) with k-means clustering. The choice of DTW is particularly apt for this analysis, as it is specifically designed to measure similarity between temporal sequences that may vary in speed or phase, allowing it to effectively match countries with similar biocapacity pathway shapes, even if their trends are temporally misaligned [
18,
19].
This study is guided by three specific research aims. First, to develop and validate a novel methodological framework combining DTW with partitional clustering for the temporal grouping of countries based on their long-term biocapacity data. Second, to identify and characterize the resulting clusters of European nations, delineating distinct, shared biocapacity trajectories. Third, to examine the relative importance of institutional versus geographical factors in shaping these distinct long-term pathways. By shifting the analytical focus from static states to dynamic pathways, this research contributes to the emerging paradigm of dynamic sustainability assessment. The findings are intended to provide a more nuanced, evidence-based foundation for designing differentiated and effective environmental policies across Europe, tailored to the unique trajectory classes identified.
2. Biocapacity—Definition
Biocapacity is defined as the capacity of terrestrial and marine ecosystems to generate a continuous flow of biologically useful resources and to absorb waste generated by human activities, while maintaining their long-term productivity, resilience, and regenerative potential [
3].
The concept of biocapacity is deeply embedded in the paradigm of ecological economics and the theory of strong sustainability [
5]. In contrast to weak sustainability, which permits the substitution of natural capital with human-made capital (e.g., replacing natural pollinators with technological alternatives), strong sustainability posits that natural capital is fundamental, critical, and largely non-substitutable. From this perspective, biocapacity represents this critical natural capital—the capacity to deliver essential ecosystem services upon which all economic activity ultimately depends. As such, it constitutes a biophysical constraint on the scale of the economy. Its measurement serves not only diagnostic purposes but also enables the establishment of operational limits for a sustainable scale, providing a quantifiable basis for the concept of “planetary boundaries” [
7]. Globally, the aggregate biocapacity of all nations defines the Earth’s total biological budget. Exceeding this budget through excessive demand, as measured by the ecological footprint, results in the systematic depletion of natural capital, biodiversity loss, and the accumulation of waste in the biosphere, manifesting as climate change or ocean acidification [
20]. Consequently, this indicator is critical for monitoring progress toward the Sustainable Development Goals (particularly Goal 12: Responsible Consumption and Production) and for formulating policies aimed at achieving prosperity within planetary boundaries.
As a fundamental metric in sustainability science, biocapacity quantifies the supply of renewable natural resources and ecosystem services. It reflects the biosphere’s ability to produce a sustained flow of biologically useful biomass and to assimilate anthropogenic waste, while preserving its long-term productivity and resilience [
1]. The comparison of global biocapacity with the global ecological footprint underpins the assessment of whether humanity’s resource use operates within the planet’s regenerative capacity or exceeds it, leading to environmental overshoot and the degradation of natural capital.
Formally, biocapacity (BC) is a function of the extent of biologically productive area and its average yield. For a given spatial unit (e.g., country, region, or the world), it is calculated as the sum of the products of area, yield factor, and equivalence factor across all land use categories, following the methodology of the National Footprint and Biocapacity Accounts (NFBA) [
3]:
where:
—total biocapacity expressed in global hectares (gha),
i—index denoting land use category (i = 1, …, n),
n—number of land use categories (typically: cropland, grazing land, forest land, fishing grounds, built-up land),
—physical area of the i-th land category expressed in hectares (ha), obtained from sources such as FAO databases [
21] and satellite imagery,
—Yield Factor for the i-th land category,
—Equivalence Factor for the i-th land category.
To enable aggregation and comparisons between different ecosystem types, biocapacity is expressed in standardized units called
global hectares (
gha). One global hectare represents one hectare of area with
world average biological productivity for a given year [
3]. The conversion of physical hectares to global hectares is achieved through the application of YF and EQF factors.
Yield Factor (YF) corrects for differences in local productivity of a given land type relative to the world average. It is defined separately for each category
i and each country as [
3,
22]:
where:
Interpretation: indicates that local productivity is higher than the world average (e.g., due to fertile soils or advanced agricultural technologies). indicates productivity lower than average.
Equivalence Factor (EQF) factor is a constant weight assigned to each land category. It reflects the relative potential photosynthetic productivity (biomass accumulation potential) of a given category on a global scale. Its value is calculated for each edition of NFBA based on global models of ecosystem productivity and is location-independent [
3].
Despite its conceptual strength and practical utility, the biocapacity metric has several important limitations that should inform the interpretation of our findings. The methodology primarily focuses on renewable resource flows and land-based productivity, while largely overlooking critical environmental issues such as chemical pollution, groundwater depletion, soil toxicity, or the loss of genetic diversity. Furthermore, the concept does not fully account for the degradation of ecosystem quality—two hectares with the same biocapacity value may differ significantly in their biodiversity or resilience. While biocapacity provides a valuable aggregated measure of regenerative capacity, it should be complemented with other environmental indicators to provide a comprehensive assessment of sustainability. These limitations are acknowledged in the interpretation of our cluster analysis results.
The primary application of biocapacity is its comparison with the ecological footprint (EF), which represents the demand for ecosystem services. This operation is described by a simple scalar product of area and productivity vectors, giving a result in gha.
Interpretation of the result [4]: : Ecological Reserve. The country’s economy operates within its own biocapacity limits.
: Ecological Deficit. Demand exceeds local supply. The country meets its needs through resource imports, over-exploitation (leading to degradation), or carbon emissions exceeding the absorption capacity of local forests.
Biocapacity is not a constant value. Its variability over time is derived from changes in its components:
These changes are driven by natural factors (e.g., climate change affecting
) and anthropogenic factors (e.g., deforestation causing
, urbanization, soil degradation reducing
, or agricultural innovations increasing
) [
10].
Although the model focuses on biomass flows and does not fully encompass all forms of degradation (e.g., chemical pollution), its mathematical transparency, replicability, and ability to aggregate for international benchmarking make it an indispensable tool in the quantitative assessment of environmental sustainability [
23].
3. Materials and Methods
This study encompasses 44 European countries, representing a comprehensive geographical scope that includes Western, Northern, Southern, Central, and Eastern European nations, as well as transcontinental countries with substantial European territory. The study area spans from approximately 34° to 72° northern latitude and 25° western to 60° eastern longitude, covering diverse biogeographical regions and climate zones.
The included countries represent four major European biomes: (1) Temperate Broadleaf and Mixed Forests covering Western and Central Europe, (2) Boreal Forests/Taiga dominating Scandinavia and Northern Russia, (3) Mediterranean Forests characterizing Southern Europe, and (4) Temperate Grasslands present in Eastern European regions. This biome diversity is further reflected in varied climate zones, including temperate maritime, temperate continental, Mediterranean, subarctic, and alpine climates, each presenting distinct ecological productivity patterns and land-use characteristics.
3.1. Materials
This study is based on secondary quantitative data concerning the total biocapacity per capita of European countries. The data were obtained from the
Ecological Footprint–Biocapacity per Country (EF-BCPC) dataset, curated and hosted by the Quality of Government Institute at the University of Gothenburg, Sweden [
24]. This comprehensive international database aggregates environmental indicators from reputable sources including (
https://datafinder.qog.gu.se, accessed on 20 August 2025):
World Development Indicators;
International Energy Agency (IEA);
Organisation for Economic Co-operation and Development (OECD);
United Nations (FAO, UNFCCC);
Climate Action Tracker;
Yale Environmental Performance Index (EPI).
The dataset spans the period from 1946 to 2020. Comprehensive measurements for most Western European countries are available beginning in 1961 (e.g., Austria, Belgium, Denmark, Finland, France, Germany). Data for Central and Eastern European countries, the Balkans, and former Soviet republics generally commence in the early 1990s, following geopolitical transformations and enhancements in statistical reporting.
The dataset exhibits significant inherent incompleteness, and no imputation or data augmentation techniques were applied. The periods 1946–1960 and 2017–2020 consist predominantly of missing records and were consequently excluded from the analysis. All analytical procedures were performed exclusively on the original, non-imputed data.
3.2. Method
To analyze the heterogeneity in environmental development trajectories among European countries, a proprietary algorithm integrating dynamic programming with the k-means method was employed. The objective of this algorithm is to identify clusters of countries exhibiting similar developmental pathways with respect to biocapacity.
While k-means clustering is a widely used method for partitioning observations into clusters based on proximity to centroids, its conventional application, which relies on Euclidean distance, is often inadequate for temporal data. The primary limitation lies in its inability to account for temporal misalignment and variations in the pace of change. For instance, two countries may exhibit fundamentally similar patterns in biocapacity evolution—such as a sequence of rapid growth, stabilization, and gradual decline—but may realize these patterns on different temporal scales, with one country lagging several years behind another. To a standard k-means algorithm, which compares values only at identical time points, such trajectories would appear dissimilar.
To address this limitation and capture genuine similarities in the dynamic shape of processes, this study applies an advanced clustering algorithm that integrates Dynamic Time Warping (DTW) with the k-means framework. DTW is a nonlinear optimization technique that elastically aligns two temporal sequences along the time axis. By identifying an optimal alignment path that “warps” the temporal structure of one series to match the other, DTW minimizes the global discrepancy between the sequences, providing a similarity measure robust to phase shifts and temporal distortions. This allows the algorithm to focus on the underlying trends and profiles of change rather than on instantaneous states.
In the implemented procedure, DTW serves a dual role: as the core similarity metric for assigning trajectories to clusters, and as the basis for defining cluster centroids. Since averaging elastically aligned sequences cannot be achieved through a simple arithmetic mean, the algorithm employs DTW Barycenter Averaging (DBA) to compute centroids. DBA iteratively adjusts the centroid to minimize the sum of DTW distances to all cluster members, effectively extracting the common temporal pattern characteristic of the group (see [
25]).
This hybrid approach enables the identification of clusters based on shared dynamic histories of biocapacity change, rather than on static similarities. The resulting clusters represent typical models of environmental transformation—such as “countries with early intensive degradation followed by late recovery” or “countries following a stable, balanced trajectory”—revealing socio-ecological similarities that remain undetected by methods ignoring temporal dynamics.
The individual steps of the proprietary algorithm are outlined below (Section
Section 3.2.1).
3.2.1 Algorithm
Input: Given data matrix where:
Output:
Cluster assignments
Anomaly flags
Step 1: Data input
The input data is a matrix
where:
Each row is a time series trajectory of total Biocapacity (gha per capita). Missing values (if any) are imputed using linear interpolation to maintain temporal continuity.
Initial condition:
where:
—is defined.
Step 2: Distance Calculation using DTW
For each pair
of countries we compute the
:
with constraints:
Monotonicity: is a monotonically increasing path,
Boundary: ’. This means: starts at and ends at ,
Step: ’
Warping window: (local warping to prevent pathological alignments). The warping window size of 5 years (approximately 10% of the time series length) was determined through a sensitivity analysis that evaluated cluster stability (using the average silhouette score) across a range of window sizes from 0 to 10 years. The 5-year window was selected as it provided the optimal balance between alignment flexibility and cluster coherence.
DTW allows us to compare trajectories regardless of phase shifts.
The warping window size of 5 years (approximately 10% of the time series length) was determined through sensitivity analysis evaluating cluster stability across window sizes from 0 to 10 years. This constraint balances algorithmic flexibility with computational efficiency while preventing excessive temporal distortion. DTW allows us to compare trajectories regardless of phase shifts.
This transforms all pairwise distances to the interval.
Step 4: Optimal Cluster Number
We compute the silhouette score:
where:
is the average DTW distance of country i to its own cluster,
is the minimum average distance to other clusters.
This step reflects the internal cohesion vs. external separation of clusters.
Step 5: Clustering
We assign each country to the nearest centroid (trajectory with smallest DTW). Centroids are initialized via k-means++ using DTW distances.
Update centroids using DTW barycenter averaging (DBA) until convergence:
Each centroid represents a prototypical globalization path for a group of countries.
Step 6: Cluster Validation
For each cluster compute:
Volatility (intra-cluster variation):
where is interpreted as the speed of total Biocapacity (gha per capita) in the cluster. Estimate trend coefficient from regression of on time t.
Step 7: Cluster Assignment Criteria
Country belongs to cluster if all conditions hold:
Mean absolute deviation is moderate:
DTW variance within cluster:
Step 8: Anomaly Detection
For each country
i in cluster
j global anomaly score:
Point anomalies for year
t:
Flag if or
Step 9: Type of anomaly
The clustering results were validated through: (1) internal validation (silhouette width, within-cluster sum of squares), (2) external validation (ANOVA with post hoc Tukey tests, ), and (3) sensitivity analysis testing robustness under different warping windows and imputation methods.
4. Results
The analyzed variable—
BCPCit (total biocapacity per capita for country
i in year
t)—represents a continuous variable measured at discrete, annual intervals. The observed values range from approximately 0.25 gha/cap (Malta, recent years) to over 14 gha/cap (Finland, 1960s–1970s), reflecting substantial geographical, demographic, and economic disparities among the analyzed countries (see as example
Figure 1).
Figure 1 reveals the significant spatial heterogeneity in biocapacity across European countries for the year 2016. The Nordic nations—Finland (12.63 gha/cap), Sweden (9.55 gha/cap), and Norway (7.27 gha/cap)—emerge as clear outliers, exhibiting exceptionally high biocapacity values attributable to their vast forest cover, low population density, and rich natural capital. A distinct latitudinal gradient is evident, with biocapacity generally decreasing from north to south. The Baltic states (Estonia: 9.52 gha/cap, Latvia: 9.52 gha/cap) also demonstrate substantial biocapacity, while Central and Eastern European countries display moderate levels (e.g., Romania: 2.87 gha/cap, Slovakia: 3.00 gha/cap). Conversely, highly urbanized and densely populated countries in Western Europe (e.g., Belgium: 0.79 gha/cap, the Netherlands: 0.82 gha/cap) and Mediterranean island states (Malta: 0.82 gha/cap) record the lowest values. This snapshot underscores the profound influence of biogeographical factors and anthropogenic pressure on the distribution of ecological resources within Europe.
The long-term spatial structure of Europe’s biocapacity, illustrated in
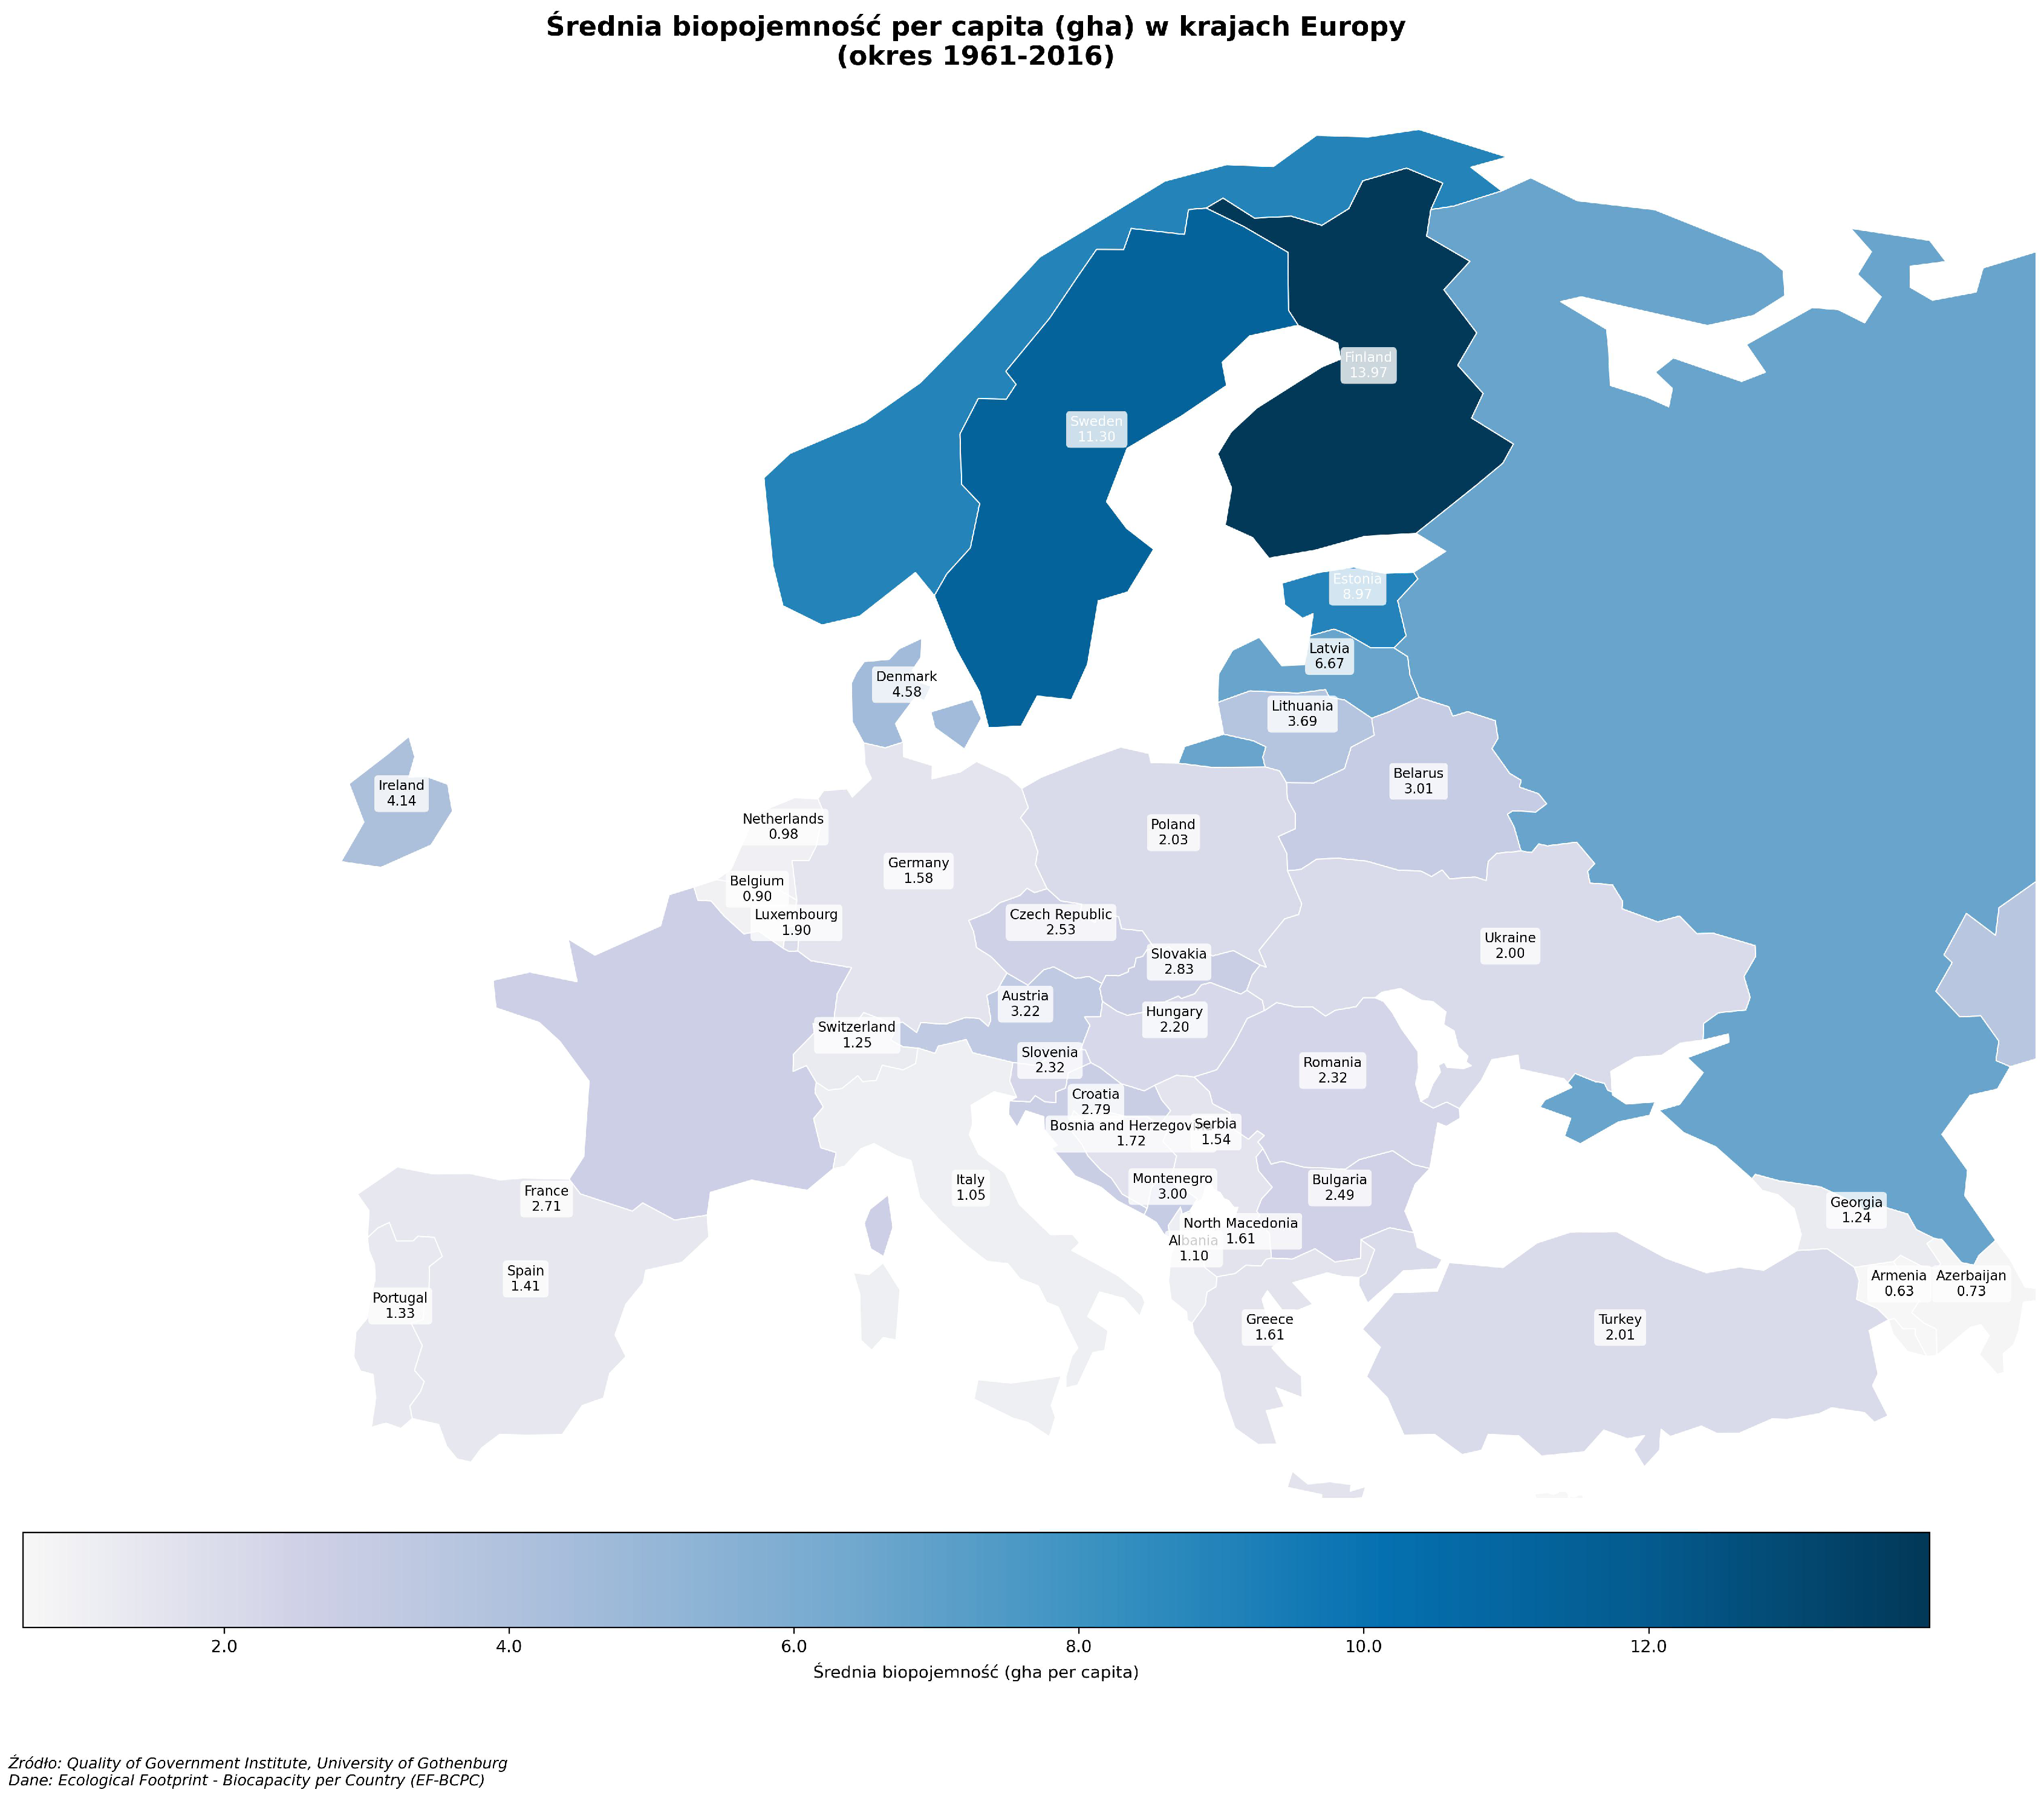
Figure 2, reveals a pronounced and persistent north–south gradient in mean per capita biocapacity over the period 1961–2016. This heterogeneity is a enduring characteristic of the continent’s ecological profile. The Fennoscandian region (Finland: 13.97 gha/cap, Sweden: 11.30 gha/cap, Norway: 8.95 gha/cap) forms a distinct bio-geographical core, characterized by extensive boreal forests, low population density, and a substantial ecological surplus. This core is surrounded by a periphery of moderate biocapacity, which includes the Baltic states (e.g., Estonia: 8.97 gha/cap) and parts of Eastern Europe. The analysis also identifies a central zone with intermediate biocapacity values, comprising nations such as France (2.71 gha/cap) and Germany (1.58 gha/cap), where intensive economic activity coexists with a moderate natural resource base. In contrast, a southern and western periphery—encompassing densely populated countries like the Netherlands (0.98 gha/cap) and the United Kingdom (1.20 gha/cap), alongside Mediterranean islands with limited land area (e.g., Malta: 0.68 gha/cap)—displays the most constrained biocapacity. This structural pattern implies that fundamental factors, including climate-productivity dynamics, historical land-use trajectories, and population distribution, have consistently influenced the continent’s ecological carrying capacity throughout the late 20th and early 21st centuries. A clear understanding of this persistent spatial order is crucial for formulating equitable and effective EU-wide environmental policies, sustainable resource management strategies, and frameworks for ecological accounting.
The missing values demonstrate systematic patterns unevenly distributed across temporal and spatial dimensions:
Small states and territories (e.g., Andorra, Monaco, Liechtenstein, San Marino) show near-complete absence of data
Early periods before established environmental monitoring (pre-1961 for Western Europe, pre-1990s for Eastern Bloc countries)
Countries with limited statistical capacity during specific historical periods
All missing values were maintained as originally documented without any form of imputation or estimation.
The methodological framework was selected explicitly to accommodate the unbalanced panel structure of the dataset. The chosen analytical technique functions effectively with unequal time series and does not require complete cases or a balanced panel, thereby preserving the integrity of the original data while enabling robust statistical inference for the available observations.
The decision to analyze the non-imputed dataset has significant methodological implications. All results are derived from a complete-case analysis and are strictly valid only for the existing observations. Generalizing these findings to countries or time periods with missing data is not statistically justified. The missingness mechanism is presumed to be Missing Not At Random (MNAR), intrinsically linked to historical, political, and economic factors that determined environmental reporting capabilities. This introduces a potential selection bias that must be acknowledged when interpreting the results. This approach prioritizes transparency and data authenticity while accepting a corresponding limitation on the scope of statistical inference.
In summary, this research utilizes original, non-imputed biocapacity data analyzed with methods specifically designed for unbalanced panel structures. This strategy ensures a rigorous examination of the available data while maintaining full transparency regarding the limitations inherent in the original dataset.
The data exhibit high variability, providing substantial analytical leverage. The minimum observed average value is 0.59 global hectares per capita, while the maximum reaches 13.97, yielding a range of 13.38 gha/cap. This extreme disparity highlights profound environmental inequality across Europe. The data’s central tendency, represented by the median value of approximately 2.20 gha/cap, lies considerably below the mean, confirming the distribution’s positive skew. A decile analysis shows the first decile (D1) at 1.17 gha/cap and the ninth decile (D9) at 8.82 gha/cap. This indicates that the top 10 percent of countries possess biocapacity values nearly 7.5 times greater than those of the bottom 10 percent. The interquartile range (IQR), which captures the middle 50 percent of countries, spans from 1.56 to 3.58 gha/cap (
Figure 3).
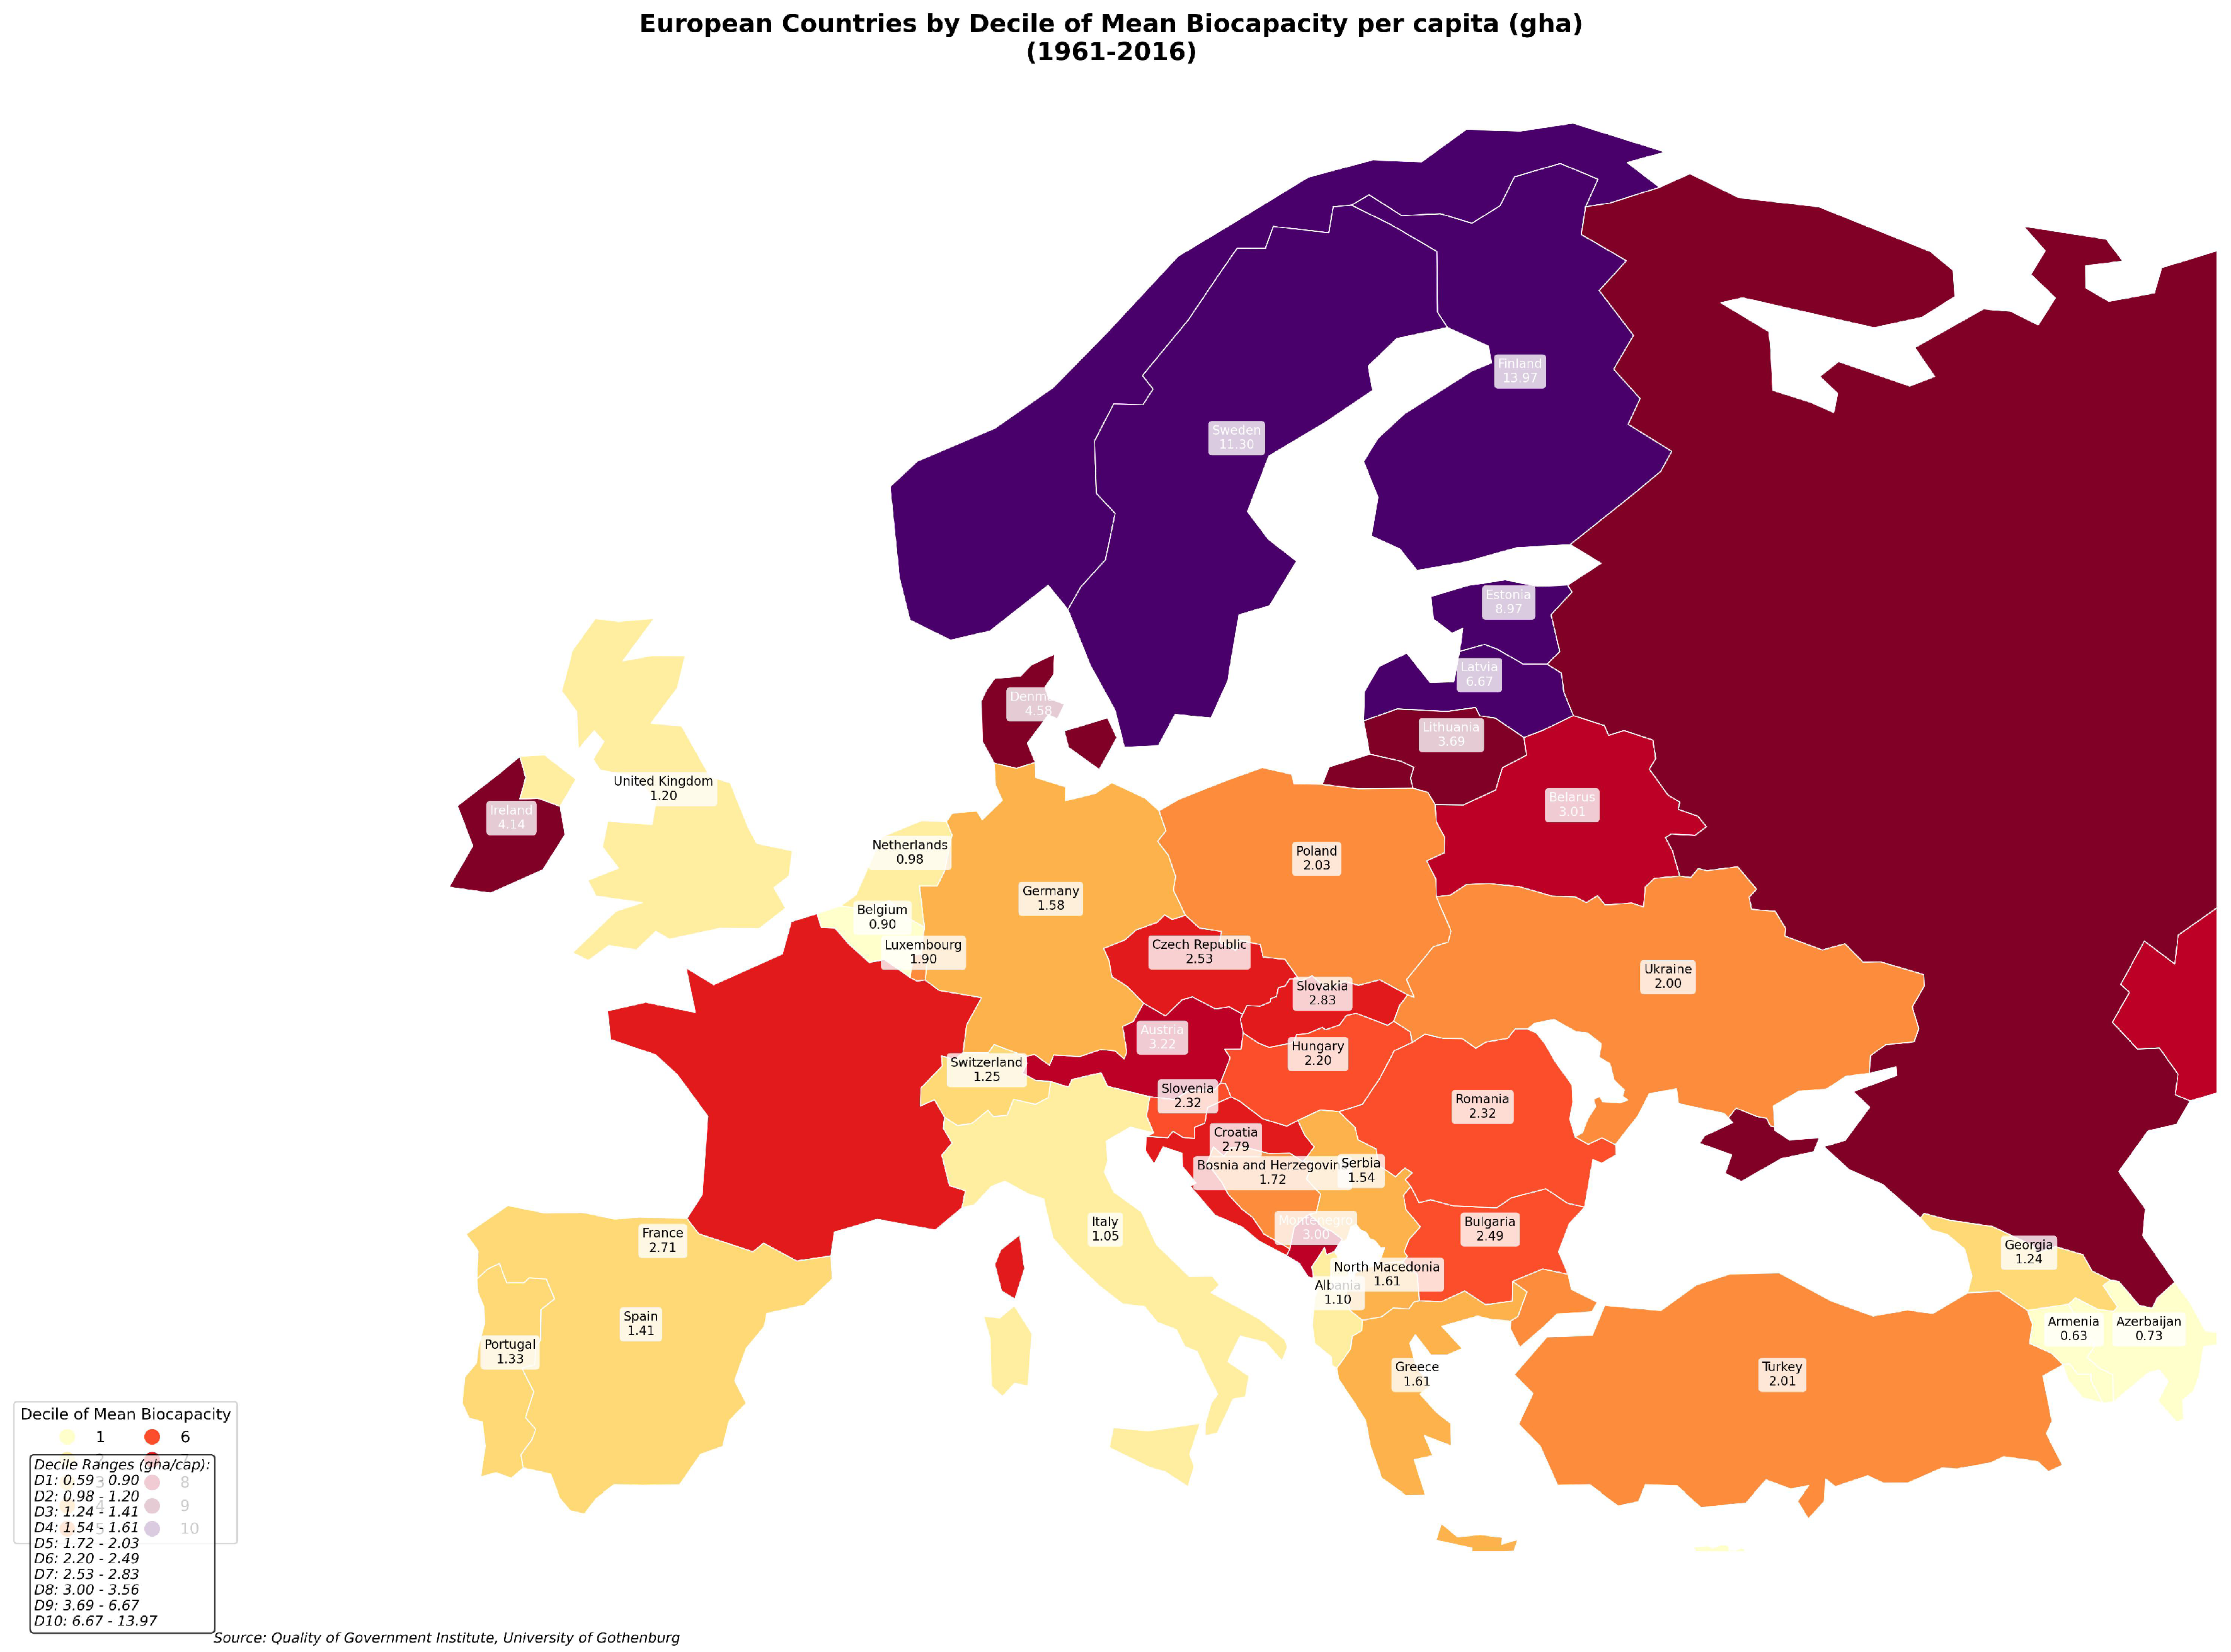
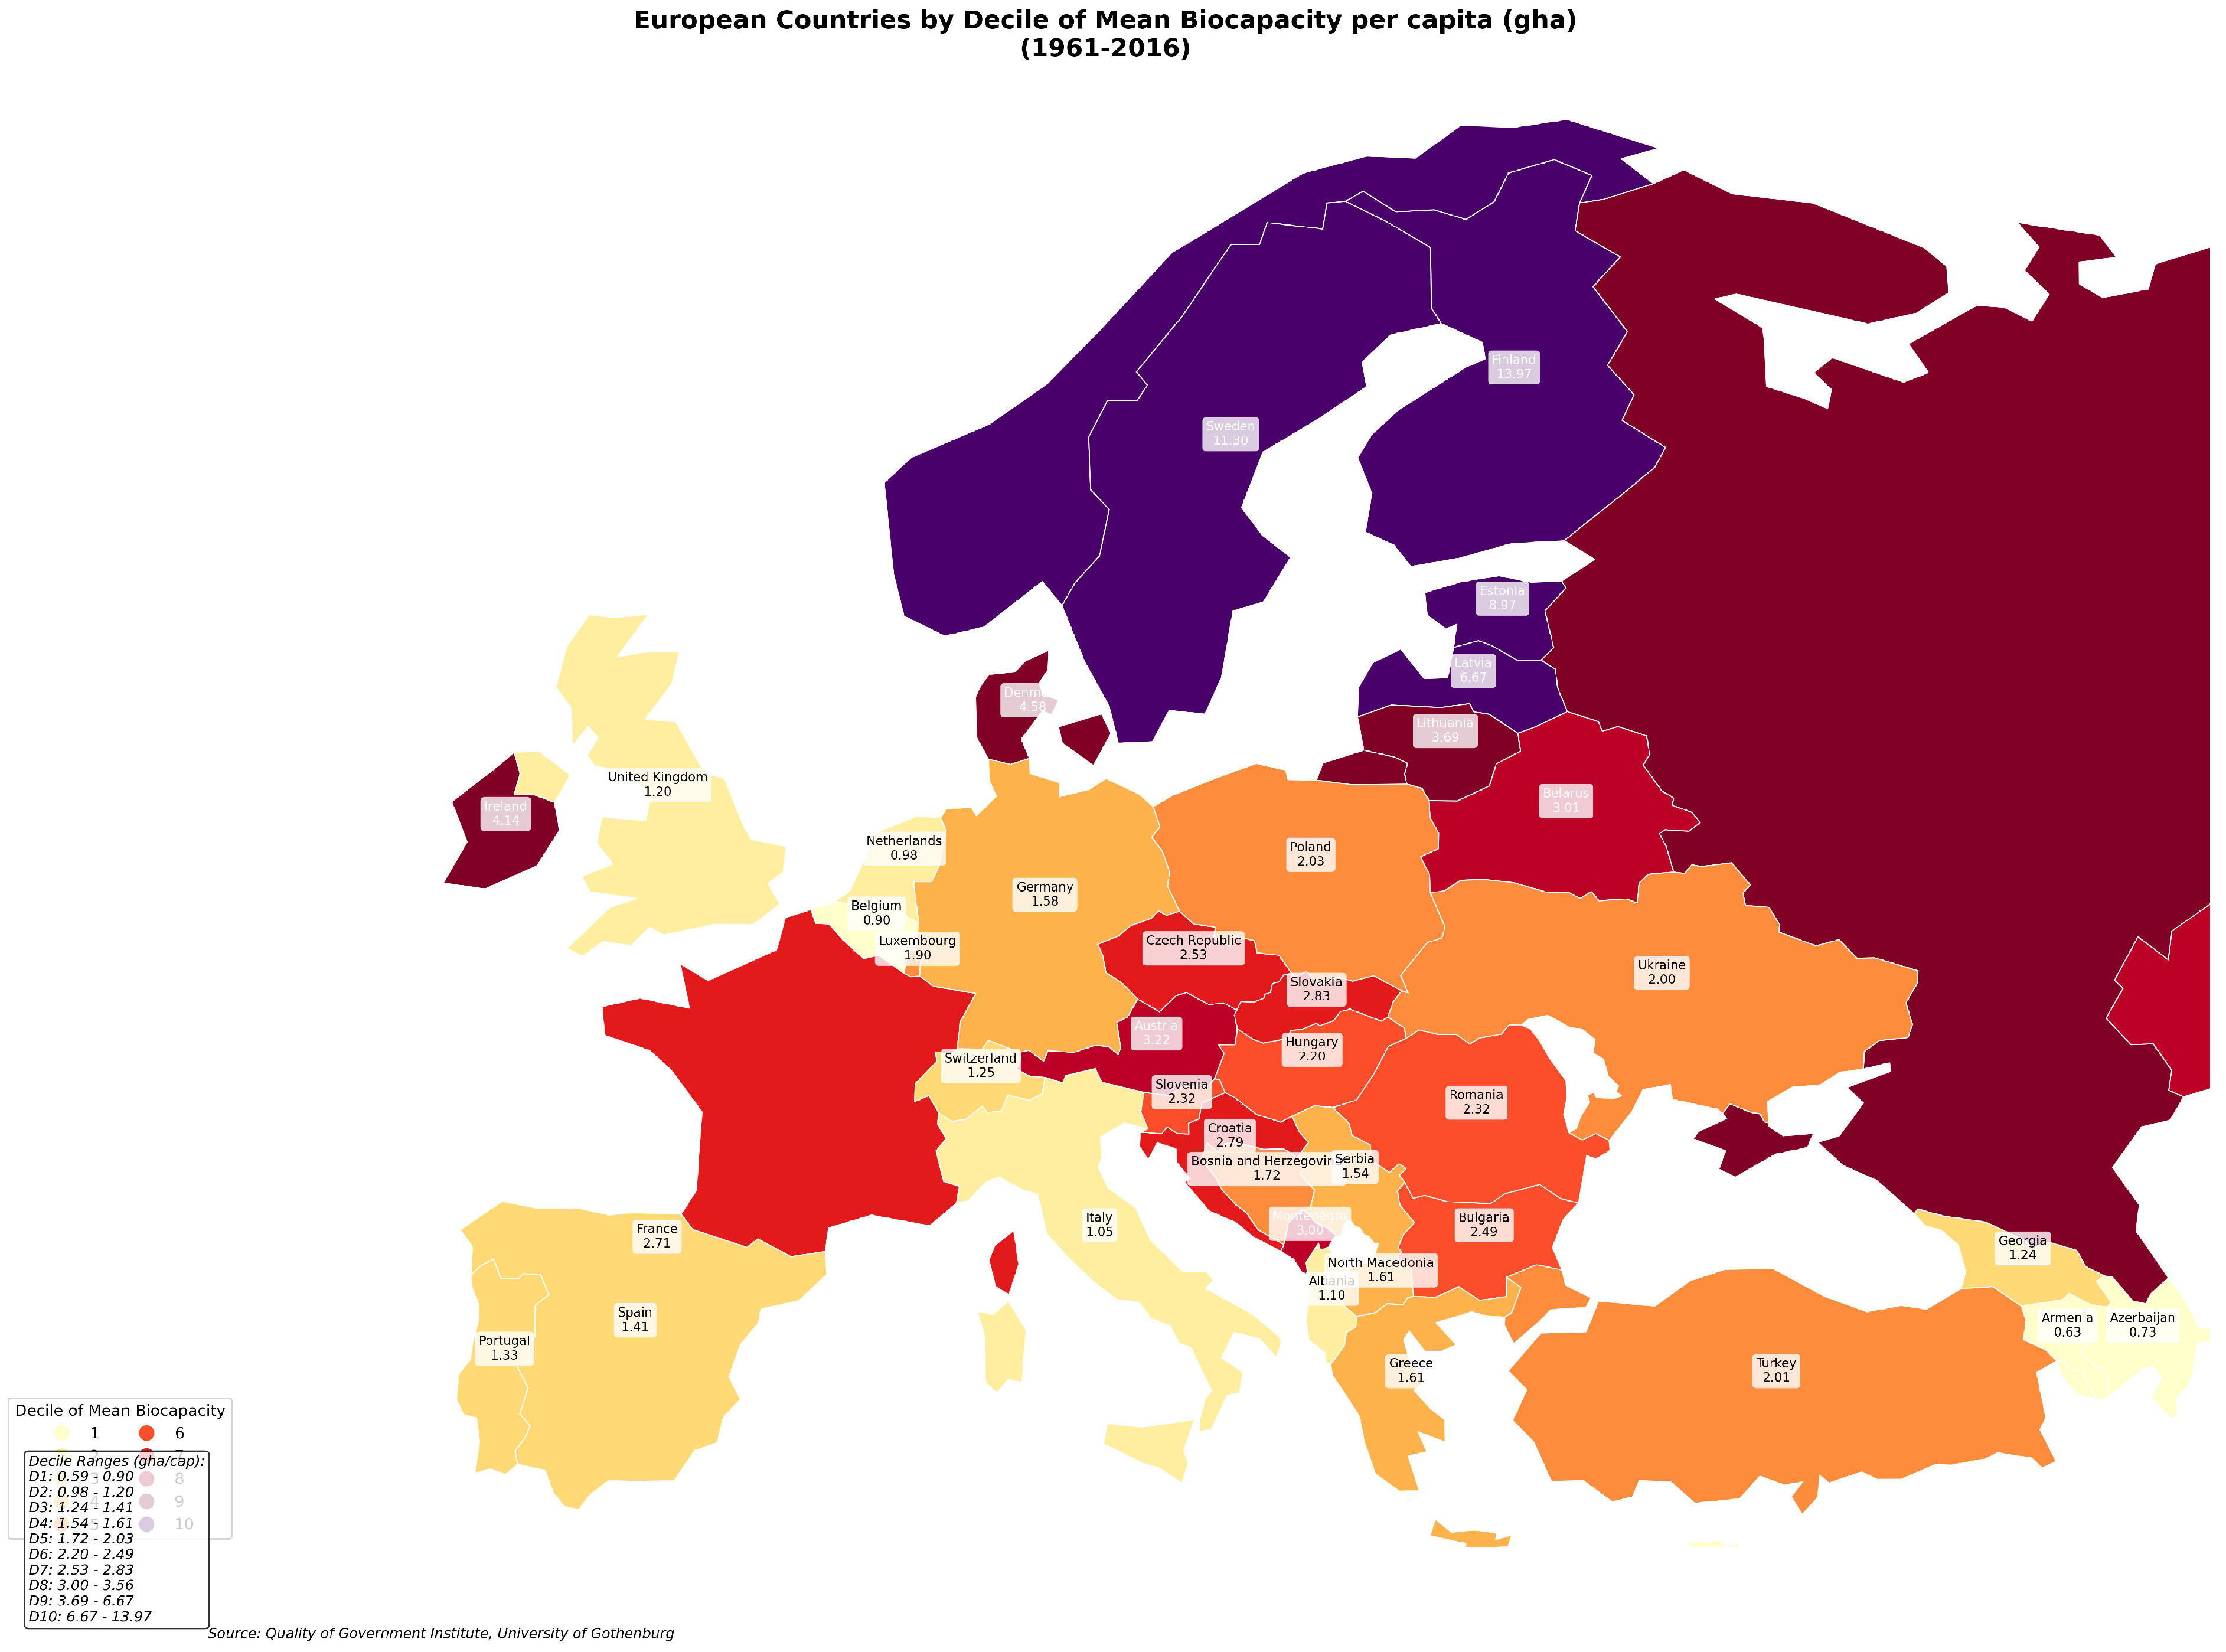
Figure 4 provides a stark visualization of the structural inequalities in biocapacity distribution across Europe, based on deciles of long-term averages (1961–2016). The map reveals a distinct biogeographical pattern, with the highest decile (D10) occupied exclusively by Nordic countries (Finland, Sweden, Norway), characterized by extensive forest cover and low population density. In contrast, the lowest decile (D1) comprises highly urbanized and island nations (The Netherlands, Malta, Cyprus) experiencing significant anthropogenic pressure on limited natural resources.
The decile classification transforms the continuous biocapacity variable into an ordinal scale that emphasizes relative positioning rather than absolute values. This approach highlights the substantial disparity between the top and bottom tenths of the distribution, where D10 values exceed 8.82 gha/cap, compared to D1 values below 1.17 gha/cap—a difference of nearly 7.5-fold. The spatial clustering of deciles suggests that geographical factors (e.g., climate, soil quality, vegetation type) exert a stronger influence on biocapacity than economic or political boundaries.
The visualization notably underscores the intermediate position of Central and Eastern European countries (primarily within D4–D7), which may reflect their transitional economic status and mixed land-use patterns during the study period. Thus, the decile map serves not only as a descriptive tool but also as a foundation for investigating the structural determinants of ecological capacity inequality across the European continent.
4.1. Cluster Analysis Results
The application of the proprietary algorithm, which integrates Dynamic Time Warping with partition-based clustering methods, enabled an effective classification of European countries into groups (clusters) exhibiting similar temporal profiles of the total biocapacity indicator over the analyzed period.
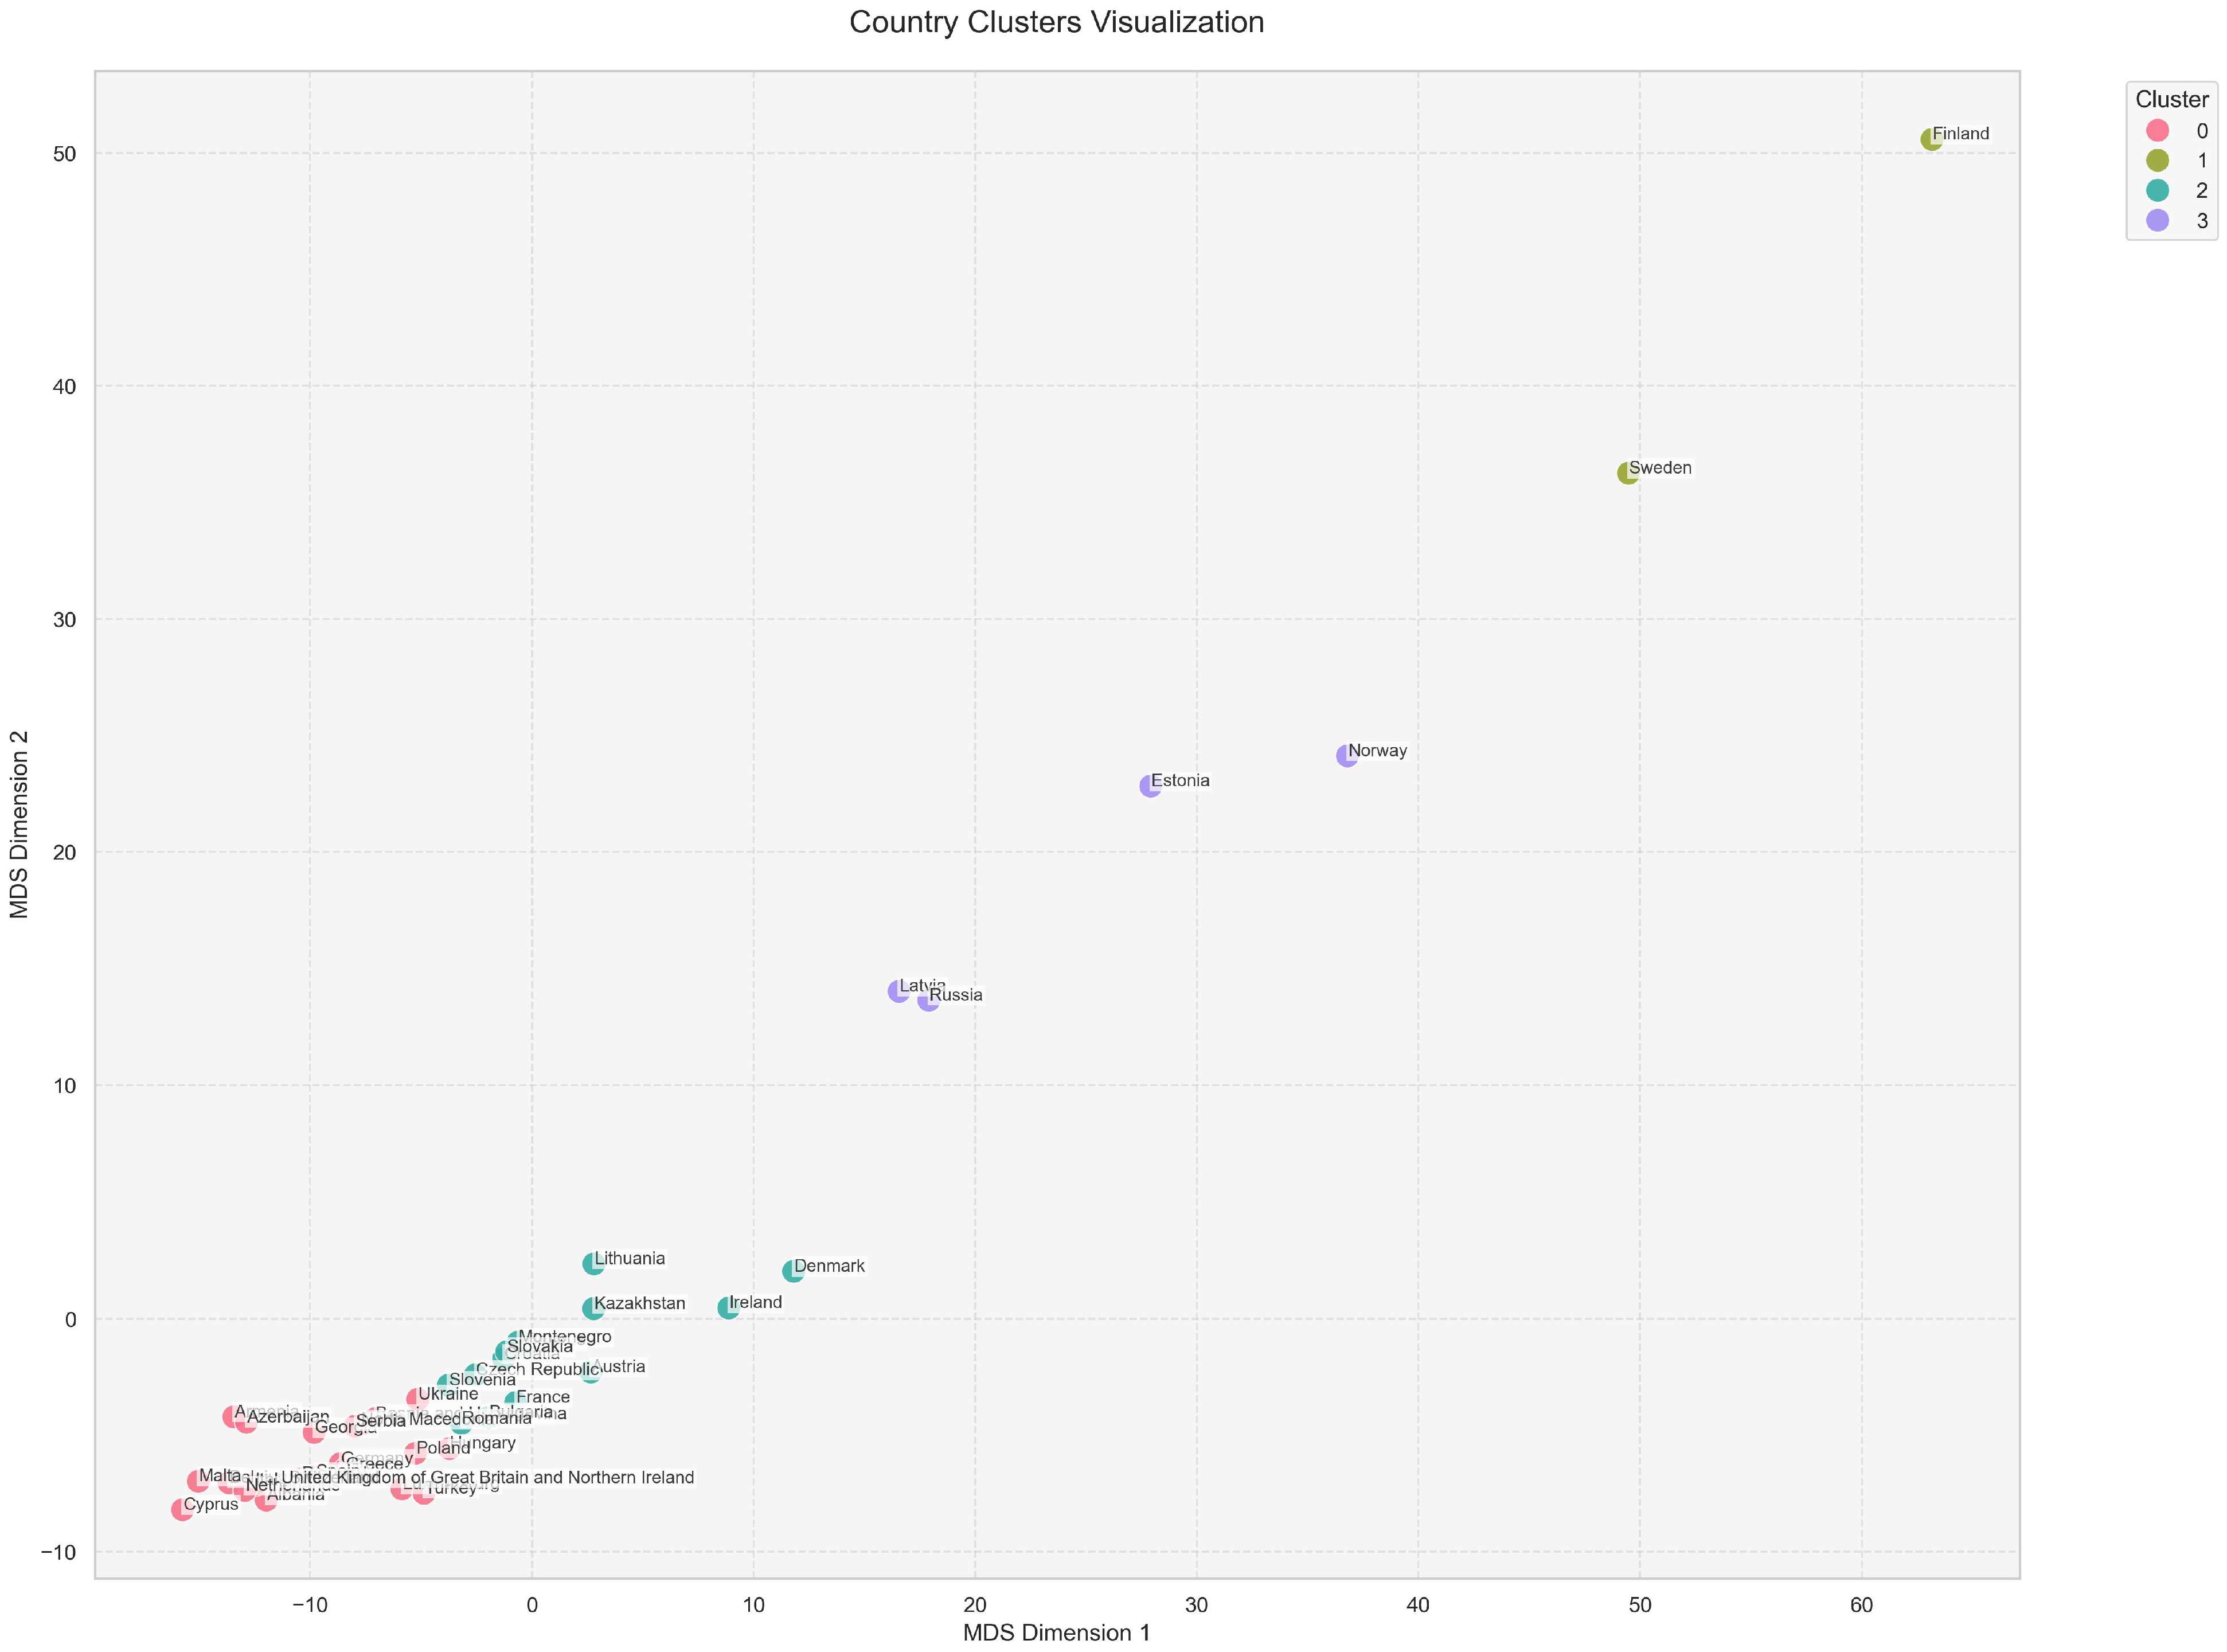
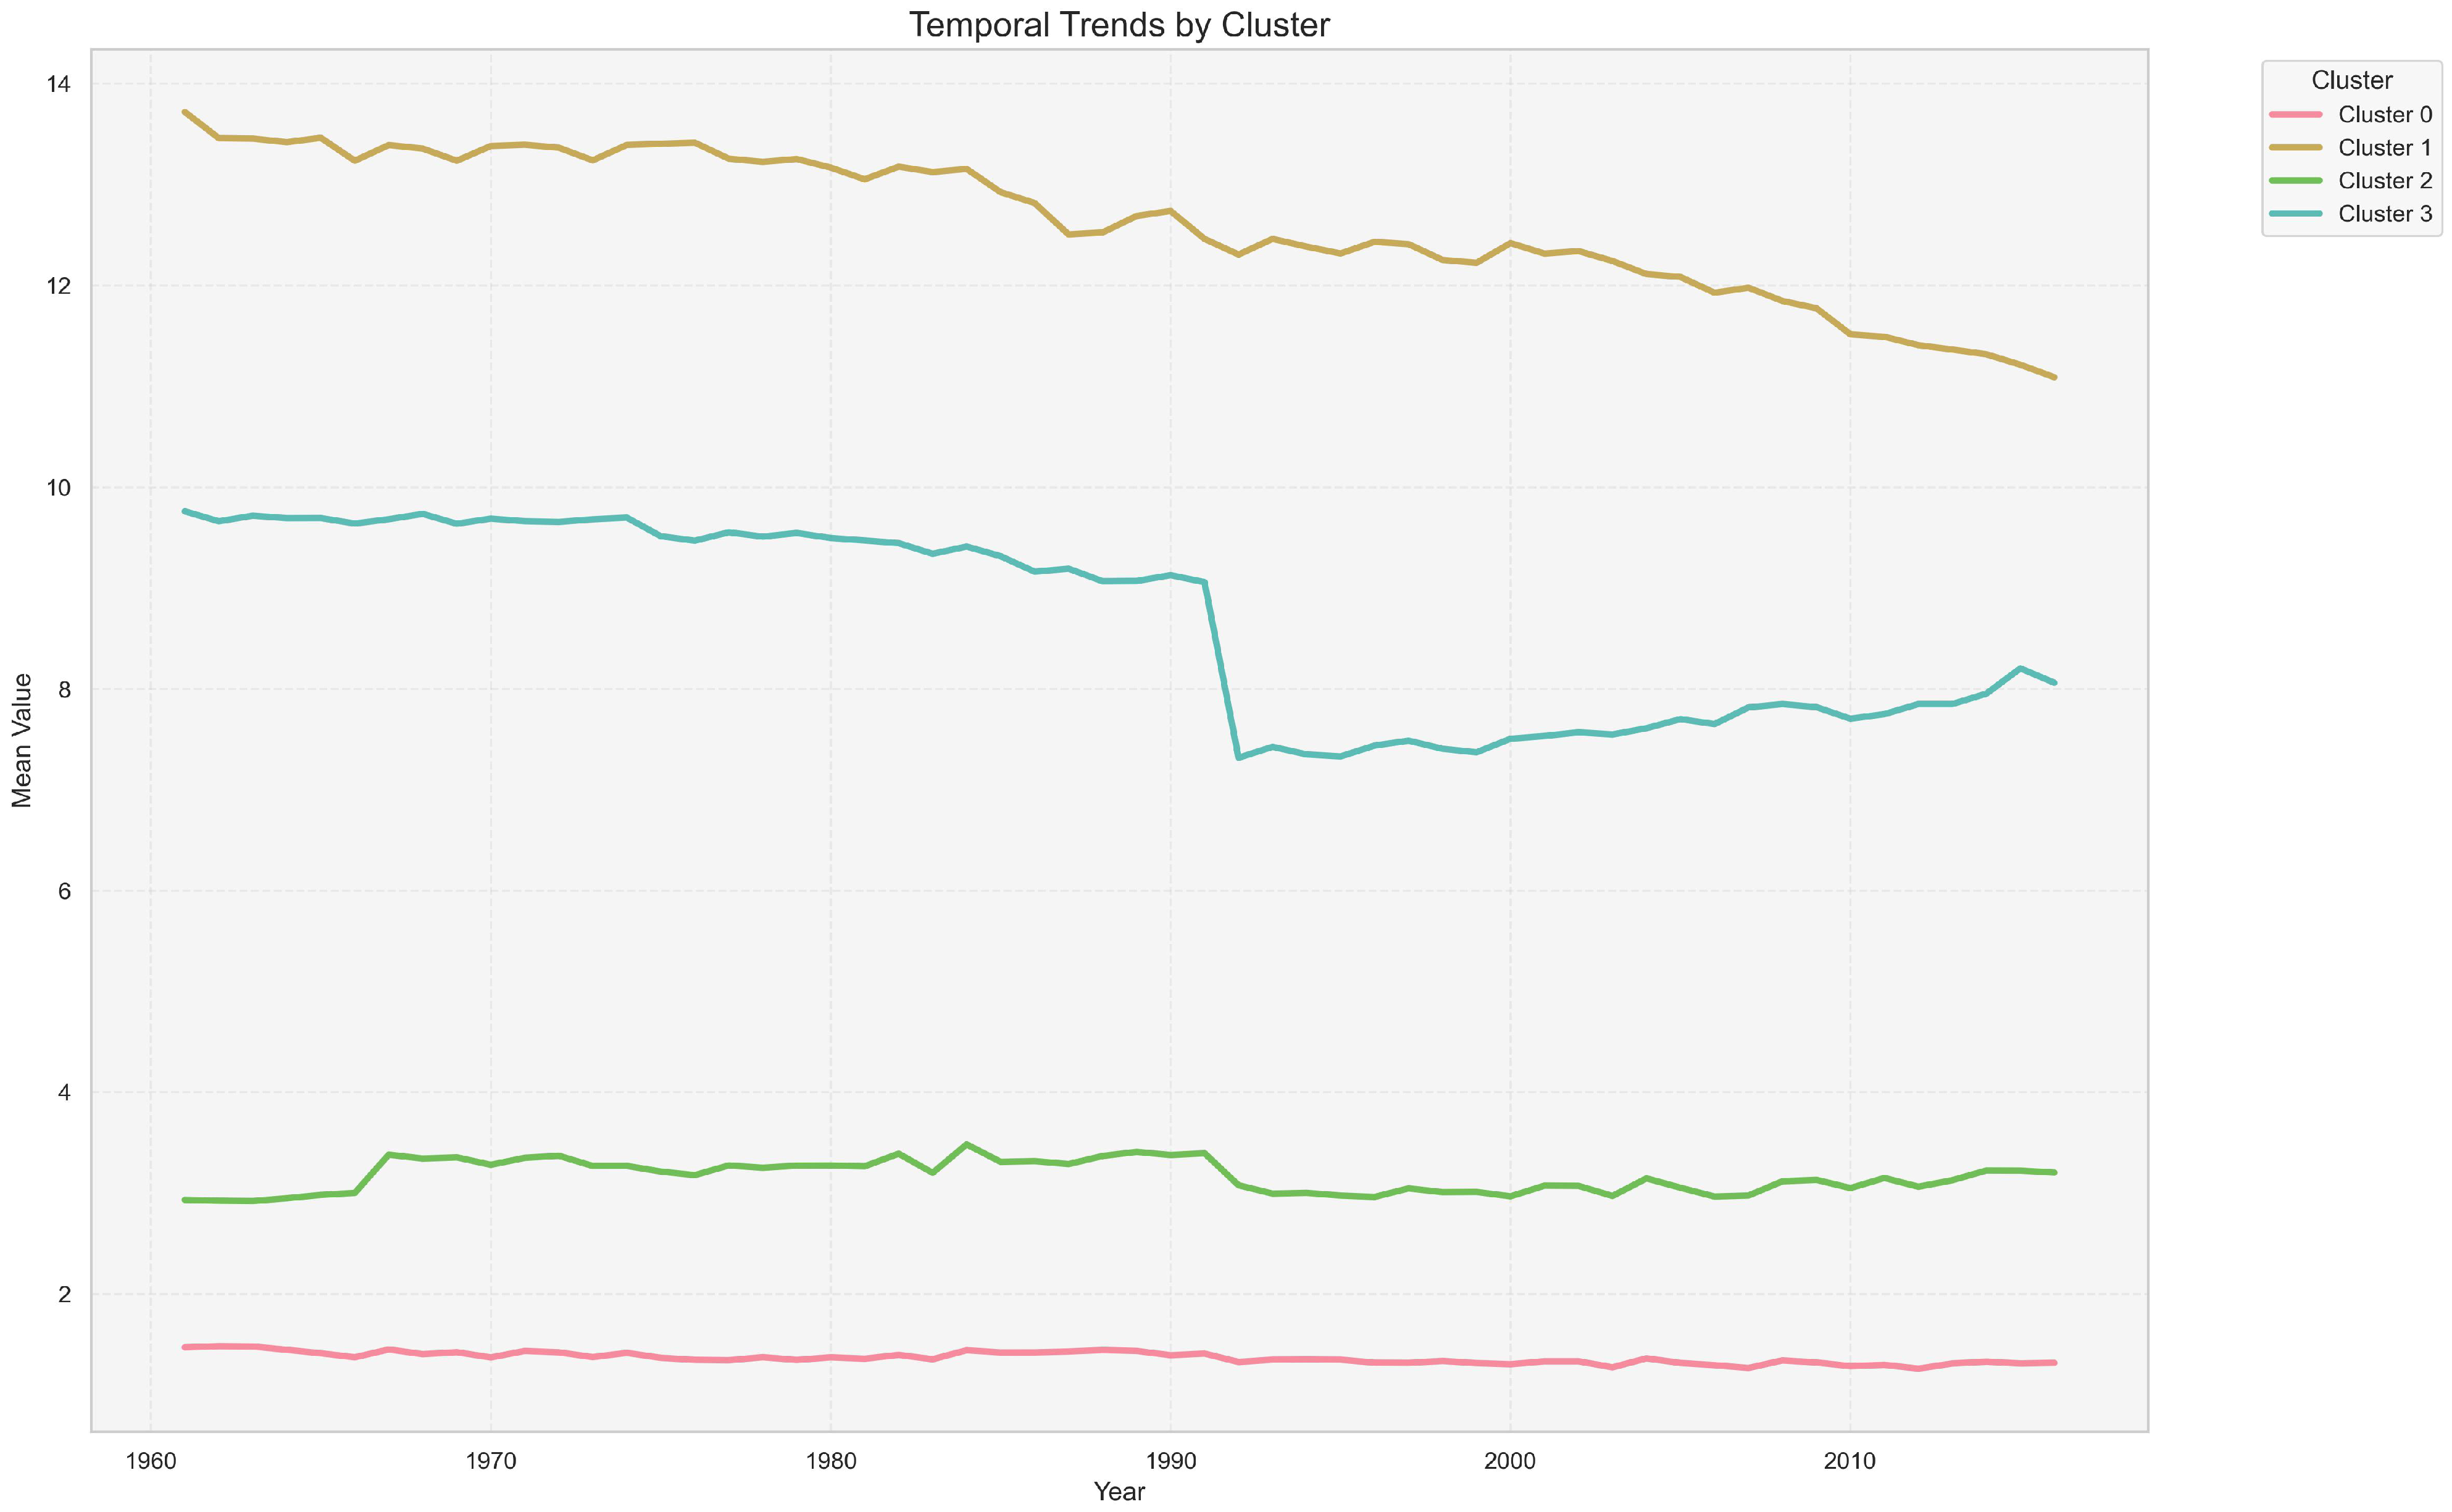
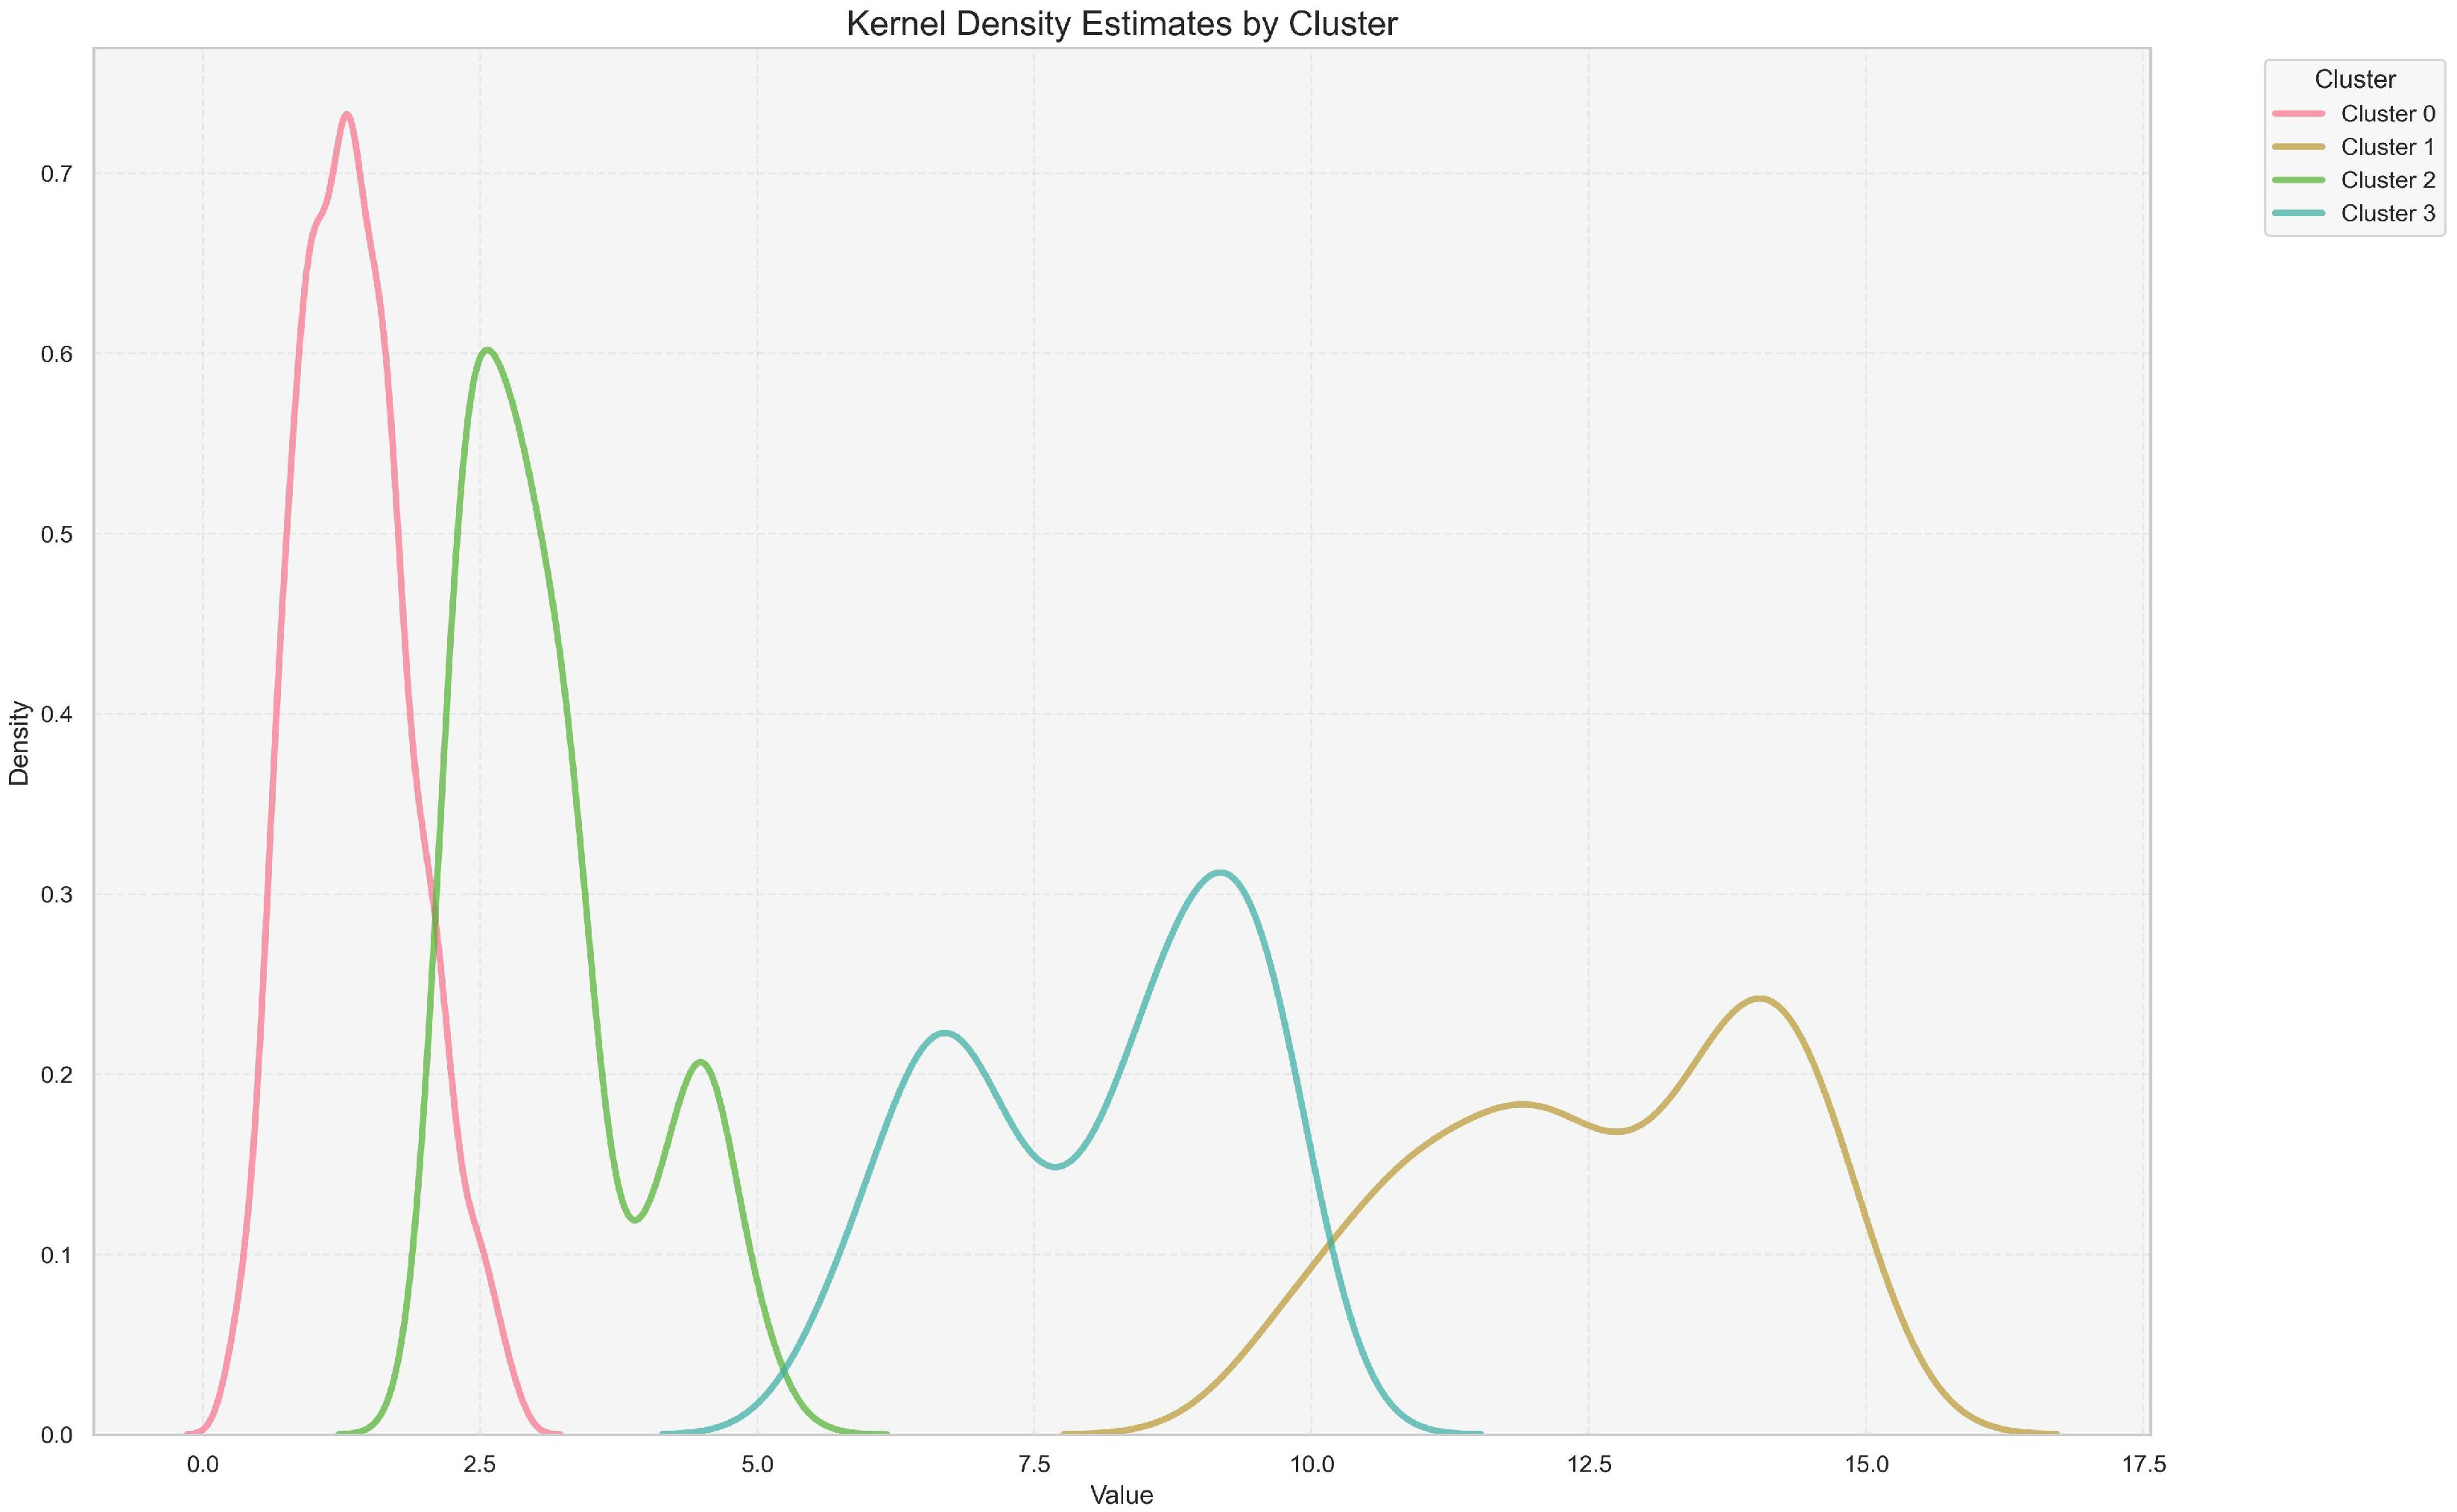
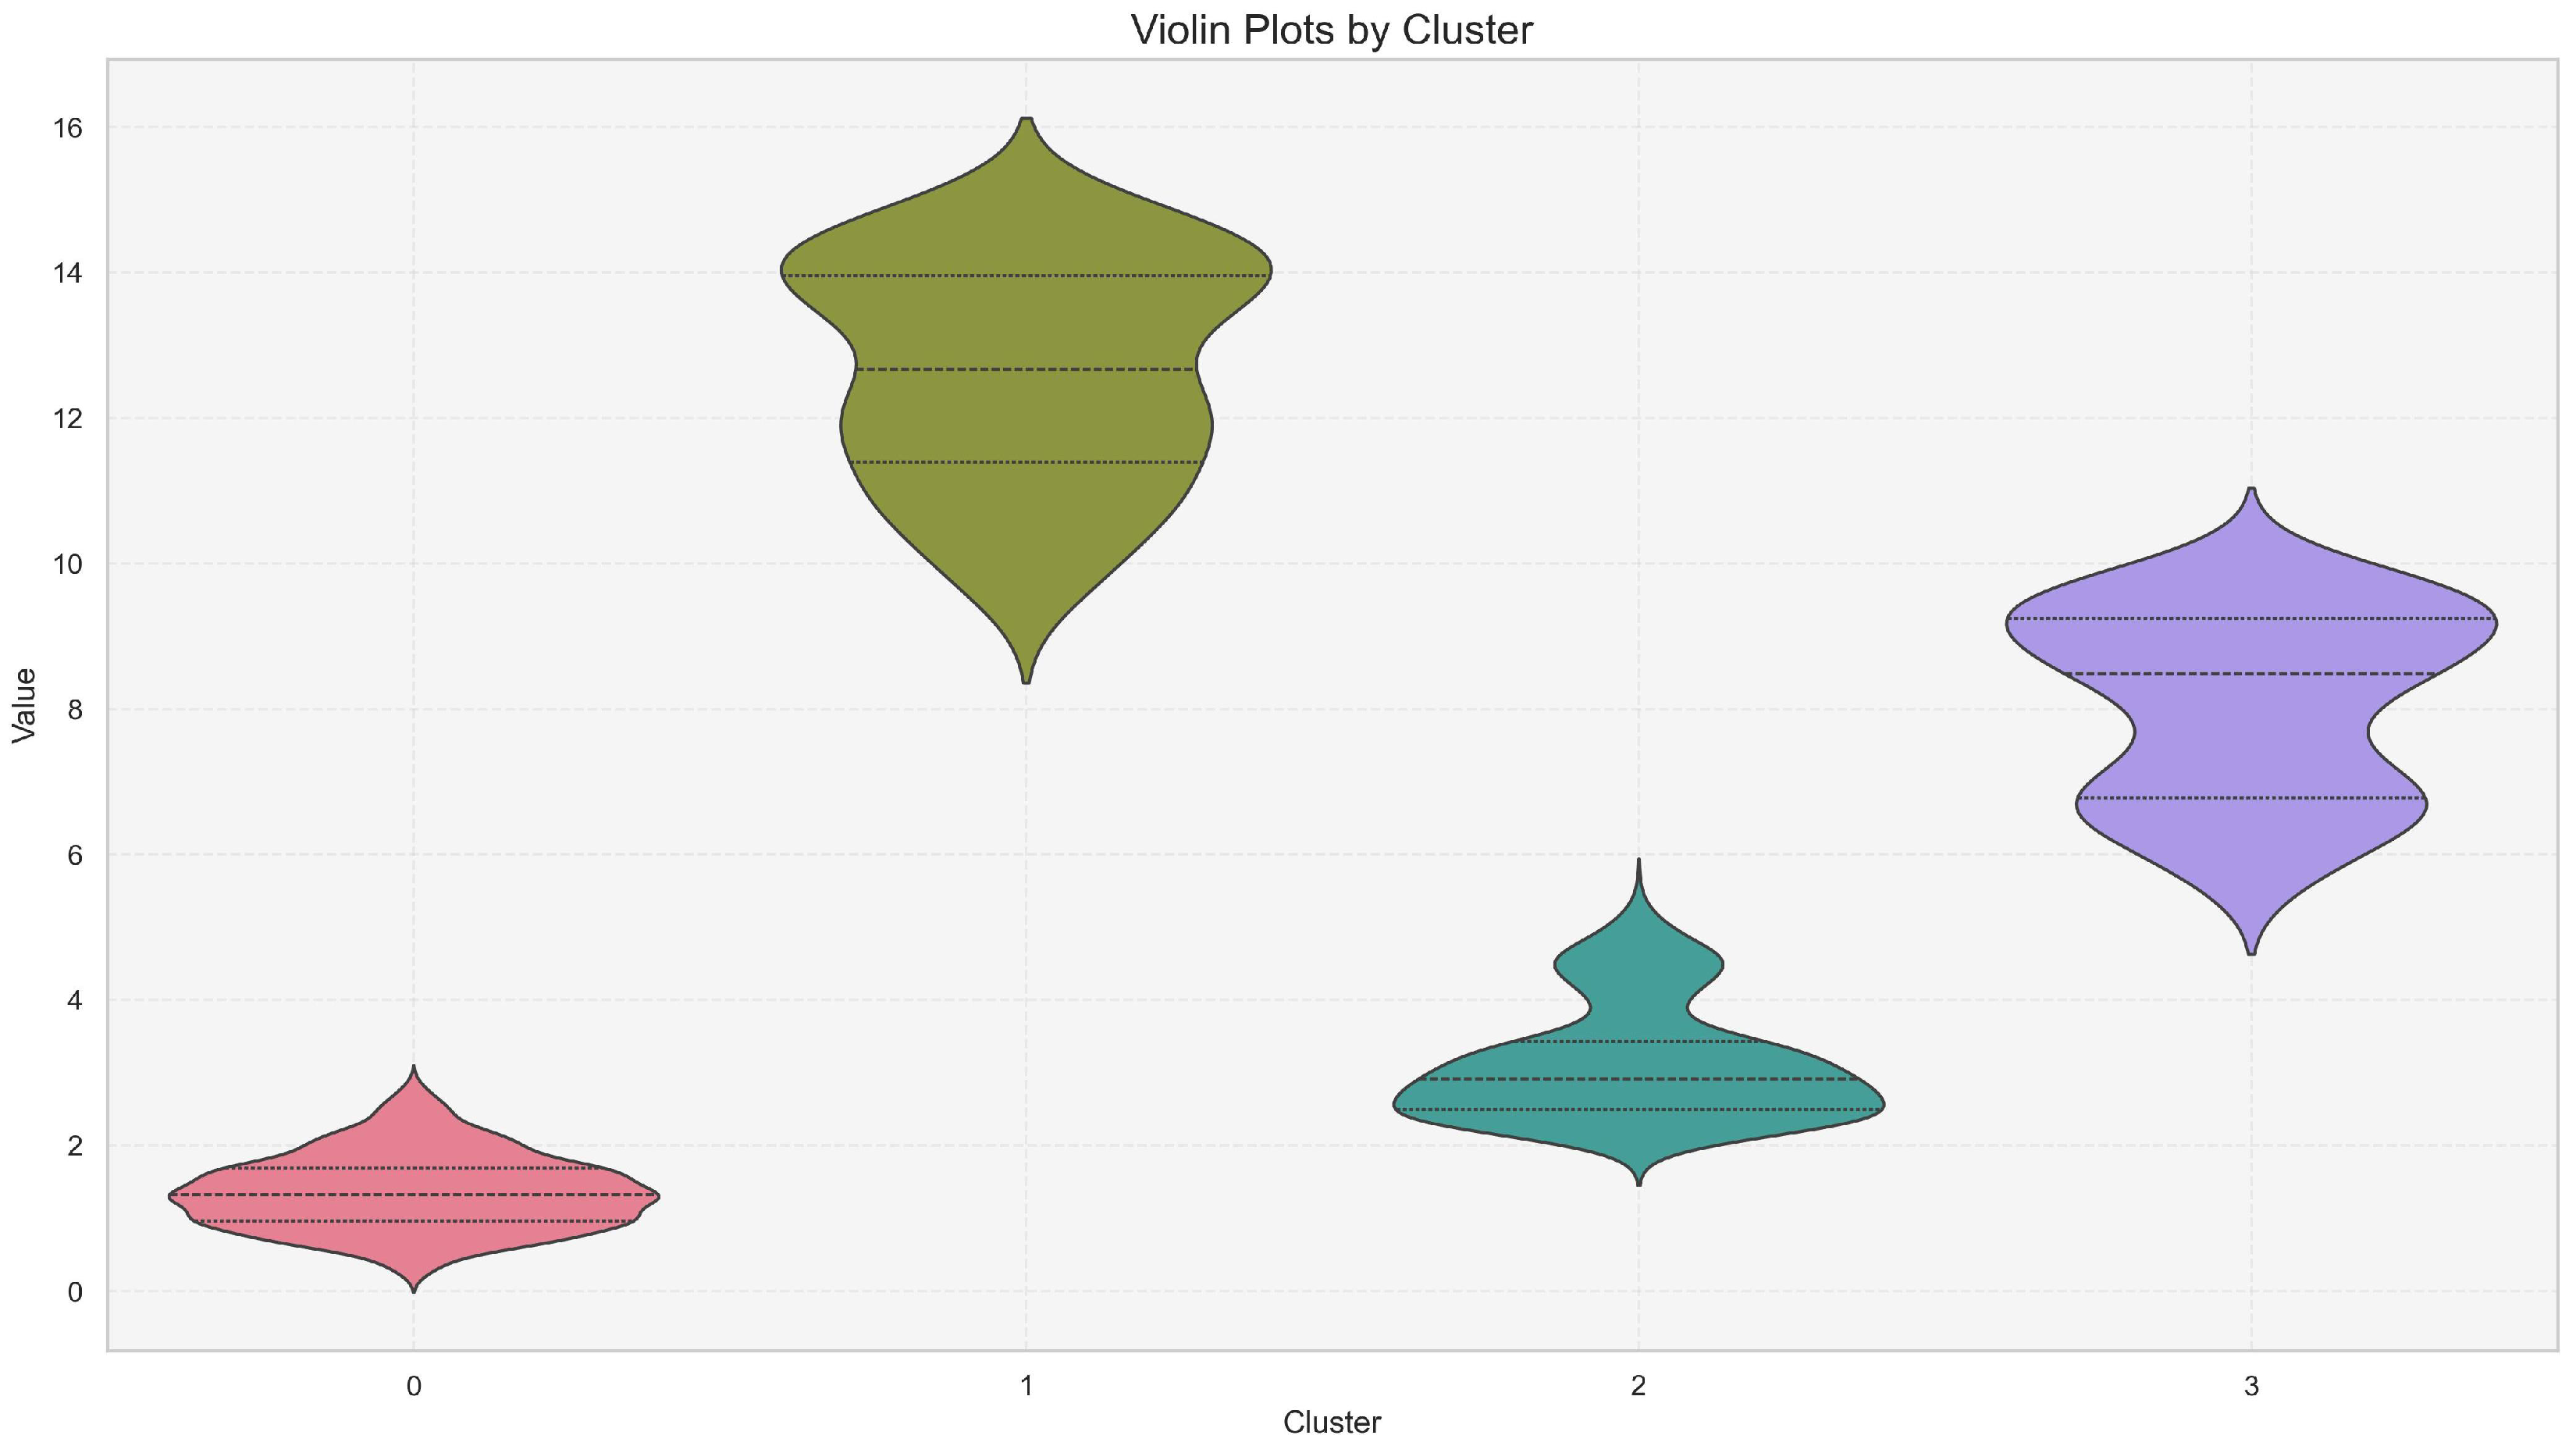
The results of the clustering procedure indicate that European countries can be comprehensively classified into four distinct clusters (
Figure 5), each characterized by unique and statistically significant patterns of biocapacity development. These groups are as follows:
Cluster 0: Albania, Armenia, Azerbaijan, Belgium, Bosnia and Herzegovina, Cyprus, Georgia, Germany, Greece, Hungary, Italy, Luxembourg, Malta, Netherlands, North Macedonia, Poland, Portugal, Serbia, Spain, Switzerland, Turkey, Ukraine, United Kingdom of Great Britain and Northern Ireland.
Cluster 1: Finland, Sweden.
Cluster 2: Austria, Belarus, Bulgaria, Croatia, Czech Republic, Denmark, France, Ireland, Kazakhstan, Lithuania, Montenegro, Romania, Slovakia, Slovenia.
Cluster 3: Estonia, Latvia, Norway, Russia.
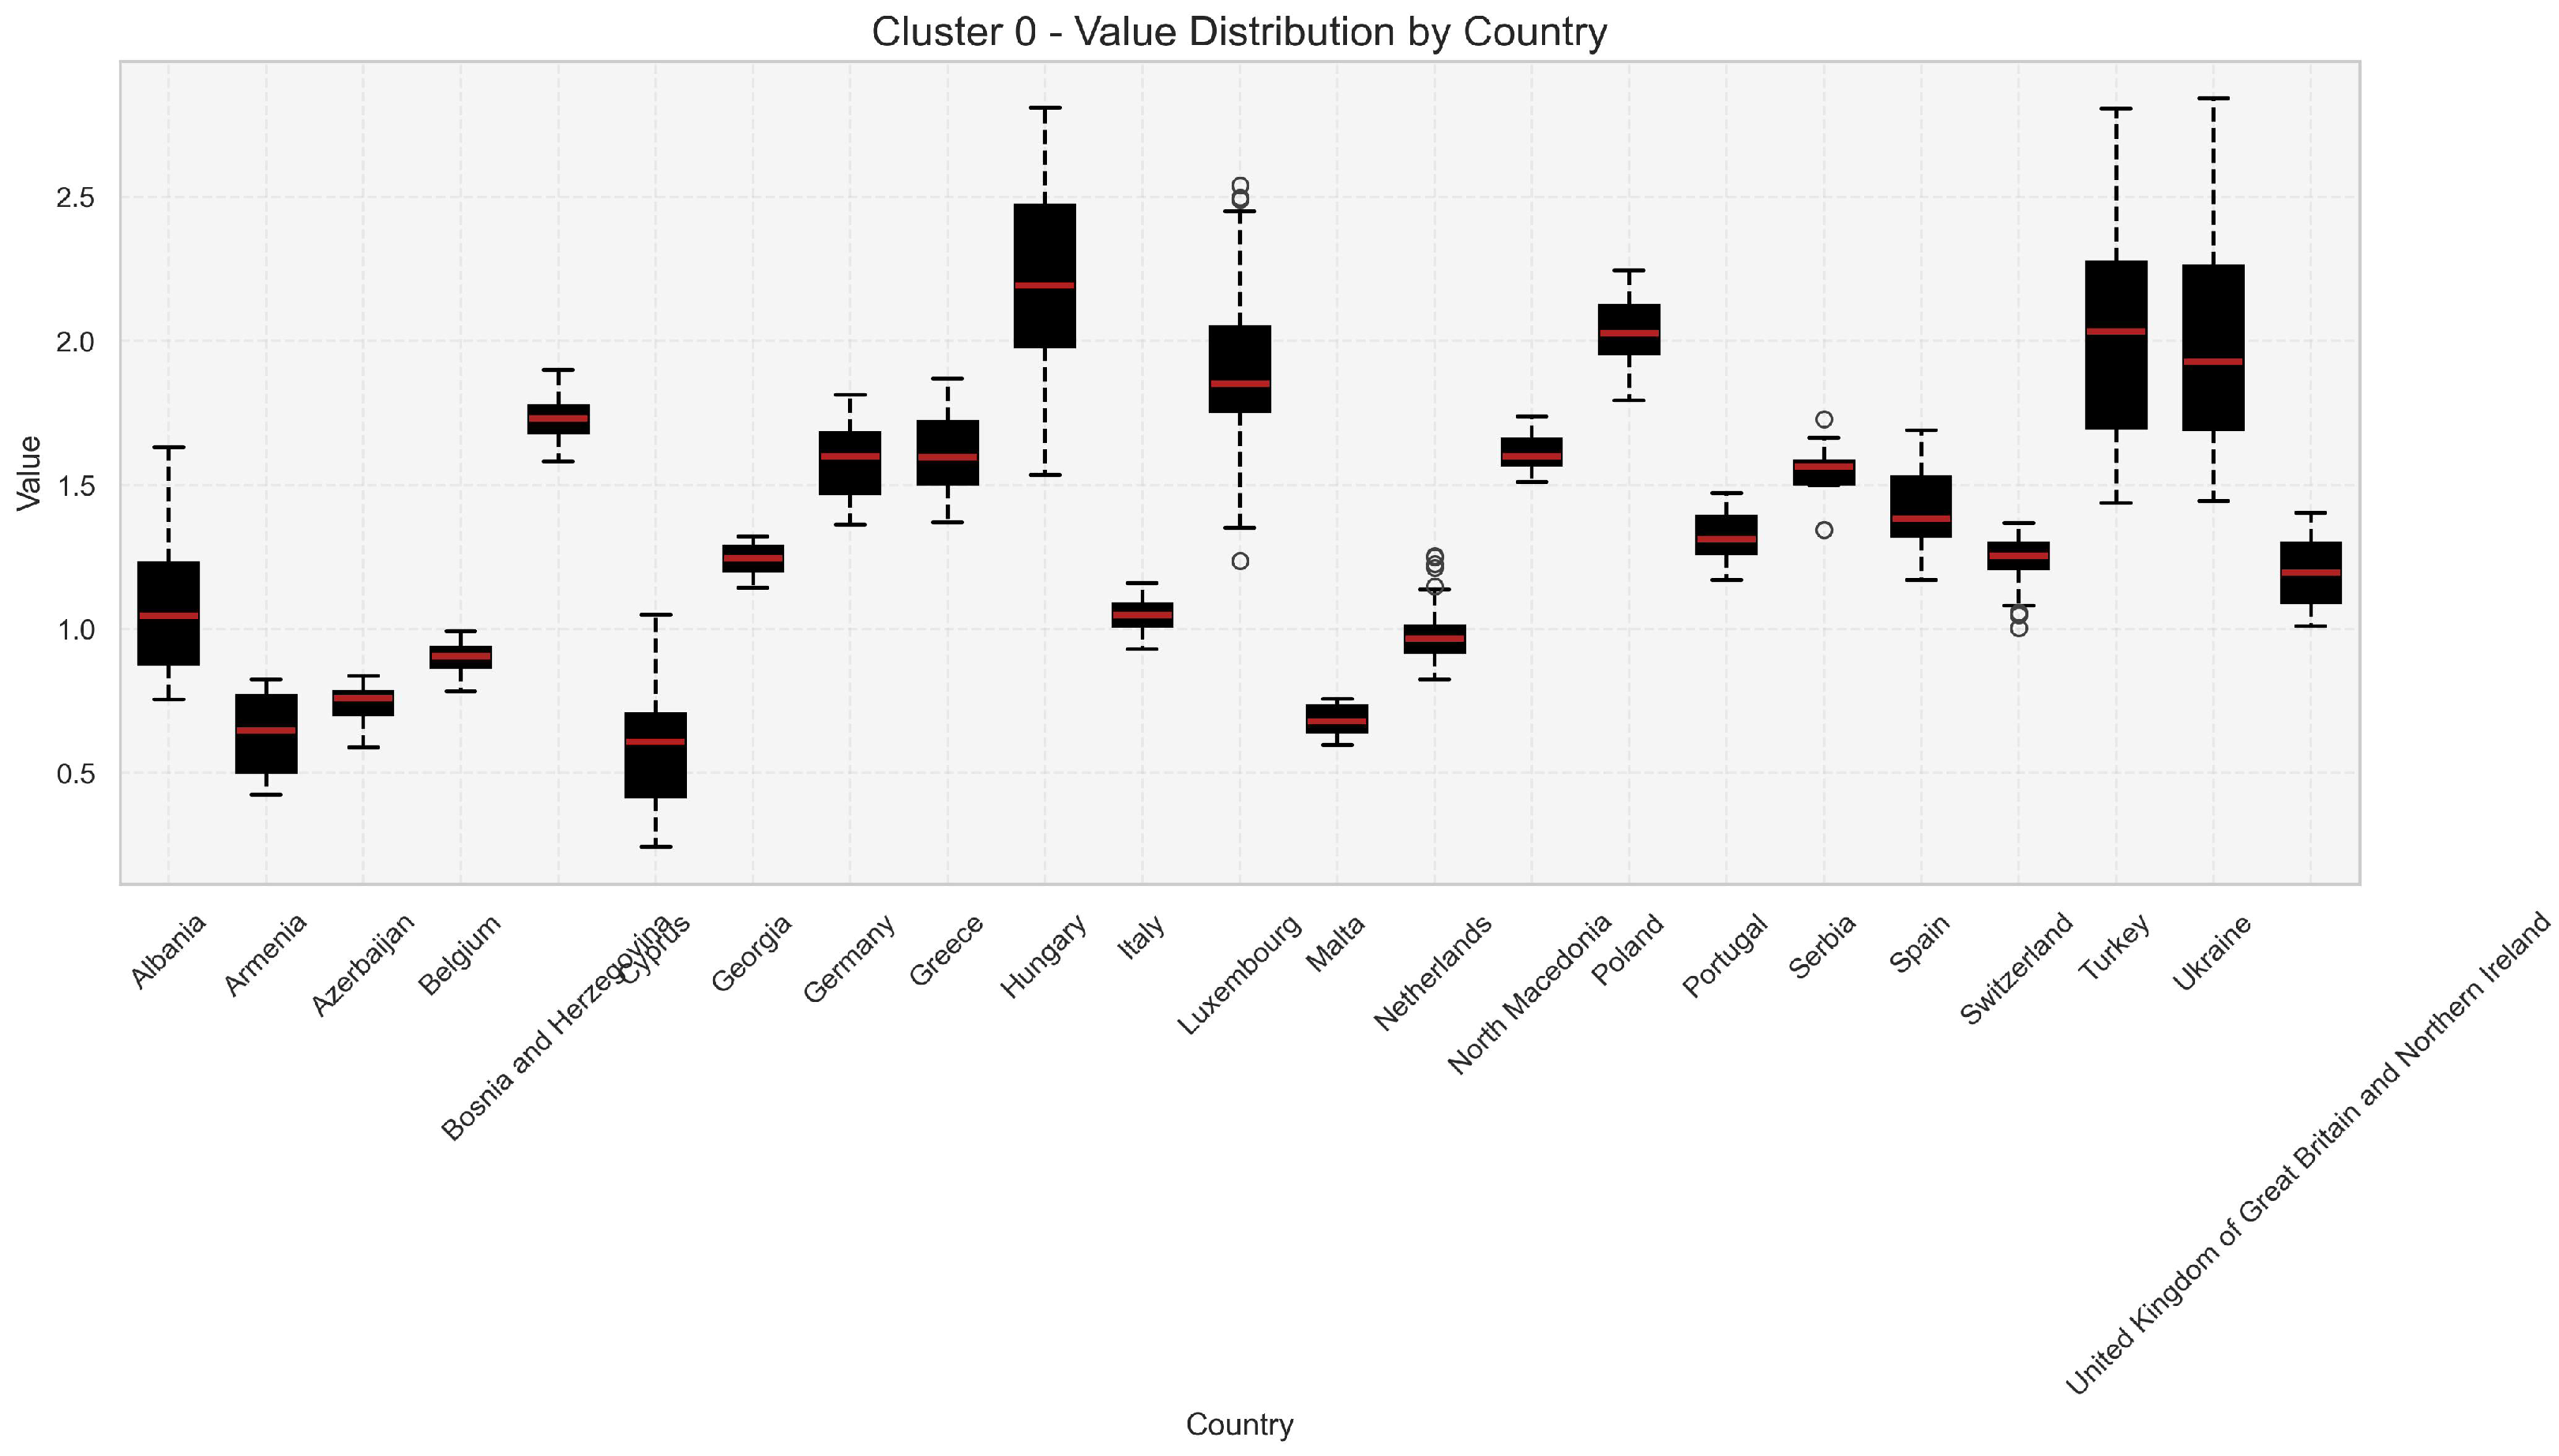
Cluster 0. This is the largest group, encompassing primarily countries from Western, Southern, and Eastern Europe. It is characterized by the lowest median biocapacity. The low and stable level of biocapacity reflects structural environmental constraints, such as high population density and a high degree of urbanization, which exceed the regenerative capacity of local ecosystems. These countries are consistently net importers of ecosystem services (
Figure 6).
Cluster 1. This group, composed exclusively of Sweden and Finland, exhibits an extremely high median and wide dispersion of biocapacity values, significantly exceeding those of the other clusters. This exceptional profile is directly attributed to the vast areas of highly productive forests that dominate the landscape of these countries. The presence of extreme high values (whiskers on the plot) underscores their unique position as major reservoirs of natural capital in Europe (
Figure 7).
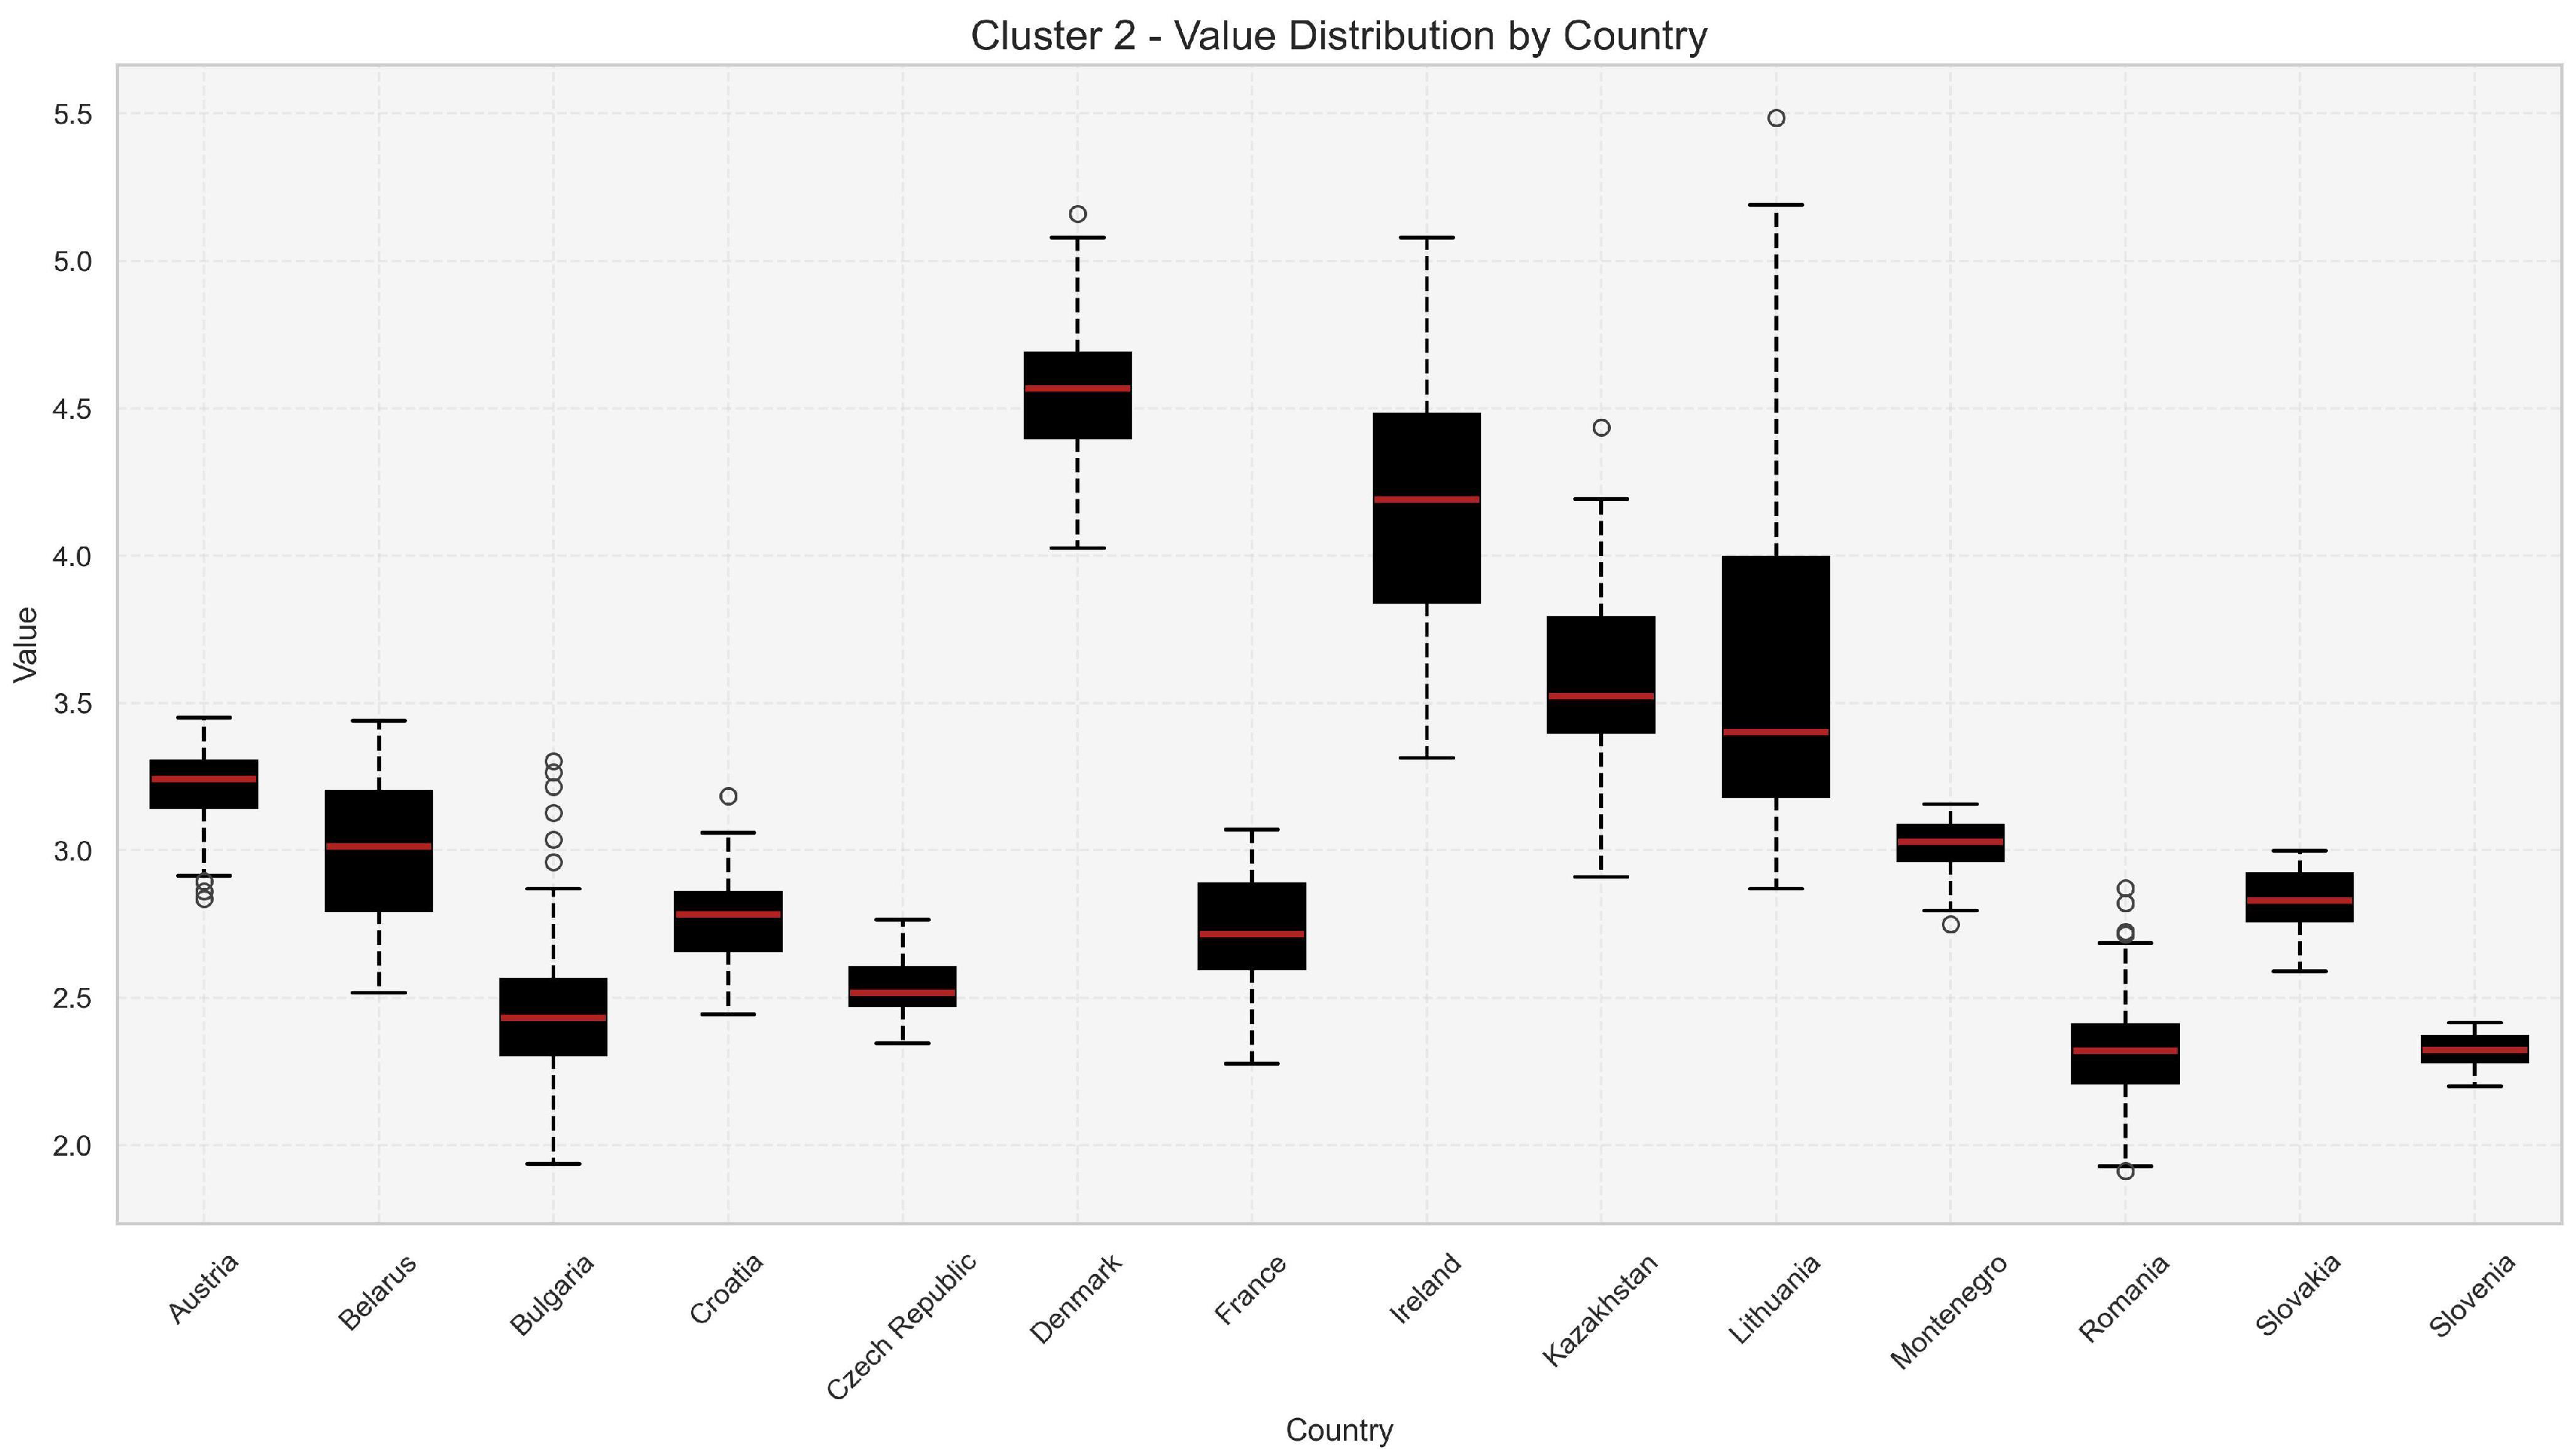
Cluster 2. This cluster, comprising countries from Central and Eastern Europe, exhibits a moderate median biocapacity, yet with a markedly higher dispersion and a clear upward trend over time compared to Cluster 0. The within-group variability and the observed growth trend suggest that political and economic factors, such as systemic transformation, changes in land use following the collapse of collective agriculture, and increased afforestation, are key determinants shaping the biological capacity of these countries (
Figure 8).
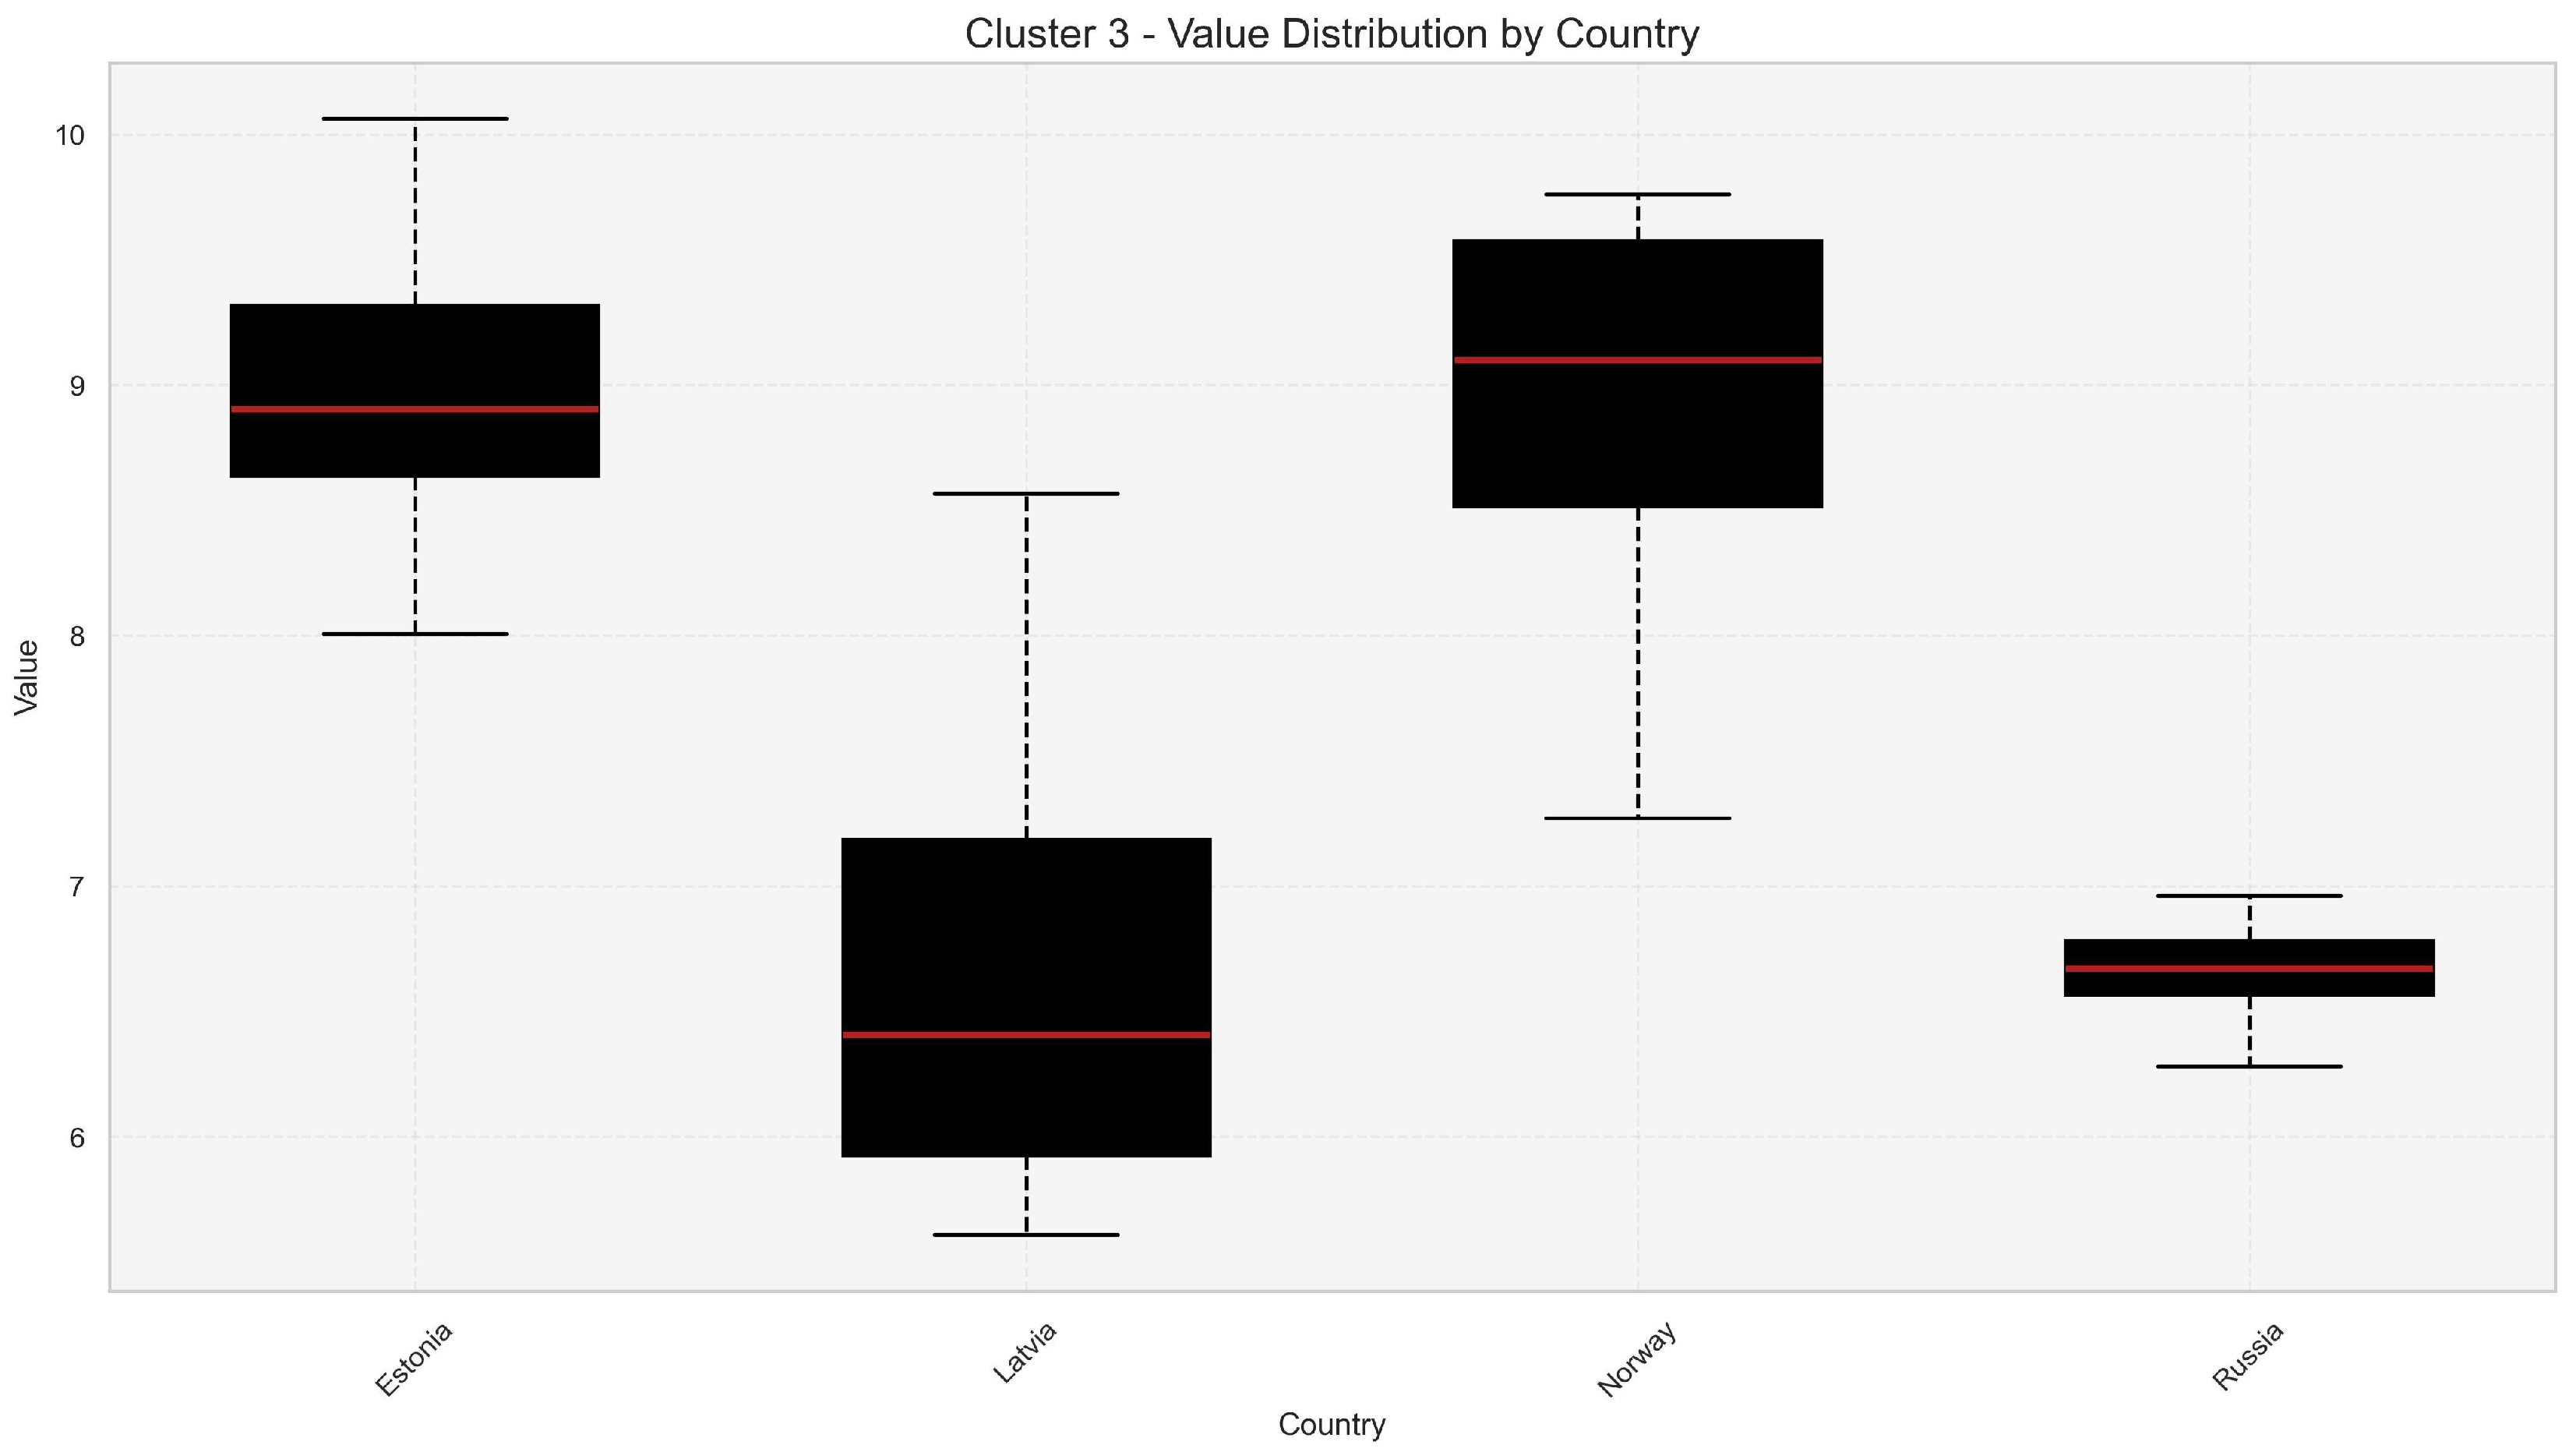
Cluster 3 (High-Variable). The Nordic and Baltic countries (Estonia, Latvia, Norway, Russia) form a group with a high median biocapacity, yet are characterized by the greatest internal variability. The wide interquartile range (height of the box in the plot) indicates significant differences in the structure and management of natural resources among cluster members, despite the shared features of relatively low population density and extensive forest cover (
Figure 9).
4.2. Characteristics of Cluster 0
Cluster 0 consists predominantly of highly developed and transitional economies, representing Europe’s demographic and industrial core. These countries are characterized by high or increasing GDP per capita and intensive consumption patterns. Paradoxically, the advanced economic development in nations such as Germany, the United Kingdom, Italy, and the Netherlands correlates strongly with limited national biocapacity, indicating a pronounced decoupling between economic growth and the availability of domestic renewable resources. These countries mitigate this deficit through extensive international trade, importing resources and externalizing a significant portion of their ecological footprint beyond national borders.
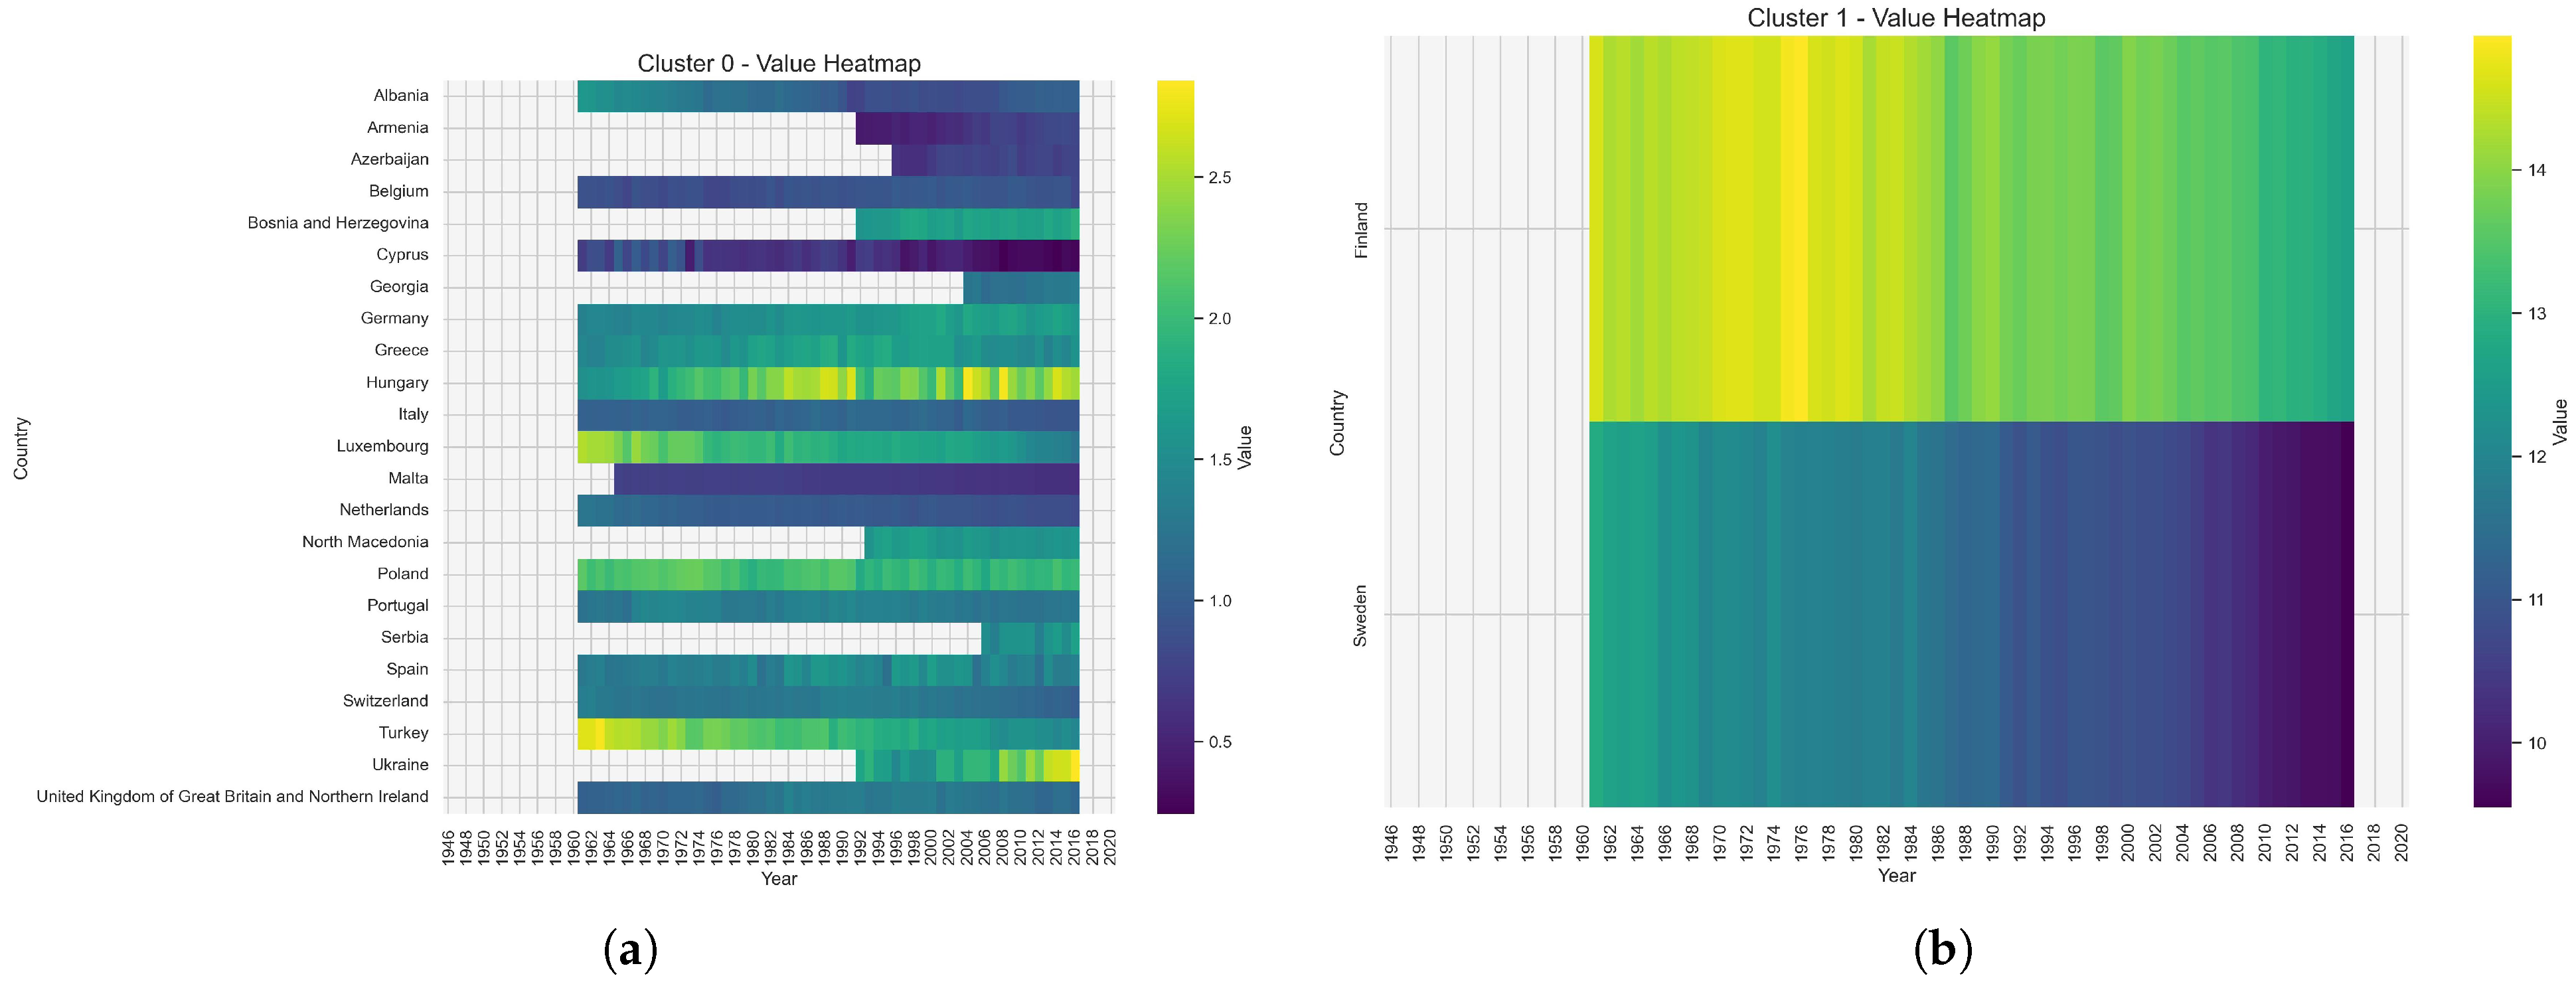
Cluster 0 exhibits the lowest median total biocapacity values among all identified groups, typically ranging between 1.0 and 3.0 global hectares per capita (
Figure 10).
The low biocapacity of countries belonging to Cluster 0 is driven by a combination of physical and anthropogenic factors. First, high population density and urbanization play a central role. A significant portion of land in Cluster 0 countries is occupied by urban, industrial, and transportation infrastructure, which exhibits zero or negligible biological productivity. Second, these countries possess a limited base of productive land. They often have relatively small areas of high-quality agricultural land and/or highly productive forests per capita. This applies both to highly urbanized Western states and to mountainous countries in the Balkans (
Figure 11).
Nations in Cluster 0 exhibit significant vulnerability to global disruptions affecting food security, water availability, and access to biological resources. Their socio-economic stability is consequently dependent on the uninterrupted operation of global supply chains.
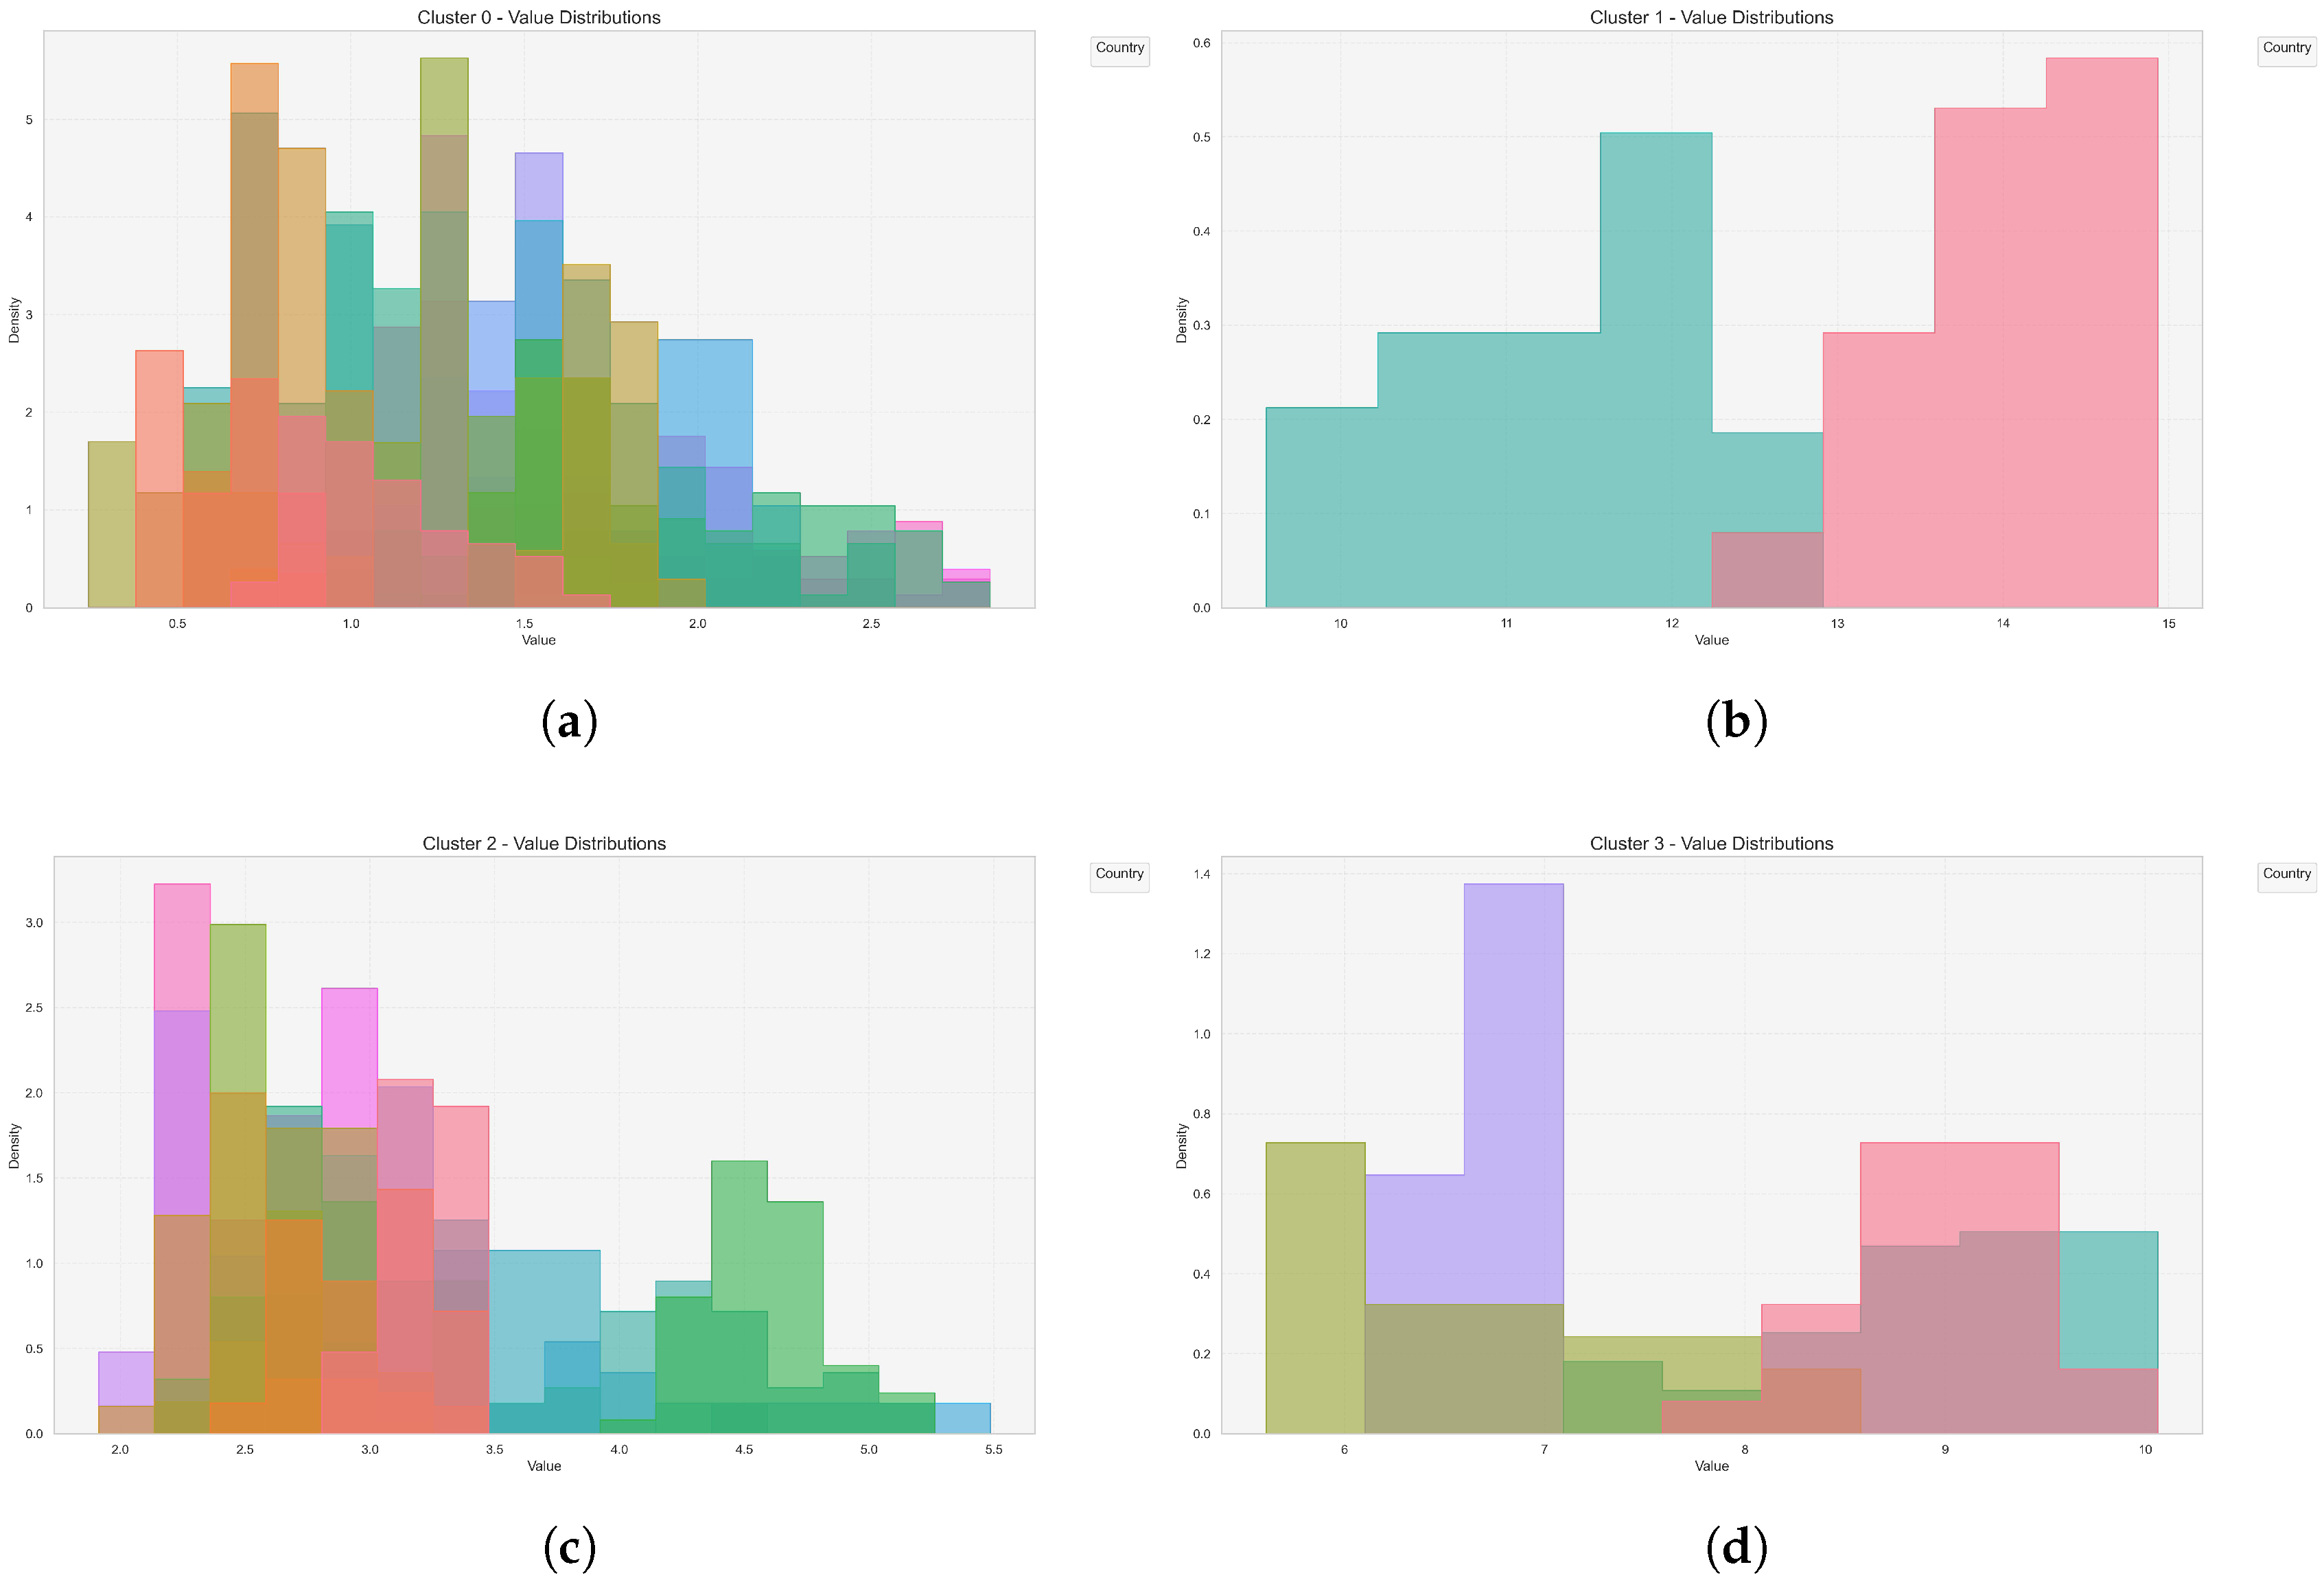
The distribution of biocapacity values within Cluster 0 is relatively constricted, characterized by a low standard deviation and a narrow interquartile range. This indicates a high degree of homogeneity within the group regarding their low per capita environmental capacity.
Cluster 0 represents the core of sustainable development challenges in Europe. Its existence illustrates the fundamental dilemma of modern economies: how to ensure prosperity under conditions of structurally limited domestic supply of ecosystem services. Its apparent stability is contingent upon external, unstable sources of natural capital, rendering it the group with the highest priority for urgent and profound transformation toward genuine sustainability.
4.3. Characteristics of Cluster 1
Cluster 1, represented exclusively by Finland and Sweden, constitutes a statistical outlier on the European scale. It is distinguished by extremely high median values of total biocapacity, multiple times exceeding the median of other groups, typically ranging between 9.5 and 14.5 gha per capita. Despite its small size, this cluster exhibits the greatest dispersion of values (high standard deviation and wide interquartile range), reflecting the substantial absolute scale of its natural resources, which are subject to some variability. The temporal trend is relatively stable, with a slight, statistically insignificant upward tendency, highlighting the persistence of their enormous environmental capacity (
Figure 12).
Cluster 1 consists of highly developed, innovative Nordic economies that rank among the world’s highest in terms of GDP per capita and quality-of-life indices. These countries represent a distinctive case where advanced economic development correlates positively with an extensive natural capital base. This economic prosperity has facilitated the implementation of rigorous environmental policies and substantial investments in green technologies. Despite high consumption levels, their per capita ecological footprint—though considerable—is often lower than that of other economies with similar GDP (e.g., certain countries in Cluster 0). Furthermore, their substantial biocapacity enables them to function as net exporters of ecosystem services. Their socio-economic model effectively integrates advanced technology with direct reliance on and sustainable management of natural resources, such as forestry and mining.
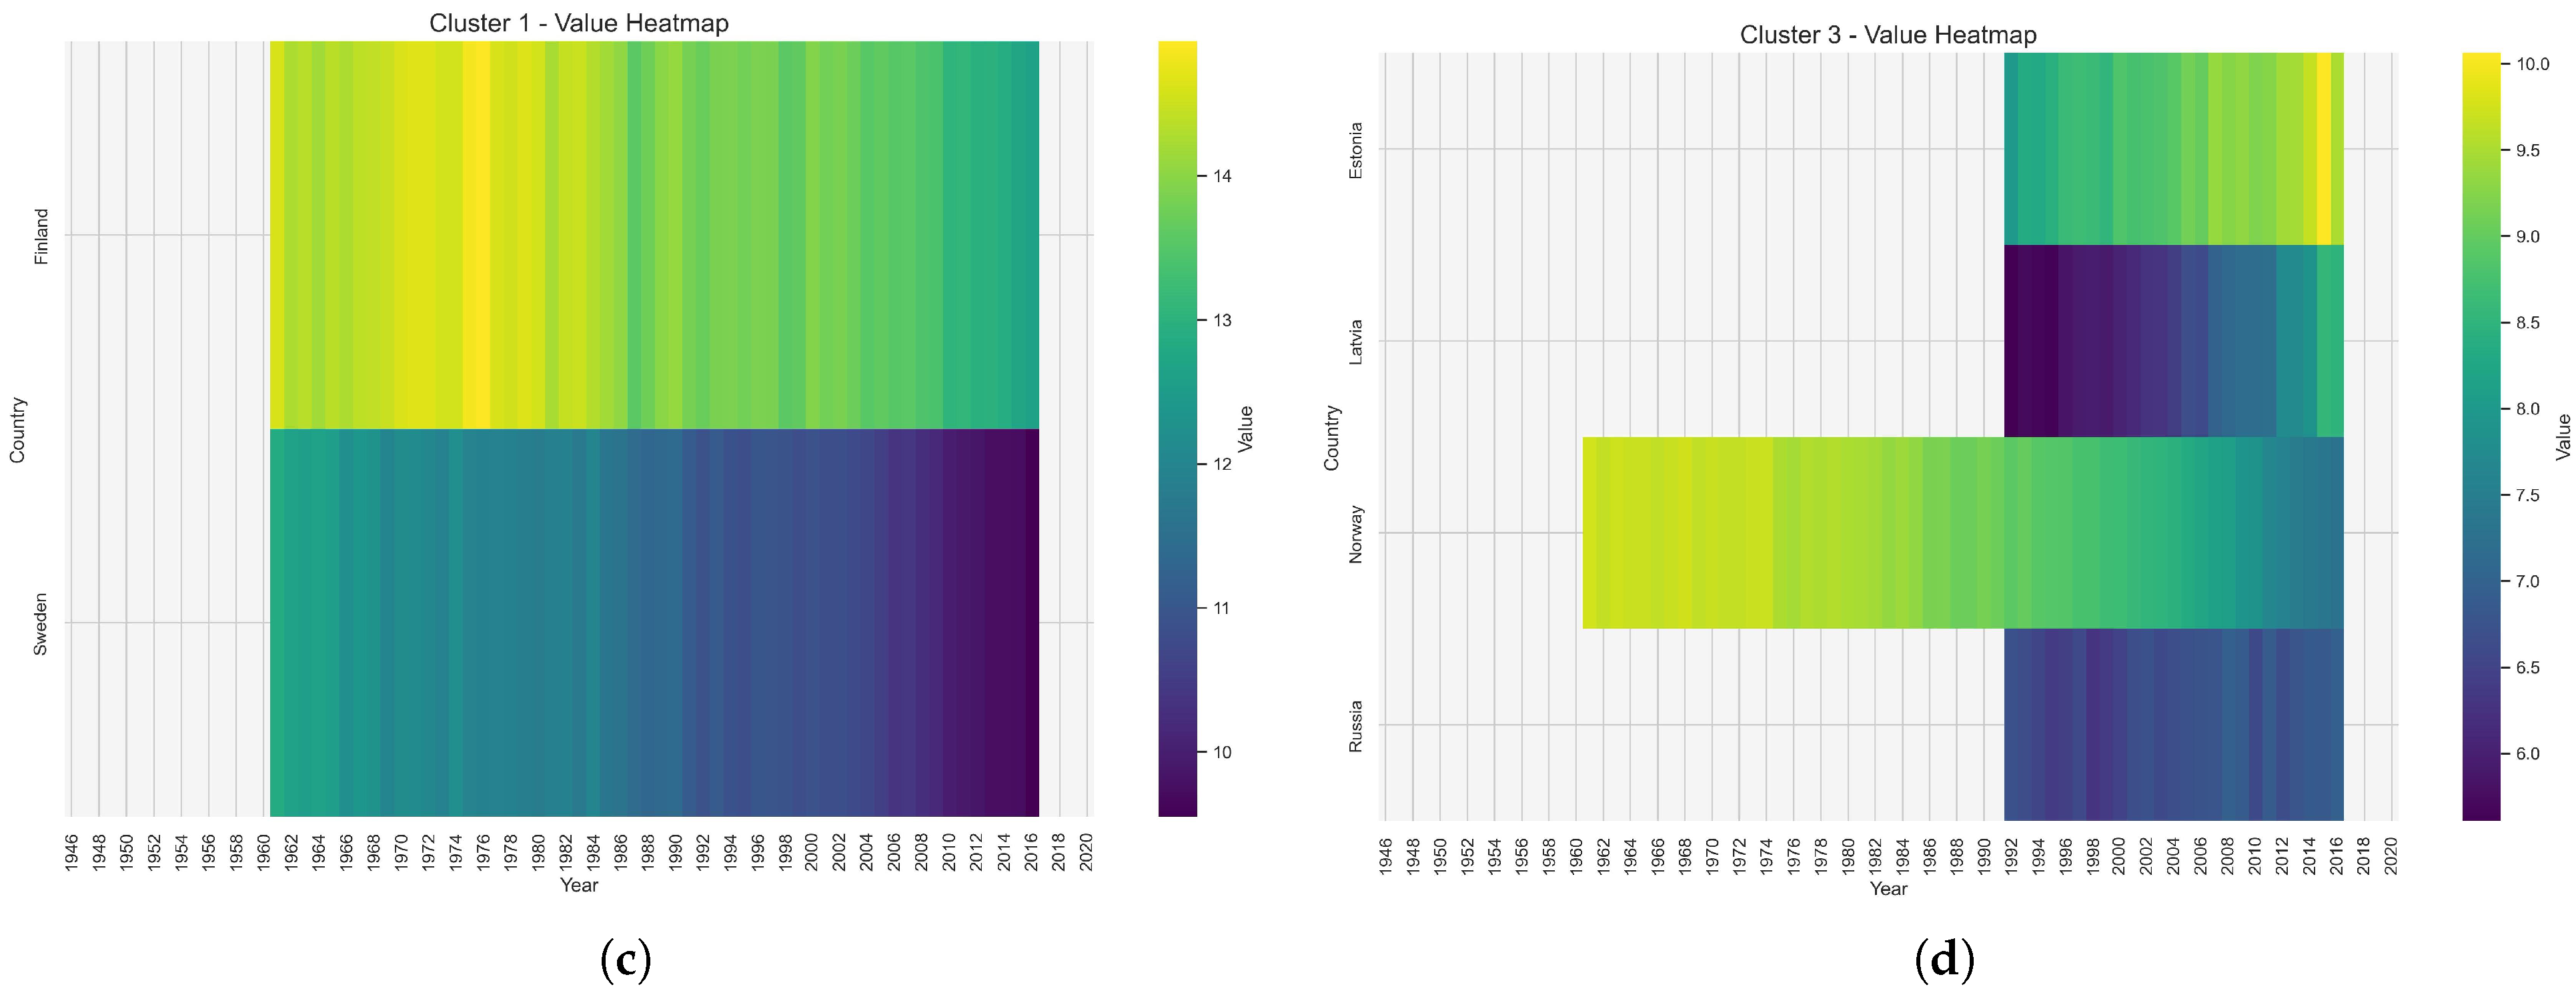
Cluster 1 constitutes a unique and strategically significant case both within Europe and globally. Its existence demonstrates that high levels of prosperity do not inevitably lead to comprehensive environmental degradation, provided that prudent, long-term resource management strategies are adopted. At the same time, their considerable environmental capacity confers a particular responsibility for maintaining the stability of the global ecological system. These nations serve not only as the “green lungs” of the region but also as critical actors in shaping future sustainable economic models (
Figure 13).
Cluster 0 (Low-Stable) and Cluster 1 (Very High) represent two extreme and mutually complementary poles within the European environmental–economic landscape.
Cluster 0, the largest group, encompasses the continent’s primary demographic and economic core, including highly developed Western European economies as well as transitioning countries from Southern and Eastern Europe. Its defining characteristic is a structurally low and remarkably stable median biocapacity, typically ranging between 1.0 and 3.0 global hectares per capita. This homogeneity in low per capita environmental capacity reflects shared challenges: high population density, advanced urbanization, and a constrained base of high-quality productive land. Paradoxically, the economic advancement of some member states correlates with a profound decoupling between GDP growth and the availability of domestic renewable resources. Consequently, the socio-economic stability of this cluster is inherently fragile, relying heavily on net imports of ecosystem services and the externalization of its ecological footprint beyond national borders. Cluster 0 thus embodies the central dilemma of sustainable development—maintaining prosperity under conditions of chronic environmental deficit—making it the highest priority for implementing radical circular economy measures and enhancing resource efficiency.
In stark contrast, Cluster 1 consists of Nordic economies that demonstrate a unique synergy between advanced economic development and substantial natural capital. These countries maintain the highest biocapacity values in Europe, enabling them to function as net exporters of ecosystem services while implementing stringent environmental policies. The comparison between these clusters reveals a fundamental structural imbalance in Europe’s environmental economy. Cluster 0, as the continent’s primary consumption center, exhibits a structural dependency on the resources of Cluster 1 and other global regions. This dependency underscores the necessity for Nordic countries to assume a leadership role in financing global nature conservation and facilitating an equitable transition. Simultaneously, the Swedish and Finnish model provides evidence that a synergy between an advanced economy and substantial natural capital is achievable, establishing an ambitious—though context-dependent—benchmark for other European nations seeking to reduce their environmental reliance (
Figure 10,
Figure 12 and
Figure 13).
4.4. Characteristics of Cluster 2
Cluster 2 constitutes a clearly differentiated group characterized by a moderate yet dynamically evolving biocapacity profile, occupying an intermediate position between the extremes of Cluster 0 (low-stable natural capital) and Cluster 1 (very high biocapacity). This cluster, which includes countries from Central, Eastern, and parts of Western Europe, exhibits a median biocapacity typically ranging from 2.5 to 4.5 global hectares per capita. Its most distinctive feature is a marked positive temporal trend, accompanied by relatively high internal variability when compared to the other clusters (
Figure 14).
The defining characteristic of Cluster 2 stems from the shared historical legacy of a socialist planned economy and the subsequent rapid systemic transformation in the late 20th century. Historically, industrialization under this model promoted extensive and often inefficient use of natural resources, while paradoxically preserving relatively large areas of agricultural and forest land—frequently managed as state-owned farms and national forests. Accession to the European Union and integration into global markets acted as catalysts for profound change. Structural shifts toward service-based economies, the abandonment of marginal arable land, and the implementation of EU afforestation programs, such as those under the Common Agricultural Policy, facilitated gradual yet systematic land reclamation and rewilding. These processes directly contributed to the observed upward trend in biocapacity. This fundamental transformation in land use represents the key mechanism distinguishing Cluster 2 from the stable trajectory of Cluster 0 (
Figure 15).
From an economic perspective, Cluster 2 represents “catching-up” economies characterized by rapid GDP growth and rising consumption levels. However, unlike the highly developed nations of Cluster 0, their per capita ecological footprint has generally not yet reached extreme levels, while biocapacity continues to increase due to the aforementioned land-use transformations. This creates a unique, though likely transitional, opportunity where the gap between ecological footprint and biocapacity remains narrower than in Western Europe. The biocapacity in these countries is often sustained by less intensive, more extensive agricultural practices and substantial areas of moderately productive forests, which have gained importance in the post-transformation period (
Figure 16).
The strategic position of Cluster 2 is highly significant. On one hand, these countries have the opportunity to learn from the developmental errors of Western nations and potentially “leapfrog” the phase of high resource intensity by directly investing in advanced resource-efficiency technologies and circular economy practices, thereby stabilizing their environmental balance. On the other hand, there exists a tangible risk of replicating the unsustainable consumption patterns characteristic of Cluster 0, which—given their already increasing ecological footprints—could rapidly erode the gains from rising biocapacity and lead to a significant ecological deficit. Therefore, the environmental and economic policies of these countries should pursue a dual strategy: continuing renaturalization efforts to enhance the supply of ecosystem services, while simultaneously aggressively pursuing decarbonization and improvements in material efficiency to reduce demand.
Cluster 2 thus represents not so much a static state as a dynamic process—a transitional bridge between a past of extensive resource use and a future of sustainable management. Its character is defined by ongoing transformation. This cluster serves as a compelling case study of how profound political and economic changes, supported by conducive legal frameworks such as the EU acquis, can generate positive environmental trends. The ultimate trajectory of this group—whether it consolidates into a state of relative environmental equilibrium or shifts toward a deficit model—remains one of the most critical and closely watched developments for Europe’s future sustainable development landscape.
4.5. Characteristics of Cluster 3
Cluster 3, comprising Estonia, Latvia, Norway, and Russia, presents a unique and seemingly paradoxical profile. It is characterized by a high median biocapacity, significantly exceeding the European average, yet it also displays the greatest internal variability and a markedly lower socio-economic potential compared to Cluster 1. The identity of this cluster is defined not by a synergy between an advanced economy and the environment, but by the sheer abundance of specific natural resources across extensive, sparsely populated territories. This resource wealth creates distinct opportunities alongside significant challenges (
Figure 17).
Cluster 3’s elevated biocapacity is supported by a combination of physical and historical factors. A substantial land area per capita forms the foundation for an abundance of two key ecosystems: extensive boreal forests (Estonia, Latvia, Russia) and northern marine and tundra ecosystems (Norway, Russia). However, unlike the diversified, technology-intensive economies of Cluster 1, the economic structure within parts of Cluster 3—particularly Russia—remains heavily reliant on the extraction of natural resources, encompassing not only renewable resources (timber, fisheries) but also, critically, non-renewable ones (oil, natural gas). This geopolitical and economic legacy renders these countries vulnerable to the “resource curse”, whereby natural wealth can impede economic diversification and innovation.
Cluster 3 can be described as a “resource power” with a dual character. On one hand, these nations hold significant surplus natural capital, functioning as net exporters of ecosystem services (e.g., carbon sequestration in forests, fish stocks). On the other hand, their economies exhibit varying degrees of insufficient diversification. Consequently, high biocapacity is often directly linked to an extractive economic model, creating a fundamental tension. In Norway, revenues from oil extraction fund the transformation and advanced management of renewable resources. For other members of the cluster, economic pressures may lead to the overexploitation of renewable resources (e.g., intensive logging) to finance development, potentially undermining the long-term sustainability of their biocapacity. The considerable internal variability within the cluster reflects these differences in management approaches and economic structures.
Thus, Cluster 3 represents Europe’s resource powerhouse with an uncertain future trajectory. Its substantial biocapacity presents both a significant opportunity and a source of risk. The opportunity lies in the potential to develop a diversified, resilient economy that preserves its vast natural resources for future generations while providing essential ecosystem services to the continent. The risk involves the consolidation of an extractive economic model, which could ultimately degrade the very resources that constitute its primary strength. Therefore, the future of this cluster depends not merely on the abundance of its resources, but on the wisdom and foresight applied in their management.
5. Discussion
The primary objective of this study was to identify and characterize groups of European countries exhibiting similar long-term trends in total biocapacity per capita. The application of a novel clustering algorithm integrating dynamic time warping (DTW) with partitioning methods successfully identified four distinct and robust clusters. This outcome not only fulfills the research aim but also provides a substantive foundation for interpreting the results within the broader socio-ecological and scientific context.
The identified cluster structure corroborates and refines established narratives in ecological economics. The clear delineation of a low-biocapacity group (Cluster 0) aligns with the well-documented phenomenon whereby highly developed, service-based economies exhibit a decoupling of economic activity from domestic biological resource availability [
26]. The stability observed in this cluster signifies not sustainability, but a profound structural dependency on imported ecosystem services—a finding consistent with theories of ecologically unequal exchange [
27]. Conversely, the emergence of Cluster 1 (Finland, Sweden) as a distinct entity demonstrates that advanced development is not inherently incompatible with high biocapacity, though this synergy is contingent upon specific geographic endowments, such as vast boreal forests, and sophisticated resource management institutions [
3].
A particularly significant finding is the identification of Cluster 2 as a “transitional” group. While previous studies often categorize Central and Eastern European countries with either Western or post-Soviet states, this temporal analysis captures their unique trajectory. The positive trend in their biocapacity strongly indicates the profound impact rapid institutional and economic changes—namely EU accession and post-socialist transition—can exert on environmental metrics [
28]. This suggests that policies leading to agricultural abandonment and afforestation can initiate a positive feedback loop for natural capital renewal [
29]. However, this window of opportunity may be narrowing as economic convergence accelerates consumption patterns, potentially steering these nations toward the deficit model characteristic of Cluster 0 [
30].
The interpretation of Cluster 3 underscores the critical distinction between resource abundance and sustainable management. The high biocapacity of its members echoes “resource curse” paradigms [
31]. Unlike Cluster 1, where advanced economies manage abundance, the biocapacity in Cluster 3 appears more vulnerable, being closely linked to extraction-based economic models. This implies that high national biocapacity alone is an insufficient indicator of sustainability; the governance of these resources and the structure of the dependent economy are paramount [
20].
Furthermore, the interpretation of these distinct biocapacity pathways must be contextualized by the data constraints outlined in the Methods section. The significant temporal and spatial gaps in the underlying data, and the conscious decision to avoid imputation in favor of transparency, mean that the findings are robust for the observed data but their generalizability to countries or specific historical periods with missing data should be made with caution. This potential selection bias, inherent in the continent’s heterogeneous environmental reporting history, underscores the importance of future efforts to reconstruct and harmonize long-term environmental accounts.
The implications of these findings are substantial. For policymakers, the clustering offers a rationale for differentiated environmental and economic strategies. A uniform approach, such as a one-size-fits-all EU Green Deal, may prove inefficient [
12]. Tailored interventions are necessary: radical resource efficiency and circular economy measures in Cluster 0; enhanced protection and global environmental leadership from Cluster 1; support for sustainable path development in Cluster 2; and economic diversification coupled with sustainable extraction practices in Cluster 3.
This study demonstrates that institutional factors—such as EU integration and post-socialist transition—can be as influential as geographical endowments in shaping biocapacity trajectories, thereby challenging purely biophysical determinism in sustainability science. The methodological integration of DTW with clustering provides a replicable framework for analyzing other environmental time-series data [
25]. Future research should integrate multi-regional input–output analysis to track embodied biocapacity flows between clusters, incorporate higher-frequency data to better capture climate impacts, and develop dynamic models to simulate policy impacts on future biocapacity trajectories under various scenarios. Despite its limitations, the identification of four robust biocapacity pathways offers a valuable framework for differentiated environmental governance across Europe’s diverse socio-ecological contexts.
Furthermore, as noted in the Methods section, the significant spatial and temporal gaps in the underlying data and our decision to avoid imputation in favor of transparency may introduce a potential selection bias, limiting the generalizability of our findings to countries or periods with missing data.
6. Conclusions
The analysed dataset, while characterised by significant temporal and spatial incompleteness, offers a unique and valuable opportunity to examine long-term ecological trends across Europe. The unbalanced panel structure, resulting from disparate data availability across countries and time periods, reflects the continent’s complex geopolitical history during the latter half of the 20th century. Data for Western European nations are available from as early as 1961, whereas for former Eastern Bloc countries, consistent reporting generally commences only after the socio-political transformations of the early 1990s.
Despite this heterogeneity, the dataset demonstrates remarkable spatial coherence and reveals pronounced, persistent gradients in biocapacity across the continent. The distribution of values is strongly right-skewed, indicating that a small number of countries possess a disproportionately large share of biocapacity relative to the European average. The observed patterns—such as the consistently high values in Nordic countries and low values in highly urbanised and island states—are sufficiently robust to emerge clearly from the incomplete data. The pattern of missingness itself is informative, frequently corresponding to historical periods of limited international cooperation or statistical capacity.
The considerable variability within the data provides substantial analytical leverage. The minimum observed average value is 0.59 global hectares per capita, while the maximum reaches 13.97, yielding a range of 13.38 gha/cap. This variability represents not statistical noise but a meaningful signal of diverse economic pathways, environmental policies, and responses to global changes. Consequently, the dataset provides a rich, albeit imperfect, foundation for analysing the dynamics of ecological resource availability and its socio-economic determinants over time.
This study moves beyond static comparisons to capture the dynamic similarity in biocapacity trajectories across Europe. The conclusions are threefold:
European countries can be meaningfully classified into four distinct clusters based on the temporal dynamics of their biocapacity per capita, each with a unique socio-ecological profile: Low-Stable (Cluster 0), Very High (Cluster 1), Medium-Growing (Cluster 2), and High-Resource Dependent (Cluster 3).
The clustering is not arbitrary but reflects deep-seated historical, economic, and geographical forces, including post-socialist transition, EU integration, resource endowments, and levels of economic development. This confirms that biocapacity trends are a function of complex path dependencies.
The methodological innovation of combining DTW with partitioning methods has proven highly effective in grouping time series based on their shape and dynamics, offering a valuable tool for future socio-ecological research where the pattern of change is as important as the static values.
In essence, the map of European biocapacity is a map of intertwined histories and economies. Recognizing these distinct clusters is the first step towards designing smarter, more equitable, and context-aware policies that can navigate the collective challenge of achieving genuine sustainability within planetary boundaries.

