Article

The Urban–Rural Integration of Resources and Services Using Big Data: A Multifunctional Landscape Perspective

1
Collaborative Innovation Center for Emissions Trading System Co-Constructed by the Province and Ministry, Hubei University of Economics, Wuhan 430205, China
2
School of Low Carbon Economics, Hubei University of Economics, Wuhan 430205, China
3
School of Resources and Environmental Sciences, Wuhan University, Wuhan 430079, China
4
International Business School, Hainan University, Haikou 570228, China
*
Author to whom correspondence should be addressed.
Sustainability 2025, 17(22), 9934; https://doi.org/10.3390/su17229934
Submission received: 1 September 2025 / Revised: 26 October 2025 / Accepted: 3 November 2025 / Published: 7 November 2025

Abstract

Spatial mismatches between ecosystem services and human demands pose critical challenges for sustainable land use in ecologically fragile regions. Rapid urbanization intensifies land-use conflicts in ecologically fragile regions, threatening ecosystem services and habitat sustainability. This study addresses this challenge by quantifying spatial mismatches between landscape resource functions (LRFs: natural, traditional, and humanistic) and service demands (LSFs, e.g., catering and public facilities) in Xinxian County, in China’s Dabie Mountains, using multi-source data (DEM, POI big data, and remote sensing) and spatial analysis (nearest neighbor indices, kernel density, and multi-ring buffers). The results reveal that concentrated natural LRFs in high-elevation single-core clusters exhibit low dispersion, thus increasing vulnerability to land conversion, while agglomerated LSFs in urban cores exacerbate ecosystem service inequalities. Crucially, service deficits beyond 3 km buffers and the fragmentation of traditional agricultural zones indicate potential erosion of regulating services, as inferred from spatial mismatches (e.g., soil retention and water regulation), and cultural resilience. These spatial mismatches act as proxies for habitat risks, in which humanistic landscape expansion competes with ecological corridors, amplifying fragmentation. To mitigate risks, we propose (1) enhancing connectivity for natural resource corridors to stabilize regulating services, (2) reallocating LSFs to peri-urban buffers to reduce pressure on critical habitats, and (3) integrating ecosystem service trade-offs into landscape planning. This framework provides an actionable pathway for balancing development and habitat conservation in mountainous regions undergoing land-use transitions.

1. Introduction

Urban and rural areas integrate natural elements and cultural activities [1] and are important spaces for accommodating and reflecting natural and cultural diversity. The predominant focus on urbanized areas has inadvertently neglected rural–urban diversity, leading to a fragmented understanding of human settlements while subjectively and objectively neglecting the observation and understanding of the overall diversity of urban and rural areas. This has led to a lack of a comprehensive understanding of human settlements [2].
Against this backdrop, the regional landscape emerges as a strategic tool for bridging urban–rural divides. As an important means to meet people’s growing needs for a better life and promote rural revitalization, the regional landscape has become an important component in improving people’s living standards [3], driving employment, and even achieving agricultural and rural modernization. In the post-epidemic era, the regional landscape plays a unique role in providing public health and leisure space, cultivating domestic demand, and serving the construction of a new development pattern. Focusing on the national landscape has become the trend. With the arrival of the era of the national landscape, while the landscape economy is rapidly developing, industry types are constantly being enriched; market size is constantly increasing; and problems such as an insufficient effective supply of landscapes, irregular market order, and imperfect institutional mechanisms are becoming increasingly prominent. Against this backdrop, the idea of urban and rural landscape development is constantly emerging, as is a series of policies. At the same time, urban and rural landscapes are still relatively weak in terms of regional integrity, industrial advantages, and overall planning layout. It is urgently necessary to extensively explore the advantages and value of urban and rural landscape resources; continuously optimize the allocation of urban and rural landscape resources from a spatial pattern; and obtain significant and practical guiding significance for improving the level of landscape resource utilization, landscape product supply, and landscape brand internationalization, as well as better meeting landscape consumption needs [4].
The scientific construction of spatial cognition based on the perspective of urban and rural landscapes is of great significance for promoting the sustainability of urban and rural landscapes [5]. By reviewing the relevant literature, we found that existing research mainly focuses on landscape spatial structure [6], spatial distribution, landscape small-town greenways [7], landscape urbanization [8], landscape planning [9], smart marketing [10], and cultural and economic sharing [11], thus providing an important foundation for scientifically understanding the spatial characteristics and elemental composition of urban and rural landscape resources. In terms of concepts, methods, and means, relevant research has helped enrich the theoretical understanding and practical exploration of urban and rural landscapes in spatial analysis models and methods such as spatial econometric modeling [12], spatial justice [13], economic social ecological environment coordination [14], social space creation [15], the spatial flow patterns of landscape flow [16], landscape spatial economy [17], and urban–rural landscape concepts and models [18].
While extant research provides a valuable foundation, significant gaps persist when applying these insights to the practice of integrated urban–rural landscape development [19,20]. First, a critical scale mismatch exists. The urban–rural landscape concept emphasizes a “whole domain” approach, yet empirical studies are predominantly conducted at macro scales (e.g., provincial or municipal levels) [21]. The county level, which serves as the fundamental administrative unit and the practical spatial carrier for implementing “whole domain” strategies in China [22], has been critically understudied. This oversight limits the theoretical relevance and practical applicability of the existing findings for on-the-ground planning. Second, there is a notable data deficiency. Quantitative analyses of landscape spatial structure still rely heavily on traditional statistical data [23], failing to capitalize on emerging big data sources like POIs that can capture fine-grained human activities and service distributions [24,25]. This lag constrains our ability to understand landscapes in the digital era. Third, the conceptual principle of multifunctionality is not fully operationalized. While landscapes are inherently multifunctional [26,27], research often focuses on isolated elements—such as historical [28,29], natural [30,31], or architectural landscapes [32,33]—thereby failing to capture the integrated development and synergistic potential of diverse resource types. This limitation is particularly acute in critical yet vulnerable regions, such as mountainous [34,35] and ecologically functional areas [34,35], in which a nuanced understanding of resource–service interplay is paramount for sustainable development.
To bridge these gaps, this study introduces an integrated resource–service perspective and conducts a fine-scale, empirical investigation at the county level. We focus on Xinxian County in China’s Dabie Mountains, which is a region emblematic of the challenges and opportunities in mountainous, ecologically fragile, and culturally rich areas. By leveraging a multi-source dataset—including DEM, remote sensing, and, perhaps most critically, POI big data—we develop a replicable spatial analytical framework. This framework is designed to (1) classify multifunctional landscape spaces by synthesizing resource and service elements; (2) quantify their spatial patterns and aggregation characteristics using the NNI and KDE; and (3) diagnose spatial mismatches between resource provision and service demand through buffer analysis. Our work aims to provide a missing, actionable knowledge base for optimizing landscape resource utilization and conservation, thus offering both theoretical advancement and practical support for regional planning.

2. Materials and Methods

2.1. Definitions and Research Methods

2.1.1. Nearest Neighbor Index

The nearest neighbor index (NNI) is an important tool for reflecting the degree of spatial distribution and aggregation of point features. The nearest distance is a geographical indicator that represents the degree of proximity between urban and rural landscape resource points in geographic space. When the point distribution of urban and rural landscape resources in a region is random (Poisson distribution type), the theoretical nearest distance can be expressed as follows:
R = r o ¯ r E ¯
r I ¯ = 1 2 n / A = 1 2 D .
In this formula, which represents the theoretical nearest distance, r 0 . is the average distance between each landscape resource spatial point and its nearest spatial point determined; A is the area of the region; N is the number of spatial points for landscape resources; and D is the point density. R is the nearest neighbor index. If R > 1, it indicates that the spatial distribution of point features is a discrete distribution. If R = 1, it indicates that the spatial distribution of point-like features is random. If R < 1, it indicates that the spatial distribution of point-like features is clustered.

2.1.2. Kernel Density Estimation

This study uses the clustering degree of landscape resources to characterize the degree of spatial distribution of urban and rural landscape resources. The non-parametric estimation method of estimating the sequence density function in spatial analysis, which is known as kernel density (KDE) distribution, is used in this study to calculate the spatial agglomeration status of urban and rural landscape resource points in the study area. This method searches a circular area around each landscape resource grid point to be calculated. By examining the distribution characteristics of landscape resource point elements in the regular area, the density value of each landscape resource grid point is calculated. The kernel density distribution function at each point is as follows:
D n ( s ) = 1 n h i = 1 n   k s c i h .
In this formula, the kernel density function of the point represents the position of the landscape resource point that falls within the circular range with a center and a radius of h, where n is the number of landscape points within the circular range; K is the kernel function representing spatial weights; and points falling within the grid have different weights. The closer they are to the search center, the greater the weight. Finally, the kernel density distribution command in the spatial analysis module of GIS software is used to calculate the kernel density of each grid cell. According to repeated experiments, using 1000 m as the distance threshold shows good adaptability in the spatial range of landscape resources.

2.1.3. Service Matching Analysis: Defining and Diagnosing Spatial Mismatch

The core objective of this study is to diagnose spatial mismatches, which we define not as a uniform lack of services but as a deviation from contextually appropriate service accessibility thresholds for different landscape resource types. A “one-size-fits-all” matching criterion is theoretically unsound, as the service dependencies of a remote natural reserve fundamentally differ from those of a cultural–historical site.
To address this, our multi-ring buffer and identity analysis was conducted under a differentiated accessibility threshold framework, guided by the intrinsic functions and visitor expectations associated with each resource category:
① Natural LRFs: These resources (e.g., mountain peaks and forests) are often valued for their tranquility and ecological integrity. The primary service expectation is basic safety and minimal infrastructure. Therefore, a service deficit within a 3 km buffer is not necessarily a critical mismatch. More significant mismatch occurs when agglomerated urban LSFs encroach upon and exert pressure on these natural cores, potentially degrading their regulating services. Our analysis thus focuses on quantifying the proximity of natural cores to urban service sprawl.
② Traditional LRFs: These areas (e.g., traditional villages and agricultural landscapes) are living communities that require sustained access to essential daily services. A lack of such services threatens their vitality and cultural continuity. Here, we define a meaningful mismatch as the scarcity of essential public facilities (PFs), healthcare (Hs), and shopping services (Ss) within a critical 3 km accessibility radius. This threshold reflects a reasonable distance for daily access in a rural, mountainous context.
③ Humanistic LRFs: These sites (e.g., memorials and historical landmarks) function as curated tourist destinations. Their sustainability depends on a supportive service ecosystem for visitors. Consequently, the key mismatch we assess is the lack of visitor-oriented services, including catering (Cs), accommodation (As), and transit (Ps), within a 1 km buffer, which aligns with typical pedestrian comfort ranges for tourists.
This refined approach ensures that our identification of “mismatches” is a theoretically grounded evaluation of whether the service provision meets the distinct functional needs of each landscape type.

2.2. Study Area and Data Collection

2.2.1. Study Area

The Dabie Mountains occupy a remote area at the junction of Hubei, Henan, and Anhui provinces. Many counties in this area, including Xin County, are poorly connected to the outside world. Located between 31°28′ and 31°46′ north latitude and 114°33′ and 115°12′ east longitude, it is one of the first national comprehensive tourism demonstration areas and the capital revolutionary base area in Hubei, Henan, and Anhui provinces. More than 80% of the townships (towns) have a relative height difference of over 500 m. The main vein of the Dabie Mountains runs through the middle of the territory, forming three peak areas in the east, middle, and west, thus creating a W-shaped terrain. The location and elevation obtained from DEM of the research area are shown in Figure 1.
The spatial functions of urban and rural landscapes are highly dependent on the regional characteristics of the study area. By analyzing the regional characteristics of the study area from five dimensions—history, nature, geography, environment, and urban–rural structure—the regional characteristics of the study area can be summarized in five words: “old” (referring to the regional characteristics of historical revolutionary areas); “mountain” (referring to the mountainous natural scenery); “edge” (referring to the climate transition zones and interprovincial border areas in the geographical location); “life” (referring to ecological functional zones of the ecological environment); and “township” (referring to county-level characteristics, with rural areas as the main body in urban–rural structures). As the research area, Xinxian County in Henan Province, which integrates the multidimensional characteristics of “border, life, and township”, is highly representative; it provides an important reference for other regions with similar features. The framework used for analyzing the regional characteristics of the research area is shown in Figure 2.

2.2.2. Data Collection

Based on the need for comprehensive research, the scale of research, and data availability, this study divides the research data into four types: The first type consists of the attribute data of urban and rural landscape elements, and the collected historical and natural landscape element data are all from cultural and tourism management departments (Table 1). The architectural landscape is mainly based on traditional villages, and the data comes from the housing and urban–rural development departments. The second type of data includes administrative division attribute data and vector boundary data. It should be noted that administrative divisions are unified into 15 townships according to local customs (i.e., the newly established Jinlanshan Street Office and Xiangshanhu Management Area are merged into Xinji Town). The third type of data is represented by the digital elevation model (DEM), which is a digital simulation of ground terrain (i.e., a digital representation of terrain surface morphology) achieved through limited terrain elevation data. It is a physical ground model that represents ground elevation in an ordered numerical array form and is a branch of the Digital Terrain Model (DTM). Other terrain feature values can be derived from it. This study used ASTER GDEMV2 DEM data with a resolution of 30 m × 3 out of 0 m, which was sourced from geospatial data clouds (http://www.gscloud.cn/), to reflect the overall natural geographical features of the research area. The fourth category consists of the life service POI big data obtained from Baidu Map, which is divided into 9 categories: catering services, public facility services, shopping services, financial and insurance services, sports and leisure services, transportation services, healthcare services, accommodation services, and other services. To reflect the spatial characteristics of the life service functions in the study area, POI data were sourced exclusively from Baidu Map in 2018. The initial collection yielded 115,910 points, which were filtered to 9231 after deduplication and further refined to 5156 valid points after spatialization and quality control. POI data may underrepresent informal services, but rigorous cleaning ensured reliability for spatial analysis.

2.2.3. Data Processing and Point Generation

From the perspective of diversity, there are multiple types of urban and rural landscape elements distributed within the space. Each element can be abstractly regarded as a point in the diversity system, and the nearest neighbor index can be used to study the geographical spatial distribution status of point-like elements. This study takes the point elements of multiple types of tourism resources in Xinxian, Henan Province, as an example and quantifies the spatial aggregation characteristics of multiple types of tourism resource elements in the study area based on the nearest neighbor index. The steps of this process include generating multiple types of tourist attraction elements across the entire region, calculating the distance r1 between the nearest points, and calculating the nearest point index.
  • DEM data processing
Using the ArcGIS 10.6.1 working platform, the obtained raw DEM data is first embedded and raster-projected. The vector administrative division data of the study area that matches the coordinates of the DEM data is selected, and the defined projected DEM data is cropped. Finally, DEM data with a resolution of 30 m × 30 m for the study area is obtained (Figure 1).
2.
Resource-based landscape attribute data point element generation
Data on the resource-oriented landscapes in the research area were mainly sourced from the official websites of local governments, and the spatial location information regarding each resource-oriented landscape is sourced from Tencent’s location services https://lbs.qq.com/tool/getpoint/index.html. The point vector spatial data of urban and rural landscape resources in the research area is generated based on latitude and longitude, and the generated point features are exported (Figure 3).

2.2.4. Service-Based Landscapes

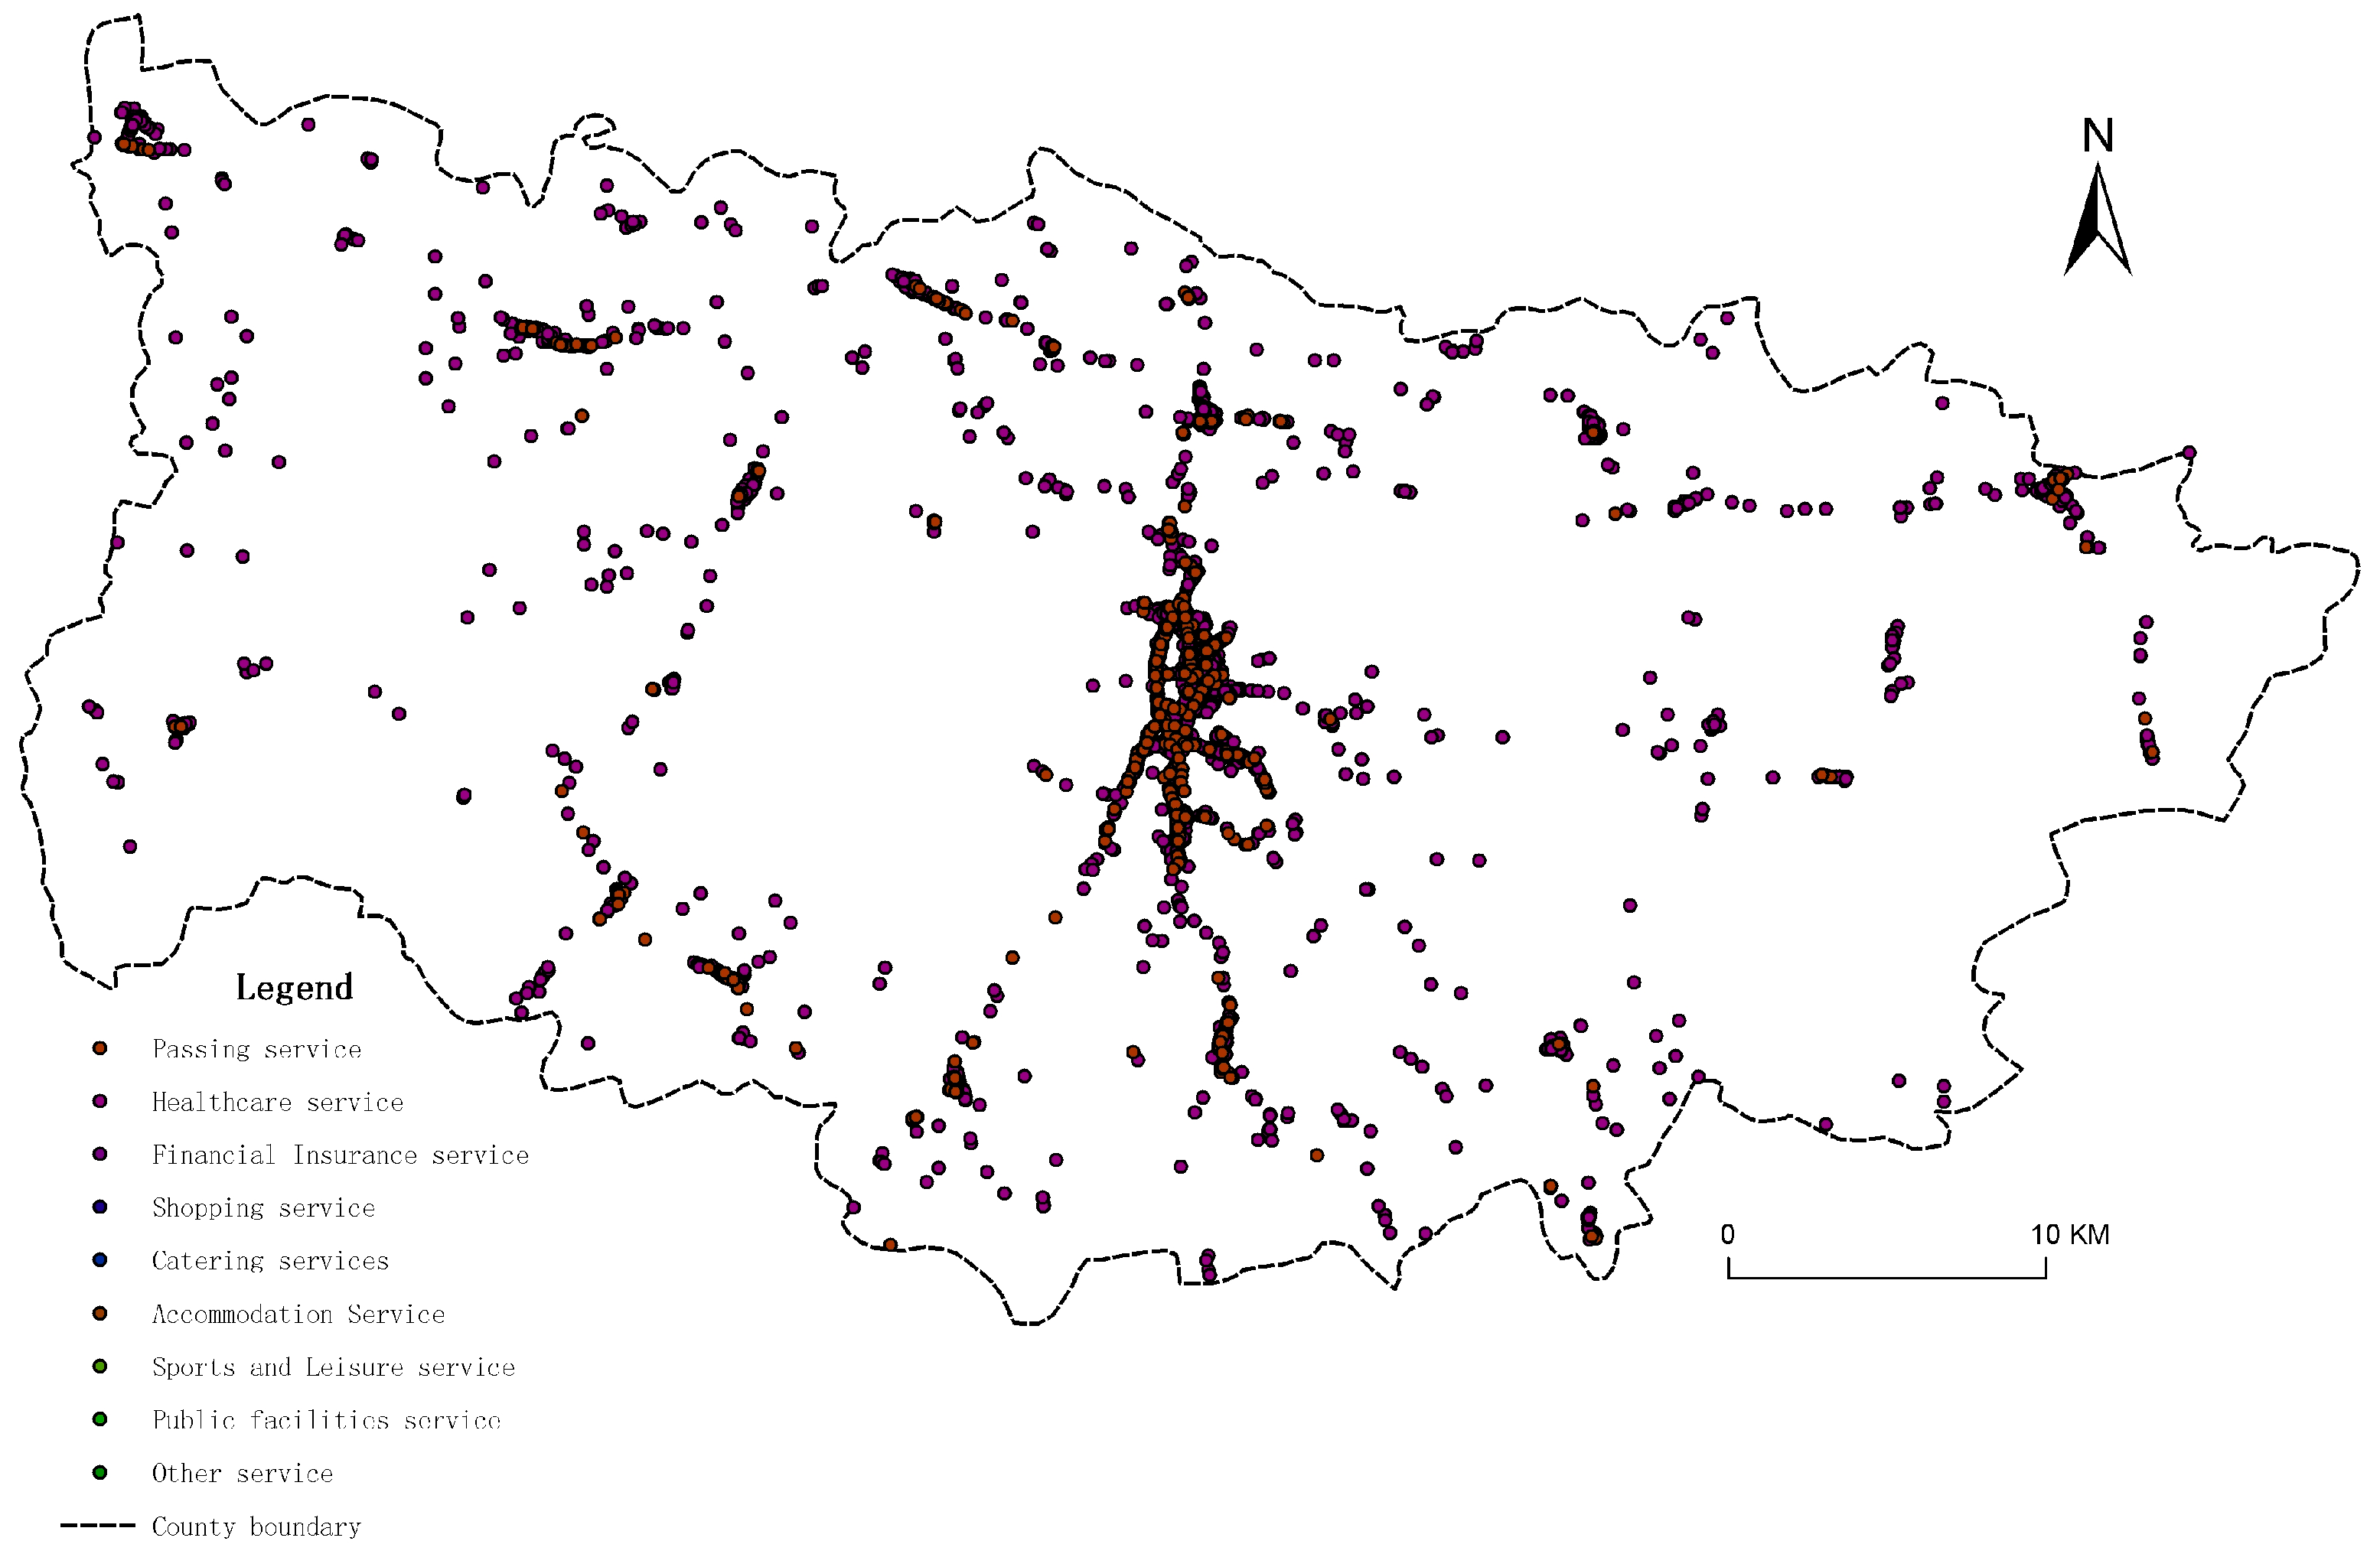
POI data is an emerging type of big data that can systematically reflect urban functions and land use. Using the application programming interface provided by Baidu Maps, 115,910 POIs were obtained in the research area. Baidu Maps has 15 types of POIs, including hotels (HT), restaurants (CT), roads (RD), residential communities (RC), businesses (EP), shopping (SP), transportation facilities (TF), finance (FN), tourist attractions (TA), car services (CS), government buildings (OB), life services (LS), leisure and entertainment (LE), medical care (MC), and government agencies (GA). The classification criteria for different types are shown in Table 2.
With the continuous development of geospatial research using big data, the application of POI data based on spatial location services in geographic research is becoming increasingly widespread. As a type of point-like geographic spatial data representing geographic entity elements, POI data contains information such as the type and location of geographic entity elements and has become an important source of data for understanding geographic activity patterns and spatial phenomena.
This study collected 9231 POI data points from the research area in 2018, which were sourced from Baidu Maps. Combined with Baidu Maps’ POI classification standards, the elements with service functions were reclassified, and the POIs closely related to life services were divided into 9 categories: catering services, public facility services, shopping services, financial and insurance services, sports and leisure services, transportation services, healthcare services, accommodation services, and other services. After data cleaning, underground coding, coordinate transformation, and data spatialization, 5156 POI data points were ultimately selected and retained to construct a spatial database of urban and rural landscape service POI big data. The spatial distribution of service-oriented landscapes based on POI big data is shown in Figure 4. The composition of the POIs is shown in Figure 5.

2.3. Theoretical Framework for Understanding Spatial Functional Diversity

To systematically determine the spatial relationship between landscape resources and services, this study constructs a theoretical framework grounded in the integration of resources and services, as visualized in Figure 6. The framework posits that the multifunctionality of an urban–rural landscape emerges from the dynamic interplay between its constituent resource base and the service provisions that support human activities. It structures this research into four sequential phases:
① Foundation: Multi-Source Data Integration. The framework is predicated on the synthesis of diverse spatial data, which forms the empirical bedrock of the analysis. This includes (a) Resource Data (demarcating the supply of humanistic, natural, and traditional landscape resource functions—LRFs) and (b) Service Data (primarily POI big data, quantifying the provision of life service functions—LSFs).
② Core Analysis: A Sequential Spatial Diagnostic Process. The analytical core employs a suite of GIS methods to transition from raw data to insightful spatial intelligence, following a causal logic of interaction.
Step 1: Spatial Pattern Characterization. We first employ the average nearest neighbor (NNI) index to classify the distribution type (clustered, random, or dispersed) of LRFs and LSFs. This is followed by kernel density estimation (KDE) to identify and visualize their spatial agglomeration cores and intensity. This step answers the following foundational question: “Where are the resources and services located, and how are they organized in space?”
Step 2: Resource–Service Matching Analysis. The identified resource cores from Step 1 then serve as centers for multi-ring buffer analysis. By overlaying these buffers with the spatial distribution of LSFs, we quantitatively evaluate the level of spatial coupling or mismatch between them. This step directly tests the core premise of the framework: “To what extent does the provision of services correspond to the location of key landscape resources?”
③ Synthesis: Interpretation of Mismatches as Risks. The spatial mismatches identified in Step 2 are not merely geometric outcomes; they are interpreted as proxies for underlying socio-ecological risks. Disconnects may indicate vulnerabilities in ecosystem services, inequalities in service accessibility, or pressures on cultural resilience.
④ Output: Informing Spatial Planning and Policy. The final phase translates the diagnostic results into actionable knowledge. The framework provides a spatially explicit evidence base for formulating targeted organizational policies and optimization strategies for urban–rural landscape development, utilization, and protection.

3. Results

We developed a classification scheme based on regional characteristics. Multifunctional space is the projection and manifestation of different types of resource utilization in space. Based on the regional characteristics and different resource features of urban and rural landscape resources in the research area, the main landscape services are divided into two categories: resources and services. Based on the multifunctionality of spatial utilization, the urban and rural landscape spaces in the research area are divided into three subtypes: humanistic, natural, and traditional. The service category is divided into nine subtypes: catering services, public facility services, shopping services, financial and insurance services, sports and leisure services, transportation services, healthcare services, accommodation services, and other services. The multifunctional types and contents of urban and rural landscape spaces are shown in Table 3.

3.1. Landscape Functional Diversity

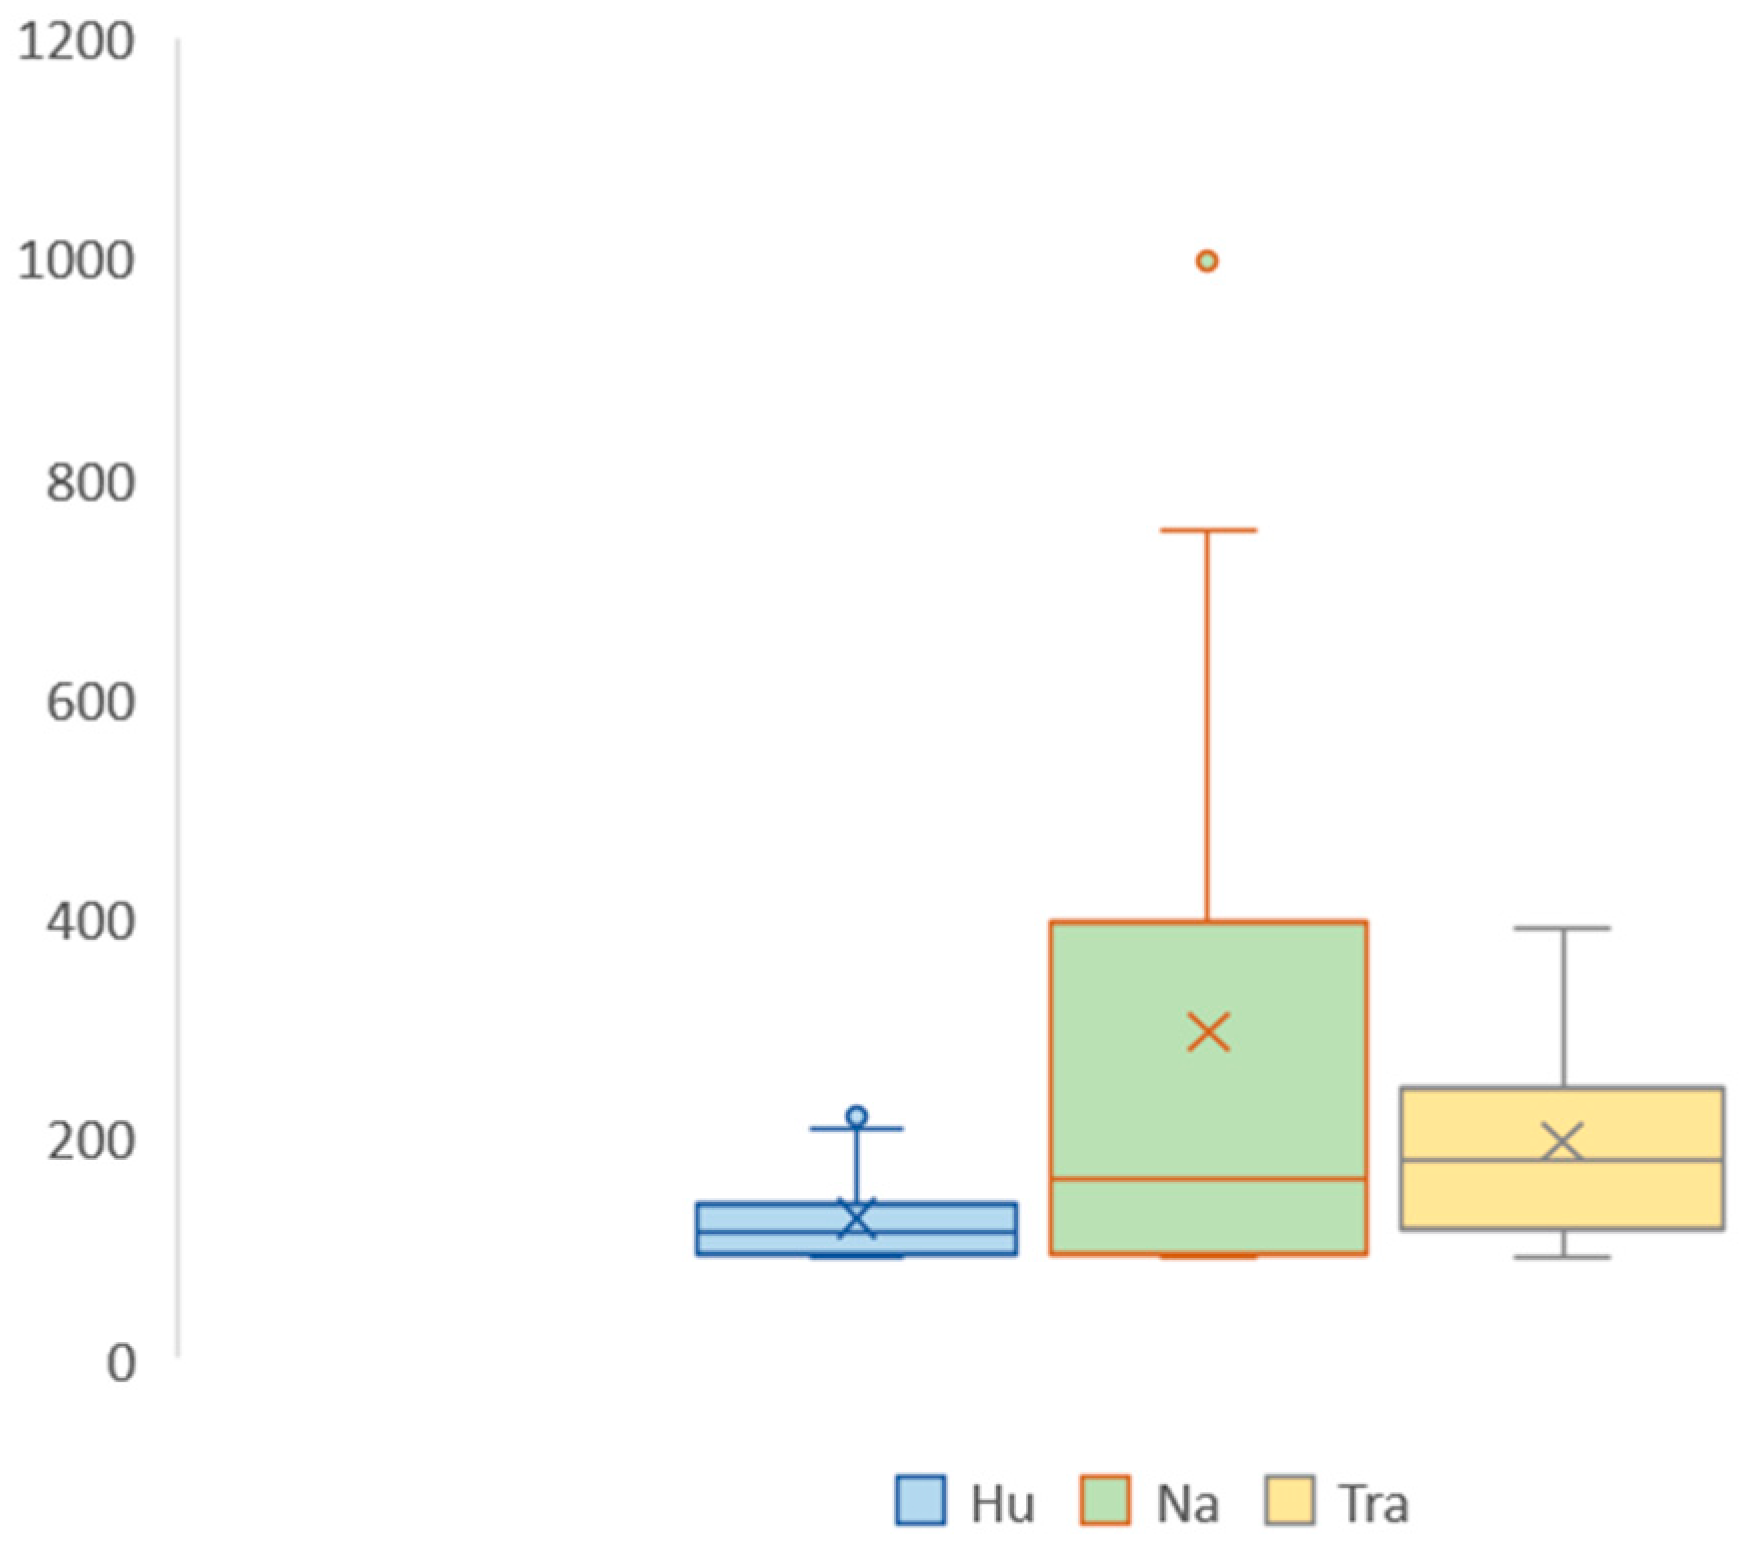
Understanding the distribution of different types of resource-oriented landscapes is an important aspect of analyzing landscape functional diversity. There are significant differences in the distribution of different types of resource-oriented landscapes, especially due to the influence of terrain factors across urban and rural areas. The digital elevation model (DEM) is a model that uses limited terrain elevation data to achieve the digital simulation of ground terrain, and it can be used to reflect the distribution differences in different types of resource-oriented landscapes in terrain elevation. The humanistic landscape has the lowest elevation value, the traditional landscape has the second lowest, and the natural landscape has the highest. Figure 7 shows the differences in the terrain distribution of different types of resource-oriented landscapes.
Using the average nearest neighbor index method, the spatial distribution of the humanistic, natural, and traditional types of tourism was determined. Table 4 reveals that humanistic and natural resources are dispersed, while services are highly clustered in urban cores. All NNI values were statistically significant (p < 0.05), as shown in Table 4. The nearest neighbor indices of humanistic and natural tourism resources in the entire region are 1.338629 and 1.377229, respectively, both showing a discrete distribution characteristic, and the spatial dispersion characteristic of natural tourism resources is more significant. The nearest neighbor index of traditional tourism resources in the entire region is 0.997447, thus showing a random distribution pattern.

3.2. Spatial Pattern

3.2.1. Resource-Oriented Landscapes

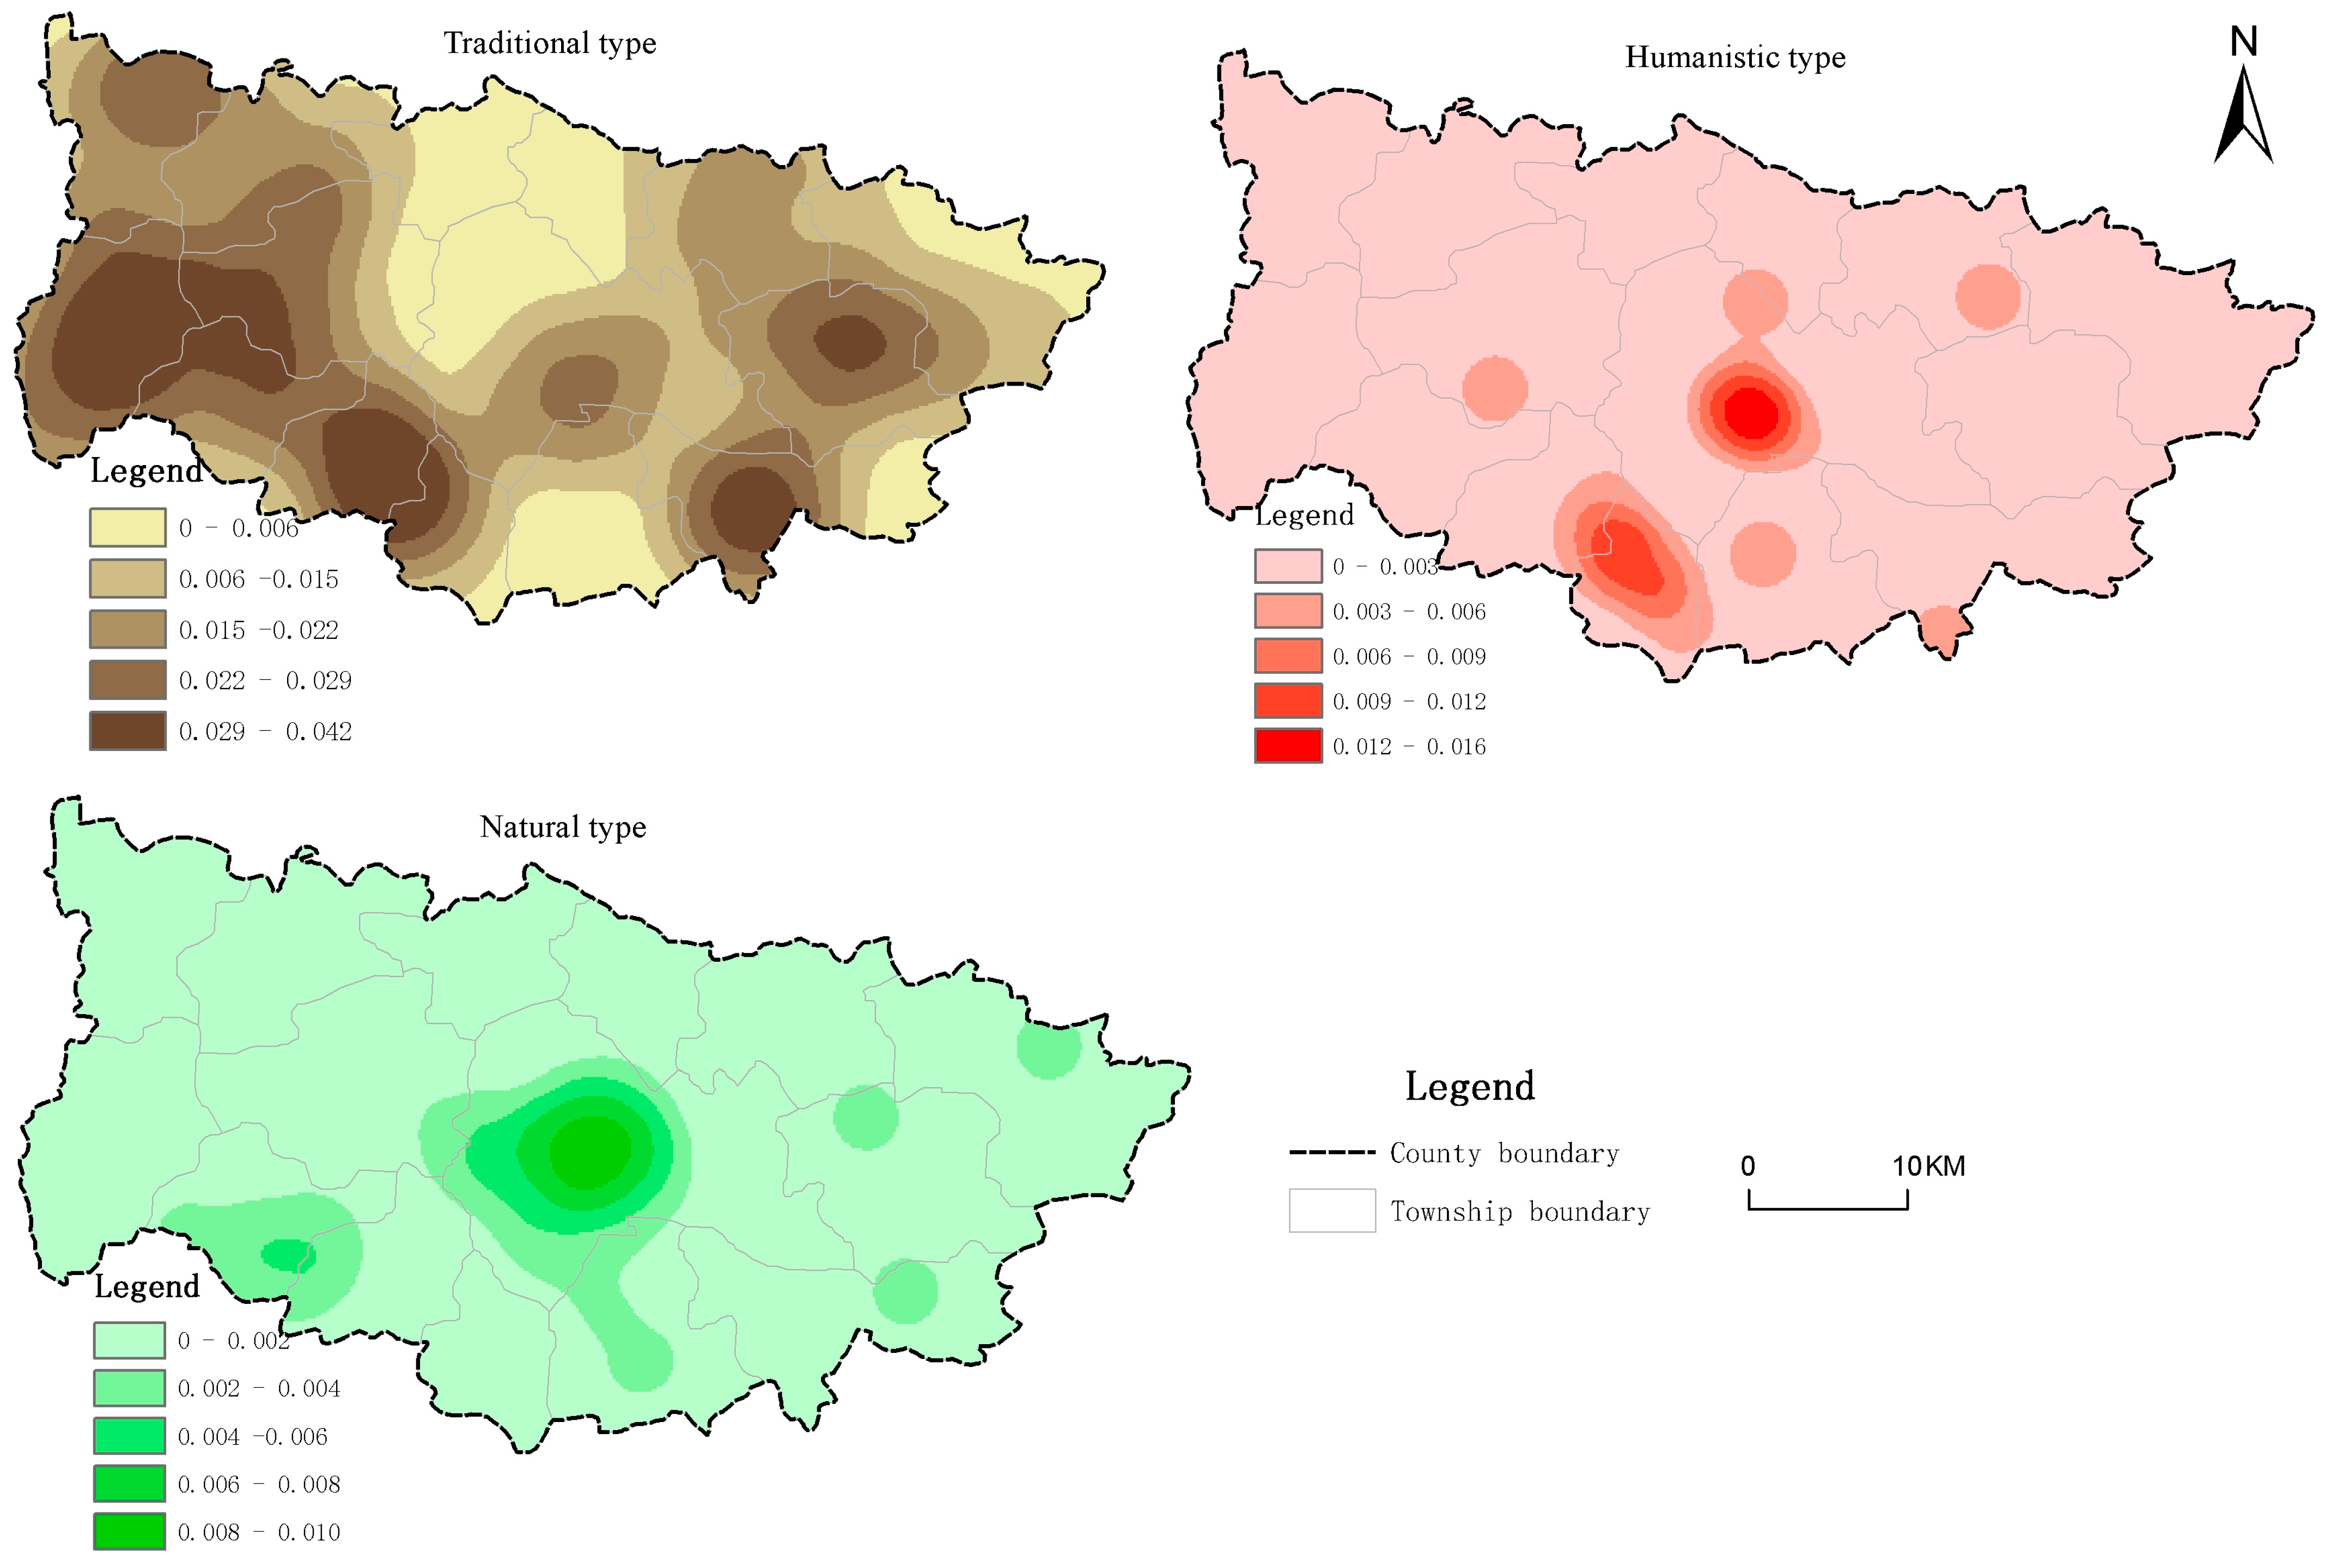
To analyze the spatial distribution characteristics of different types of landscapes, kernel density estimation was used to separately analyze resource- and service-oriented landscapes (Figure 8). Urban and rural resource-oriented landscapes exhibit typical spatial non-equilibrium characteristics, and the spatial patterns of different types of resource-oriented landscapes show significant differences. Among them, the traditional landscape has formed a belt-like distribution pattern with one primary center and three secondary centers and is approximately inclined with a “Z” shape. The primary centers are concentrated in the western triangle formed by Kafang Township, Doushanhe Township, and Guojiahe Township. The three secondary centers formed by Chendian Township, Jianchanghe Township, Zhouhe Township, and Tianpu Township are distributed around the primary center and gradually decrease in density. The lowest value of traditional landscape core density is distributed in Wuchenhe Town and Sidian Township. By identifying the spatial pattern characteristics of natural landscapes, it can be seen that natural landscapes form a typical single-center circle distribution pattern. Specifically, natural landscapes are concentrated in Xinji Town, located in the central area of the study area, while other natural landscapes are scattered in the northeast and southwest regions of the study area. The spatial pattern of humanistic landscape shows a typical dual-center circle distribution structure, which is roughly located in the center of Xinji Town in the middle of the study area and the center of Jianchanghe Township in the southwest region.
From the spatial distribution patterns of different types of resource-oriented landscapes, natural landscapes exhibit a typical single-center circle pattern, cultural landscapes exhibit a typical double-center circle pattern, and traditional landscapes exhibit a typical multi-center belt pattern. From the spatial distribution relationship of three different types of resource-oriented landscapes, it can be seen that natural landscapes and cultural landscapes have spatial distribution consistency, with both being concentrated in the central area of the study area, thus reflecting the spatial correlation and interdependence between the two.

3.2.2. Service-Based Landscapes

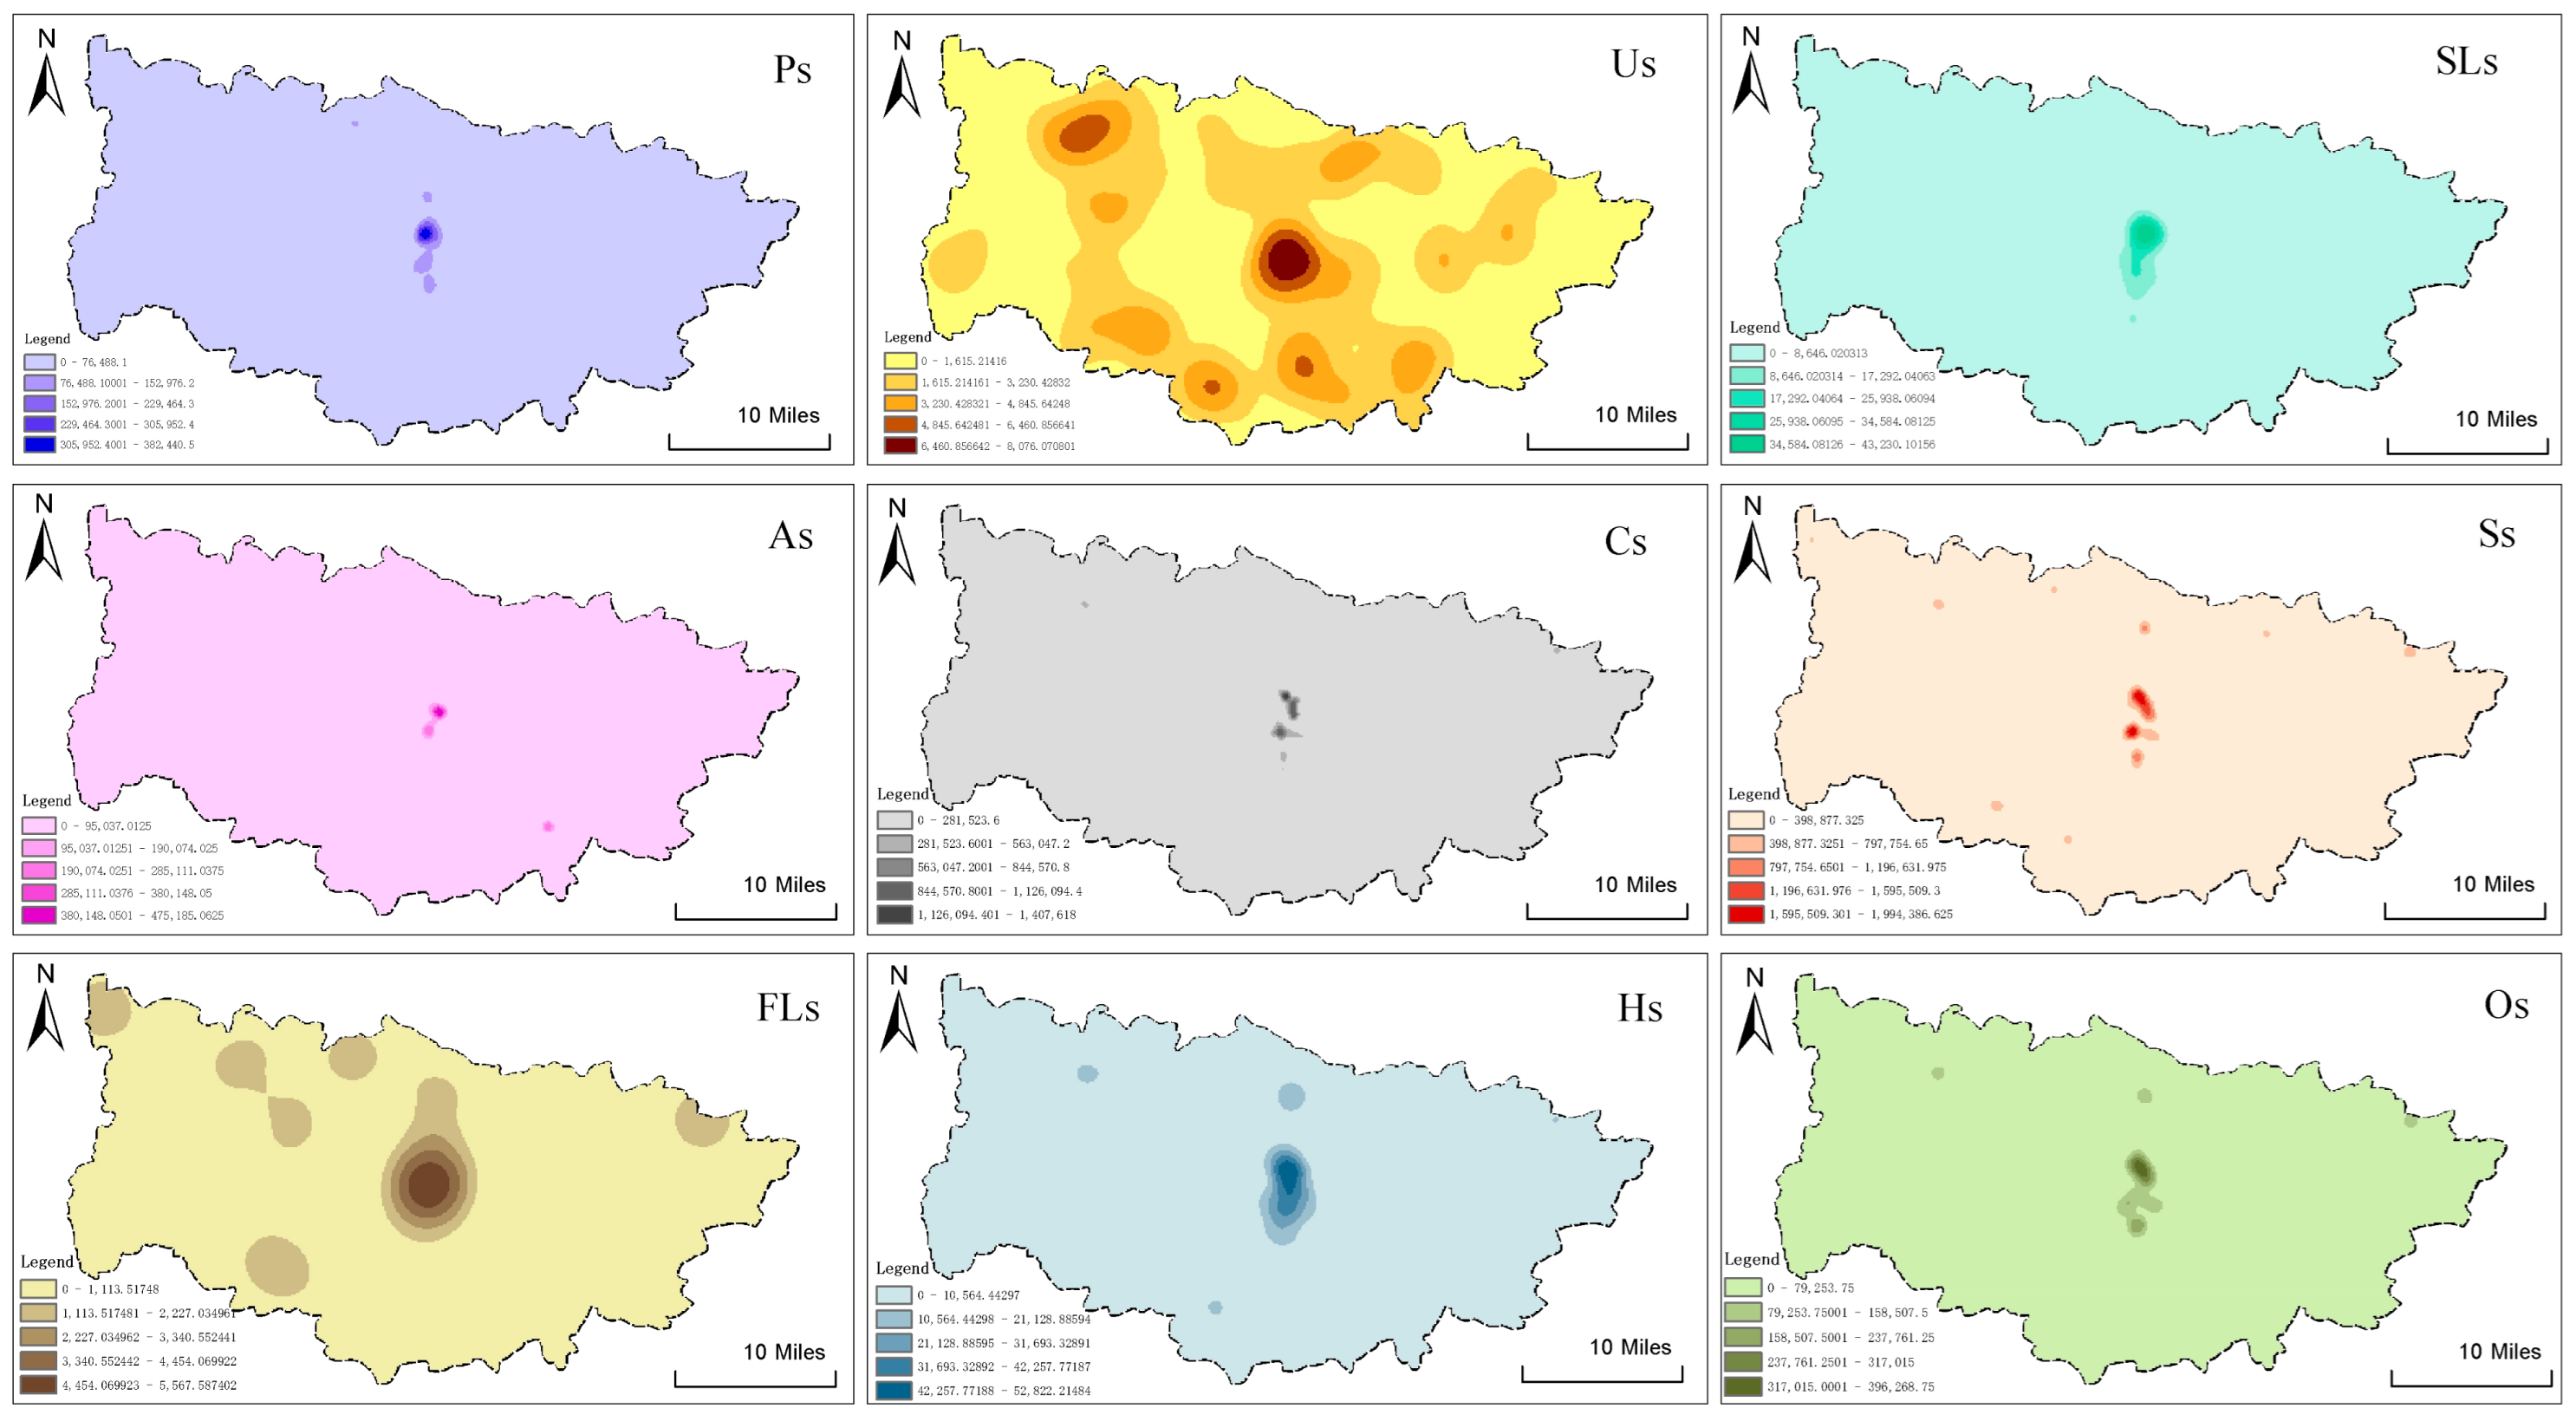
In contrast to resource-oriented landscapes, the spatial pattern of service-oriented landscapes exhibited a pronounced monocentric and aggregated structure, which was sharply focused on the urban core of Xinji Town (Figure 9). The kernel density analysis revealed a single, high-intensity core that accounted for the majority of service provisions, with density values rapidly decaying with increasing distance from the center. This core area integrated all nine service types, thus forming a multifunctional hotspot. A secondary, lower-intensity cluster was identified in the southwestern part of the county, primarily consisting of basic services such as catering (Cs) and shopping (Ss), thus indicating a subordinate service center. The spatial distribution of different service types showed clear stratification: high-order services (e.g., financial FIs and sports–leisure SLs) were almost exclusively located within the primary core, while essential services (e.g., public facility PFs and transit Ps) demonstrated a slightly broader, though still limited, dispersion along major transportation routes. This pattern highlights a critical spatial dependency of service provision on the central urban area, potentially creating significant accessibility barriers for peripheral and rural communities.

3.3. Multi-Distance Gradient Spatial Matching

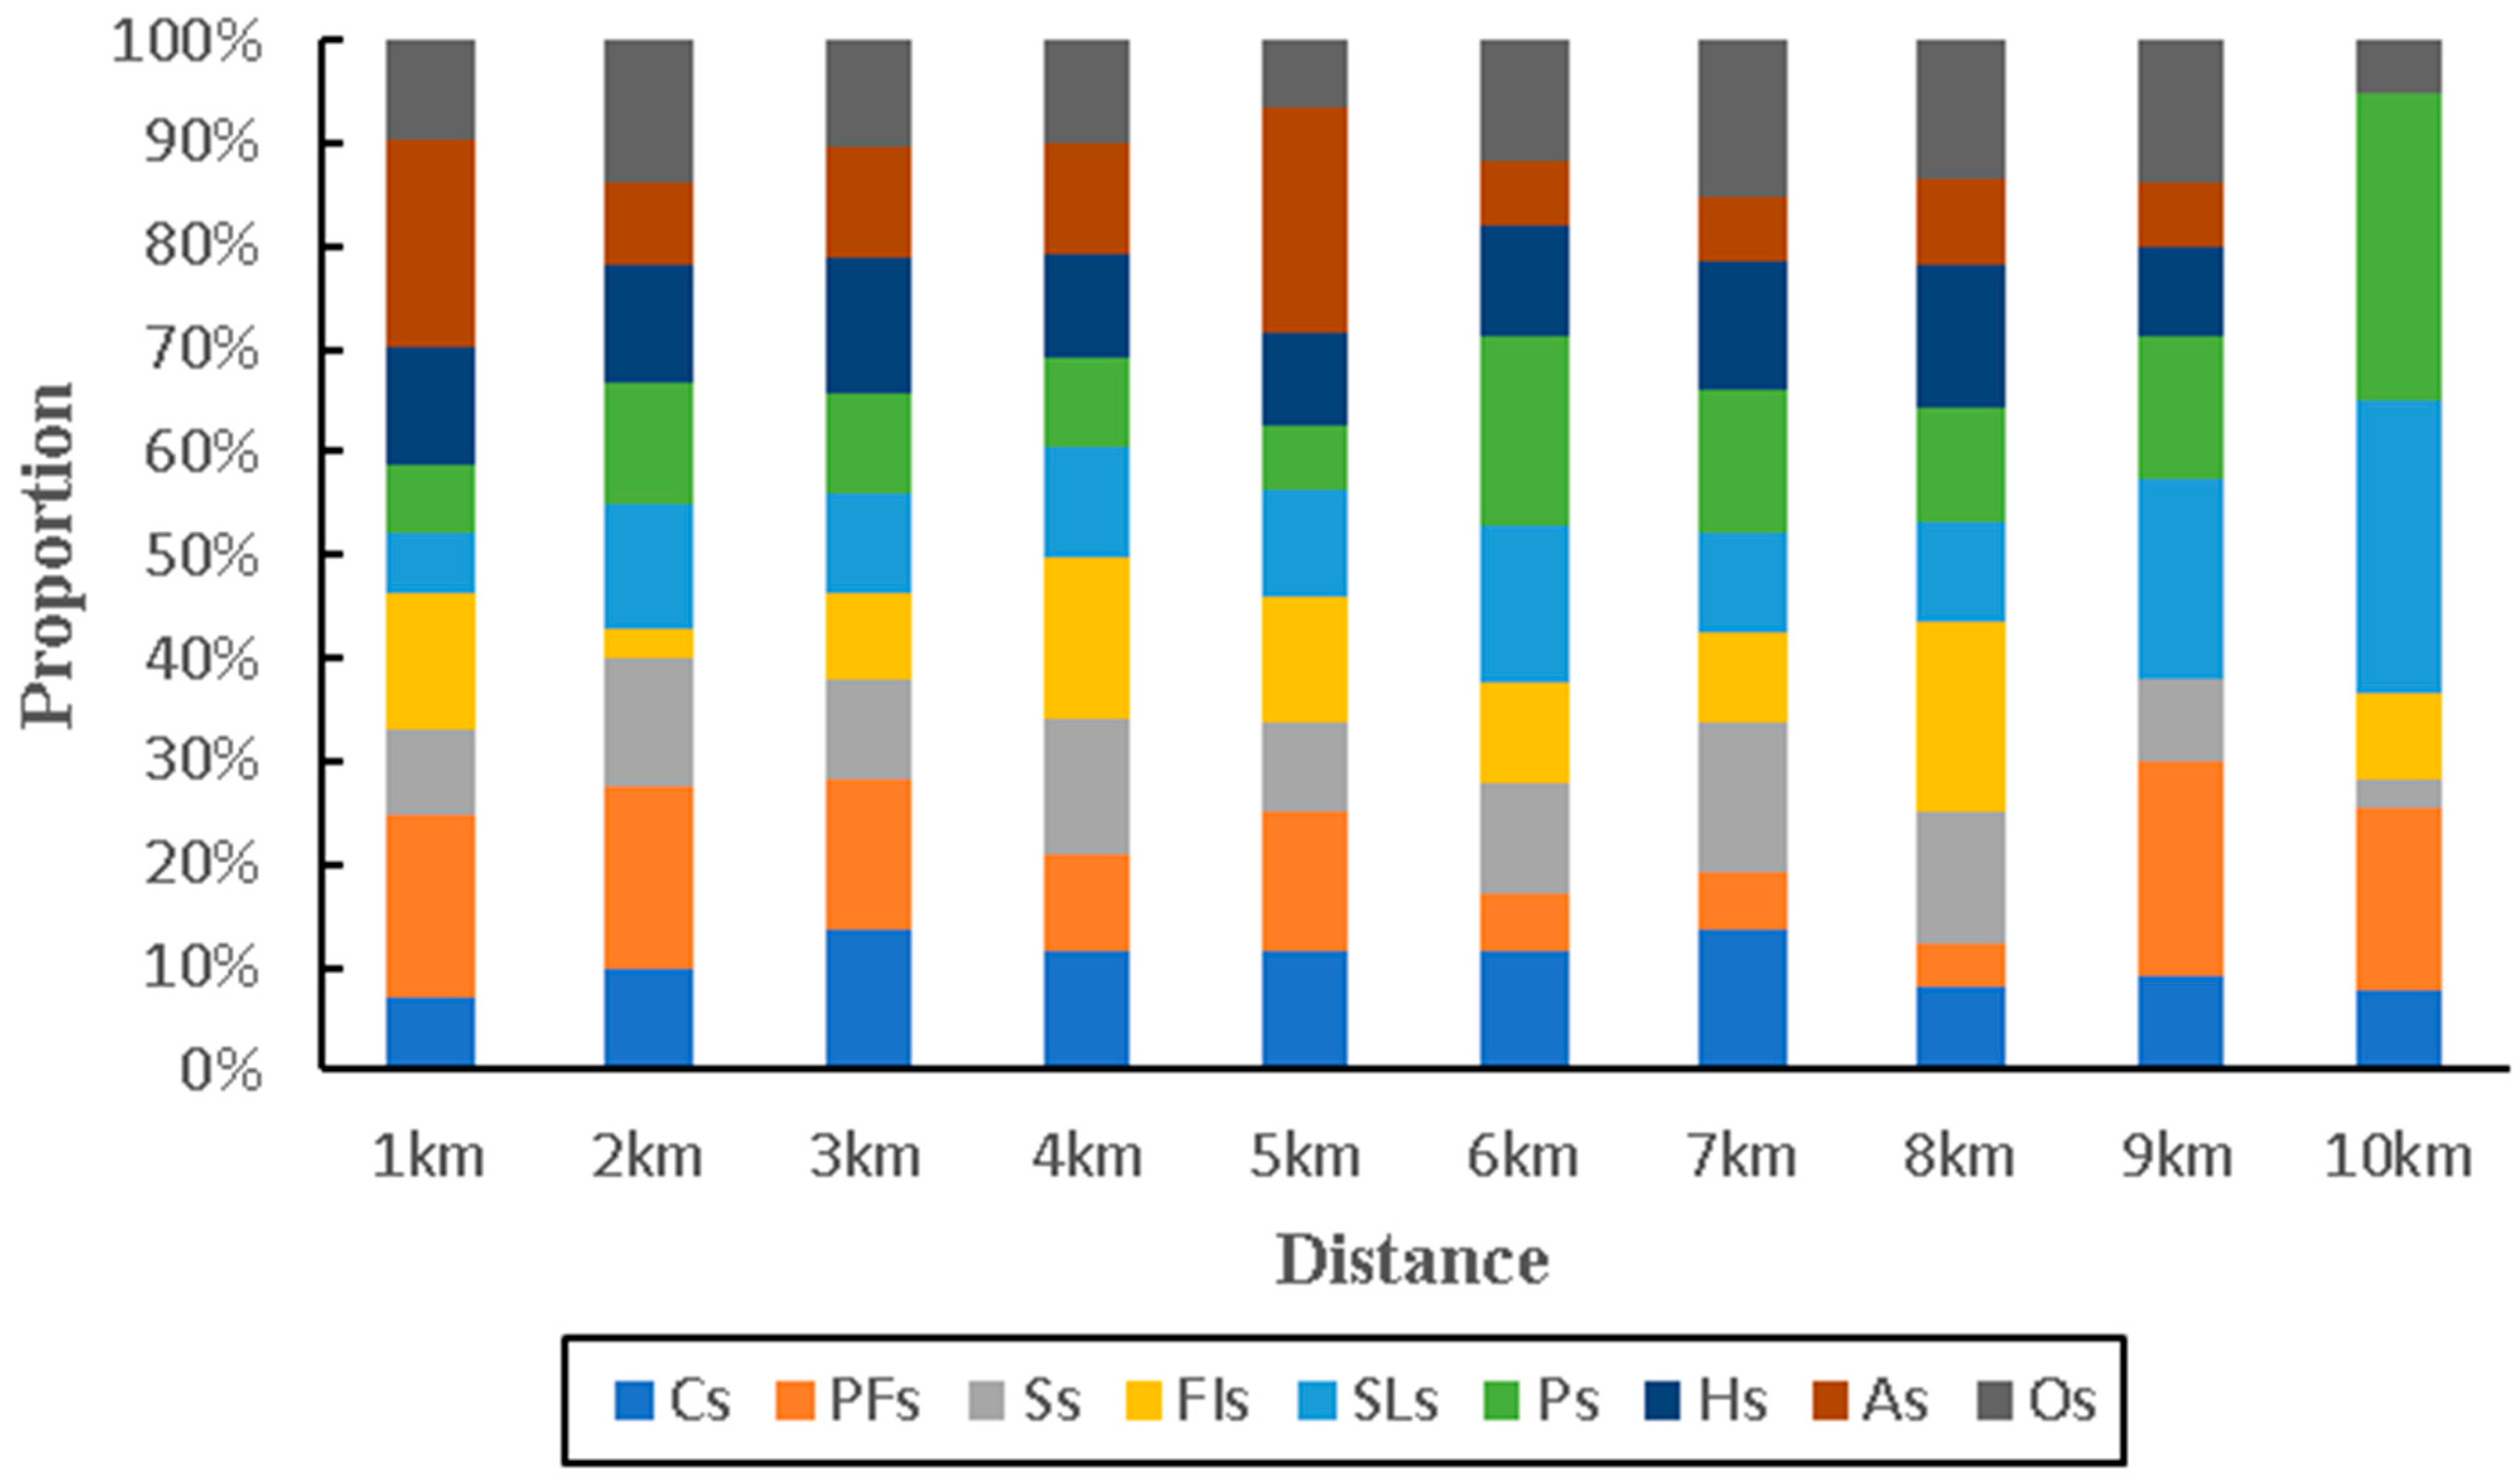
The spatial intersection analysis between buffer zones and service elements at a distance of 1 km along different types of landscapes reveals significant spatial dynamics (Figure 10, Figure 11 and Figure 12). Specifically, the proportion of different service elements within a buffer distance of 3 km in natural landscapes is not significantly different, with PFs exhibiting the smallest proportion, but between 3 and 6 km, the proportion of PFs gradually expands and then decreases and shows a dominant position at 10 km. The proportion of buffer zones between traditional landscapes and different service elements does not show significant differences with distance, exhibiting stable distribution characteristics. The proportion of different service elements within a buffer distance of 3 km for humanistic landscapes is not significantly different, but Cs, Ss, and Ps have a higher proportion compared to other service types. Between 3 and 6 km, the proportion of PFs gradually increases and shows an absolute dominant position at 6 km, followed by a decreasing trend in proportion within 6–10 km. After analyzing the buffer zones of service elements for three types of resources, it can be seen that within a buffer distance of 3 km, there is not much difference in the proportion of all service elements. As the buffer distance continues to increase, the proportion of different service type elements shows a trend of differentiated growth.

4. Discussion

This study empirically bridges the concept of landscape multifunctionality and spatial mismatch theory, providing a scalable framework for diagnosing urban–rural integration challenges. Our findings reveal that multifunctionality is not merely the co-existence of diverse landscape types but a dynamic and often conflicted interplay between resource supply and service demand. The pronounced spatial dissociation we observed—in which dispersed ecological and cultural resources are disconnected from centralized service clusters—echoes the findings in European and Latin American contexts, in which urban-centric development has led to the peripheralization of rural areas [18]. However, our study adds a critical nuance: in ecologically fragile mountainous regions, these mismatches are not just socio-economic but are intrinsically linked to the degradation of regulating ecosystem services. By quantifying these mismatches, we move the multifunctional landscape discourse from a conceptual ideal to a measurable and actionable planning reality.
The distinct spatial patterns observed are the legacies of intertwined natural and human forces. The single-core, high-elevation clustering of natural LRFs is a direct function of topographic constraints, thus confining high-value ecosystems to areas less suitable for human settlement. Conversely, the multi-core “Z-shaped” belt of traditional landscapes is likely a historical artifact, tracing the paths of ancient trade routes and settlement corridors along river valleys, which is a pattern documented in other montane cultural landscapes [31]. As the most critical pattern, the monocentric agglomeration of services is a classic signature of market-driven economies of scale. This creates a core–periphery structure in which the cost-effectiveness of centralizing services in Xinji Town inadvertently generates “service deserts” in the hinterlands. This tension highlights a fundamental planning dilemma: the economic logic of service provision clashes with the geographical reality of distributed resource preservation.
The quantified mismatches serve as robust proxies for systemic environmental and social risks. The low dispersion of natural LRFs in single-core clusters increases their vulnerability to habitat conversion, potentially compromising key regulating services such as soil retention and water purification—a concern paramount in ecological function zones [35]. The fragmentation of traditional landscapes threatens the loss of agro-biodiversity and cultural resilience. Crucially, the sharp decline in service coverage beyond the 3 km buffer, particularly for healthcare and public facilities, translates into tangible accessibility inequalities, thus raising issues of spatial justice for rural communities [13]. Furthermore, the spatial overlap of humanistic and natural landscapes suggests land-use competition, in which the expansion of cultural infrastructure could intensify ecological fragmentation. These findings validate the need to integrate ecosystem service trade-off analyses directly into landscape planning to preemptively mitigate such risks.
This study has limitations that chart a clear path for future inquiry. First, its cross-sectional nature captures a static picture; longitudinal studies tracking the evolution of these mismatches are needed to attribute causality to specific policies or market forces. Second, while POI data powerfully reveals service supply, it cannot capture user perception, demand, or accessibility burdens. Future research must integrate participatory mapping and surveys of residents and tourists to ground-truth our spatial models and incorporate social feasibility into policy design. Finally, the single-case study design, while providing depth, limits generalizability. Applying this integrated framework across a comparative set of mountainous regions will be essential for deriving universally applicable principles for sustainable landscape integration.

5. Conclusions

This study developed and applied an integrated spatial analysis framework to diagnose mismatches between landscape resource functions (LRFs) and service demands (LSFs) in Xinxian County, which is a typical mountainous region undergoing an urban–rural transition. By fusing multi-source data, including POI big data, and employing spatial metrics (NNI, KDE, and multi-ring buffers), we moved beyond a descriptive account to provide a quantifiable, spatially explicit assessment of multifunctional landscape integration. Our analysis confirms a fundamental spatial disconnect: while natural and traditional resources are dispersed or randomly distributed across the terrain, the life services essential for both residents and tourists are intensely clustered in the urban core.
The key contribution of this work is threefold. First, it demonstrates the operationalizability of the “multifunctional landscape” concept at the critical county scale, offering a replicable methodology for pinpointing spatial mismatches. Second, it reveals that these mismatches are not uniform but stratified; the scarcity of high-order services in rural areas is more acute than that of basic services. Third, it establishes that the expansion of humanistic landscapes, while culturally valuable, may compete with ecological corridors, thereby amplifying fragmentation risks.
These findings carry direct implications for sustainable landscape planning. To mitigate the identified risks, we propose three targeted policy actions. ① Prioritize Ecological Connectivity: Conservation planning should explicitly enhance connectivity for natural resource corridors to stabilize regulating services like soil retention and water regulation. ② Optimize Service Allocation: Urban planning should strategically reallocate a subset of LSFs, particularly public facilities and essential healthcare, to peri-urban buffers and key traditional villages to reduce pressure on the central habitat and improve rural accessibility. ③ Integrate Trade-off Analysis: Land-use decisions must formally integrate ecosystem service trade-off evaluations, especially when approving new developments in areas where humanistic landscapes interface with ecological spaces.
Future research should build upon this spatial diagnostic foundation in several directions. A critical next step is to incorporate a temporal dimension to understand the dynamics of these mismatches under rapid urbanization. Furthermore, the insights from spatial data must be enriched with participatory approaches—such as surveys and interviews with residents, tourists, and planners—to validate perceived service deficiencies and assess the social feasibility of the proposed reallocations. Finally, applying this integrated framework to other mountainous regions with varying socio-economic contexts will test its generalizability and refine its principles for balancing development and conservation.

Author Contributions

Conceptualization, Y.W., B.W. and Q.Y.; methodology, B.W.; formal analysis, Y.W. and B.W.; resources, Y.W.; data curation, Y.W.; writing—original draft preparation, Y.W. and B.W.; writing—review and editing, Y.W. and Q.Y.; visualization, B.W. and Q.Y.; supervision, Y.W.; funding acquisition, Y.W. and Q.Y. All authors have read and agreed to the published version of the manuscript.

Funding

This research was funded by Ministry of Education of China Humanities and Social Sciences Research General Project, grant number No. 20YJC630149; the Provincial Natural Science Foundation of Hainan, grant number No. 722QN290; and the Hainan Province Philosophy and Social Science Planning Project, grant number No. HNSK(QN)23-91.

Institutional Review Board Statement

Not applicable.

Informed Consent Statement

Not applicable.

Data Availability Statement

The original contributions presented in this study are included in the article. Further inquiries can be directed to the corresponding author.

Conflicts of Interest

The authors declare no conflicts of interest.

References

  1. Mishra, A.; Bajpai, S.; Bhadwal, S. Nature-Based Solutions for Climate-Resilient Development: A Technical, Policy, and Governance Perspective; Springer: Cham, Switzerland, 2024. [Google Scholar]
  2. Ra’dI, Y.; Nefedkin, N.; Popovski, P.; Alù, A. Nonlinear, Active, and Time-Varying Metasurfaces for Wireless Communications: A perspective and opportunities. IEEE Antennas Propag. Mag. 2024, 66, 52–62. [Google Scholar] [CrossRef]
  3. Lei, W.; Jie, G.U.; Xie, H. Land use pattern and multifunctional evolution in Hunan Province using “production-living-ecosystem” space. Trans. Chin. Soc. Agric. Eng. 2024, 40, 283–293. [Google Scholar] [CrossRef]
  4. Huang, X.; Wu, Z.; Zhu, L.; Li, Y. Accurate identification and trade-off analysis of multifunctional spaces of land in megacities: A case study of Guangzhou city, China. Habitat Int. 2024, 153, 103209. [Google Scholar] [CrossRef]
  5. Li, Y.; Marquez, R.; Xie, L.; Li, X. Evaluating the impact of special additional deductions policy on urban-rural household vulnerability: Insights from China Family Panel Studies. Econ. Anal. Policy 2025, 86, 839–857. [Google Scholar] [CrossRef]
  6. Du, C.; Ge, S.; Song, P.; Jombach, S.; Fekete, A.; Valánszki, I. Optimizing Urban Green Spaces for Vegetation-Based Carbon Sequestration: The Role of Landscape Spatial Structure in Zhengzhou Parks, China. Forests 2025, 16, 679. [Google Scholar] [CrossRef]
  7. Smardon, R.C. Beyond Greenways: The Next Step for City Trails and Walking Routes by Robert Searns (review). Landsc. J. 2024, 43, 133–134. [Google Scholar] [CrossRef]
  8. Correa, C.M.A.; Salomao, R.P.; Ferreira, G.K.R. From green to grey: Unravelling the role of urbanization on diversity of dung beetles in an Amazonian landscape. Urban Ecosyst. 2024, 27, 773–787. [Google Scholar] [CrossRef]
  9. Le, Q.B.; Zucca, C.; Hermassi, T.; Diwediga, B. User-Friendly and Integrated Landscape Simulation Tool for Support Sustainable Land Management Planning in Tunisia. In Euro-Mediterranean Conference for Environmental Integration; Springer: Cham, Switzerland, 2024. [Google Scholar] [CrossRef]
  10. Dacko, S.G.; Xu, W. Impact of Familiarity, Destination-Specific Relevance, and Marketing on Engagement with Augmented Reality Smart Tourism Experiences. In International Conference on Management, Tourism and Technologies; Springer: Cham, Switzerland, 2024. [Google Scholar] [CrossRef]
  11. Shockley, B.; Gengler, J.J. Sharing citizenship: Economic competition, cultural threat, and immigration preferences in the rentier state. Political Sci. Res. Methods 2024, 12, 59–75. [Google Scholar] [CrossRef]
  12. Ebrahim, E.E.M.; Abonazel, M.R.; Shalaby, O.A.; Albeltagy, W.A.A. Studying the Impact of Socioeconomic and Environmental Factors on Nitrogen Oxide Emissions: Spatial Econometric Modeling. Int. J. Energy Econ. Policy 2025, 15, 248–259. [Google Scholar] [CrossRef]
  13. Guevara-Cue, G. Revealing spatial (in) justice: Exploring the dynamics of triple spatiality in Chile and its impact on the generation of spatial barriers to social rights. GeoJournal 2024, 89, 157. [Google Scholar] [CrossRef]
  14. Feng, L.; Hu, J.; Wu, K.; Huang, M.; Hu, M. Investigating the role of green mobility in coupling coordination of urbanization and ecological environment: Evidence from high-speed rail accessibility. Transp. Policy 2025, 170, 24–33. [Google Scholar] [CrossRef]
  15. Barthel, M.; Scott, J.W. Conceptualizing Place Borders as Narrative: Observations From Berlin-Wedding, a Neighbourhood in Transformation. Urban Plan. 2024, 9, 7027. [Google Scholar] [CrossRef]
  16. Su, J.; Huang, T.; Zhao, H.; Li, X. Spatial and temporal dynamics of base flow in semi-arid montane watersheds and the effects of landscape patterns and topography. Environ. Monit. Assess. 2023, 195, 581. [Google Scholar] [CrossRef]
  17. Bamgbade, J.A.; Golly, G.N.A.; Ohueri, C.C. Sociopolitical economy and spatial accentuation of neighbourhood gentrification in East Malaysia. J. Hous. Built Environ. 2024, 39, 49–75. [Google Scholar] [CrossRef]
  18. Jonas, T.; Macht, G.A. Analyzing the urban-rural divide: Understanding geographic variations in charging behavior for a user-centered EVSE infrastructure. J. Transp. Geogr. 2024, 116, 103859. [Google Scholar] [CrossRef]
  19. Chen, K.Z.; Mao, R.; Zhou, Y. Rurbanomics for common prosperity: New approach to integrated urban-rural development. China Agric. Econ. Rev. 2023, 15, 1–16. [Google Scholar] [CrossRef]
  20. Tang, S.; Cui, J.; Zhou, L. Reflection on Popular Concepts of Landscape Design. J. Landsc. Res. 2023, 15, 67–69. [Google Scholar]
  21. Du, L.; Liu, H.; Liu, H.; Liu, W.; Quan, Z.; Zhang, Y. Value Assessment and Prediction of Regulating Ecosystem Services in Hainan Tropical Rainforest National Park, China. Sustainability 2024, 16, 9170. [Google Scholar] [CrossRef]
  22. Yang, G.; Wang, L.; Huang, H. Characteristics of Urban–Rural Integration at the County-Scale Interface: The Case of Linqu County, China. Land 2024, 13, 1999. [Google Scholar] [CrossRef]
  23. Chen, G.; Zhao, J.; Duan, X.; Tang, B.; Zuo, L.; Wang, X.; Guo, Q. Spatial Quantification of Cropland Soil Erosion Dynamics in the Yunnan Plateau Based on Sampling Survey and Multi-Source LUCC Data. Remote. Sens. 2024, 16, 977. [Google Scholar] [CrossRef]
  24. Longyin, H.U.; Cheng, J. Spatial Distribution Characteristics and Convenience of Urban Catering Industry Based on POI Data: A Case Study of Nanjing, Jiangsu Province. Geogr. Geogr. Inf. Sci. 2024, 40, 78. [Google Scholar] [CrossRef]
  25. Li, T.; Feng, Q.; Niu, B.; Chen, B.; Yan, F.; Gong, J.; Liu, J. Mapping urban villages based on point-of-interest data and a deep learning approach. Cities 2025, 156, 105549. [Google Scholar] [CrossRef]
  26. Garba, I.I.; Bell, L.W.; Chauhan, B.S.; Williams, A. Optimizing ecosystem function multifunctionality with cover crops for improved agronomic and environmental outcomes in dryland cropping systems. Agric. Syst. 2024, 214, 103821. [Google Scholar] [CrossRef]
  27. Zhao, W.; Li, Y.; Wang, Q.; Shao, J. Coupling mechanism for rural multifunctional development and rural settlement evolution in mountainous areas of China. Trans. Chin. Soc. Agric. Eng. 2024, 40, 259–270. [Google Scholar] [CrossRef]
  28. Huang, Y. The geographical evolution of sports cultural landscapes in historical and cultural research. GeoJournal 2025, 90, 186. [Google Scholar] [CrossRef]
  29. Clemente, M. Street Tree Redevelopment in Rome’s Historical Landscapes: From Strategic Vision to Streetscape Design. Land 2025, 14, 233. [Google Scholar] [CrossRef]
  30. Le Vot, T.; Cohen, M.; Nowak, M.; Passy, P.; Sumera, F. Resilience of Terraced Landscapes to Human and Natural Impacts: A GIS-Based Reconstruction of Land Use Evolution in a Mediterranean Mountain Valley. Land 2024, 13, 592. [Google Scholar] [CrossRef]
  31. Jayakody, D.; Adams, V.; Pecl, G.; Lester, E. What makes a place special? Understanding drivers and the nature of place attachment. Appl. Geogr. 2024, 163, 103177. [Google Scholar] [CrossRef]
  32. Upadhyay, N.; Sharma, A. Understanding and Recreating Historical Landscapes through Oral History, Architectural and Archival Research—A Methodology: The Case of the Royal Gardens of Rajnagar, Bundelkhand. J. Herit. Manag. 2018, 2, 202–220. [Google Scholar] [CrossRef]
  33. Zeng, C.; Liu, P.; Huang, L.; Feng, S.; Li, Y. Features of architectural landscape fragmentation in traditional villages in Western Hunan, China. Sci. Rep. 2023, 13, 18633. [Google Scholar] [CrossRef]
  34. Shi, S.; Zhou, J.; Chen, X.; Xu, Y.; Tao, J. Risk Assessment of Geological Disasters Triggered by Heavy Rainfall in Mountainous Areas: A Case Study in Hebei Province, China. Appl. Ecol. Environ. Res. 2025, 23, 5443–5460. [Google Scholar] [CrossRef]
  35. Yuan, H.; Fan, J.; Luo, J.; Ren, R.; Li, H. Study on Urban System Relationships and Resilience Promotion Strategies in Underdeveloped Mountainous Areas Based on Social Network Analysis: A Case Study of Qiandongnan Miao and Dong Autonomous Prefecture. Land 2025, 14, 1500. [Google Scholar] [CrossRef]
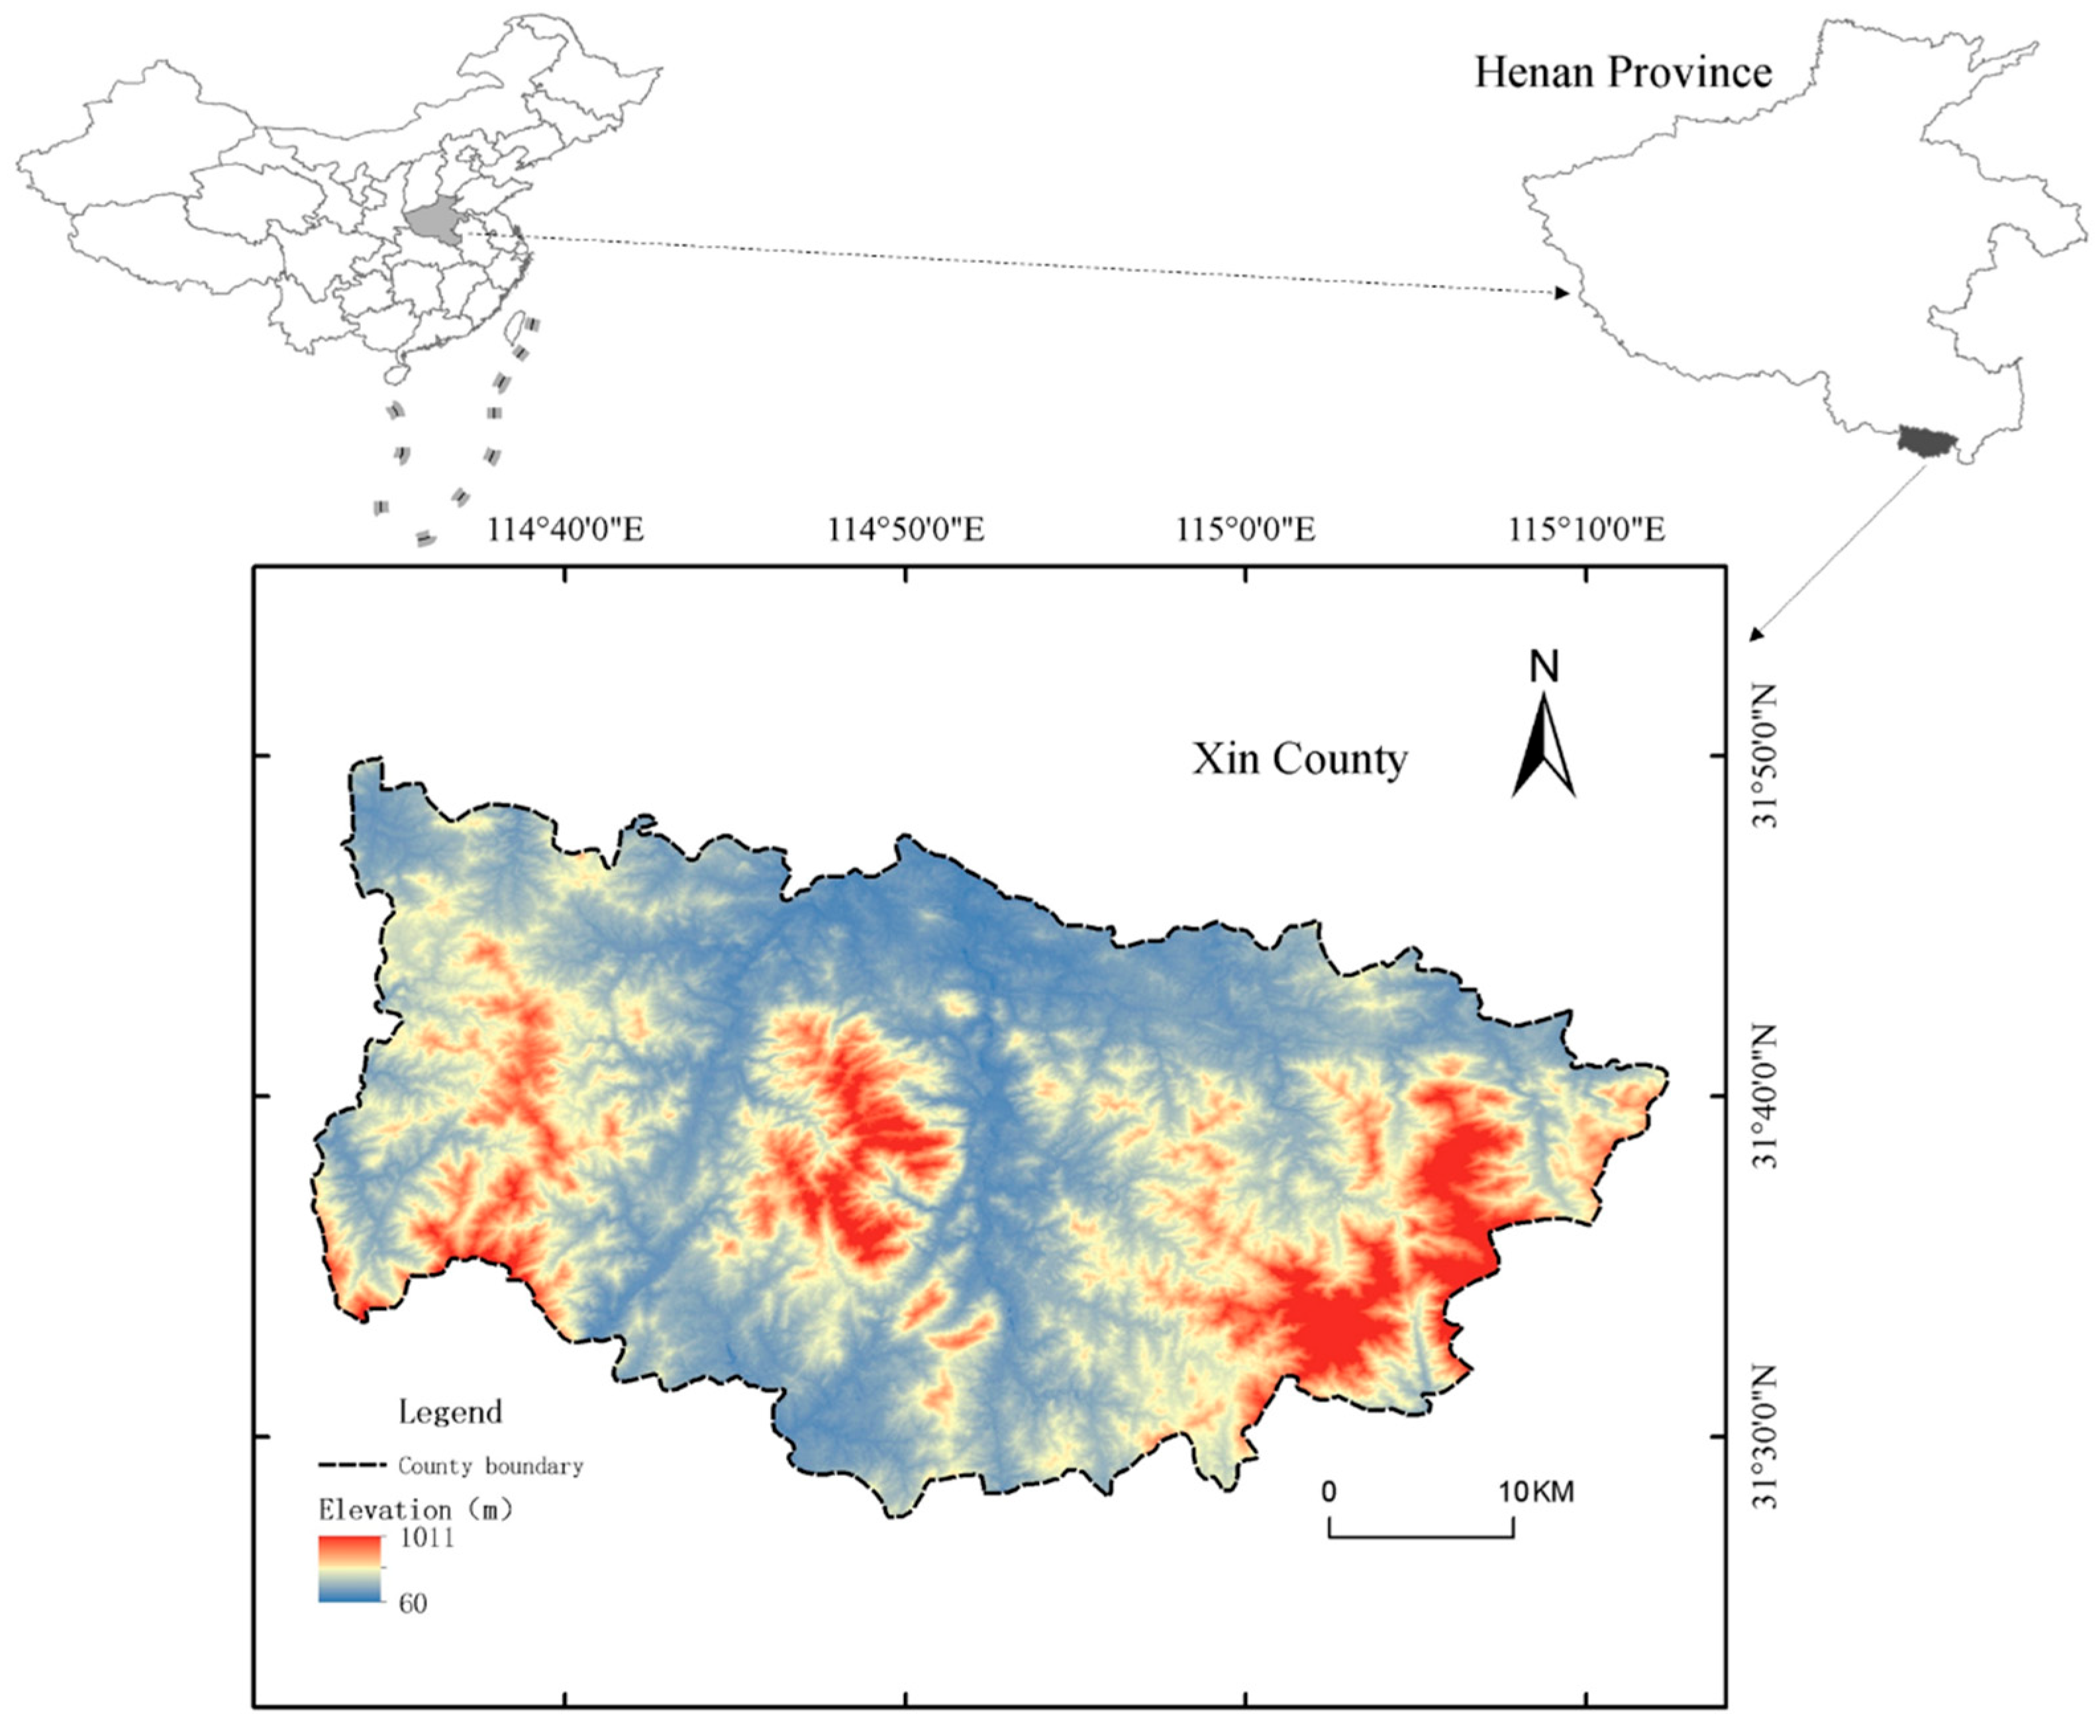
Figure 1. Location and elevation of study area.
Sustainability 17 09934 g001
Figure 2. Analysis framework of multidimensional characteristics of study area.
Sustainability 17 09934 g002
Figure 3. Spatial distribution of resource-oriented landscapes.
Sustainability 17 09934 g003
Figure 4. Distribution of service-based landscape diversity based on POI big data.
Sustainability 17 09934 g004
Figure 5. Composition of POIs.
Sustainability 17 09934 g005
Figure 6. Theoretical framework for understanding spatial functional diversity based on integration of resources and services.
Sustainability 17 09934 g006
Figure 7. Differences in topographic distribution of different resource types.
Sustainability 17 09934 g007
Figure 8. Kernel density of different types of resource-oriented landscapes.
Sustainability 17 09934 g008
Figure 9. Kernel density of different types of service-oriented landscapes.
Sustainability 17 09934 g009
Figure 10. Multi-distance gradient space buffer matching of natural landscape and service-oriented landscapes.
Sustainability 17 09934 g010
Figure 11. Multi-distance gradient space buffer matching of traditional landscape and service-oriented landscapes.
Sustainability 17 09934 g011
Figure 12. Multi-distance gradient space buffer matching of humanistic landscape and service-oriented landscapes.
Sustainability 17 09934 g012
Table 1. Basic information about data sources.
DatasetData ContentResolutionData source
Geographic dataDEM and land-use remote sensing monitoring dataGridhttps://www.gscloud.cn/
Management data Administrative boundaries, national highways, and other spatial dataSpatial linear vector dataNational Geomatics Center of China
http://www.ngcc.cn
Statistical dataUrban and rural landscape statistical dataStatistical valuesLocal management and statistical departments
Network big dataPOIsSpatial point dataBaidu Map https://map.baidu.com
Table 2. Types of service-based landscapes.
IDTypeSubtypeNumber
1Catering services (Cs)Hotels, restaurants, restaurants, fast food restaurants, tea houses, farmhouse restaurants, and other catering-related services836
2Public facility services (PFs)Public toilets287
3Shopping services (Ss)Shopping malls, shopping malls, supermarkets, convenience stores, farmers markets, specialty stores, etc.2314
4Financial insurance service (FIs)Banks, ATMs, postal savings, rural credit cooperatives, etc.85
5Sports and leisure services (SLs)Leisure venues, sports venues, theaters, resorts and recuperation venues, entertainment venues, etc.127
6Passing services (Ps)Railway stations, bus stations, parking lots, car rental and maintenance, motorcycle rental and maintenance, high-speed exits, high-speed entrances, gas stations, etc.379
7Healthcare services (Hs)Hospitals, disease control centers, 120 emergency centers, health centers, clinics, pharmacies, etc.236
8Accommodation services (As)Hotels, guesthouses, hostels, homestays, etc.227
9Other services (Os)Beauty salons, telecommunication business halls, photography shops, logistics outlets, lottery sales, other life service departments, etc.665
Table 3. Classification characteristics of multifunctional landscape space in urban and rural areas.
Functional CategoryClassificationType CharacteristicsType ExplanationType ContentType Quantity
Resource-oriented landscapeHumanistic typeUniqueness, stability, non-renewability, etc.Humanistic-type resources are highly dependent on historical figures and events and have uniqueness; they have long-term stability and cannot be replicated or regenerated.Cultural landscape complex with red historical activities, red historical figures, red historical relics, and other resources as the main body14
Natural typeRestrictiveness, centralization, compatibility, etc.Natural-type resources generally have ecological characteristics and limitations in their utilization. They have a strong dependence on natural geographical conditions and are relatively concentrated in space. In terms of utilization, they have strong compatibility with other types of tourism resources.Natural landscape resources mainly composed of geographical landscapes, water landscapes, etc.15
Traditional typePotentiality, scarcity, adaptability, etc.The internal and external value of traditional-type resources is constantly being explored and has potential. Antique tourism resources with certain regional characteristics are relatively scarce. The development of traditional villages requires protective transformation to be revitalized.Traditional landscape resources mainly consisting of traditional villages, rural cultural and historical relics, rural buildings and facilities, etc.30
Service-oriented landscapeService-oriented typeUniversality, scalability, variability, etc.Service-oriented type spaces are widely present in urban and rural landscape resource spaces, often on a large scale, and their utilization types change under certain conditions.A functional space that provides services for tourism activities such as catering, public facilities, shopping, transportation, and medical care5156
Table 4. Multifunctional distribution pattern of urban and rural landscape space.
TypeSamplesAverage Nearest Neighbor Distance (m)Expected Average Nearest Neighbor Distance (m)Nearest Neighbor Index (NNI)Distribution Pattern
Humanistic resource-oriented144426.02873306.39011.338629Low dispersion type
Natural resource-oriented154882.95263545.491.377229Low dispersion type
Traditional resource-oriented303581.30063590.46540.997447Random type
Catering service type836145.381692705.0245810.206208High concentration type
Public facility service type287835.0669281262.9644130.661196Low agglomeration type
Shopping service type231456.416709437.6329260.128913High concentration type
Financial and insurance service type85394.958152021.9756510.195333High concentration type
Sports and leisure service type127916.1398871667.0472080.549558Low agglomeration type
Passing service type379224.7703721071.4088880.20979High concentration type
Healthcare service type236481.7985451262.7758210.381539High concentration type
Accommodation service type227358.5314571214.8317530.295128High concentration type
Other service type665142.755136769.6721790.185475High concentration type
Disclaimer/Publisher’s Note: The statements, opinions and data contained in all publications are solely those of the individual author(s) and contributor(s) and not of MDPI and/or the editor(s). MDPI and/or the editor(s) disclaim responsibility for any injury to people or property resulting from any ideas, methods, instructions or products referred to in the content.