Abstract
The study aims to evaluate the impact of climate change on pasture ecosystems in Central Kazakhstan, particularly within the Karaganda and Ulytau regions. The assessment combines remote sensing indicators (NDVI, LST) with long-term climatic datasets (CRU TS v4.09 and national meteorological records) for the period 2000–2024. Non-parametric statistical methods, including the Mann–Kendall trend test, Sen’s slope estimator, and Pettitt’s test, were applied to identify the direction, intensity, and structural shifts in temperature and precipitation trends. The results indicate significant regional warming, especially during summer and spring, alongside spatially inconsistent precipitation changes. The southern and southwestern areas (Zhezkazgan and Satpayev) show intensified aridization, manifested in rising land surface temperatures, decreasing rainfall, and declining vegetation productivity and exacerbated by anthropogenic pressures. Conversely, the eastern and northeastern regions exhibit stable or increasing NDVI values and moderate precipitation growth, suggesting potential for natural recovery. The study concludes that pasture degradation in Central Kazakhstan is driven by combined climatic and human factors, with pronounced spatial heterogeneity. The integrated approach enhances the reliability of climate impact assessments and provides a scientific basis for developing adaptive and region-specific strategies for sustainable pasture management under ongoing climate change.
1. Introduction
Pastures, defined as extensive grazing lands dominated by natural or semi-natural non-forest vegetation, occupy approximately half of the Earth’s terrestrial surface [1]. They provide essential ecosystem services to society, including the preservation of cultural identity, livestock forage supply, climate regulation, and disease control [2]. Indeed, low-cost pasture forage plays a crucial role in the global production of affordable meat, dairy products, leather, and wool [3].
Scientific evidence confirms that climate change significantly contributes to pasture degradation. Rising average temperatures and altered precipitation patterns increase drought frequency and reduce soil moisture, directly limiting forage productivity and herbage biomass [4].
Disruption of hydrothermal conditions leads to reduced vegetation cover, loss of drought-sensitive species, and a decline in overall biodiversity of pasture landscapes [4,5]. According to a study published in Nature, anthropogenic climate change has already caused degradation of approximately 12.6% of the world’s drylands (around 5.43 million km2), contributing to desertification processes and affecting over 200 million people [6].
Arid and semi-arid pastures in Africa, Central Asia, Australia, and China are particularly vulnerable, with long-term satellite observations indicating a consistent decline in vegetation productivity [7,8]. The negative trends of the NDVI (Normalized Difference Vegetation Index) in these territories indicate chronic depletion of vegetation and disruption of ecosystem functioning.
The synergy of climatic stressors and anthropogenic pressure is a critical driver of degradation. Intensive livestock grazing under conditions of reduced climatic productivity leads to pasture overuse, vegetation depletion, and accelerated degradation processes [9]. This creates a self-reinforcing cycle: environmental deterioration leads to reduced forage capacity, resulting in overgrazing and further degradation.
Modeling under the RCP8.5 scenario projects a 4.7% decrease in average pasture biomass and a 21% increase in interannual variability by 2050. Approximately 74% of global pastures are expected to experience productivity declines, with half facing both reduced biomass and greater instability. The Sahel, Australia, Mongolia, northern China, and Central Asia are identified as the most vulnerable regions, where these changes pose significant risks to livestock production, particularly in underdeveloped areas with limited adaptive capacity [10].
An analysis of meteorological data reveals significant climatic variability in Central Asia during the period 1997–2013, despite the absence of a discernible long-term warming trend. This 15-year period has been identified as the warmest in the last five decades. While precipitation remained relatively stable from 1960 to 1986, a marked increase occurred in 1987, followed by a decline since the early 2000s. These shifts in meteorological conditions are already having an impact on natural ecosystems. Pasture ecosystems are highly sensitive to climatic variability and anthropogenic pressures, making them vulnerable to degradation. Timely monitoring of their condition and productivity decline requires the use of remote sensing techniques. The Normalized Difference Vegetation Index (NDVI) has proven to be a reliable and widely used indicator of vegetation dynamics, enabling the assessment of productivity, detection of degradation processes, and analysis of their relationship with climatic and land-use factors [11,12].
Modern research shows significant progress in applying NDVI to assess land degradation and pasture productivity. For example, Li et al. [13] presented the global dynamics of land productivity with high spatial resolution, linking the results with the UN SDG indicators. Jiang et al. [14] identified global degradation hotspots and demonstrated the contribution of climatic and anthropogenic factors to productivity decline. In turn, Purevjav et al. [15] concluded based on a large-scale analysis that climatic conditions are the main determinant of pasture productivity, while the role of overgrazing turned out to be less significant than previously thought. These results are complemented by studies aimed at assessing not only the quantitative but also the qualitative characteristics of pastures. Serrano et al. demonstrated the potential of using Sentinel-2 NDVI data to assess feed quality (protein, fibre and moisture content). Furnitto et al. [16] presented an overview of modern remote sensing methods, summarising the potential of NDVI indices and other spectral indicators for monitoring both biomass and forage value of pastures.
NDVI analysis for the period 1982–2013 demonstrated a positive trend prior to 1998 (0.004/decade), which subsequently reversed to a negative trend after 1998 (−0.003/decade). A warming of 0.93 °C since 1997, relative to the 1960–1997 average, has reduced water availability, thereby worsening conditions for vegetation growth across the region [17,18,19].
Scientific studies based on the analysis of the NDVI confirm persistent degradation processes on Kazakhstan’s pastures. Between 1993 and 2007, a significant decline in NDVI values was observed across a large portion of pasturelands: up to 24% of the country’s area showed a steady decrease in vegetation productivity. In contrast, improvement was recorded on only 11–12% of the territory, indicating a predominance of negative trends [20]. According to Dubovyk et al. [21], in 2000, 2008, 2010, 2011, 2012 and 2014, more than 50% of the territory of Kazakhstan suffered from drought of varying degrees. The droughts of 2012 and 2014 were the largest droughts in terms of area of distribution. Han W. et al. [22] (2000–2022) investigated the loss and restoration of vegetation as a result of drought in Central Asia using a comprehensive vegetation index. According to the TVDI (Temperature Vegetation Dryness Index) analysis, the dry conditions in the region peaked in 2012 (0.6398) and 2019 (0.6377). In both years, vegetation in arid areas was mostly exposed to severe drought, while moderate drought prevailed in semi-arid areas. Taking these issues into account, the period from 2000 to 2024 was selected to assess the impact of climate change on pasture ecosystems in Central Kazakhstan.
Pasturelands represent the dominant form of agricultural land use in the Republic of Kazakhstan, covering an area of 183.2 million ha, which accounts for 83.6% of all agricultural land in the country. Of this, 5.7 million ha are classified as improved pastures, while 104.8 million ha are designated as irrigated or watered pastures [23].
Despite the presence of significant areas of farmland, their current state is of serious concern. According to space monitoring data, more than 87% of the pasture territories of Kazakhstan, including the Central Region, are in unsatisfactory or extremely unsatisfactory condition. The main reasons are land degradation, desertification processes and low productivity of hayfields [24].
Central Kazakhstan is a region characterised by a predominance of dry-steppe and semi-desert pastures, which form the basis of the fodder base for traditional extensive animal husbandry. The area of pastures in this region is 35.2 million ha, which corresponds to 19% of the total pasture area of the republic. Concurrently, pasture lands occupy in excess of 80% of the total area of Central Kazakhstan [25].
In recent decades, Central Kazakhstan has been experiencing steady negative climatic changes: an increase in average annual temperatures, a decrease in precipitation, and an increase in droughts. In combination with anthropogenic factors such as overgrazing, lack of rotation and soil compaction, there is a significant deterioration in the condition of pastures [26,27]. These processes lead to land degradation, loss of biodiversity, and reduced forage capacity, ultimately undermining ecosystem resilience and agricultural productivity [28]. Animal husbandry is an important sector of the region’s economy and is particularly sensitive to these changes. A shortage of feed remains a key limiting factor in productivity, particularly during dry periods.
This study aims to assess the spatial and temporal impact of climatic and anthropogenic factors on pasture ecosystems in Central Kazakhstan by analysing remote sensing data and the NDVI. This will help to identify key degradation trends and the factors that determine a decrease in productivity and forage potential.
Despite a significant increase in the number of publications on climate change and land degradation in Central Asia, a number of significant gaps remain. First, studies of pastoral ecosystems in Central Kazakhstan are fragmentary and limited to individual administrative regions, without taking into account spatial and temporal dynamics. Second, remote sensing data has not been well integrated with meteorological observations to identify the complex effects of climatic factors on the condition of pastures. Third, there is no systematic assessment of the impact of climate trends on pasture productivity in the long term. This study aims to fill these gaps and offers a spatio-temporal analysis of pasture ecosystems in Central Kazakhstan based on long-term satellite data and climate indicators, which allows us to identify patterns of degradation processes, assess their link to climate change, and propose scientifically sound recommendations for sustainable pasture management.
Study Area
Central Kazakhstan, located in the central part of the republic, includes Karaganda and Ulytau oblasts. Its length is 600 km from north to south and 1100 km from east to west, with an area of 427.98 thousand km2. The region borders Akmola and Pavlodar oblasts in the north, Abai and Almaty oblasts in the east, Zhambyl, Turkestan and Kyzylorda oblasts in the south, Aktobe and Kostanay oblasts in the west. Lake Balkhash is located in the south-east (Figure 1). The total length of the region’s borders is about 4 thousand km.
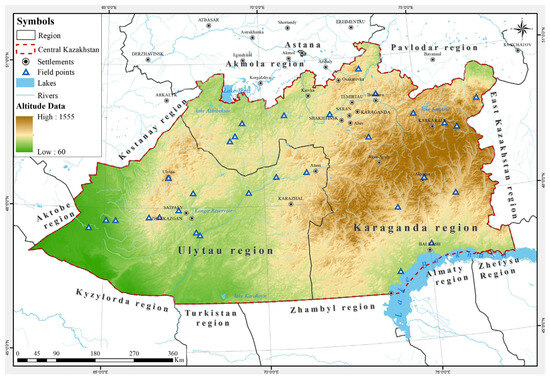
Figure 1.
Location of the study area showing administrative boundaries and field survey points.
The region has a continental climate with a high degree of aridity. Average annual temperatures range from −2 °C in the north to +6 °C in the south, with summer highs reaching +40–45 °C and winter lows dropping to −35 °C. Annual precipitation varies between 130 and 310 mm, peaking in spring. Evapotranspiration significantly exceeds precipitation levels, resulting in moisture deficits and pronounced dryness. Precipitation decreases from 300–350 mm in steppe areas to 200 mm or less in desert zones, averaging around 260 mm across the region.
Central Kazakhstan falls within a zone of insufficient moisture, characterised by low air humidity and limited precipitation. The average annual absolute humidity is 5.9 mb, dropping to approximately 1.5 mb in January–February and rising to 10.4–11.7 mb in June. Relative humidity ranges from 45–55% in winter (peaking at 80–82%), falling to 20–23% in summer (e.g., in the Betpak-Dala area). The average annual humidity deficit ranges from 5.0–5.5 mb in the north to 7.5–9.5 mb in the south.
The region’s hydrographic network is poorly developed. The major rivers Sarysu, Nura, Kengir and Zhezkazgan are predominantly seasonal and typically dry up in summer. Lakes are also temporary and play a limited role in supporting the water needs of pasturelands.
The soil cover is mainly made up of chestnut soils, grey soils and light chestnut soils, which have a low humus content (1.5–2.5%), are highly alkaline and are susceptible to deflation when vegetation is disturbed.
Vegetation cover consists of grass–typchak–wormwood associations, which are dominated by narrow-leaved cereals and wormwood. Moistened depressions contain meadow communities with Pyrenean sedge and herbaceous species. The pasture fund includes dry steppes and desert areas; sandy lands account for up to 25% of the territory.
Pasture productivity varies from 1.5–2.0 c/ha in dry years to 5–6 c/ha under favourable moisture conditions. However, in recent years there has been a downward trend in productivity due to soil and vegetation degradation caused by climate change and overgrazing. Geobotanical surveys have recorded a decrease in forage cereals and an increase in the proportion of inedible and poisonous species.
In terms of natural landscape zoning, the region encompasses dry steppe and semi-desert landscapes characterised by wormwood and sagebrush grasslands, barren northern landscapes, saline steppes and sandy areas in the south, and meadow steppe lowlands alongside temporary watercourses. There are also technogenically disturbed areas with soil degradation and reduced biodiversity in industrial zones such as Zhezkazgan, Saran and Temirtau.
The main forage lands comprise natural dry steppe pastures dominated by sagebrush (Festuca valesiaca), Stipa lessingiana and S. capillata, as well as Artemisia spp.; semi-desert pastures with Agropyron fragile and ephemera; and meadow pastures with Elytrigia repens, Carex spp. and Poa spp.
2. Materials and Methods
This study was based on data collected during a comprehensive investigation of pasturelands in Central Kazakhstan from 2000 to 2024. It incorporated field notes and observations on vegetation dynamics and biodiversity status in degraded pasture ecosystems. Remote sensing techniques, including the calculation of Land Surface Temperature (LST) and NDVI, were employed to assess vegetation condition and evaluate spatiotemporal changes.
Temperature regime and dynamics (LST). MODIS data from May to August were used to assess temperature conditions during the active period of vegetation growth. Five temperature zones were identified on maps showing the average LST values. Annual composites were generated from MODIS satellite imagery with an 8-day periodicity to calculate the mean land surface temperature for the period 2000–2024. Temperature values, originally presented on the Kelvin scale with a scaling factor of 0.02, were converted to degrees Celsius using the corresponding formula.
where
LST(°C) = (LSTDN × 0.02) − 273.15
- LSTDN—pixel value in the raster (integer);
- 0.02—MODIS scaling factor;
- 273.15—conversion to the Celsius scale.
After bringing all the values to a single scale, an operation was performed to calculate the average temperature value for each pixel over the entire period. The averaging was carried out arithmetically according to the formula:
Each component represents the temperature value for a specific year. The resulting average temperature distribution was classified into five ranges: 20–25 °C, 25–30 °C, 30–35 °C, 35–40 °C, and 40–45 °C. The classified raster was visualized as a thematic map, with each temperature range represented by a distinct color.
To assess the long-term trend of LST, annual mean surface temperature values were generated for each year. A time series of 25 values (2000–2024) was constructed for each pixel. A linear trend model was then fitted to each time series in the form:
where y is the temperature value, t is the year index, a is the slope coefficient, and b is the intercept of the trend line. The slope coefficient a indicates the rate of temperature change over time: a positive value reflects a warming trend, while a negative value indicates cooling.
y = a·t + b
The slope coefficient value was calculated using the linear regression formula:
where is the ordinal number of the year, is the temperature value in this year, is the total number of years (25).
Based on the values of the trend slope, each pixel was categorised according to the following scheme:
- a > 0—significant warming);
- 0 < a ≤ 0.1—slight warming;
- −0.1 ≤ a < 0–0.1—(slight decrease);
- a < −0.1—significant cold snap.
Precipitation regime and its changes. Rainfall has a critical impact on vegetation growth and development, especially in areas with insufficient moisture. For this analysis, ERA5-Land climate model data for the May–August period were used, enabling the assessment of both mean values and their temporal trends.
To calculate the spatial distribution of mean annual precipitation and its trend over the period 2000–2024, Formulas (1) and (2) were applied. The resulting data were classified by value and visualized as a thematic map using a color scale ranging from green (lowest values) to violet-brown (highest values).
For precipitation trend analysis, an approach similar to that used for LST trends was applied. A time series was constructed for each pixel, and a linear trend model was then calculated according to Formula (3).
The calculated precipitation trend values were classified into three categories: increasing precipitation (positive slope values), no significant change (values near zero), and decreasing precipitation (negative slope values). On the resulting map, these classes were color-coded: blue-green tones indicate an increase, light yellow represents stability, and brown shades signify a decline in precipitation.
The present study was based on data obtained from Kazhydromet bulletins [29], statistical yearbooks of the National Bureau of Statistics of the Republic of Kazakhstan [30], and the Ministry of Agriculture, as well as meteorological records on air temperature and precipitation for the period 2000–2024. To assess the spatiotemporal variability of precipitation during the growing season (May–September), continuous long-term observations from regional meteorological stations (1994–2024) were analyzed.
In this study, along with data from weather stations, global climate data from CRU TS v4.09 (Climatic Research Unit Time Series) were used. These data were used because a significant number of meteorological stations in the region under study do not have continuous and sufficiently long observation series, or they have significant gaps.
The CRU TS dataset is a global grid-based climate database with a spatial resolution of 0.5° × 0.5° (~55 km), including information on air temperature, precipitation and other climate variables for the period from 1901 to the present [31].
To increase the reliability of the analysis, CRU TS 4.09 data were compared with archival materials from the National Hydrometeorological Service of Kazakhstan (Kazhydromet). Comparative analysis showed satisfactory agreement between interannual temperature and precipitation fluctuations, confirming the applicability of this dataset in Central Asia. As noted in a number of recent studies, CRU TS data are widely used in climatic and hydrometeorological research in the region and are recognised as a reliable source of information for analysing spatio-temporal climate change in Central Asia [32,33].
Furthermore, remote sensing data were employed as a validation tool, thereby enhancing the accuracy and reliability of the results. This integrated approach facilitated a comprehensive evaluation of pasture conditions and the identification of degradation trends under changing climatic and anthropogenic pressures.
Non-parametric analysis of time series. To identify the presence and direction of trends in long-term time series of climatic parameters, the non-parametric Mann–Kendall test was applied [34]. Its advantage lies in the absence of assumptions regarding data normality and its robustness to outliers. The test determines whether a time series exhibits a statistically significant trend by comparing each pair of observations and identifying the direction of their change. A positive test statistic indicates an increasing trend, whereas a negative value reflects a decreasing trend, while the p-value represents the statistical significance of the result.
The magnitude of temporal change was estimated using Sen’s slope method [35]. This method is related to nonparametric methods and calculates the median value of all paired angular coefficients between the points in the series. Therefore, slope estimation is robust to outliers and abnormal values, providing a reliable indication of the rate of change over time. In climate research, this enables changes in temperature or precipitation to be expressed in units per year, allowing the intensity of trends to be compared between stations and periods.
To detect abrupt changes in the distribution within time series, the Pettitt test was additionally applied [36]. It belongs to the class of non-parametric homogeneity tests and is used to detect a single change point within a data sequence. The method is based on rank analysis and identifies the position in the time series where a shift in the mean level of the studied variable most likely occurred. This allows for the detection of possible structural changes associated, for example, with alterations in the climatic regime or the influence of anthropogenic factors.
2.1. Field Data and NDVI Validation
During the 2024 field survey, 30 key sites were established, where a detailed analysis of pasture degradation levels was carried out. For each site, the vegetation species composition, projective cover, and aboveground biomass (determined by the clipping method) were assessed within reference plots of 15 m2. To validate the satellite-derived data, the mean annual NDVI for 2024 was used. Point NDVI values corresponding to the locations of the field sites were used to establish Pearson correlation relationships between NDVI and three indicators: species composition, projective cover, and aboveground biomass (Figure 2).
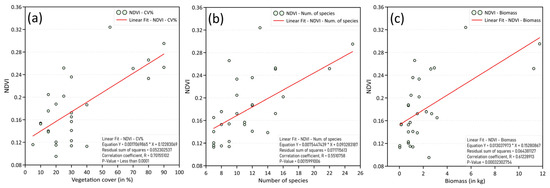
Figure 2.
Correlation between NDVI and field-based vegetation indicators: (a) projective cover; (b) species richness; (c) aboveground biomass.
The observed relationships between NDVI and field measurements demonstrate statistically significant positive associations with a sample size of n = 30. The strongest correlation was found for canopy cover (R = 0.70, p < 0.0001), indicating a high sensitivity of the spectral index to the structural density of the vegetation cover. The relationship with biomass is also significant (R = 0.61; p < 0.0003), while the correlation with species composition is moderate but significant (R = 0.55; p < 0.001). Thus, NDVI can serve as a proxy indicator of the condition of the pasture cover in Central Kazakhstan.
2.2. Limitations and Uncertainties
The data used in this study are derived from multiple sources at different spatial and temporal scales. These sources include satellite-based vegetation and surface temperature indicators (MODIS NDVI/LST), climate reanalyses and gridded observations (CRU TS, ERA5-Land) and spatial–statistical analyses (OLS trends, Mann–Kendall tests, Sen’s slope and NDVI–PREC/NDVI–LST correlations). Several inherent uncertainties were identified and, where possible, minimised.
Spatial resolution and pixel mixing. MODIS data (with a resolution of ~1 km) inevitably reflects the mosaic nature of pasture landscapes. The ‘soil–vegetation’ mixture that is typical of semi-arid steppes can distort the Normalized Difference Vegetation Index (NDVI) (soil background effect), while the land surface temperature (LST) is highly sensitive to bare soils and solonetz areas. To reduce pixel noise, seasonal composites and robust trend estimators were employed; however, the effects of sub-pixel heterogeneity cannot be fully eliminated.
Cross-scale comparability of climate data: The spatial resolution of CRU TS (0.5°) and ERA5-Land is coarser than that of MODIS. Interpolation under the sparse meteorological network of Central Kazakhstan introduces region-specific uncertainties. Interannual variability patterns in the CRU data were compared with Kazhydromet archives and showed acceptable agreement. Nevertheless, the accuracy of the absolute values and local trends should be interpreted with caution, particularly in orographically diverse areas and deserts.
3. Results and Discussion
The region has significant pastureland, accounting for over 80% of its agricultural land, including 18.5 million ha in the Karaganda region and 8 million ha in the Ulytau region. In some areas, such as Ulytau, pastures account for 96.3% of the land. The main types of pasture are steppe and semi-desert on chestnut soils.
Pasture productivity varies greatly across the region due to differences in temperature, soil fertility, precipitation and soil moisture conditions. Typically, yields range from 0.5 to 4.9 c/ha. In Central Kazakhstan, cattle, horses, sheep, and goats primarily graze on pastures. In particular, in spring and early summer, animals graze around populated areas and horses roam freely in the pastures [37].
The results of the analysis revealed significant disparities in pasture availability across the regions of Central Kazakhstan as shown in Figure 3. The Bukhar-Zhyrau district had the largest area of pastures within settlements (4354.9 thousand ha), which significantly exceeded the corresponding figures for other districts. High values were also observed in the Ulytau (2103.9 thousand ha) and Shet (1884.0 thousand ha) districts, indicating a strong potential for pasture husbandry development. Conversely, low availability of pasturelands was recorded in the Abai (126.7 thousand ha) and Osakarov (134.6 thousand ha) districts, which may have limited the potential for intensive cattle breeding in these areas. These results underscored the need for an adaptive land-use policy aimed at the rational allocation and restoration of pasture resources to address regional imbalances.
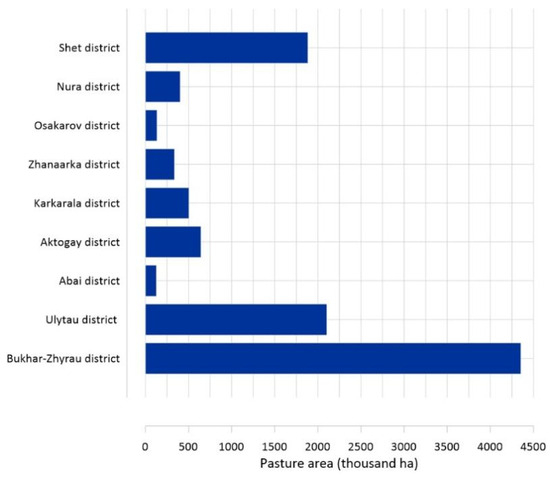
Figure 3.
Area of pastures in settlements in Central Kazakhstan districts (thousand ha).
The rational use of pastures is directly related to the number of farm animals and their grazing load [26,38]. The imbalance between the bearing capacity of land and the number of livestock leads to accelerated degradation of vegetation, especially in an arid climate. Based on statistical data for the period from 1998 to 2023, there are clear trends in the number of cattle, as well as sheep and goats in the districts of the regions of Central Kazakhstan. Current information as of 2024 is presented in Figure 4 below.
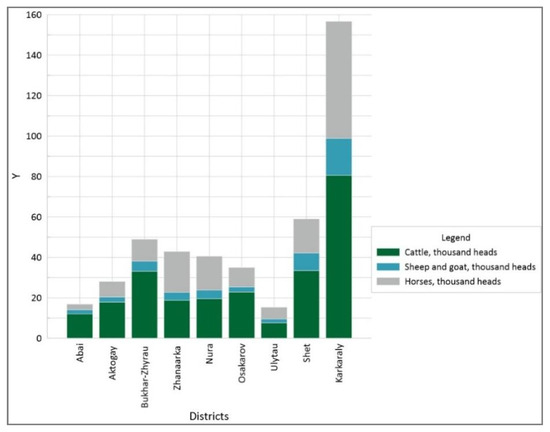
Figure 4.
Livestock numbers in households, including cattle, sheep, goats, and horses (thousand head).
Statistical calculations based on these data show that the need for pastureland varies considerably across the districts of Central Kazakhstan.
As shown in Figure 5, the largest required volume of pastures is recorded in the Karkarala district (1723.6 thousand ha) due to the high number of livestock and favourable natural and climatic conditions for grazing. A significant need is also noted in the Shet (650.1 thousand ha) and Bukhar-Zhyrau (538.8 thousand ha) districts, where cattle breeding is one of the leading agricultural activities.
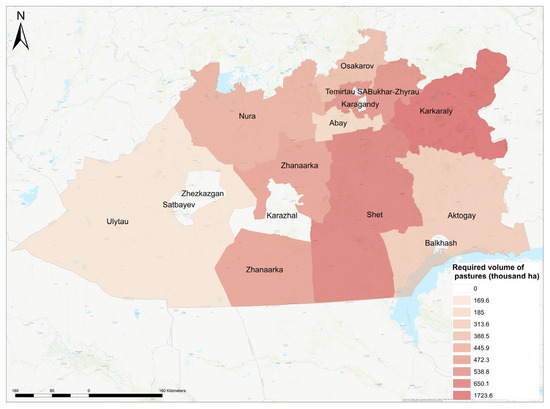
Figure 5.
Required volume of pastures by districts of Central Kazakhstan, thousand ha.
At the same time, the lowest values are recorded in the Ulytau (169.6 thousand ha) and Abai (185.0 thousand ha) districts. This may be due to lower population and livestock density, as well as the area’s partial specialisation in other agricultural sectors. These differences emphasise the need for a differentiated approach to managing pasture resources depending on territorial specifics.
In the context of the progressive development of the livestock sector in Central Kazakhstan’s districts, there has been a steady increase in the number of cattle and small ruminants over the last 25 years. This growth, particularly evident in the Shet, Aktogay, Zhanaarka and Ulytau districts, positively impacts the production of meat and dairy products, thereby strengthening the region’s agrarian economy. However, alongside the economic benefits, the increase in livestock numbers has a significant impact on pasture resources.
Firstly, an increase in livestock leads to increased anthropogenic pressure on rangelands [39]. A high risk of land degradation, including trampling, loss of vegetation cover and acceleration of desertification processes, is present in areas with a deficit of available pasture area (e.g., Osakarov and Abai). If grazing intensity exceeds the natural capacity of vegetation to regenerate, it leads to a decrease in biological productivity and the deterioration of the forage base.
Secondly, the imbalance between the demand for and the actual availability of pasture is particularly pronounced in areas where there is active growth in the livestock population but limited land. For instance, Karkaraly district requires 1723.6 thousand ha of pasture, yet only around 500 thousand ha are available, creating a significant burden and necessitating urgent measures to restore and expand pasture areas.
Thirdly, an increase in the number of livestock requires an improvement in pasture management systems. Measures such as introducing rotational grazing systems, zoning pastures, monitoring land conditions using remote sensing and digitalising land records become relevant.
In addition, the significant difference in the availability of pasture resources across different regions highlights the need for regional planning and targeted support. Where pastures are abundant (for example, in the Ulytau district), programmes can be implemented to increase livestock production. In areas where pasture resources are scarce, the focus should be on restoring ecosystems and optimising the structure of agricultural production.
To ensure the effective use of the Republic’s pastures, the Law of the Republic of Kazakhstan ‘On Pastures’ was adopted in 2017. This law requires each rural district to develop a five-year pasture management plan and regulates livestock numbers [40]. In 2023–2024, amendments were made and the concept of ‘public pastures’ was introduced: land plots around villages intended for the communal grazing of residents’ livestock. Local Akimats are now authorised to seize underutilised pasture land from farmers and transfer it to villagers who lack land. The usage requirements have also been tightened; whereas previously it was sufficient to use at least 20 percent of the provided pasture area, now at least 50 per cent must be used otherwise the plot can be confiscated. These measures are intended to ensure an even distribution of the load.
The disparities in pasture availability and demand across districts of Central Kazakhstan are closely linked to natural and climatic conditions that influence pasture productivity. To better understand the drivers of pasture condition, key climatic and biophysical indicators were analyzed. The study examined LST trends, the spatial distribution of precipitation, temporal and spatial changes in the NDVI, and the relationship between climatic factors and NDVI dynamics.
Temperature regime and dynamics (LST). LST is a key climatic parameter that directly affects moisture evaporation, microclimate and the bioproductivity of ecosystems [41,42].
The average land surface temperatures in the region show a consistent prevalence of high values, particularly in the southern and western areas. As illustrated in Figure 6, much of the Ulytau region and neighboring districts of Karaganda region (Zhezkazgan, Satpayev, Ulytau, Karazhal, Atasu, Balkhash) experience temperatures ranging from 35–40 °C, with extreme values of 40–45 °C observed in the southwestern and southernmost parts. These figures reflect the presence of an arid, sharply continental climate marked by prolonged hot and dry summers. Such conditions exert significant pressure on natural resources, particularly water, soil, and vegetation while increasing the risk of pasture degradation, soil desiccation, reduced agricultural productivity, and desertification.
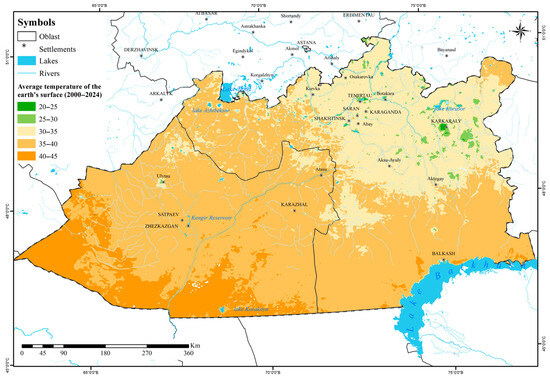
Figure 6.
Average Land Surface Temperature in Central Kazakhstan (2000–2024).
In contrast, the central districts (Abai, Aktogay, Shet) exhibit moderate temperatures between 30–35 °C, representing a transitional zone. While these areas still hold agricultural potential, emerging negative climatic trends suggest a need for adaptive approaches, including climate-resilient technologies and heat-tolerant crop varieties.
Favorable temperature conditions are observed in the northeastern part of Karaganda region, particularly in the districts of Karkaraly, Osakarov, and Botakara, as well as near major water bodies such as Lake Balkhash, Lake Tengiz, and Lake Karkaraly. Temperatures in these areas generally range from 25 to 30 °C, occasionally decreasing to 20–25 °C. This is due to the influence of natural buffer ecosystems such as mountain forests, wetlands, and lakes, which contribute to the formation of local microclimates with lower temperatures and higher humidity. These areas have high ecological and water-regulating potential and play an important role in sustainable land use and maintaining biospheric balance.
Figure 7 shows the long-term trend in land surface temperature, reflecting the dynamics of thermal change over the study period. Significant warming is observed across large areas in the south and west of the region, particularly in the Ulytau region and neighboring districts of the Karaganda region, including Zhezkazgan, Ulytau, Satpayev, Karazhal, and parts of the Balkhash area. These zones also exhibit the highest average temperatures, indicating a continued intensification of thermal stress. The combination of high current temperatures and a persistent upward trend sharply increases the climatic vulnerability of these areas. These zones are also characterized by the highest mean temperatures and show an increase in thermal stress over the observation period (Figure 8d). The combination of high temperatures and a persistent upward trend (0.146 °C yr−1; p < 0.0001) sharply heightens the climatic vulnerability of these areas (Table 1).
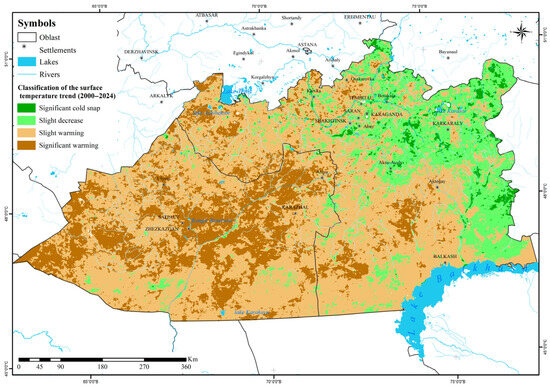
Figure 7.
Land Surface Temperature Trend in Central Kazakhstan (2000–2024).
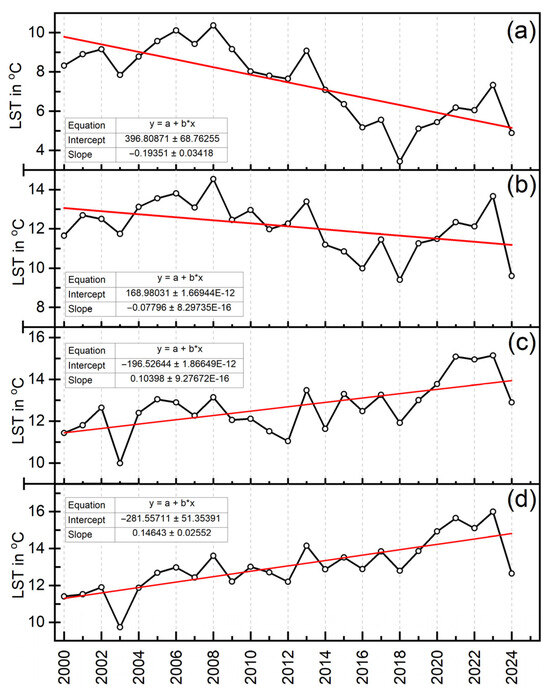
Figure 8.
Long-term changes in LST (°C) and the OLS linear trend (2000–2024): (a) significant cold snap; (b) slight decrease; (c) slight warming; (d) significant warming; the red lines represent the OLS linear trend.

Table 1.
OLS regression results for LST showing intercepts, trend slopes (°C yr−1), and their statistical significance, reflecting the direction and intensity of surface temperature changes.
In the central part of the region, a moderate warming trend prevails (Figure 8c). Although the increase is less pronounced, the positive trajectory 0.103 °C yr−1 (p < 0.0009) suggests a potential decline in climatic conditions over time without adaptive interventions (Table 1). These areas remain suitable for agriculture, provided that modern water management techniques, drought-tolerant crops, and artificial irrigation systems are implemented.
In the northeastern part of the region, particularly in Karkaraly, Osakarov, and parts of Botakara districts, a trend of temperature decline is observed, including zones of significant temperature decline (Figure 8a,b). However, the area with a substantial temperature decline (−0.193 °C yr−1; p < 0.0001) covers only about 8800 km2, or roughly 2% of the study area, whereas modest decreases with a multi-year slope of −1.76 °C per 25 years encompass 18% of the territory, predominantly in the northeastern sector (Table 1). These areas serve as important climatic buffers, highlighting the need to preserve forests, limit human impact, and strengthen conservation measures. Forest and lake ecosystems also support the retention of water resources and biodiversity.
The distribution and dynamics of precipitation in the Ulytau and Karaganda regions from 2000 to 2024 reveal key climatic patterns that directly influence the water balance, agricultural productivity, and environmental sustainability of the region. Analysis of average annual precipitation maps and long-term trends allows for the following conclusions.
Figure 9 illustrates a clear zonal pattern in average annual precipitation across the region. The driest areas, located in the south and southwest (Zhezkazgan, Satpayev, Karazhal, and south of Lake Karakoyin), receive less than 200 mm annually, indicating an arid, sharply continental climate. Low precipitation combined with high evapotranspiration creates conditions highly prone to soil degradation, limiting land use to extensive grazing under significant climatic risk.
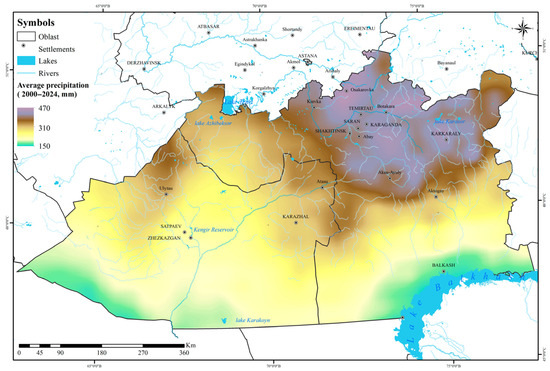
Figure 9.
Average Annual Precipitation in Central Kazakhstan (2000–2024).
Central districts such as Abai, Aktogay, Shet, and Karazhal receive 250–310 mm of precipitation, characteristic of a semi-arid climate with unstable moisture regimes. While droughts and short-term heavy rains are common, the area retains moderate agricultural potential with appropriate water-saving technologies and resilient crops.
The most humid zones lie in the northeast (Karkaraly, Osakarov, Botakara, Karaganda, Temirtau), where precipitation reaches 450–470 mm. These conditions support steppe and forest-steppe ecosystems, favoring agriculture and conservation. Forests, mountains, and lakes in this area play a critical role in microclimate regulation, water retention, and biodiversity preservation.
The precipitation trend map (Figure 10) for 2000–2024 reveals spatially heterogeneous patterns. A consistent decline in precipitation is observed in the southern, southwestern, and western areas, including Zhezkazgan, Satpayev, Ulytau, and Karazhal. This intensifies existing arid conditions, reduces pasture productivity, and depletes surface and groundwater resources. When combined with rising temperatures, these trends significantly increase the risk of desertification and ecosystem degradation.
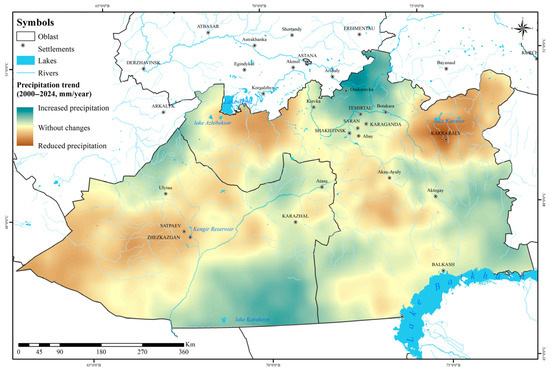
Figure 10.
Precipitation Trend in Central Kazakhstan (2000–2024).
In the central and southeastern parts of the region, precipitation trends are mostly stable, with localized slight increases. These areas retain relative climatic stability, offering potential for adaptive agriculture and efficient use of water resources. Nevertheless, ongoing monitoring is essential due to the region’s sensitivity to climatic variability.
The northeastern region, despite receiving the highest precipitation, shows a declining trend, particularly in the mountain forests of Karkaraly and surrounding areas. This may signal forest degradation, reduced moisture retention, and altered seasonal precipitation patterns. Such changes threaten river flow, snowpack levels, and the integrity of unique natural ecosystems.
Thus, a spatial and temporal analysis of precipitation in the Ulytau and Karaganda regions reveals an increase in climatic instability. While the southern and western regions are becoming increasingly arid, the northeastern territories are experiencing a downward trend despite high precipitation levels. The central part of the region remains a transition zone with potential for sustainable environmental management. These results highlight the need for an integrated approach to managing water resources, adapting agriculture to climate change and conserving natural buffer zones. In the face of increasing climate challenges, the development of territorial adaptation programmes, the introduction of land reclamation systems, forest protection, and effective climate monitoring should become priorities.
The Pettitt test results indicated that the main change point in temperature series occurred around 1976, while significant shifts in precipitation were observed in 1930 and 1975. Seasonal variations differed among stations but generally showed major temperature shifts around 1960 and 1976. For precipitation, the patterns were less consistent, with notable breakpoints near 1930 and 1986. Based on these results, the climatic time series were divided into three periods: the long-term baseline, the period of intensified warming, and the recent study period. A comprehensive analysis using the Mann–Kendall test and Sen’s slope estimator was then conducted for these three periods (1901–2023, 1976–2023, and 2000–2023) on both annual and seasonal scales.
During the period 1901–2023 (123 years), a strong and statistically significant long-term warming trend (Z > 6, p < 0.05) was observed at all stations. The Sen’s slope averaged approximately 0.017 °C per year, equivalent to about 2.1 °C/century. Warming was statistically significant across all seasons, but most pronounced in summer (Z ~ 7.53, Sen’s slope ~ 0.015–0.033 °C/year). The weakest, yet still significant, warming occurred in winter (Z ~ 2.4–4.0, Sen’s slope ~ 0.018–0.025 °C/year) (Figure 11).
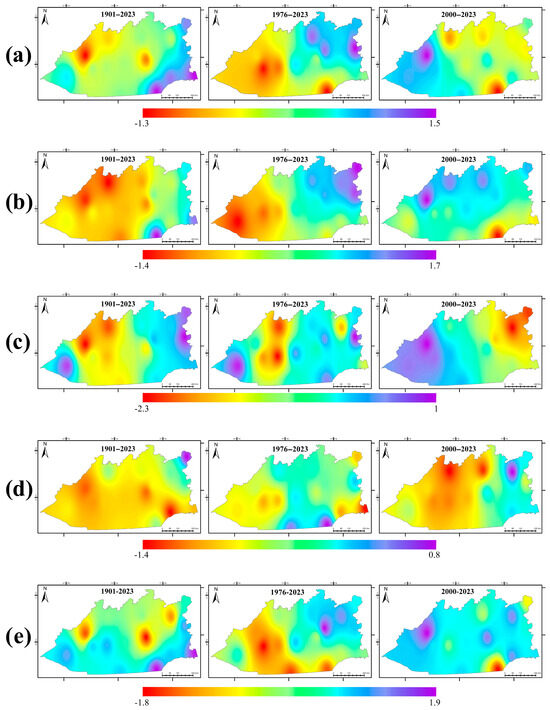
Figure 11.
Spatio-temporal trends of precipitation by seasons (Mann–Kendall test, 1901–2023). (a) Annual, (b) Autumn, (c) Spring, (d) Summer, (e) Winter.
No uniform trend in precipitation was identified across the region. While most stations showed statistically insignificant trends, a significant decrease (p < 0.05) was observed at three stations. A notable decline in precipitation was detected during the winter season at stations A, UT and KK, whereas in other seasons, trends remained mostly insignificant. A significant reduction in spring and autumn precipitation was recorded in the Ulytau area.
During the 48-year period from 1976 to 2023 (representing the phase of intensified warming), the warming trend not only persisted but also accelerated sharply. This trend was highly significant at all stations (p < 0.01) and Sen’s slope increased to between 0.03 and 0.045 °C/year–equivalent to approximately 1.4 and 2.2 °C over 48 years. The most pronounced acceleration occurred in spring and winter. In spring, Z-values reached 4.71 with a Sen’s slope of ~0.07–0.08 °C/year. In winter, the warming rate also increased markedly (Z ~ 1.0–2.2 and a Sen’s slope of ~0.05–0.06 °C/year).
No statistically significant changes were detected in the annual precipitation trend (p > 0.05). Certain areas showed a significant increase in winter, while weak positive but mostly insignificant trends prevailed in spring.
For the 24-year study period (2000–2023), representing short-term contemporary dynamics, the temperature trend remained positive but showed reduced statistical significance due to high interannual variability over the short time span (Figure 12).

Figure 12.
Spatio-temporal trends of air temperature by seasons (Mann–Kendall test, 1901–2023). (a) Annual, (b) Autumn, (c) Spring, (d) Summer, (e) Winter.
A significant trend (p < 0.1) was observed at only a few stations. Most stations exhibited highly significant and intense warming in summer (Z-values up to 3.6 and Sen’s slope of ~0.06–0.08 °C/year). The spring trend was weaker yet generally positive and partially significant. In autumn, most stations showed an insignificant cooling tendency.
No statistically significant trends were found in annual precipitation. A general decrease in precipitation was observed in spring and summer, while autumn exhibited a slight, statistically insignificant increase.
As is typical for continental regions, no uniform precipitation trend was identified. However, an alarming pattern has emerged in recent decades: an increase in winter precipitation, possibly in the form of rain, accompanied by a decline in summer precipitation. This represents a highly unfavourable scenario, leading to moisture deficits during the growing season. The combination of rising temperatures (particularly in summer), reduced summer rainfall and a potential redistribution of precipitation towards winter poses serious risks to water resources, increases the frequency of droughts and reduces vegetation cover.
The spatial and temporal dynamics of the NDVI: The NDVI enables vegetation activity to be quantified by distinguishing between degraded and landscaped areas [43,44,45]. The spatio-temporal dynamics of NDVI were assessed using linear regression, following the method outlined by Christensen [46], to identify trends over a 25-year period. This approach, consistent with that applied to other indicators, enabled the detection of long-term changes in vegetation activity. NDVI trend values were classified into five categories as shown in Figure 13:
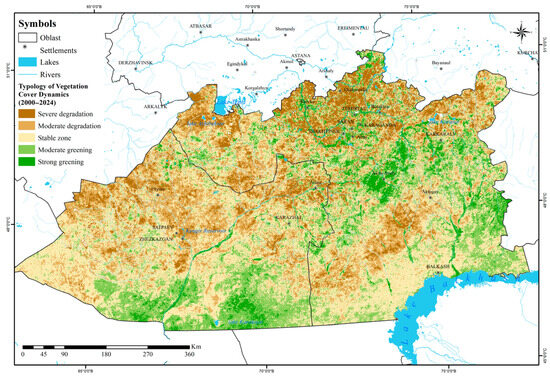
Figure 13.
Vegetation Cover Dynamics in Central Kazakhstan (2000–2024).
- Strong greening (a > 0.5): consistent increase in vegetation cover;
- Moderate greening (0.2 < a ≤ 0.5): slight positive trend;
- Stable condition (−0.2 ≤ a ≤ 0.2): no significant change in vegetation activity;
- Moderate degradation (−0.5 < a < −0.2): gradual decline in NDVI;
- Severe degradation (a ≤ −0.5): marked deterioration in vegetation condition.
From 2000 to 2024, the dynamics of vegetation cover changes within the study area by the above-mentioned categories are characterized as follows (Table 2):
Table 2.
Classification of NDVI indicators by classes within the administrative units of Central Kazakhstan.
- Strong greening—2804 thousand ha (6.7%);
- Moderate greening—8832 thousand ha (21.0%);
- Stable condition—16,504 thousand ha (39.1%);
- Moderate degradation—9707 thousand ha (23.0%);
- Severe degradation—4310 thousand ha (10.2%).
Spatial analysis reveals that the southern parts of the region (Zhezkazgan, Satpayev, and adjacent areas) are dominated by zones with a negative NDVI trend with an annual slope of −0.0046/yr−1 (p < 0.0001) (Table 3). This reflects the combined impact of high temperatures, low precipitation, and intensive land use, particularly grazing, leading to consistent vegetation degradation, reduced cover density, soil deterioration, and an elevated risk of desertification.
Table 3.
OLS regression statistics for NDVI: intercept, slope, and their statistical significance.
According to the results of the spatial analysis, the territories within the city of Zhezkazgan exhibited degradation processes of varying intensity between 2000 and 2024. 49.6% of the land was moderately degraded, while 15.4% was severely degraded. A similar trend was observed in Satpayev, where 48.7% of the territory was identified as moderately degraded and 18.7% as severely degraded in terms of vegetation cover (Table 2).
In the central region (Karazhal, Aktogay, Shet district), trends are more heterogeneous, with a mosaic of stable zones alongside areas of moderate greening or degradation (Figure 14c). This pattern is linked to variations in landscape conditions, land use practices, and sensitivity to climatic fluctuations.
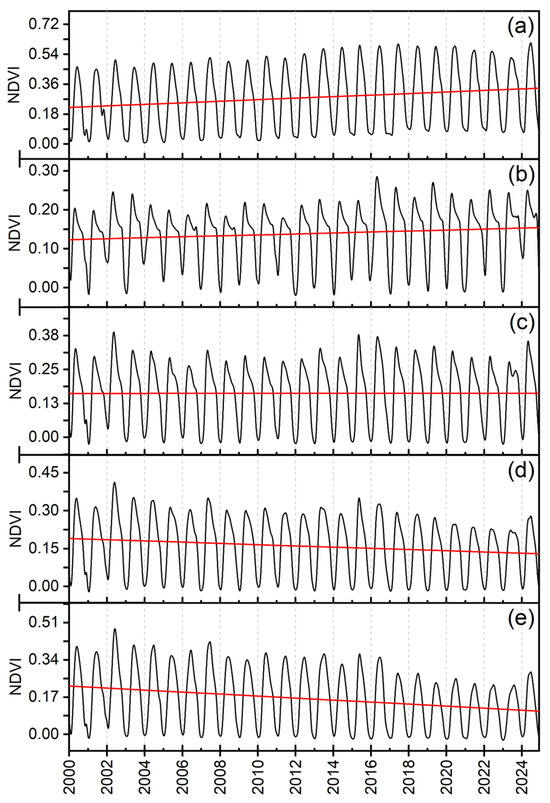
Figure 14.
Long-term changes in NDVI and the OLS linear trend (2000–2024): (a) Strong greening; (b) Moderate greening; (c) Stable condition; (d) Moderate degradation; (e) Severe degradation. The red line represents the OLS linear trend.
Between 2000 and 2024, 49.3% of Karazhal city’s territory was characterised by stable vegetation conditions. Similar situations were observed in the Shet (40.4%), Ulytau (45.8%) and Aktogay (49.8%) districts, where vegetation cover also remained relatively stable.
Northeastern and eastern districts (Karkaraly, Osakarov, Temirtau, Shakhtinsk) a positive NDVI trend is observed with a slope of 0.0047/yr−1 (p < 0.002) (Table 2). A significant portion of these territories shows signs of vegetation recovery, supported by a more favorable climate, forested areas, higher humidity, and lower anthropogenic pressure. The foothill and forested zones of the Karkaraly Range stand out with the most pronounced greening over the study period.
The study revealed a significant improvement in vegetation conditions in the Karkaraly district over the analysed period. Specifically, 22% of the area exhibited moderate greening, while 12.1% exhibited strong greening. A similar trend was observed in the Osakarov district, where the corresponding values were 12.5% and 10.1%, respectively.
Comparable patterns were identified in the Temirtau and Shakhtinsk districts, where distinct vegetation recovery processes were recorded. In Temirtau, 21.4% of the area was moderately greened and 26.3% was strongly greened, whereas in Shakhtinsk these values were 27.1% and 25.4%, respectively.
Positive NDVI trends are also observed in lake and floodplain areas near Lake Balkhash and Lake Karakoyin, likely driven by localized microclimatic conditions, relatively stable moisture availability, and natural vegetation regeneration.
The analysis of long-term NDVI trends at (α < 0.05) reveals a statistically significant differentiation in vegetation dynamics: degradation dominates the southern areas, stability characterizes the central zone, and greening is observed in the eastern and northeastern regions (Figure 14). These findings provide an objective basis for assessing the ecological stability of landscapes, identifying zones of risk and recovery, and supporting the planning of environmental protection measures and sustainable management of pastures and agricultural lands.
The relationship between climatic factors and NDVI indicates that changes in temperature and precipitation directly influence vegetation activity, productivity, and stability in semi-desert and steppe ecosystems. To demonstrate consistency between climatic drivers and NDVI, the Pearson correlation coefficient was mapped between NDVI and both precipitation and LST over the past 25 years (Figure 15). To ensure phenological comparability, the NDVI and LST time series were averaged over the vegetation period (May–September, MJJAS), while the precipitation totals were accumulated for April–September (AMJJAS) in order to account for pre-vegetation soil moisture. Overall, the expected positive relationship between NDVI and precipitation and inverse relationship with LST were observed. The spatial distribution of statistically significant correlations (p < 0.05) is heterogeneous and is primarily associated with areas characterised by high climatic variability.
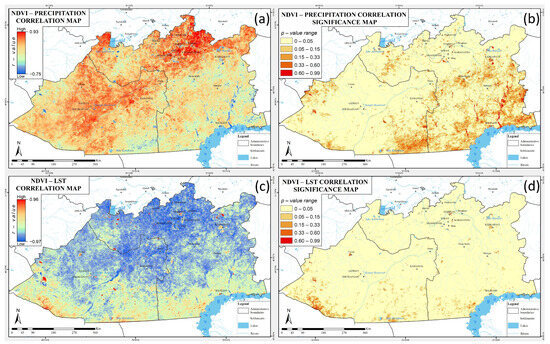
Figure 15.
Maps of NDVI correlation with climatic factors: (a) NDVI–precipitation correlation, (b) significance of NDVI–precipitation correlation (p-value), (c) NDVI–LST correlation, (d) significance of NDVI–LST correlation (p-value).
The land surface temperature (LST) derived from satellite observations reflects the degree of heating of the soil and vegetation cover. High LST values, particularly those exceeding 35 °C, recorded in the southern and western parts of the region (Zhezkazgan, Satpayev, Karazhal), are associated with a decline in NDVI and indicate vegetation degradation, with an average correlation coefficient of r = −0.69 (p < 0.004). This is due to the fact that at high temperatures evaporation of moisture from the soil increases, water scarcity increases, and the photosynthetic activity of plants decreases. Elevated temperatures lengthen non-planting periods, contribute to the wilting and dying of vegetation, especially in conditions of limited moisture [45,47,48]. Consequently, a negative relationship is observed between surface temperature and NDVI, whereby elevated temperatures result in reduced NDVI values, particularly in arid environments where climatic stress surpasses the adaptation thresholds of both natural and cultivated vegetation. Overall, areas with a negative correlation between NDVI and LST cover nearly 95% of the entire region.
By contrast, there is a positive correlation between precipitation and NDVI (see Figure 15a,b). In regions characterised by humidity levels exceeding 350–400 mm per year, such as the northeastern part of the Karaganda region (Karkaraly, Osakarov, Shakhtinsk, Temirtau), there is a persistent high NDVI and a positive long-term trend in its change. This finding suggests that the vegetation in these areas possesses an adequate water supply, is not subject to moisture deficiency, and possesses the capacity for self-healing. Furthermore, in these regions, NDVI has exhibited a tendency towards greening over the past 25 years, which may be attributable not only to climatic conditions, but also to a lesser extent to a reduced degree of anthropogenic stress, the presence of forests and protected natural areas.
In the southern and southwestern regions (Zhezkazgan, Satpayev and the south of Balkhash), where the average annual precipitation does not exceed 200 mm, minimal NDVI values and a negative trend are observed. This indicates an increase in pasture degradation processes, grass burning and decreased soil fertility, as well as an increased risk of desertification. The situation is particularly unfavourable in areas where temperature increases and precipitation decreases are recorded simultaneously such areas are subject to a dual climatic influence, which dramatically reduces their environmental sustainability.
The relationship between climatic factors and NDVI is particularly evident in the transition zone, specifically in the central part of the region (Karazhal, Atasu and the Shet district). Here, the NDVI shows mosaic dynamics: some areas show signs of greening while others show signs of degradation. This reflects the sensitivity of these territories to interannual climate fluctuations. Even minor changes in temperature or precipitation can cause noticeable reactions in the vegetation, in both directions.
The analysis shows that the pasture ecosystems of Central Kazakhstan are under significant pressure due to climate change, as evidenced by increased temperatures, more frequent droughts, and reduced rainfall in many areas. These processes exacerbate vegetation degradation and highlight the need for comprehensive monitoring.
The results aligned with global patterns. Zhou et al. [4] reported that over 12.6% of the world’s arid lands had been degraded due to climatic factors. Han et al. [49] identified Central Asia as one of the most vulnerable regions under the SSP5-8.5 scenario. The analysis of NDVI and degradation trajectories confirmed that pasture ecosystems in Central Kazakhstan were increasingly losing resilience to extreme climatic events.
Nevertheless, areas of natural regeneration have been identified, where vegetation recovers under reduced grazing pressure and the presence of residual moisture. This underscores the importance of implementing adaptive pasture management strategies, including rotational grazing, pasture rest periods, reseeding with forage species, and improving water access through wells and boreholes.
At the zonal level, pasture degradation is most pronounced in lowland areas, where over 95% of degraded pastures are concentrated, particularly within desert and semi-desert zones amounting to 16.1 million ha or 59.4% of their total area. The overgrowth of pastures is a key outcome of both shifting environmental conditions and unsustainable land use practices. It is characterized by the loss of valuable forage species and their replacement with weedy, non-palatable, and short-lived annuals.
The substitution of perennial species with annuals results in reduced average pasture productivity and limits grazing to narrow seasonal windows. These altered plant communities are ecologically unstable, subject to ongoing species turnover, and exhibit high interannual and seasonal variability in yield, strongly influenced by weather conditions.
4. Conclusions
International experience demonstrates that effective pasture management in arid regions requires the integration of scientific approaches, remote monitoring, and active participation of local communities. Implementing such strategies is crucial for mitigating the impacts of climate change and preserving pasture productivity.
To mitigate desertification in Kazakhstan, particularly in areas of intensive agricultural use, it is essential to develop and implement an adaptive natural resource management system. This system should be based on the identification of specific drivers and conditions of desertification across different climatic zones. It must include a framework for land use organization, along with scientifically grounded guidelines, recommendations, and measures aimed at preventing and reversing land degradation.
In Central Kazakhstan, a significant share of pastureland remains underutilized due to a lack of water infrastructure. Therefore, priority should be given to restoring and expanding water access systems. Sustainable pasture management must also be based on science-driven methods. When forecasting pasture load, it is necessary to account for climatic risks such as drought and vegetation degradation.
In the Karaganda region, urgent measures are needed to optimize land use, including the introduction of pasture rotation systems and cooperation with the Ulytau region to redistribute grazing pressure. The surplus of pastureland in Ulytau creates opportunities for expanding livestock-fattening operations.
Climatic impacts on specific landscape units can help assess how vegetation changes may affect the livestock sector. To ensure sustainable pasture use under climate change, adaptive strategies must be developed to minimize risks and leverage new opportunities. These may include improved grazing practices, efficient irrigation systems, the introduction of biodiverse and drought-resistant plant species, and other resilience-enhancing approaches.
The following measures are recommended for the purpose of sustainable land management:
- The implementation of water-saving technologies in agriculture and livestock farming is of particular importance in southern regions, where there is a prevalence of precipitation deficits.
- The regular monitoring of vegetation, temperature, and soil moisture through satellite surveillance is imperative for the early identification of degradation risks.
- The development and implementation of zonally differentiated adaptation strategies is imperative, with these strategies reflecting local climate trends and ecosystem sensitivity.
- It is imperative to provide support and assistance to agroecological practices that have been proven to enhance NDVI, encompassing the restoration of pastures, phytomelioration, and the implementation of drought-resistant cropping methods.
- The organisation of community outreach and educational programmes on the subjects of sustainable pasture use, land restoration, and climate adaptation.
The integration of climate and vegetation indicators into natural resource management will enhance the resilience of agroecosystems in Central Kazakhstan. In the context of a changing climate, it is imperative to understand these dynamics and develop sustainable management strategies to maintain the productivity and ecological stability of pasture ecosystems.
Author Contributions
Methodology, A.T., K.Z., O.T., R.S. and U.M.; Software, U.M. and B.B.; Validation, R.S.; Formal analysis, A.A., B.B. and D.T.; Investigation, K.Z. and O.T.; Resources, D.K., A.A. and D.T.; Writing—original draft, D.K.; Writing—review & editing, A.T. and R.S.; Visualization, D.K., R.S., U.M. and B.B.; Supervision, A.T. All authors have read and agreed to the published version of the manuscript.
Funding
This research was funded by the Committee of Science of the Ministry of Science and Higher Education of the Republic of Kazakhstan (Grant No. AP19579270—“Cartographic modelling and forecasting of pasture productivity in Central Kazakhstan based on remote sensing data for sustainable livestock development”).
Institutional Review Board Statement
Not applicable.
Informed Consent Statement
Not applicable.
Data Availability Statement
The original contributions presented in this study are included in the article. Further inquiries can be directed to the corresponding author.
Conflicts of Interest
The authors declare no conflicts of interest.
References
- Reeves, M.; Washington-Allen, R.; Angerer, J.; Hunt, E.R.; Kulawardhana, W.; Kumar, L.; Loboda, T.; Loveland, T.; Metternicht, G.; Ramsey, R.D. A Global View of Remote Sensing of Rangelands: Evolution, Applications, Future Pathways. In Remote Sensing Handbook; CRC Press: Boca Raton, FL, USA, 2024; Volume 3, pp. 361–418. [Google Scholar]
- Godde, C.M.; Garnett, T.; Thornton, P.K.; Ash, A.J.; Herrero, M. Grazing Systems Expansion and Intensification: Drivers, Dynamics, and Trade-Offs. Glob. Food Secur. 2018, 16, 93–105. [Google Scholar] [CrossRef]
- Xie, Z.; Game, E.T.; Phinn, S.R.; Adams, M.P.; Bayarjargal, Y.; Pannell, D.J.; Purevbaatar, G.; Baldangombo, B.; Hobbs, R.J.; Yao, J.; et al. A Scalable Big Data Approach for Remotely Tracking Rangeland Conditions. Commun. Earth Environ. 2024, 5, 349. [Google Scholar] [CrossRef]
- Zhou, Y.; Li, Y.; Li, W.; Li, F.; Xin, Q. Ecological Responses to Climate Change and Human Activities in the Arid and Semi-Arid Regions of Xinjiang in China. Remote Sens. 2022, 14, 3911. [Google Scholar] [CrossRef]
- Zhou, Y.; Zhang, L.; Xiao, J.; Williams, C.A.; Vitkovskaya, I.; Bao, A. Spatiotemporal Transition of Institutional and Socioeconomic Impacts on Vegetation Productivity in Central Asia over Last Three Decades. Sci. Total Environ. 2019, 658, 922–935. [Google Scholar] [CrossRef] [PubMed]
- Mirzabaev, A.; Wu, J.; Evans, J.; García-Oliva, F.; Hussein, I.A.; Iqbal, M.H.; Kimutai, J.; Knowles, T.; Meza, F.; Nedjroaoui, D. Desertification. In Climate Change and Land: An IPCC Special Report on Climate Change, Desertification, Land Degradation, Sustainable Land Management, Food Security, and Greenhouse Gas Fluxes in Terrestrial Ecosystems; IPCC: Geneva, Switzerland, 2019. [Google Scholar]
- Fensholt, R.; Langanke, T.; Rasmussen, K.; Reenberg, A.; Prince, S.D.; Tucker, C.; Scholes, R.J.; Le, Q.B.; Bondeau, A.; Eastman, R.; et al. Greenness in Semi-Arid Areas across the Globe 1981–2007—An Earth Observing Satellite Based Analysis of Trends and Drivers. Remote Sens. Environ. 2012, 121, 144–158. [Google Scholar] [CrossRef]
- Afuye, G.A.; Kalumba, A.M.; Orimoloye, I.R. Characterisation of Vegetation Response to Climate Change: A Review. Sustainability 2021, 13, 7265. [Google Scholar] [CrossRef]
- Reid, W.; Mooney, H.; Cropper, A.; Capistrano, D.; Carpenter, S.; Chopra, K.; Dasgupta, P.; Dietz, T.; Duraiappah, A.; Hassan, R. Millennium Ecosystem Assessment; Cranfield University: Bedford, UK, 2021. [Google Scholar]
- Godde, C.M.; Boone, R.B.; Ash, A.J.; Waha, K.; Sloat, L.L.; Thornton, P.K.; Herrero, M. Global Rangeland Production Systems and Livelihoods at Threat under Climate Change and Variability. Environ. Res. Lett. 2020, 15, 044021. [Google Scholar] [CrossRef]
- Tuoku, L.; Wu, Z.; Men, B. Impacts of Climate Factors and Human Activities on NDVI Change in China. Ecol. Inform. 2024, 81, 102555. [Google Scholar] [CrossRef]
- Yan, K.; Gao, S.; Yan, G.; Ma, X.; Chen, X.; Zhu, P.; Li, J.; Gao, S.; Gastellu-Etchegorry, J.-P.; Myneni, R.B.; et al. A Global Systematic Review of the Remote Sensing Vegetation Indices. Int. J. Appl. Earth Obs. Geoinf. 2025, 139, 104560. [Google Scholar] [CrossRef]
- Li, X.; Shen, T.; Garcia, C.L.; Teich, I.; Chen, Y.; Chen, J.; Kabo-Bah, A.T.; Yang, Z.; Jia, X.; Lu, Q.; et al. A 30-Meter Resolution Global Land Productivity Dynamics Dataset from 2013 to 2022. Sci. Data 2025, 12, 555. [Google Scholar] [CrossRef]
- Jiang, K.; Teuling, A.J.; Chen, X.; Huang, N.; Wang, J.; Zhang, Z.; Gao, R.; Men, J.; Zhang, Z.; Wu, Y.; et al. Global Land Degradation Hotspots Based on Multiple Methods and Indicators. Ecol. Indic. 2024, 158, 111462. [Google Scholar] [CrossRef]
- Purevjav, A.-O.; Avirmed, T.; Wilcox, S.W.; Barrett, C.B. Climate Rather than Overgrazing Explains Most Rangeland Primary Productivity Change in Mongolia. Science 2025, 389, 1229–1233. [Google Scholar] [CrossRef]
- Furnitto, N.; Ramírez-Cuesta, J.M.; Intrigliolo, D.S.; Todde, G.; Failla, S. Remote Sensing for Pasture Biomass Quantity and Quality Assessment: Challenges and Future Prospects. Smart Agric. Technol. 2025, 12, 101057. [Google Scholar] [CrossRef]
- Aralova, D.; Gafurov, D.; Toderich, K. NDVI-Based Monitoring Long-Term Vegetation Change Dynamics in the Drylands of Central Asia. In Vegetation of Central Asia and Environs; Springer: Cham, Switzerland, 2018; pp. 49–71. [Google Scholar]
- Gao, C.; Ren, X.; Fan, L.; He, H.; Zhang, L.; Zhang, X.; Li, Y.; Zeng, N.; Chen, X. Assessing the Vegetation Dynamics and Its Influencing Factors in Central Asia from 2001 to 2020. Remote Sens. 2023, 15, 4670. [Google Scholar] [CrossRef]
- Xing, X.; Qian, J.; Chen, X.; Chen, C.; Sun, J.; Wei, S.; Yimamaidi, D.; Zhanar, Z. Analysis of Effects of Recent Changes in Hydrothermal Conditions on Vegetation in Central Asia. Land 2022, 11, 327. [Google Scholar] [CrossRef]
- Liang, L.; Wenpeng, D.; Huimin, Y.; Lin, Z.; Yu, D. Spatio-Temporal Patterns of Vegetation Change in Kazakhstan from 1982 to 2015. J. Resour. Ecol. 2017, 8, 378–384. [Google Scholar] [CrossRef]
- Dubovyk, O.; Ghazaryan, G.; González, J.; Graw, V.; Löw, F.; Schreier, J. Drought Hazard in Kazakhstan in 2000–2016: A Remote Sensing Perspective. Environ. Monit. Assess. 2019, 191, 510. [Google Scholar] [CrossRef] [PubMed]
- Han, W.; Zheng, J.; Guan, J.; Liu, Y.; Liu, L.; Han, C.; Li, J.; Li, C.; Mao, X.; Tian, R. Assessment of Vegetation Drought Loss and Recovery in Central Asia Considering a Comprehensive Vegetation Index. Remote Sens. 2024, 16, 4189. [Google Scholar] [CrossRef]
- Temirzhanov, M.B.; Alpamyshov, A.Z.; Abdrakhmanov, A.R.; Mukasheva, M.M.; Ramazanov, M.D. Summary Analytical Report of the Ministry of Agriculture of Kazakhstan on the State and Use of Land in the Republic of Kazakhstan for 2023; Ministry of Agriculture of Kazakhstan: Astana, Kazakhstan, 2023.
- Ministry of Agriculture of the Republic of Kazakhstan, Committee for Land Resources Management. Consolidated Analytical Report on the State and Use of Land Resources of the Republic of Kazakhstan for 2022; Ministry of Agriculture of Kazakhstan: Astana, Kazakhstan, 2022; p. 318.
- Ministry of Ecology and Natural Resources of the Republic of Kazakhstan. National Report on the State of the Environment and Use of Natural Resources of the Republic of Kazakhstan; Ministry of Ecology and Natural Resources of the Republic of Kazakhstan: Astana, Kazakhstan, 2024; p. 565.
- Akhylbekova, B.; Serekpayev, N.; Nogayev, A.; Zhumabek, B. Pasture Productivity Depending on the Method of Pasture Use in the Steppe Zone of Northern Kazakhstan. OnLine J. Biol. Sci. 2022, 22, 476–483. [Google Scholar] [CrossRef]
- Kabzhanova, G.; Arystanova, R.; Bissembayev, A.; Arystanov, A.; Sagin, J.; Nasiyev, B.; Kurmasheva, A. Remote Sensing Applications for Pasture Assessment in Kazakhstan. Agronomy 2025, 15, 526. [Google Scholar] [CrossRef]
- Bragina, T.M.; Nowak, A.; Vanselow, K.; Wagner, V. Grasslands of Kazakhstan and Middle Asia: The Ecology, Conservation and Use of a Vast and Globally Important Area. In Grasslands of the World: Diversity, Management and Conservation; CRC Press: Boca Raton, FL, USA, 2018; pp. 141–169. [Google Scholar]
- Kazhydromet. Annual Bulletin of Monitoring of the Climate State and Climate Change in Kazakhstan: 2021; Republican State Enterprise Kazhydromet: Astana, Kazakhstan, 2022; p. 76. [Google Scholar]
- Bureau of National Statistics Agency for Strategic Planning and Reforms of the Republic of Kazakhstan Bureau of National Statistics. Available online: https://stat.gov.kz/en/ (accessed on 15 August 2024).
- Harris, I.; Osborn, T.J.; Jones, P.; Lister, D. Version 4 of the CRU TS Monthly High-Resolution Gridded Multivariate Climate Dataset. Sci. Data 2020, 7, 109. [Google Scholar] [CrossRef] [PubMed]
- Vakulchuk, R.; Daloz, A.S.; Overland, I.; Sagbakken, H.F.; Standal, K. A Void in Central Asia Research: Climate Change. Cent. Asian Surv. 2023, 42, 1–20. [Google Scholar] [CrossRef]
- Chen, J.; Yao, J.; Dilinuer, T.; Li, J.; Li, S.; Yang, L.; Mao, W. Central Asia Daily Extreme Precipitation in Observations and Gridded Datasets: A Threshold Criteria Perspective. Front. Environ. Sci. 2022, 10, 1007365. [Google Scholar] [CrossRef]
- Kendall, M.G. Rank Correlation Methods; APA PsycInfo: Washington, DC, USA, 1948. [Google Scholar]
- Sen, P.K. Estimates of the Regression Coefficient Based on Kendall’s Tau. J. Am. Stat. Assoc. 1968, 63, 1379–1389. [Google Scholar] [CrossRef]
- Pettitt, A.N. A Non-parametric Approach to the Change-point Problem. J. R. Stat. Soc. Ser. C (Appl. Stat.) 1979, 28, 126–135. [Google Scholar] [CrossRef]
- Makhambetov, M.Z.; Izimova, R.; Khamit, A.B.; Koishyglova, G.U. The Impact of Climate Change on Pasture Ecosystems of the Atyrau Region of the Republic of Kazakhstan. Yessenov Sci. J. 2024, 48, 157–169. [Google Scholar] [CrossRef]
- Nendissa, D.R.; Alimgozhaevich, I.K.; Sapaev, I.; Karimbaevna, T.M.; Bakhtiyarovna, S.Z.; Abdullah, D.; Ugli Zokirov, K.G.; Sharifovna, A.G. Sustainable Livestock Grazing in Kazakhstan Practices, Challenges, and Environmental Considerations. Casp. J. Environ. Sci. 2023, 21, 977–988. [Google Scholar]
- Filazzola, A.; Brown, C.; Dettlaff, M.A.; Batbaatar, A.; Grenke, J.; Bao, T.; Peetoom Heida, I.; Cahill, J.F., Jr. The Effects of Livestock Grazing on Biodiversity Are Multi-trophic: A Meta-analysis. Ecol. Lett. 2020, 23, 1298–1309. [Google Scholar] [CrossRef]
- Law of the Republic of Kazakhstan Dated February 20, 2017 No. 49-VI “On Pastures”; Parliament of the Republic of Kazakhstan: Nur-Sultan, Kazakhstan, 2017.
- Li, Z.; Wu, H.; Duan, S.; Zhao, W.; Ren, H.; Liu, X.; Leng, P.; Tang, R.; Ye, X.; Zhu, J.; et al. Satellite Remote Sensing of Global Land Surface Temperature: Definition, Methods, Products, and Applications. Rev. Geophys. 2023, 61, e2022RG000777. [Google Scholar] [CrossRef]
- Mo, Y.; Xu, Y.; Chen, H.; Zhu, S. A Review of Reconstructing Remotely Sensed Land Surface Temperature under Cloudy Conditions. Remote Sens. 2021, 13, 2838. [Google Scholar] [CrossRef]
- de Oliveira, V.F.R.; Vick, E.P.; Bacani, V.M. Analysis of Seasonal Environmental Fragility Using the Normalized Difference Vegetation Index (NDVI) and Soil Loss Estimation in the Urutu Watershed, Brazil. Nat. Hazards 2025, 121, 10017–10041. [Google Scholar] [CrossRef]
- Huang, S.; Tang, L.; Hupy, J.P.; Wang, Y.; Shao, G. A Commentary Review on the Use of Normalized Difference Vegetation Index (NDVI) in the Era of Popular Remote Sensing. J. For. Res. 2021, 32, 1–6. [Google Scholar] [CrossRef]
- Kumar, B.P.; Babu, K.R.; Rajasekhar, M.; Ramachandra, M. Assessment of the Visual Disaster of Land Degradation and Desertification Using TGSI, SAVI, and NDVI Techniques. In Geospatial Modeling for Environmental Management; CRC Press: Boca Raton, FL, USA, 2022; pp. 261–279. [Google Scholar]
- Christensen, R. Analysis of Variance, Design, and Regression: Linear Modeling for Unbalanced Data; Chapman and Hall/CRC: Boca Raton, FL, USA, 2018; ISBN 1-315-37009-3. [Google Scholar]
- Feller, U.; Vaseva, I.I. Extreme Climatic Events: Impacts of Drought and High Temperature on Physiological Processes in Agronomically Important Plants. Front. Environ. Sci. 2014, 2, 39. [Google Scholar] [CrossRef]
- Lipiec, J.; Doussan, C.; Nosalewicz, A.; Kondracka, K. Effect of Drought and Heat Stresses on Plant Growth and Yield: A Review. Int. Agrophys. 2013, 27, 463–477. [Google Scholar] [CrossRef]
- Han, W.; Zheng, J.; Guan, J.; Liu, Y.; Liu, L.; Han, C.; Li, J.; Li, C.; Tian, R.; Mao, X. A Greater Negative Impact of Future Climate Change on Vegetation in Central Asia: Evidence from Trajectory/Pattern Analysis. Environ. Res. 2024, 262, 119898. [Google Scholar] [CrossRef] [PubMed]


Disclaimer/Publisher’s Note: The statements, opinions and data contained in all publications are solely those of the individual author(s) and contributor(s) and not of MDPI and/or the editor(s). MDPI and/or the editor(s) disclaim responsibility for any injury to people or property resulting from any ideas, methods, instructions or products referred to in the content. |
© 2025 by the authors. Licensee MDPI, Basel, Switzerland. This article is an open access article distributed under the terms and conditions of the Creative Commons Attribution (CC BY) license (https://creativecommons.org/licenses/by/4.0/).