Abstract
Under the context of global climate change and China’s dual carbon strategy (DCS), the impact of land use/land cover change (LULCC) on regional carbon stocks has garnered increasing attention. As a key economic and ecological hub in Southwest China, Chengdu has undergone significant urbanization over the past two decades, and it is necessary to quantitatively assess how shifts in land use affect its carbon stock function. This study integrates multi-period remote sensing data from 2000 to 2020, combining socioeconomic and natural environmental drivers. The PLUS model was employed to simulate land use in 2030 under four scenarios: Natural Development Scenario (NDS), Urban Development Scenario (UDS), Conservation of Cropland Scenario (CPS), and Ecological Protection Scenario (EPS). The InVEST model was then used to calculate changes in carbon stocks and their spatial distribution characteristics. The results indicate the following: (1) From 2000 to 2020, Chengdu’s cropland decreased by 1188.6174 km2, while built-up land increased by 1006.5465 km2, resulting in a net carbon stock decrease of approximately 3.25 × 10⁶ t, with carbon gains from forest restoration offsetting part of the cropland-to-built-up loss; (2) Under all scenarios, built-up land exhibited an expansion trend, with the UDS showing the most significant increase, reaching 1919.2455 km2. In the EPS, the forest increased to 4035.258 km2, achieving the largest carbon stock increase of 8.5853 × 10⁶ t. (3) Chengdu’s carbon stock exhibits a spatial distribution pattern characterized by “high in the northwest, low in the center”. High-value areas are concentrated in the ecologically sound Longmen Mountains and Longquan Mountains, while low-value areas are primarily located in urban built-up zones and their peripheries. The study indicates that rationally controlling the expansion of Built-up land, strengthening ecological restoration, and protecting forests can effectively enhance Chengdu’s carbon sink capacity and achieve regional low-carbon and sustainable development. This study aims to address the gap in carbon stock assessments under different development scenarios at the urban scale in Southwest China, and to provide a scientific basis for Chengdu’s regional spatial planning, ecological conservation, low-carbon development, and sustainable land management.
1. Introduction
Against the background of global climate change, China has proposed the dual carbon strategy (DCS). The DCS refers to China’s goal of achieving a carbon peak by 2030 and carbon neutrality by 2060, aimed at promoting green economic transformation and sustainable development. As the world’s largest manageable carbon sink, terrestrial ecosystems play an important role in mitigating rising greenhouse gas concentrations, regulating regional climates, and maintaining biodiversity and ecological security [1,2,3,4,5]. According to the Intergovernmental Panel on Climate Change (IPCC) estimates, terrestrial ecosystems absorb and sequester approximately one-quarter of anthropogenic carbon dioxide emissions annually; their stability and sustainability directly determine the effectiveness of climate regulation [6,7,8]. Different land use types exhibit significant variations in vegetation cover, biomass accumulation, soil organic carbon storage capacity, and surface albedo [9]. The spatial combination of different land use types constitutes the regional land use. Therefore, changes in land use not only reshape the structure and function of regional ecosystems but also significantly influence the spatiotemporal distribution characteristics of carbon stocks and their carbon sink potential [10,11,12,13].
In recent years, with rapid urbanization, industrial restructuring, and the expansion of transportation and infrastructure, land use/land cover change (LULCC) has become a key driver affecting the carbon storage capacity of terrestrial ecosystems [14,15,16]. Specifically, urban expansion and infrastructure construction often convert cropland and forest into built-up land, while industrial restructuring alters land demand and accelerates land use transitions, leading to habitat loss and reduced carbon storage capacity [17,18,19]. Extensive research indicates that converting forests to built-up or cropland often leads to significant carbon losses (i.e., reductions in vegetation and soil carbon stocks), while restoring degraded grasslands to forest or implementing grassland ecological restoration projects can effectively enhance carbon sink levels (i.e., enhance the capacity of ecosystems to absorb and store carbon dioxide from the atmosphere) [20,21,22,23]. LULCC not only alters regional carbon budgets but also forms complex feedback mechanisms with climate change, such as changes in surface energy balance, hydrological cycles, and greenhouse gas emissions, which in turn affect vegetation growth and soil carbon sequestration [24]. Therefore, quantifying the spatiotemporal characteristics of LULCC and its impacts on terrestrial ecosystem carbon stocks is essential for scientifically assessing carbon sink potential. This assessment can provide a solid basis for optimizing land use and supporting the achievement of the dual carbon strategy (DCS) goals.
The research on the impact of LULCC and climate change on carbon stocks primarily employs carbon stock assessment methods, including field surveys, biomass methods, and model simulations [25,26]. Field surveys and biomass methods exhibit high accuracy in small-scale studies but face limitations such as high costs, lengthy cycles, limited coverage, and difficulties in conducting long-term studies [27,28]. In contrast, model simulations enable long-term, large-scale assessments while facilitating spatial visualization of carbon stocks, making them widely adopted in studies examining the relationship between LULCC and carbon stock changes [29,30,31,32]. Compared with other carbon assessment and land use simulation models such as Cellular Automata–Markov (CA–Markov), Future Land Use Simulation (FLUS), and System Dynamics (SD) models, the Patch-generating Land Use Simulation (PLUS) and Integrated Valuation of Ecosystem Services and Trade-offs (InVEST) models have been increasingly applied for regional carbon stock simulation and scenario projection. These models demonstrate distinct advantages in requiring fewer input data, improving computational efficiency, and providing user-friendly spatial and temporal visualization of simulation results, which facilitates the interpretation of land use transitions and spatial patterns of carbon storage. This refers to the ability of the models to generate spatially explicit maps and temporal change visualizations that clearly display land use transitions and carbon stock distributions. Such visualization enables straightforward comparison among different scenarios and helps policymakers and researchers intuitively identify spatial hotspots of carbon loss or gain [30,33,34,35]. Some studies have employed the PLUS and InVEST models to analyze land use transitions and carbon stock dynamics in various regions such as India and China, demonstrating that the integration of these models can effectively simulate both the spatial evolution of land use patterns and the associated carbon storage changes under different development scenarios [36,37,38].
Despite the increasing attention on the relationship between land use, land cover change, and carbon dynamics, most existing studies in China have focused on the provincial scale, with few emphasizing urban-scale development scenario projections—particularly in the urban-expanding southwest region [14,26,34]. As a typical megacity in southwest China, Chengdu is undergoing simultaneous rapid urban expansion and ecological restoration, which provides a unique case study for exploring how land use strategies under different development scenarios influence future carbon stocks. To address this gap, this study integrates multi-period remote sensing data and driving factors, using the PLUS model to simulate LULCC patterns in 2030 under four scenarios, and employs the InVEST model to assess carbon stocks. The study aims to: (1) quantify the spatial-temporal dynamics of LULCC and carbon stock changes in Chengdu from 2000 to 2020; (2) examine the spatial distribution patterns and variation trends of Chengdu’s projected (2030) carbon stocks under different development scenarios; and (3) identify optimized land use strategies to enhance regional carbon sequestration capacity, providing scientific guidance for ecological conservation, low-carbon development, and sustainable land management in Chengdu.
2. Materials and Methods
2.1. Research Area
In this study, Chengdu was selected as the study area. Chengdu (102°54′–104°57′ E, 30°05′–31°26′ N) is located on the western edge of the Sichuan Basin in southwestern China (Figure 1). The topography generally slopes from the highlands in the northwest to the lowlands in the southeast, with the Longmen Mountains in the northwest, the Chengdu Plain in the central region, and the hills extending beyond the Longquan Mountains in the east. The climate is classified as subtropical humid, characterized by mild winters, hot summers, and abundant rainfall. Chengdu administers 12 districts (Jinjiang, Qingyang, Jinniu, Wuhou, Chenghua, Longquanyi, Qingbaijiang, Xindu, Wenjiang, Shuangliu, Pidu, Xinjin), five county-level cities (Dujiangyan, Pengzhou, Qionglai, Chongzhou, and Jianyang), and six counties (Jintang, Dayi, Pujiang, Xinjin, Shuangliu, and Longquanyi). The total area is approximately 14,338 km2, with cropland as the dominant land use type, followed by forest and grassland.
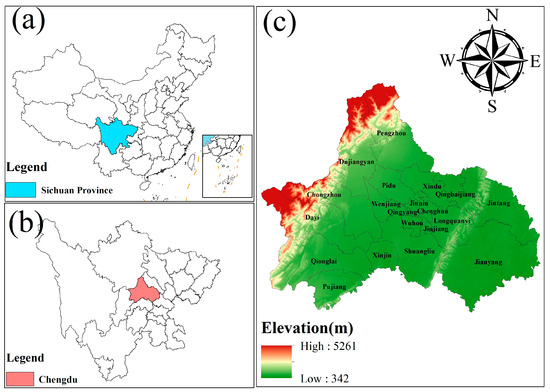
Figure 1.
Geographic Location and Regional Distribution of Chengdu. (a) Location of Sichuan Province in China; (b) Location of Chengdu City in Sichuan Province; (c) Chengdu Administrative Overlay Map.
Over the past two decades, Chengdu’s land use/land cover change (LULCC) patterns have undergone significant transformations, characterized by the rapid expansion of built-up land, continuous reduction in cropland, and the coexistence of both restoration and degradation in forest and grassland areas [39,40,41,42]. These transitions have reshaped regional ecosystem structures and profoundly influenced carbon stock stability and carbon cycling processes. Under the dual pressures of accelerated urbanization and strengthened ecological conservation, scientifically assessing the spatiotemporal evolution of carbon stocks and projecting their future dynamics under different development scenarios are of great significance for optimizing Chengdu’s territorial spatial planning, enhancing its ecosystem carbon sink capacity, and supporting the achievement of China’s dual carbon strategy (DCS) goals [43,44].
2.2. LULCC Data
LULCC data for Chengdu in the years 2000, 2005, 2010, 2015, and 2020 were obtained from AIEarth (https://engine-aiearth.aliyun.com/?accounttraceid=d5ecfe0e9dcc4d8b8ba-10e5d0d116b8bmnav#/dataset/CHINA_CLCD_V01_WHU_IRSIP, accessed on 16 February 2025), with a spatial resolution of 30 m × 30 m. Based on Chengdu’s LULCC characteristics, the data were classified into eight types: cropland, grassland, forest, shrub, water, Snow/Ice, barren land, and built-up land. This classification system is referenced from the land cover classification system proposed by Liu et al., which is consistent with the FROM_GLC global classification system [45,46].
2.3. Driving Factors and Data Sources
By reference to other studies and the actual conditions of the study area [47,48], this study selected 15 factors to simulate LULCC (Table 1 and Figure 2). Which include: (1) Socioeconomic factors: GDP, population density (POP_D), distance to railway (Railway_R), distance to highway (Road_R), distance to primary street (Street_1R), distance to secondary street (Street_2R), distance to tertiary street (Street_3R), distance to river (River_R), and distance to lake (Lake_R), distance to the nearest residential area (Residents_R); (2) Climate and environmental factors: Soil type (Soil_G, Soil type is a categorical variable representing soil classification categories, in Figure 2, it is displayed as a classified map where different colors indicate distinct soil types), annual mean temperature (TMP), and annual mean precipitation (PRE); (3) Topographic factors: Altitude and slope. The selection of these factors is based on their relevance to land use change dynamics, as well as the availability of high-quality data. Socioeconomic factors influence land use through human activity patterns, such as urbanization and infrastructure development. Climate and environmental factors affect land suitability for agriculture and vegetation growth, while topographic factors define the physical constraints of the land.

Table 1.
Data Sources for LULCC and Driver Factors.
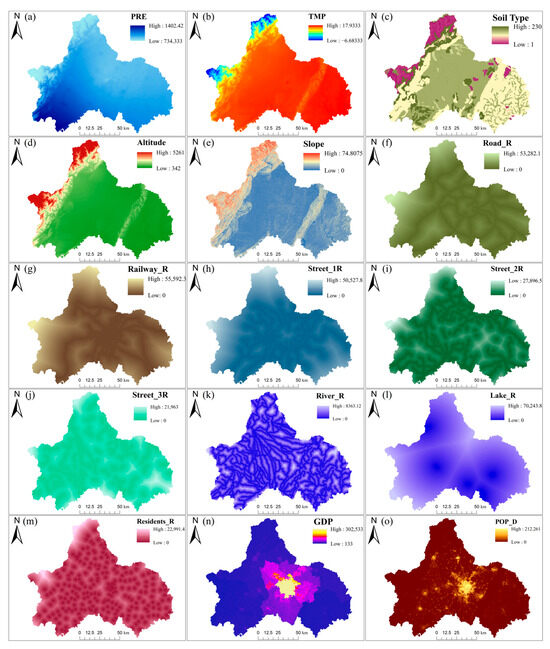
Figure 2.
Spatial distribution of the driving factors used for land use/land cover change (LULCC) simulation in Chengdu. (a) Annual mean precipitation (PRE, 2020); (b) Annual mean temperature (TMP, 2020); (c) Soil type (Soil_G, 2020); (d) Altitude (2020); (e) Slope (2020); (f) Distance to highway (Road_R, 2021); (g) Distance to railway (Railway_R, 2021); (h) Distance to primary street (Street_1R, 2021); (i) Distance to secondary street (Street_2R, 2021); (j) Distance to tertiary street (Street_3R, 2021); (k) Distance to river (River_R, 2021); (l) Distance to lake (Lake_R, 2021); (m) Distance to nearest residential area (Residents_R, 2021); (n) Gross domestic product (GDP, 2020); (o) Population density (POP_D, 2020).
Where PRE and TMP were obtained from the National Center for Earth System Science Data (https://www.geodata.cn, accessed on 16 February 2025). Altitude and slope were derived from DEM data sourced from the Geospatial Data Cloud (https://www.gscloud.cn/, accessed on 16 February 2025). Altitude values were directly extracted from the DEM, while slope was calculated using the “Slope” tool in ArcGIS 10.2. Road_R, Railway_R, Street_1R, Street_2R, Street_3R, River_R, Lake_R, and Residents_R were originally acquired from the National Catalogue Service for Geographic Information (https://www.webmap.cn, accessed on 16 February 2025). The “Euclidean Distance” tool in ArcGIS 10.2 was used to compute the respective distance maps for each feature type. Soil_G, GDP, and POP_D were obtained from the Resource and Environmental Science Data Platform (https://www.resdc.cn, accessed on 16 February 2025). To address the issue of inconsistent spatial resolution, the “Resample” tool in ArcGIS 10.2 was used to resample the data (GDP, POP_D, Soil_G, PRE) to a 30 m spatial resolution. The LULCC data in this study covers the period from 2000 to 2020, while the driving factor data is from 2020 or 2021. This is due to the study assuming that the dividing factors changed very little between 2000 to 2020.
2.4. LULCC Simulation
2.4.1. PLUS Model
This study employs the Patch-generating Land Use Simulation (PLUS) model to simulate land use/land cover change (LULCC) in Chengdu. The PLUS model identifies areas of land use change by overlaying land use maps from different periods and uses a random forest algorithm to explore the nonlinear relationships between land use types and multiple driving factors, including natural, socioeconomic, and policy-related variables. This process generates “development probability” rules for each land use type. The PLUS model effectively integrates multiple driving factors and simulates complex land transition processes, making it particularly suitable for dynamically evolving, rapidly urbanizing regions. Based on this, the model incorporates the Land Expansion Analysis Strategy (LEAS) to identify hotspots of land expansion and determine the dominant driving factors, enhancing the understanding of land transition mechanisms. Additionally, the Cellular Automata-based Random Search (CARS) module [49] is applied to better capture the randomness and spatial self-organization of land use changes. By comprehensively considering spatial heterogeneity factors such as topographic constraints and transportation networks, the model dynamically adjusts the land transition probabilities, resulting in simulation outputs whose spatial patterns and distributions closely resemble reality, thereby achieving high-precision and reliable LULCC simulation [50].
2.4.2. Multi-Scenario Transfer Matrix Configuration
Based on the land development and protection objectives outlined in the “Chengdu Territorial Space Master Plan (2021–2035)” and the “Sichuan Provincial Territorial Space Plan (2021–2035)”, along with the ecological restoration expectations and the land type distribution within the study area, this study designed four scenarios to predict and analyze the spatiotemporal dynamics of future land use types and carbon stocks. (1) Natural Development Scenario (NDS): In this scenario, no conversion probabilities were set between land types. (2) Urban Development Scenario (UDS): To support the Chengdu-Chongqing Economic Circle and promote small town development, this scenario assumes a 20% increase in the probability of converting cropland, forest, and grassland into built-up land, while reducing the probability of converting built-up land back into forest, grassland, and water bodies by 30%. (3) Cropland Protection Scenario (CPS): Considering cropland as a crucial foundation for ensuring food supply and national food security, this scenario reduces the probability of cropland conversion to built-up land by 60%. (4) Ecological Protection Scenario (EPS): Guided by the principles of prioritizing ecology and strengthening ecological conservation, this scenario reduces the probability of forest and grassland conversion to built-up land by 50%, lowers the probability of cropland conversion to built-up land by 30%, increases the probability of cropland conversion to forest or grassland by 30%, and designates water bodies as restricted zones prohibited from conversion to built-up land. The conversion probability coefficients for the above four scenarios were determined based on policy documents and existing research results [29,42]. Based on the LULCC in Chengdu from 2010 to 2020, the PLUS model and Markov chains were employed to predict Chengdu’s land use demand by 2030.
2.4.3. Accuracy Verification
This study utilized LULCC data from Chengdu in 2000 and 2010, employing the LEAS module and CARS function within the PLUS model to simulate the land use types for Chengdu in 2020. Through the validation function of the PLUS model, the actual LULCC data for Chengdu in 2020 were compared and validated against the simulated results. The specific steps are as follows:
- (1)
- Converting raw data into the standard input format required by the PLUS model, extracting the land use expansion dynamics of the study area from 2000 to 2010.
- (2)
- Based on the extracted expansion data, generate the land development potential for the period 2000–2010, and use the Markov chain module in the PLUS model to calculate the land use demand for the study area in 2020.
- (3)
- Generate simulated results for the distribution of land use types in Chengdu in 2020 based on the Markov chain, and obtain the confusion matrix and Fidelity of Model (FoM) index using the validation module in the PLUS model.
The verification results indicate that the model’s overall reliability reached 0.9270, with a kappa coefficient of 0.8570. The model demonstrates high accuracy in predicting future land use types [51]. The PLUS model can be applied to simulate LULCC in Chengdu by 2030. The land use transition matrices under different scenarios are presented in Table 2.
Table 2.
Land Use Transition Matrix Configuration for Multiple Scenarios.
2.5. InVEST Model
This study employs the InVEST (Integrated Valuation of Ecosystem Services) model to estimate and spatially assess carbon stocks in Chengdu [52]. As one of the most widely applied ecosystem service assessment tools, this model excels particularly in large-scale evaluations of carbon storage and sequestration potential. Its Carbon Storage and Carbon Sequestration module categorizes ecosystem carbon pools into four major components: above-ground biomass carbon (carbon stored in all living vegetation above the soil surface), below-ground biomass carbon (carbon stored in vegetation roots), soil organic carbon (carbon stored in organic matter and mineral soil layers), and dead organic matter carbon (carbon contained in litter layers and dead wood). The calculation formulas for these pools are as follows:
where Ci is the carbon stock of land type i, Cabove is the above-ground carbon stock, Cbelow is the below-ground carbon stock, Csoil is the soil carbon stock, Cdead is the carbon stock in dead matter, and Ai is the area of land type i. m is the number of land types, typically m = 8 in this study.
The carbon storage module of the InVEST model assumes that the carbon density of each land use type remains constant throughout the study period. Therefore, the total regional carbon stock is obtained by multiplying the area of each land use type by its corresponding carbon density. Given the significant variation in carbon density values across different studies, to ensure the accuracy of the carbon density data used, the carbon density data referenced research findings within Sichuan Province. The carbon density data used in this study primarily referenced the results of existing research [53,54,55], with specific values shown in Table 3. The research pathway for this study is illustrated in Figure 3.
Table 3.
Carbon Density by Land Use Type in Chengdu by 2020 (104 g/hm2).
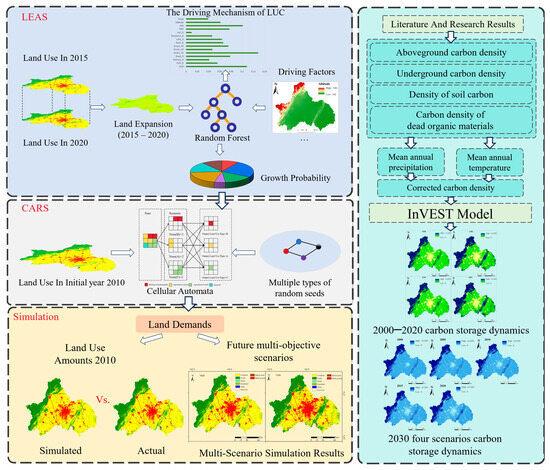
Figure 3.
The Research Approach for Spatiotemporal Evolution of Land Use and Carbon Stock in Chengdu Based on the PLUS-InVEST Model.
By integrating multi-period (2000–2020) remote sensing data, with natural and socioeconomic factors, the PLUS model was employed to simulate LULCC patterns in 2030 under four scenarios: Natural Development Scenario (NDS), Urban Development Scenario (UDS), Conservation of Cropland Scenario (CPS), and Ecological Protection Scenario (EPS). The results were then input into the InVEST model for carbon stock estimation and comparative analysis.
3. Results
3.1. Dynamic Changes in Land Use in Chengdu
From 2000 to 2020, cropland and forest remained the dominant land uses in Chengdu, collectively accounting for over 87% of the study area. These were followed by shrub, grassland, water, and built-up land, while snow/ice and Barren land constituted the smallest proportions. The land use distribution in 2020 is as follows: cropland (65.75%), forest (22.16%), built-up land (10.36%), water (0.93%), grassland (0.71%), shrub (0.044%), barren land (0.035%), and Snow/Ice (0.0016%). The most significant change in land use types between 2000 and 2020 was the continuous reduction in cropland area. This decreased from 10,616.256 km2 in 2000 to 9427.6386 km2 in 2020, representing a loss of 1188.6174 km2 (8.29% of the total area). This decline in cropland is closely linked to factors such as urbanization, shifts in agricultural production methods, and land transfer policies. Additionally, built-up land expanded significantly, increasing by 1006.5465 km2, primarily driven by growing demands for urbanization and infrastructure development. Forest also increased by 133.2684 km2, accounting for 0.92% of the total area. This growth may be associated with government-implemented ecological conservation and forest restoration policies, such as the Grain-for-Green Program. Changes in shrub, grassland, water, snow/Ice areas, and barren remained relatively small and stable, reflecting the relative stability of these land use types (Table 4).
Table 4.
Land Use Transition Matrix for Chengdu City (2000–2020).
From a different period perspective (Figure 4), Chengdu’s built-up land began expanding from 2000 to 2005, with 202.9527 km2 of cropland converted to built-up land, while the conversion of forest was minimal. The period from 2005 to 2010 marked a phase of rapid urban expansion, during which 308.3076 km2 of cropland was converted to built-up land. Concurrently, 522.9171 km2 of forest was converted to cropland, while 157.4865 km2 of cropland was converted to forest, indicating active forest-to-cropland and cropland-to-forest conversions. The expansion of built-up land may be attributed to post-disaster reconstruction following the 2008 Wenchuan Earthquake. From 2010 to 2015, built-up land increased by 310.8888 km2, primarily through the conversion of cropland (303.8940 km2). This expansion was associated with the development of Tianfu International Airport and Tianfu New Area, while forests began significant recovery, and shrubland and grassland areas showed slight expansion. From 2015 to 2020, urban development entered a stable phase, with an increase of 195.3927 km2 in built-up land. Cropland conversion remained dominant, while forest and shrubland areas recovered. Grassland and water bodies remained stable. Chengdu’s Snow/Ice and barren land areas remained small, showing no significant fluctuations between 2000 and 2020. Overall, from 2000 to 2020, Chengdu experienced rapid increases in built-up land, with urban expansion primarily relying on the conversion of cropland into built-up land.
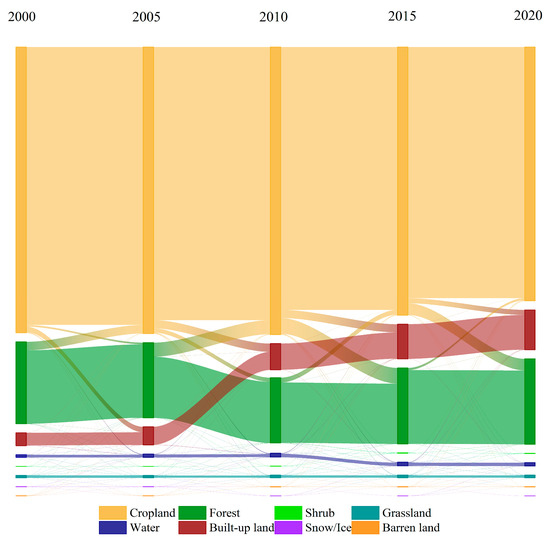
Figure 4.
Sankey plots of land use conversion in Chengdu during different periods.
3.2. Driving Mechanisms for LULCC
3.2.1. Spatio-Temporal Dynamics of LULCC
Based on LULCC statistics from 2000 to 2020, this study employed the PLUS model to simulate Chengdu’s LULCC patterns under four scenarios in 2030 (Figure 5 and Table 5). The results showed that under all scenarios, built-up land had an expansion trend by 2030, but significant differences in LULCC existed among the scenarios. Under the UDS, built-up land shows the most significant increase, expanding by 29.17%, while cropland decreased. In the NDS and EPS, cropland decreases by 10.02% and 11.47%, respectively. Under the EPS, forest expansion is most pronounced, increasing by 26.97% compared with 2020, with a growth area of approximately 857.24 km2. Ecological land types such as grassland and water bodies exhibited minimal fluctuations across all scenarios, while barren land and Snow/Ice areas remained at consistently low levels.
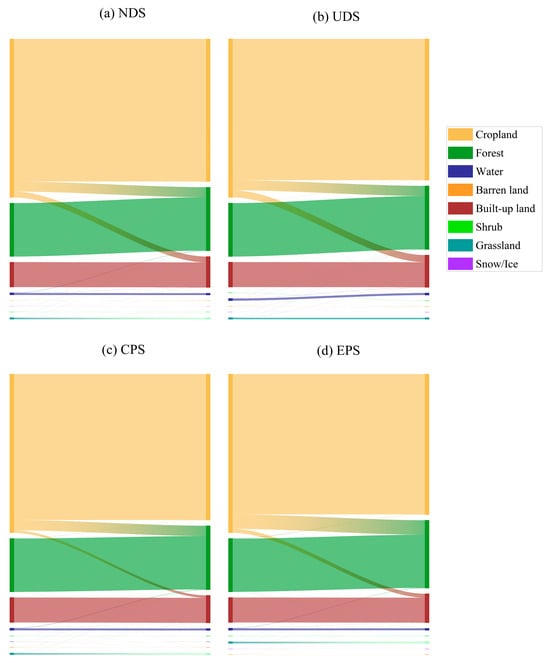
Figure 5.
Sankey plots of land use conversion in Chengdu under different scenarios for 2020–2030. (a) NDS; (b) UDS; (c) CPS; (d) EPS.
Table 5.
Land Use Change in Chengdu Under Four Scenarios for 2020–2030.
Based on the land conversion matrix, the pathways and intensity of conversion between different land use types can be further analyzed. From 2020 to 2030, the expansion of built-up land is primarily attributed to the conversion of cropland. Under the UDS, the conversion of cropland to built-up land was most dramatic, with a transfer area of 421.7283 km2. In the CPS and EPS, the area of cropland converted to built-up land was smaller, at 147.1482 km2 and 232.0497 km2, respectively. The CPS showed a lower decrease in cropland, indicating that cropland protection measures have been effective. Under the EPS, the expansion of forest primarily depended on conversions from cropland and grassland. Benefiting from the implementation of the “Grain-for-Green” program, the forested land area increases by 5.97%.
3.2.2. Land Use Change Drivers
In this study, the variable importance measure of the random forest algorithm was employed to assess the contribution of each driving factor. By randomly shuffling the values of driving factors, the degree of decline in model prediction accuracy was calculated to assess their contribution. The LULCC patterns across four scenarios reflect the impacts of different policies on urban expansion and ecological conservation (Figure 6). While UDS accelerates urbanization, it exerts greater pressure on cropland and other ecological land. Conversely, CPS and EPS discourage the uncontrolled expansion of Built-up land, thus recovering cropland and forest. Overall, Chengdu’s future LUILCC pattern will exhibit a trend of “persistent pressure on cropland, continuous expansion of built-up land, and conditional increase of forest.”
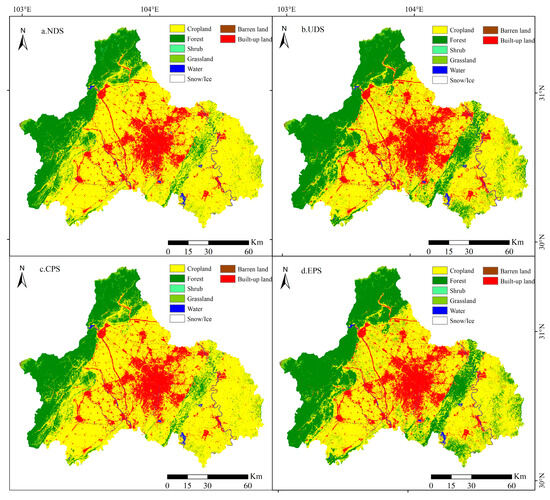
Figure 6.
Land Use Distribution Under Four Scenarios for 2030. (a) NDS; (b) UDS, (c) CPS; (d) EPS.
As shown in Figure 7, the expansion of built-up land in Chengdu is primarily driven by Residents_R (0.1529), Railway_R (0.1427), and POP_D (0.1421), while GDP (0.0647) and soil type (0.0845) also exert influence. This indicates that built-up land expansion mainly depends on population density, transportation accessibility, and economic development, and shows a multi-driver pattern of “population-transportation-economy.” The key drivers of cropland change are Street_1R (0.1286), GDP (0.1083), and PRE (0.1009). This indicates that the spatial pattern of cropland is significantly associated with transportation accessibility, economic development, and moisture conditions, reflecting that cropland distribution is affected by infrastructure, economic policies, and natural conditions simultaneously. Forest changes are mainly driven by TMP (0.1491), PRE (0.1098), and altitude (0.0913). This indicates that forest distribution is more dependent on hydrothermal conditions and topographic characteristics, with natural conditions playing a dominant role in the evolution of ecological land use. The dominant drivers of grassland change are PRE (0.1610) and Lake_R (0.1465), followed by Railway_R (0.0727). This indicates that grassland distribution is sensitive to climate and water sources while also being influenced by human activities. The most significant driver of water bodies’ expansion was altitude (0.3832), followed by Lake_R (0.1223) and slope (0.0840). Overall, differences exist in the driving mechanisms of various land use types, and these differences are key factors in the differentiation of Chengdu’s land use spatial patterns.
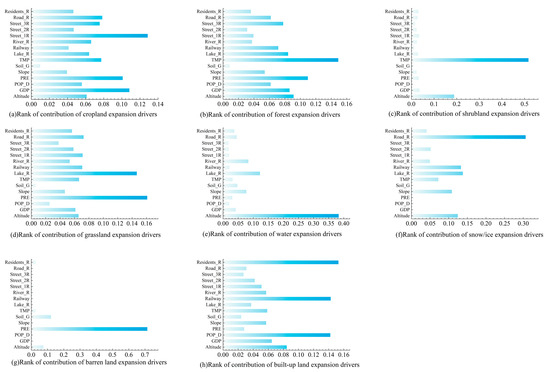
Figure 7.
Contribution rates of factors to drive LULCC in Chengdu by 2030. (a) Cropland; (b) Forest; (c) Shrub; (d) Grassland; (e) Water bodies; (f) Ice/snow; (g) Bare land; (h) Built-up land.
3.3. Characteristics of Carbon Stock in Chengdu
3.3.1. Temporal Variation Characteristics of Carbon Stock
From 2000 to 2020 (Table 6), Chengdu’s total carbon stock showed a decreasing trend, decreasing from 9.7613 × 10⁷ t in 2000 to 9.436 × 10⁷ t in 2020. The total carbon stock decreased by 3.2502 × 10⁶ t, with an average annual decrease of 1.6251 × 10⁵ t. Carbon stocks contributed by cropland decreased from 4.892 × 10⁷ t to 4.3443 × 10⁷ t, while those from forest increased from 4.8108 × 10⁷ t to 5.0214 × 10⁷ t. This reflects the positive outcomes of ecological restoration policies. This transformation is closely related to Chengdu’s continued promotion of natural forest protection, returning farmland to forest, and ecological construction of park cities. In particular, the citywide greening campaign and the construction of the Tianfu Greenway system implemented during the 13th Five-Year Plan period (2016–2020) have significantly increased both forested land area and forest quality. Carbon stocks contributed by grasslands increased from 5.87962 × 10⁵ t to 6.6381 × 10⁵ t, while those from shrublands decreased from 6.5207 × 10³ t to 4.3587 × 10⁴ t.
Table 6.
Changes in Carbon stocks in Chengdu from 2000–2020 (t).
From 2005 to 2010, Chengdu’s total carbon stock showed a significant decrease, decreasing by 5.551 × 10⁶ t, with an average annual decrease of 1.1102 × 10⁶ t. The carbon stocks contributed by cropland and forest fluctuated. Forest carbon stocks dropped to 3.836 × 10⁷ t in 2010, but rebounded to 5.0213 × 107 t by 2020, demonstrating the positive outcomes of ecological restoration and forest recovery policies. The carbon stock in cropland decreased by 5.4771 × 10⁶ t between 2000 and 2020, decreasing from 4.8920 × 10⁷ t to 4.3442 × 10⁷ t.
According to the projected data, from 2020 to 2030, under the NDS, UDS, CPS, and EPS development scenarios, Chengdu’s total carbon stock will increase from 9.4364 × 10⁷ tons in 2020 to 9.9605 × 10⁷ tons, 9.9141 × 10⁷ tons, 1.0076 × 10⁸ tons, and 1.0295 × 10⁸ tons, respectively. This increase is primarily attributed to the significant increase in forest carbon stocks, which far exceed the 2020 level (5.0214 × 10⁷ tons) under all scenarios. Particularly under the Ecological Protection Scenario (EPS), forest carbon stocks reach the highest level of 6.3758 × 10⁷ tons. This indicates that strengthening the role of forests as a core carbon sink through an ecologically driven development strategy will be the key driver for regional carbon stock growth in the future (Table 7).
Table 7.
Projected carbon stocks under four scenarios in 2030 (t).
3.3.2. Spatial Distribution Characteristics of Carbon Stocks
Chengdu’s carbon stocks exhibit a spatial pattern with higher values in the northwest (e.g., Dujiangyan, Pengzhou) and lower values in the central urban districts (e.g., Jinjiang, Qingyang). The northwest benefits from favorable ecological conditions, while urbanized areas have lower carbon stocks, with Jinjiang having the lowest at 7.5844 × 10⁴ t. The urban-rural transition zone shows moderate carbon stocks. This distribution aligns with land use, where areas with forest and cropland have higher carbon sink capacities, and areas with expanding built-up land have lower carbon stocks (Figure 8).
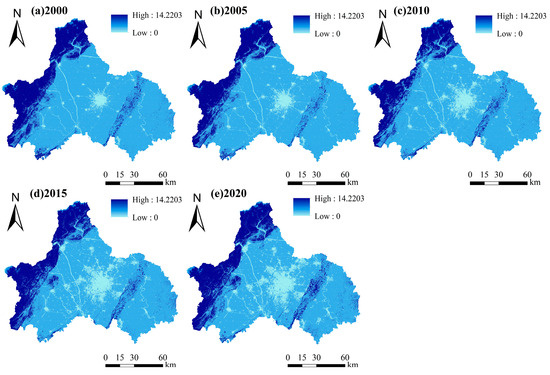
Figure 8.
Spatial Distribution of Carbon Stocks in Chengdu. (a) 2000; (b) 2005; (c) 2010; (d) 2015; (e) 2020.
Under four development scenarios (Figure 9), the spatial distribution pattern of Chengdu’s carbon stocks in 2030 is consistent with that observed between 2000 and 2020. High-carbon-stock areas are primarily distributed in mountainous and hilly regions, such as Jianyang, Qionglai, Dujiangyan, Pengzhou, and Chongzhou. Under the EPS, Chengdu has the highest total carbon stock (1.0295 × 10⁸ t), an increase of 8.5853 × 10⁶ t compared to 2020, indicating the most significant enhancement in carbon stock capacity under EPS. Overall, carbon stocks are consistent with land use, with forests as the main carbon sink, while carbon stocks decrease in areas of built-up land expansion.
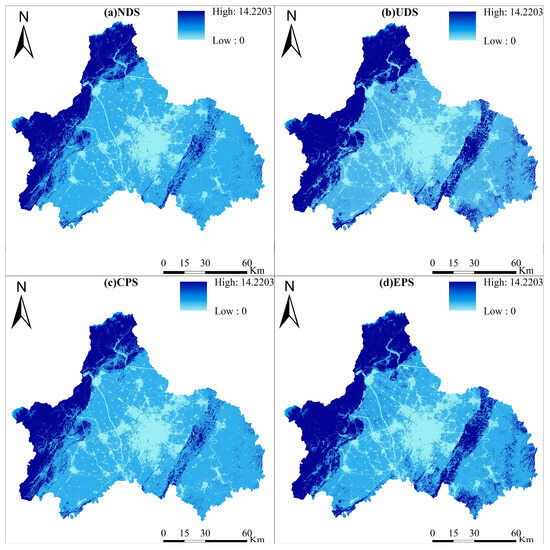
Figure 9.
Spatial Distribution of Carbon Stocks Under Four Scenarios for 2030. (a) NDS; (b) UDS; (c) CPS; (d) EPS.
4. Discussion
In this study, we employed the PLUS and InVEST models to simulate and predict spatiotemporal changes in land use and carbon stocks in Chengdu. The PLUS model captures the spatial self-organizing characteristics and randomness of LULCC through LEAS and CARS strategies, while utilizing the random forest algorithm to address nonlinear relationships among multiple drivers [29,32]. Simulation results usually exhibit high consistency with actual LULCC patterns, and model accuracy is generally satisfactory [56,57,58]. The InVEST model provides a land-type-based carbon stock estimation method, which allows for spatial analysis of large-scale regional carbon stocks, and facilitates comparisons of carbon stock changes under different development scenarios [59,60,61]. Compared to traditional field surveys or biomass measurements, this research method has significant advantages in spatial coverage, data acquisition efficiency, and scenario prediction capabilities [62,63,64,65].
The land use in Chengdu is characterized by “plains dominated by cropland and hills dominated by forest and grassland”, which is closely related to topography, climate, and socioeconomic factors. This is due to the flat topography, fertile soil, and rich water resources of the plains, which are suitable for agricultural development, and thus have a high proportion of cropland. In contrast, the hilly topography is rugged and transportation is inconvenient, making it less favorable for cultivation and urban expansion, thus supporting more forest and grassland [66,67,68]. The drivers of LULCC include rapid urbanization, transportation infrastructure development, population growth, and industrial restructuring. The conversion of cropland to built-up land is primarily concentrated in areas near cities and convenient for transportation, which is highly correlated with population density and the spatial distribution of road networks [69,70]. Moreover, ecological conservation policies and cropland protection measures have a significant effect on maintaining forests and cropland. For example, the “Ecological Red Line” and “Farmland Protection” policies have greatly decreased the risk of excessive land development [71,72,73].
Under different development scenarios, the land use changes in the future (2030) of Chengdu showed significant differences. In the natural development scenario, land use trends continue the patterns observed over the past two decades (2000–2020), with built-up land gradually expanding. In the urban priority scenario, the expansion of built-up land accelerates. In the cropland protection and ecological conservation scenarios, cropland and forest remain relatively stable, while ecological spaces are optimized. Policy factors have a regulatory effect on land use, as LULCC is not only constrained by natural conditions, but also dependent on socioeconomic development strategies and planning management [74,75,76,77,78,79]. Future land use in Chengdu may change into a pattern of balanced development between urban expansion and ecological conservation. Li et al. (2023) [30] found that Kunming’s carbon storage continuously declined from 2000 to 2020 due to urbanization and expansion of built-up land, especially in low-altitude areas. However, the implementation of ecological red-line policies and restoration measures effectively mitigated carbon loss, with forest conservation playing a crucial role. Comparably, Chengdu experienced carbon loss under rapid urban expansion, but stricter ecological protection and forest restoration policies have led to partial recovery in mountainous regions [30].
The spatiotemporal distribution of carbon stocks in Chengdu is highly correlated with land use, with higher and more stable carbon stocks found in forest and grassland, while cropland and built-up land have lower carbon stocks. This can be explained by the fact that the spatial differences in carbon stocks are primarily determined by the distribution of land types, vegetation cover, and topographic factors [80,81,82]. The LULCC directly impacts carbon stocks, such as when cropland conversion to built-up land increases carbon emissions, while forest restoration and ecological restoration enhance regional carbon sink capacity. The negative impact of urban expansion on carbon stocks is greatest in plains, where urban development is concentrated. Protecting and restoring the forest in mountainous areas can partially offset carbon losses [40,83]. Furthermore, policy and planning measures significantly shape the spatial distribution of carbon stocks, such as “Ecological Red Line Protection”, which can maintain high local carbon stocks [84,85,86].
This study provides valuable insights into the relationship between land use change and carbon storage, but some limitations remain. The socioeconomic data used as driving factors have certain time lags, which may not fully reflect the latest land use trends. In addition, the InVEST model estimates carbon storage based on average carbon density values for each land type, without considering spatial heterogeneity or management differences, which may cause uncertainty in the results. Future work should refine carbon density parameterization and update socioeconomic datasets to improve the model’s accuracy.
5. Conclusions
This study employs land use data from 2000 to 2020, and the PLUS-InVEST to simulate and analyze the impact of land use changes on carbon stocks, while exploring the patterns of land use and carbon stock changes in Chengdu in 2030. The research showed that the continuous decrease in cropland and rapid expansion of built-up land during 2000–2020 caused a decline in regional carbon stocks. Urbanization is an important driver of carbon stock decrease. Chengdu’s carbon stocks show a spatial pattern of higher values in the northwest and lower levels in the central area, with cropland and forest contributing the most to regional carbon sinks. Compared to 2020, carbon stocks under all four future development scenarios (2030) show increases, though the differences in increases are significant. Land use policies can significantly influence future carbon sink potential, with ecological priority and cropland protection measures contributing to enhanced regional carbon storage capacity. Chengdu’s future land use will follow an overall trend of “decreasing cropland, expanding construction land, and increasing forest land.” While optimizing the territorial spatial pattern and implementing the “dual carbon” strategy hold positive implications for regional low-carbon transformation, it is essential to acknowledge the practical constraints arising from rapid urbanization. These include rigid demands for construction land expansion driven by economic growth and spatial conflicts between cropland protection and urban development, which pose significant barriers to policy implementation. To further balance urban growth and carbon goals, future planning in Chengdu should prioritize compact urban development and enhanced ecological protection. The Longmen and Longquan Mountains should remain key conservation zones due to their high carbon storage capacity. Strengthening forest restoration and cropland protection will help maintain regional carbon sinks and support sustainable development. This study provides a reference for policymakers, demonstrating that optimizing territorial space and implementing the “dual carbon” strategy can contribute to regional low-carbon transformation and sustainable development.
Author Contributions
Conceptualization, Y.F. and L.L.; methodology, Y.F., J.H. and L.L.; software, J.H. and L.L.; validation, Z.Y., J.H. and Y.H.; formal analysis, J.H. and L.L.; investigation, J.H., Y.F. and L.L.; resources, Y.F. and L.L.; data curation, J.H. and L.L.; writing—original draft preparation, Y.F., J.H., Y.H. and L.L.; writing—review and editing, Y.F., J.H. and L.L.; visualization, J.H., Y.H., Z.Y. and L.L.; supervision, Y.F.; project administration, Y.F.; funding acquisition, Y.F. All authors have read and agreed to the published version of the manuscript.
Funding
This research was funded by the Yangtze River Key Ecological Functional Area Protection Policy Research Center (Grant No. YREPC2025-ZD001) and the Chengdu Technological University Talent Program (Grant No. 2025RC016).
Institutional Review Board Statement
Not applicable.
Informed Consent Statement
Not applicable.
Data Availability Statement
The data presented in this study are available on request from the corresponding author. The data are not publicly available due to the ongoing project to which the data belong.
Acknowledgments
We acknowledge the financial support provided by the Yangtze River Key Ecological Functional Area Protection Policy Research Center and Chengdu Technological University for this study.
Conflicts of Interest
The authors declare no conflicts of interest.
References
- Ciais, P. The Global Carbon Cycle and the Role of Terrestrial Ecosystems. Glob. Biogeochem. Cycle 2019, 33, 123–145. [Google Scholar]
- Piao, S.; Yue, C.; Ding, J.; Guo, Z. Perspectives on the Role of Terrestrial Ecosystems in the ‘Carbon Neutrality’ Strategy. Sci. China Earth Sci. 2022, 65, 1178–1186. [Google Scholar] [CrossRef]
- Qiu, L.; Niu, K.; He, W.; Hu, Y. Two Contribution Paths of Carbon Neutrality: Terrestrial Ecosystem Carbon Sinks and Anthropogenic Carbon Emission Reduction—A Case of Chongqing, China. Sustainability 2023, 15, 11306. [Google Scholar] [CrossRef]
- Chen, G.; Liu, X.; Li, X. Global Terrestrial Carbon Storage Change Affected by Future Land Dynamics Under Social-Climatea Scenarios. Earth’s Future 2025, 13, e2024EF005873. [Google Scholar] [CrossRef]
- Xu, M.; Guo, B.; Zhang, R. Variations of Terrestrial Net Ecosystem Productivity in China Driven by Climate Change and Human Activity from 2010 to 2020. Forests 2024, 15, 1484. [Google Scholar] [CrossRef]
- IPCC. Climate Change and Land: An IPCC Special Report on Climate Change, Desertification, Land Degradation, Sustainable Land Management, Food Security, and Greenhouse Gas Fluxes in Terrestrial Ecosystems; Cambridge University Press: Cambridge, UK, 2019. [Google Scholar]
- IPCC. Climate Change 2022: Impacts, Adaptation and Vulnerability. Contribution of Working Group II to the Sixth Assessment Report of the Intergovernmental Panel on Climate Change; Cambridge University Press: Cambridge, UK, 2022. [Google Scholar]
- Friedlingstein, P.; Jones, M.W.; O’Sullivan, M.; Andrew, R.M.; Bakker, D.C.E.; Hauck, J.; Peters, G.P.; Peters, W.; Pongratz, J.; Sitch, S.; et al. Global Carbon Budget 2024. Earth Syst. Sci. Data 2025, 17, 965–1039. [Google Scholar] [CrossRef]
- Rasool, R.; Fayaz, A.; Shafiq, M.U.; Singh, H.; Ahmed, P. Land Use Land Cover Change in Kashmir Himalaya: Linking Remote Sensing with an Indicator Based DPSIR Approach. Ecol. Indic. 2021, 125, 107447. [Google Scholar] [CrossRef]
- Wang, L.; Wang, K.; Sheng, M. Changes in Land Use Are Associated with the Accumulation of Soil Phytolith-Occluded Organic Carbon. Ecol. Indic. 2023, 151, 110300. [Google Scholar] [CrossRef]
- Chang, S.Z.; Wang, Z.M.; Song, K.S.; Liu, D.W.; Zhang, B.; Zhang, C.H.; Zhang, S.M. Impact of Land Use and Land Cover Change on the Vegetation Carbon Storage in Sanjiang Plain. Chin. J. Ecol. 2010, 29, 207–214. [Google Scholar]
- Resende, F.M.; Cimon-Morin, J.; Poulin, M.; Meyer, L.; Joner, D.C.; Loyola, R. The Importance of Protected Areas and Indigenous Lands in Securing Ecosystem Services and Biodiversity in the Cerrado. Ecosyst. Serv. 2021, 49, 101282. [Google Scholar] [CrossRef]
- Huera-Lucero, T.; Lopez-Piñeiro, A.; Torres, B.; Bravo-Medina, C. Biodiversity and Carbon Sequestration in Chakra-Type Agroforestry Systems and Humid Tropical Forests of the Ecuadorian Amazon. Forests 2024, 15, 557. [Google Scholar] [CrossRef]
- Zhu, Y.; Quan, B. A Muti-Scenario Prediction and Spatiotemporal Analysis of the LUCC and Carbon Storage Response: A Case Study of the Central Shanxi Urban Agglomeration. Sustainability 2025, 17, 1532. [Google Scholar] [CrossRef]
- Setiawan, O.; Rahayu, A.A.D.; Samawandana, G.; Tata, H.L.; Dharmawan, I.W.S.; Rachmat, H.H.; Suharti, S.; Windyoningrum, A.; Khotimah, H. Unraveling Land Use Land Cover Change, Their Driving Factors, and Implication on Carbon Storage Through an Integrated Modelling Approach. Egypt. J. Remote Sens. Space Sci. 2024, 27, 615–627. [Google Scholar] [CrossRef]
- Wang, K.; He, K.; Wang, X.-C.; Xie, L.; Dong, X.; Lei, F.; Gong, C.; Liu, M. Land-Based Carbon Effects and Human Well-Being Nexus. Land 2024, 13, 1419. [Google Scholar] [CrossRef]
- Wu, B.; Zhang, Y.; Wang, Y.; Lin, X.; Wu, Y.; Wang, J.; Wu, S.; He, Y. Urbanization promotes carbon storage or not? The evidence during the rapid process of China. J. Environ. Manag. 2024, 359, 121061. [Google Scholar] [CrossRef]
- Zhang, C.; Ren, X.; Zhao, W.; Wang, P.; Bi, W.; Du, Z. Decoupling and peak prediction of industrial land carbon emissions in East China for developing countries’ prosperous regions. Sci. Rep. 2025, 15, 6169. [Google Scholar] [CrossRef]
- Yang, S.; Li, L.; Zhu, R.; Luo, C.; Lu, X.; Sun, M.; Xu, B. Assessing land-use changes and carbon storage: A case study of the Jialing River Basin, China. Sci. Rep. 2024, 14, 15984. [Google Scholar] [CrossRef]
- Tonosaki, K.; Imi, K.; Teshirogi, J.; Kida, K.; Ishizuka, S. Study on Soil Carbon Stock Changes Due to Land Use Changes from Forest and Cropland to Settlements. J. Jpn. Soc. Reveg. Technol. 2022, 48, 374–385. [Google Scholar] [CrossRef]
- Cheng, Y.; Luo, P.; Yang, H.; Li, M.; Ni, M.; Li, H.; Huang, Y.; Xie, W.; Wang, L. Land Use and Cover Change Accelerated China’s Land Carbon Sinks Limits Soil Carbon. npj Clim. Atmos. Sci. 2024, 7, 199. [Google Scholar] [CrossRef]
- Liao, Z.; Yue, C.; He, B.; Zhao, K.; Ciais, P.; Alkama, R.; Grassi, G.; Sitch, S.; Chen, R.; Quan, X.; et al. Growing Biomass Carbon Stock in China Driven by Expansion and Conservation of Woody Areas. Nat. Geosci. 2024, 17, 1127–1134. [Google Scholar] [CrossRef]
- Yu, H.; Song, W. Research Progress on the Impact of Land Use Change on Soil Carbon Sequestration. Land 2023, 12, 213. [Google Scholar] [CrossRef]
- Sun, S.; Chen, B.; Yan, J.; Van Zwieten, L.; Wang, H.; Dong, J.; Fu, P.; Song, Z. Potential Impacts of Land Use and Land Cover Change (LUCC) and Climate Change on Evapotranspiration and Gross Primary Productivity in the Haihe River Basin, China. J. Clean. Prod. 2024, 476, 143729. [Google Scholar] [CrossRef]
- Li, J.; Guo, X.; Chuai, X.; Xie, F.; Yang, F.; Gao, R.; Ji, X. Reexamine China’s Terrestrial Ecosystem Carbon Balance Under Land Use-Type and Climate Change. Land Use Policy 2021, 102, 105275. [Google Scholar] [CrossRef]
- Song, J.; He, X.; Zhang, F.; Ma, X.; Jim, C.Y.; Johnson, B.A.; Chan, N.W. Analyzing and Predicting LUCC and Carbon Storage Changes in Xinjiang’s Arid Ecosystems Under the Carbon Neutrality Goal. Remote Sens. 2024, 16, 4439. [Google Scholar] [CrossRef]
- Feng, H.; Wang, S.; Zou, B.; Yang, Z.; Wang, S.; Wang, W. Contribution of Land Use and Cover Change (LUCC) to the Global Terrestrial Carbon Uptake. Sci. Total Environ. 2023, 901, 165932. [Google Scholar] [CrossRef]
- Fang, J.; Guo, Z.; Piao, S.; Chen, A. Terrestrial Vegetation Carbon Sinks in China, 1981–2000. Sci. China Ser. D 2007, 50, 1341–1350. [Google Scholar] [CrossRef]
- Wang, Q.; Zhang, W.; Xia, J.; Ou, D.; Tian, Z.; Gao, X. Multi-Scenario Simulation of Land-Use/Land-Cover Changes and Carbon Storage Prediction Coupled with the SD-PLUS-InVEST Model: A Case Study of the Tuojiang River Basin, China. Land 2024, 13, 1518. [Google Scholar] [CrossRef]
- Li, Y.; Yang, X.; Wu, B.; Zhao, J.; Jiang, W.; Feng, X.; Li, Y. Spatio-Temporal Evolution and Prediction of Carbon Storage in Kunming Based on PLUS and InVEST Models. PeerJ 2023, 11, e15285. [Google Scholar] [CrossRef]
- Bacani, V.M.; Machado da Silva, B.H.; Ayumi de Souza Amede Sato, A.; Souza Sampaio, B.D.; Rodrigues da Cunha, E.; Pereira Vick, E.; Ribeiro de Oliveira, V.F.; Decco, H.F. Carbon Storage and Sequestration in a Eucalyptus Productive Zone in the Brazilian Cerrado, Using the Ca-Markov/Random Forest and InVEST Models. J. Clean. Prod. 2024, 444, 141291. [Google Scholar] [CrossRef]
- Levy, P.E.; Friend, A.D.; White, A.; Cannell, M.G.R. The Influence of Land Use Change on Global-Scale Fluxes of Carbon from Terrestrial Ecosystems. Clim. Change 2004, 67, 185–209. [Google Scholar] [CrossRef]
- Nie, Q.; Man, W.; Li, Z.; Wu, X. From Policy to Practice: Assessing Carbon Storage in Fujian Province Using Patch-Generating Land Use Simulation and Integrated Valuation of Ecosystem Services and Tradeoffs Models. Land 2025, 14, 179. [Google Scholar] [CrossRef]
- Huang, S.-Q.; Wu, D.-F.; Pan, Y.-L.; Lin, J.-Y.; Zhou, P. A Study on the Spatiotemporal Dynamics of Land Cover Change and Carbon Storage in the Northern Gulf Economic Zone of Guangxi Based on the InVEST Model. Atmosphere 2024, 15, 1332. [Google Scholar] [CrossRef]
- Zhao, H.; Yang, C.; Lu, M.; Wang, L.; Guo, B. Patterns and Dominant Driving Factors of Carbon Storage Changes in the Qinghai–Tibet Plateau Under Multiple Land Use Change Scenarios. Forests 2024, 15, 418. [Google Scholar] [CrossRef]
- Huang, F.; Han, J. Land Use/Cover and Carbon Storage Changes in Central and Southern Liaoning Urban Agglomerations, China. In Proceedings of the 2015 IEEE International Geoscience and Remote Sensing Symposium (IGARSS), Milan, Italy, 26–31 July 2015; pp. 4625–4628. [Google Scholar]
- Liu, Y.; Wu, K.; Zhao, R. Bibliometric Analysis of Research on Soil Health from 1999 to 2018. J. Soils Sediments 2019, 20, 1513–1525. [Google Scholar] [CrossRef]
- Xiong, Z.; Zhang, Y.; Liu, M.; Hu, W. Assessing the Impact of Urbanization and Economic Growth on Terrestrial Carbon Storage Based on Remote Sensing: Evidence from the Yangtze River Economic Belt. Environ. Earth Sci. 2024, 83, 620. [Google Scholar] [CrossRef]
- Li, Z.; Zhu, J.; Tian, Y. Impact of Land-Use–Land Cover Changes on the Service Value of Urban Ecosystems: Evidence from Chengdu, China. J. Urban Plan. Dev. 2024, 150, 05024028. [Google Scholar] [CrossRef]
- Yuan, H.; Zhang, Z.; Feng, D.; Rong, X.; Zhang, S.; Yang, S. Assessment of the Impact of Land Use/Land Cover Change on Carbon Storage in Chengdu, China, in the Context of Carbon Peaking and Carbon Neutrality, 2000–2030. Environ. Dev. Sustain. 2024. [Google Scholar] [CrossRef]
- Zhai, D.; Zhang, X.; Zhuo, J.; Mao, Y. Driving the Evolution of Land Use Patterns: The Impact of Urban Agglomeration Built-up land in the Yangtze River Delta, China. Land 2024, 13, 1514. [Google Scholar] [CrossRef]
- Chen, W.; Wang, G.; Gu, T.; Fang, C.; Pan, S.; Zeng, J.; Wu, J. Simulating the Impact of Urban Expansion on Ecosystem Services in Chinese Urban Agglomerations: A Multi-Scenario Perspective. Environ. Impact Assess. Rev. 2023, 103, 107275. [Google Scholar] [CrossRef]
- Yu, Y.; Guo, B.; Wang, C.; Zang, W.; Huang, X.; Wu, Z.; Xu, M.; Zhou, K.; Li, J.; Yang, Y. Carbon Storage Simulation and Analysis in Beijing-Tianjin-Hebei Region Based on CA-Plus Model Under Dual-Carbon Background. Geomat. Nat. Hazards Risk 2023, 14, 2173661. [Google Scholar] [CrossRef]
- Zhu, Y.; Ma, B.; Hu, H.; Ding, D.; Zhou, H.; Liu, J.; Liu, J.; Lin, Z. Analysis and Prediction of Spatiotemporal Carbon Storage Changes in the Taihu Lake Basin in Jiangsu Province Based on PLUS and InVEST Model. Trees For. People 2025, 21, 100916. [Google Scholar] [CrossRef]
- Ning, J.; Liu, J.; Kuang, W.; Xu, X.; Zhang, S.; Yan, C.; Li, R.; Wu, S.; Hu, Y.; Du, G.; et al. Spatiotemporal patterns and characteristics of land-use change in China during 2010–2015. J. Geogr. Sci. 2018, 28, 547–562. [Google Scholar] [CrossRef]
- Gong, P.; Wang, J.; Yu, L.; Zhao, Y.; Zhao, Y.; Liang, L.; Niu, Z.; Huang, X.; Fu, H.; Liu, S.; et al. Finer resolution observation and monitoring of global land cover: First mapping results with Landsat TM and ETM+ data. Int. J. Remote Sens. 2013, 34, 2607–2654. [Google Scholar] [CrossRef]
- Liu, J.; Hou, Y.; Li, F.; Zheng, B.; Chen, Z.; Zheng, F.; Zhang, X.; Yu, R. Land Use Change Projection and Driving Factors Exploration in Hainan Island Based on the PLUS Model. Front. Mar. Sci. 2025, 12, 1534508. [Google Scholar] [CrossRef]
- Wu, F.; Mo, C.; Dai, X. Analysis of the Driving Force of Land Use Change Based on Geographic Detection and Simulation of Future Land Use Scenarios. Sustainability 2022, 14, 5254. [Google Scholar] [CrossRef]
- Liang, X.; Guan, Q.; Clarke, K.C.; Liu, S.; Wang, B.; Yao, Y. Understanding the Drivers of Sustainable Land Expansion Using a Patch-Generating Land Use Simulation (PLUS) Model: A Case Study in Wuhan, China. Comput. Environ. Urban Syst. 2021, 85, 101569. [Google Scholar] [CrossRef]
- Li, J.; Wang, J.; Li, L.; Zhou, C.; Niu, Q.; Zhang, C. Impact of Land Use Change on Carbon Storage in the Dongting Lake Eco-Economic Zone. Chin. J. Appl. Ecol. 2022, 41, 1156–1165. [Google Scholar]
- Tang, W.; Hu, J.; Zhang, H. Kappa Coefficient: A Popular Measure of Rater Agreement. Shanghai Arch. Psychiatry 2015, 27, 62–67. [Google Scholar]
- Piyathilake, I.D.U.H.; Udayakumara, E.P.N.; Ranaweera, L.V.; Jayawardana, D.T. Modeling Predictive Assessment of Carbon Storage Using InVEST Model in Uva Province, Sri Lanka. Model. Earth Syst. Environ. 2022, 8, 2213–2223. [Google Scholar] [CrossRef]
- Yuan, Z.; Huang, G.; Mo, H.; Shen, R.; Xu, M.; Qiu, S.; Zhao, F.; Li, R. Dynamic Evaluation of Ecosystem Biomass Carbon Stock in Baoxing County, Sichuan Province. For. Resour. Manag. 2014, 1, 82–88. [Google Scholar]
- Hou, R.; Xia, C.; Chen, J.; Zheng, Q.; Li, H.; Huang, J.; Huang, X.; Deng, J.; Han, X.; An, T.; et al. Carbon Stock in Forest Land and Other Biomass in the Yangtze River Economic Belt. Acta Ecol. Sin. 2022, 42, 9483–9498. [Google Scholar]
- Fan, L.; Zhu, J.; Li, Q.; Feng, Y.; Xiao, W. Effects of Land Use/Cover Change on Carbon Stock in the Three Gorges Reservoir Area. J. Nanjing For. Univ. (Nat. Sci. Ed.) 2018, 42, 53–60. [Google Scholar]
- Yang, Y.; Wang, H.; Li, X.; Huang, X.; Lyu, X.; Tian, H.; Qu, T. How Will Ecosystem Carbon Sequestration Contribute to the Reduction of Regional Carbon Emissions in the Future? Analysis Based on the MOP-PLUS Model Framework. Ecol. Indic. 2023, 156, 111156. [Google Scholar] [CrossRef]
- Zhang, Y.; Liao, X.; Sun, D. A Coupled InVEST-PLUS Model for the Spatiotemporal Evolution of Ecosystem Carbon Storage and Multi-Scenario Prediction Analysis. Land 2024, 13, 509. [Google Scholar] [CrossRef]
- Xu, Q.; Li, K. Multi-Scenario Simulation of Land Use and Assessment of Carbon Stocks in Terrestrial Ecosystems Based on SD-PLUS-InVEST Coupled Modeling in Nanjing City. Forests 2024, 15, 1824. [Google Scholar] [CrossRef]
- Wang, C.; Li, T.; Guo, X.; Xia, L.; Lu, C.; Wang, C. Plus-InVEST Study of the Chengdu-Chongqing Urban Agglomeration’s Land-Use Change and Carbon Storage. Land 2022, 11, 1617. [Google Scholar] [CrossRef]
- Ye, Y.; Lai, M.; Dong, M.; Li, Z.; Yuan, J.; Lyu, J. Coupling the PLUS-InVEST Model for Multi-Scenario Land Use Simulation and Carbon Storage Assessment in Northern Anhui, China. Sustainability 2025, 17, 4185. [Google Scholar] [CrossRef]
- Springgay, E.; Casallas Ramirez, S.; Janzen, S.; Vannozzi Brito, V. The Forest–Water Nexus: An International Perspective. Forests 2019, 10, 915. [Google Scholar] [CrossRef]
- Shao, Z.; Chen, C.; Liu, Y.; Cao, J.; Liao, G.; Lin, Z. Impact of Land Use Change on Carbon Storage Based on FLUS-InVEST Model: A Case Study of Chengdu–Chongqing Urban Agglomeration, China. Land 2023, 12, 1531. [Google Scholar] [CrossRef]
- Wang, Z.; Zhong, A.; Wei, E.; Hu, C. Carbon Storage Simulation and Land Use Optimization for High-Water-Table Resource-Based Cities Based on the Coupled GMOP-PLUS-InVEST Model. Remote Sens. 2024, 16, 4480. [Google Scholar] [CrossRef]
- Xu, K.; Li, R.; Liu, M.; Cao, Y.; Yang, J.; Wei, Y. Analysis of Carbon Storage Changes in the Chengdu–Chongqing Region Based on the PLUS-InVEST-MGWR Model. Land 2025, 14, 1651. [Google Scholar] [CrossRef]
- Zhou, J.; Johnson, V.C.; Shi, J.; Tan, M.L.; Zhang, F. Multi-Scenario Land Use Change Simulation and Spatial-Temporal Evolution of Carbon Storage in the Yangtze River Delta Region Based on the PLUS-InVEST Model. PLoS ONE 2025, 20, e0316255. [Google Scholar] [CrossRef]
- Deng, Y.; Shao, Z.; Dang, C.; Huang, X.; Zhuang, Q. The Impact of Policies on Land Cover and Ecosystem Services Dynamics in the Poyang Lake Ecological Economic Zone, China. Ecol. Indic. 2023, 156, 111169. [Google Scholar] [CrossRef]
- Lei, X.; Liu, H.; Li, S.; Luo, Q.; Cheng, S.; Hu, G.; Wang, X.; Bai, W. Coupling Coordination Analysis of Urbanization and Ecological Environment in Chengdu-Chongqing Urban Agglomeration. Ecol. Indic. 2024, 161, 111969. [Google Scholar] [CrossRef]
- Huang, W.; Deng, Y.; Chen, H.; Hai, Y.; Ma, A.; Duan, M.; Ming, L. Spatiotemporal Changes in Land Use and Identification of Driving Factor Contributions in the Chengdu-Chongqing Economic Circle Based on the Random Forest Model. Environ. Sci. Pollut. Res. 2025, 32, 18975–18994. [Google Scholar] [CrossRef] [PubMed]
- Liang, X.; Cao, Y.G.; Zhou, W. Analysis on Change in Land-Use and Its Driving Forces in Lanzhou City. Resour. Dev. Mark. 2010, 10, 876–879. [Google Scholar]
- Song, M.; Hu, C.; Yuan, J.; Zhang, A.; Liu, X. Toward an Ecological Civilization: Exploring Changes in China’s Land Use Policy Over the Past 35 Years Using Text Mining. J. Clean. Prod. 2023, 427, 139265. [Google Scholar] [CrossRef]
- Chen, X.; Xu, D.; Fadelelseed, S.; Li, L. Spatiotemporal Analysis and Control of Landscape Eco-Security at the Urban Fringe in Shrinking Resource Cities: A Case Study in Daqing, China. Int. J. Environ. Res. Public Health 2019, 16, 4640. [Google Scholar] [CrossRef] [PubMed]
- Jiang, Y.; Zhu, Y.; Tian, Y. Measuring the Urban Sprawl of a Mega-Urban Agglomeration Area Based on Multi-Dimensions with a Mechanical Equilibrium Model: A Case Study of the Yangtze River Delta, China. Land 2023, 12, 1548. [Google Scholar] [CrossRef]
- Zhu, L.; He, Y. Mitigating Spatial Land Use Conflicts Through an Ecological Lens: Insights from the Chengdu-Chongqing Urban Agglomeration. Environ. Dev. Sustain. 2025. [Google Scholar] [CrossRef]
- Yu, J.; Guo, S.; Wang, S.; Luo, Y. Multi-Scenario Simulation of Land Use Change and Ecosystem Health Assessment in Chengdu Metropolitan Area Based on SD-PLUS-VORS Coupled Modeling. Sustainability 2025, 17, 3202. [Google Scholar] [CrossRef]
- Dey, T.; S, D.; Singh, M.; A, A.; Tamang, M.; N, S.N.; Nath, A.J.; Shukla, G.; Chakravarty, S. Prioritizing Tree-Based Systems for Optimizing Carbon Sink in the Indian Sub-Himalayan Region. Land 2023, 12, 1155. [Google Scholar] [CrossRef]
- Xie, H.; Kung, C.-C.; Zhang, Y.; Li, X. Simulation of Regionally Ecological Land Based on a Cellular Automation Model: A Case Study of Beijing, China. Int. J. Environ. Res. Public Health 2012, 9, 2986–3001. [Google Scholar] [CrossRef]
- Wei, H.; Wang, Y.; Liu, J.; Zhang, J.; Cao, Y. Coordinated Development of Cropland Use and Ecological Protection in Cities Along the Main Stream of the Yellow River in Henan Province, China. Ecol. Indic. 2023, 156, 111143. [Google Scholar] [CrossRef]
- Zou, N.; Wang, C.; Wang, S.; Li, Y. Impact of Ecological Conservation Policies on Land Use and Carbon Stock in Megacities at Different Stages of Development. Heliyon 2023, 9, e18814. [Google Scholar] [CrossRef] [PubMed]
- Li, J.; Ouyang, X.; Zhu, X. Land Space Simulation of Urban Agglomerations from the Perspective of the Symbiosis of Urban Development and Ecological Protection: A Case Study of Changsha-Zhuzhou-Xiangtan Urban Agglomeration. Ecol. Indic. 2021, 126, 107669. [Google Scholar]
- Li, Y.; Jiang, H.; Zhang, B.; Yao, S.; Gao, X.; Zhang, J.; Hua, C. Comparative Evaluation of Multi-Scale Spatiotemporal Variability and Drivers of Carbon Storage: An Empirical Study from 369 Cities, China. Ecol. Indic. 2023, 154, 110568. [Google Scholar] [CrossRef]
- Wang, C.; Li, M.; Wang, X.; Deng, M.; Wu, Y.; Hong, W. Spatio-Temporal Dynamics of Carbon Storage in Rapidly Urbanizing Shenzhen, China: Insights and Predictions. Land 2024, 13, 1566. [Google Scholar] [CrossRef]
- Xing, S.; Yang, S.; Sun, H.; Wang, Y. Spatiotemporal Changes of Terrestrial Carbon Storage in Rapidly Urbanizing Areas and Their Influencing Factors: A Case Study of Wuhan, China. Land 2023, 12, 2134. [Google Scholar] [CrossRef]
- Cai, Y.; Wang, C.; Zhou, Y.; Deng, D. Temporal and Spatial Characteristics of Carbon Storage and Its Response to Land-Use Change in Chengdu, China. J. Chin. Archit. Urbanism 2024, 6, 3069. [Google Scholar] [CrossRef]
- Li, X.; Jiang, Y.; Liu, Y.; Sun, Y.; Li, C. The Impact of Landscape Spatial Morphology on Green Carbon Sink in the Urban Riverfront Area. Cities 2024, 148, 104919. [Google Scholar] [CrossRef]
- Gai, Z.; Xu, Y.; Du, G. Spatio-Temporal Differentiation and Driving Factors of Carbon Storage in Cropland-Use Transition. Sustainability 2023, 15, 3897. [Google Scholar] [CrossRef]
- Kong, J.; Chen, L. The Changes in Cropland Pattern Enhanced Carbon Storage in Northwest China. Agronomy 2023, 13, 2736. [Google Scholar] [CrossRef]


Disclaimer/Publisher’s Note: The statements, opinions and data contained in all publications are solely those of the individual author(s) and contributor(s) and not of MDPI and/or the editor(s). MDPI and/or the editor(s) disclaim responsibility for any injury to people or property resulting from any ideas, methods, instructions or products referred to in the content. |
© 2025 by the authors. Licensee MDPI, Basel, Switzerland. This article is an open access article distributed under the terms and conditions of the Creative Commons Attribution (CC BY) license (https://creativecommons.org/licenses/by/4.0/).