Does Low-Carbon Pilot City Policy Reduce Transportation CO2 Emissions? Evidence from China
Abstract
1. Introduction
2. Literature Review and Theoretical Hypotheses
2.1. Literature Review
2.2. Theoretical Hypotheses
3. Methodology and Data
3.1. Multiperiod DID Model
3.2. Mediating Effects Model
3.3. Data and Variables
4. Empirical Analysis
4.1. Parallel Trend Test and Dynamic Effect Analysis
4.2. Baseline Results
4.3. Indirect Mechanism
4.4. Robustness Tests
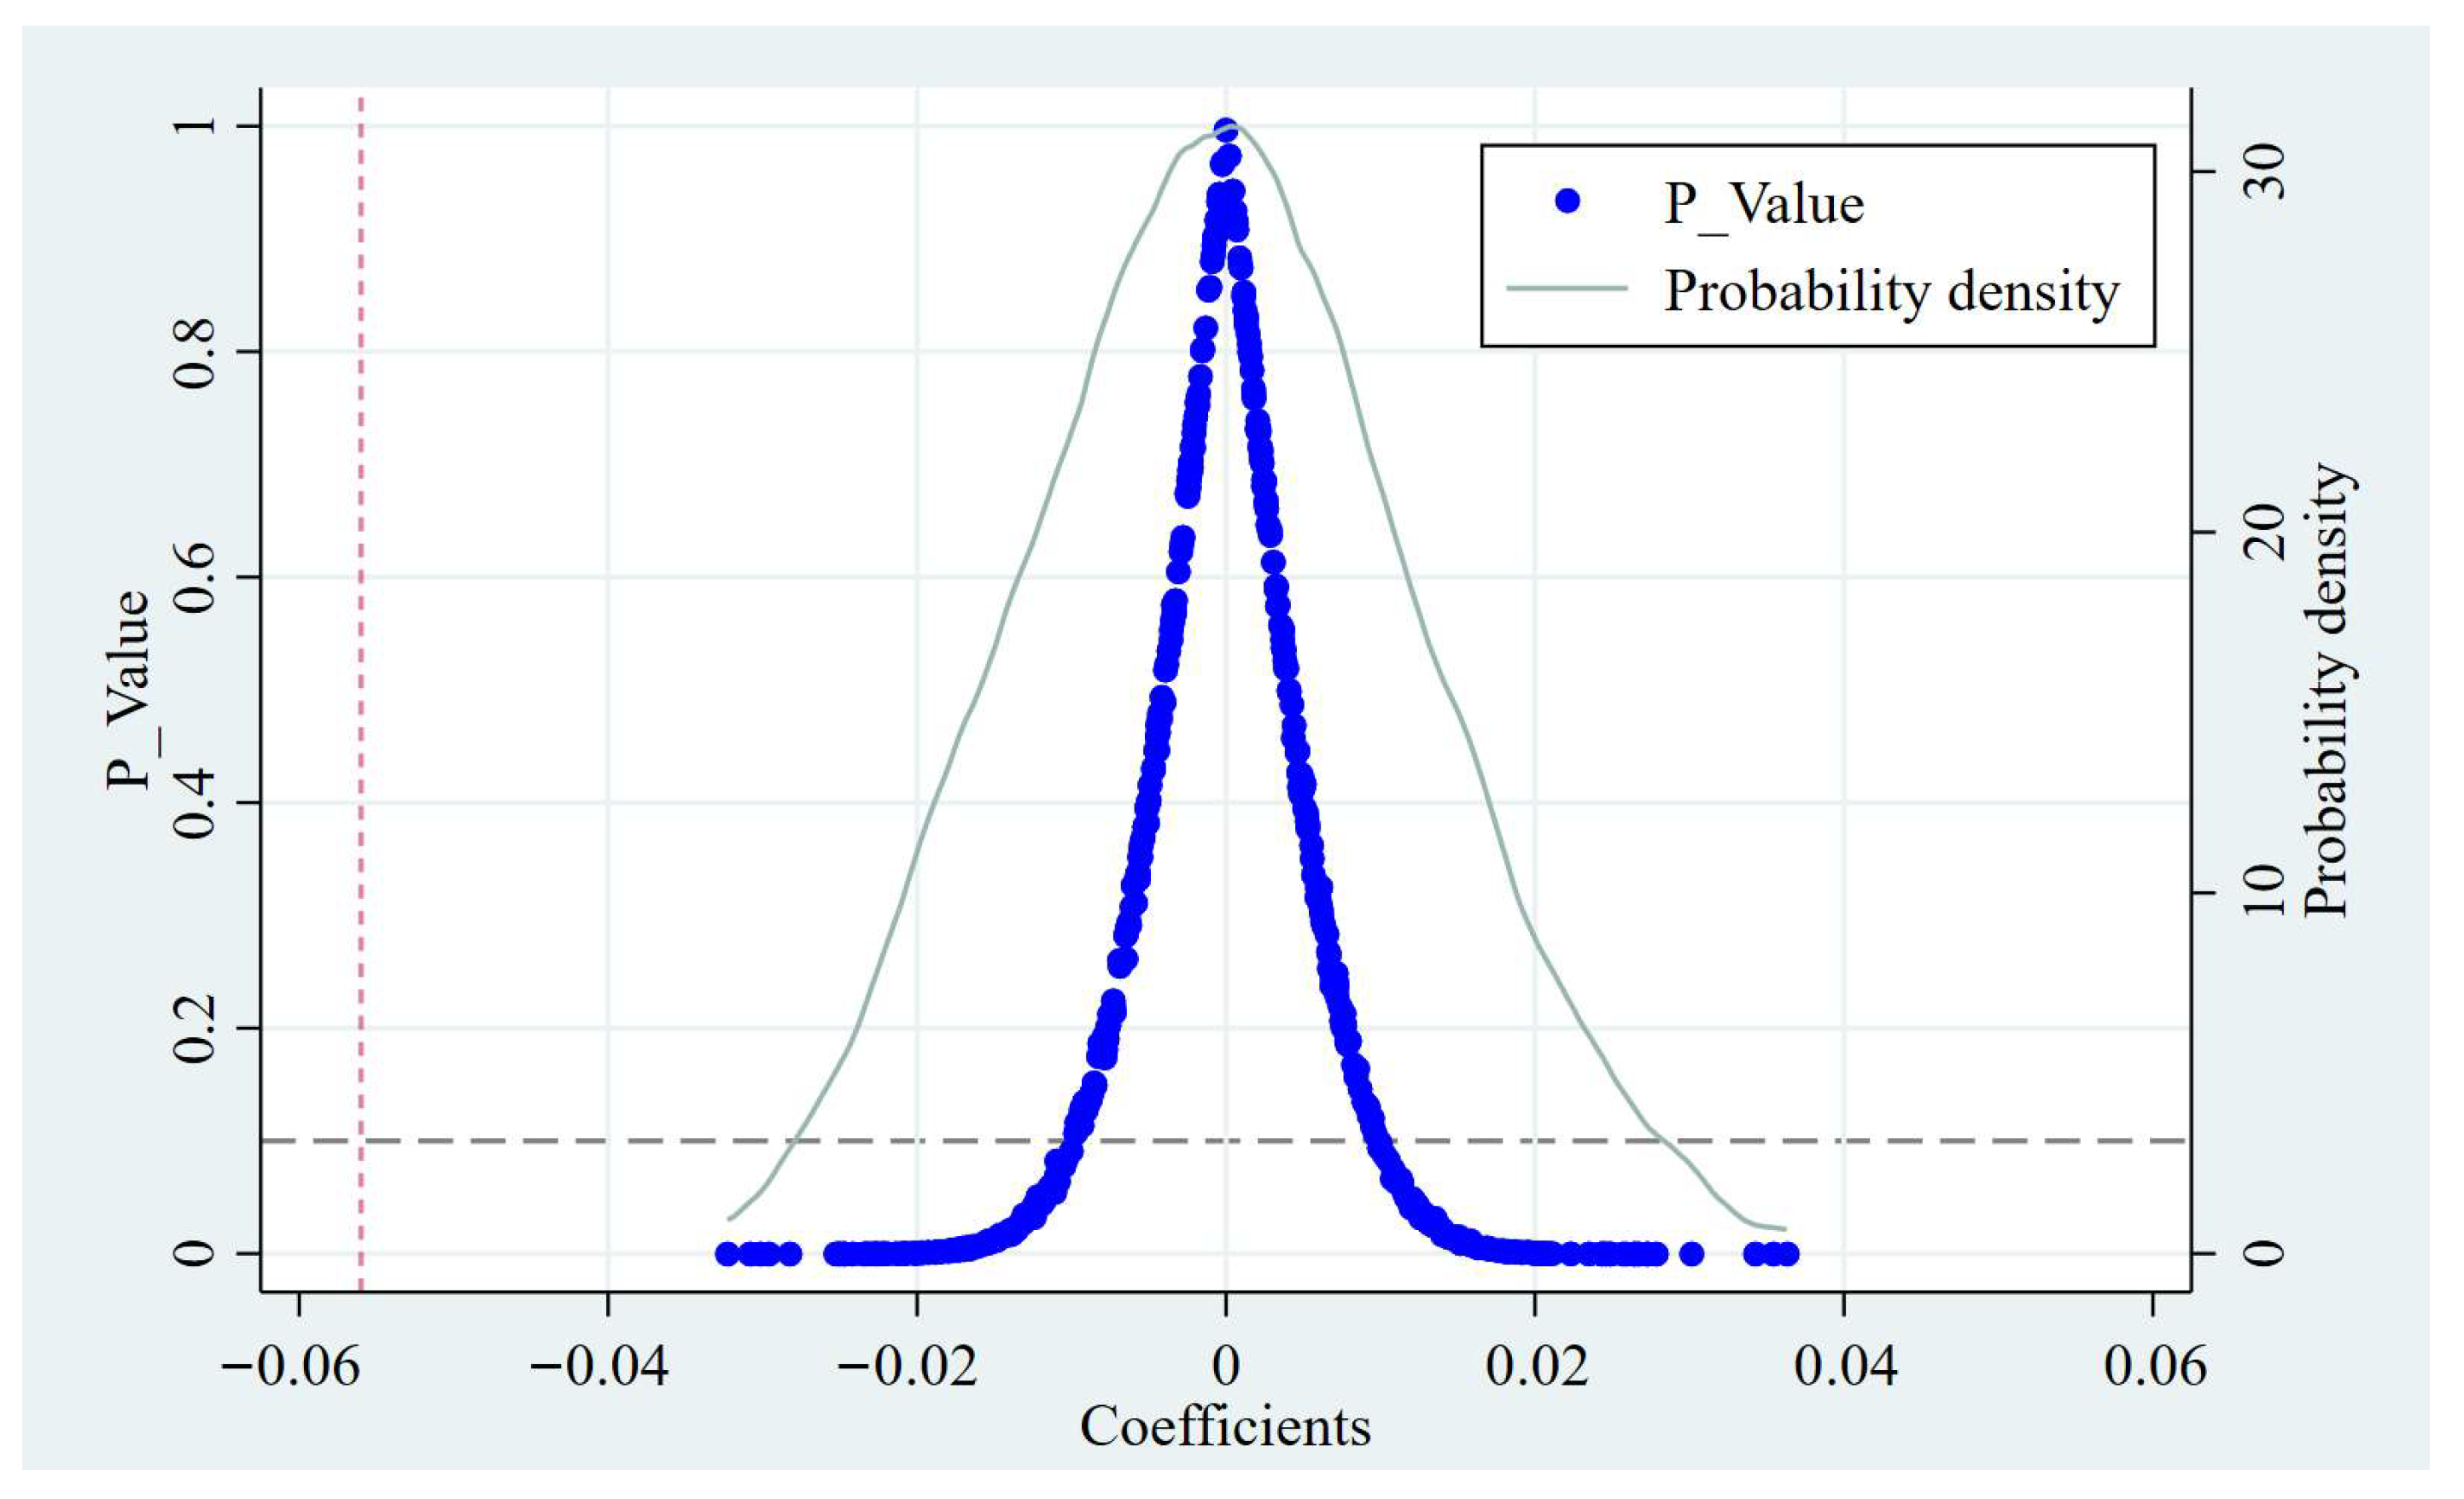
4.4.1. Placebo Test
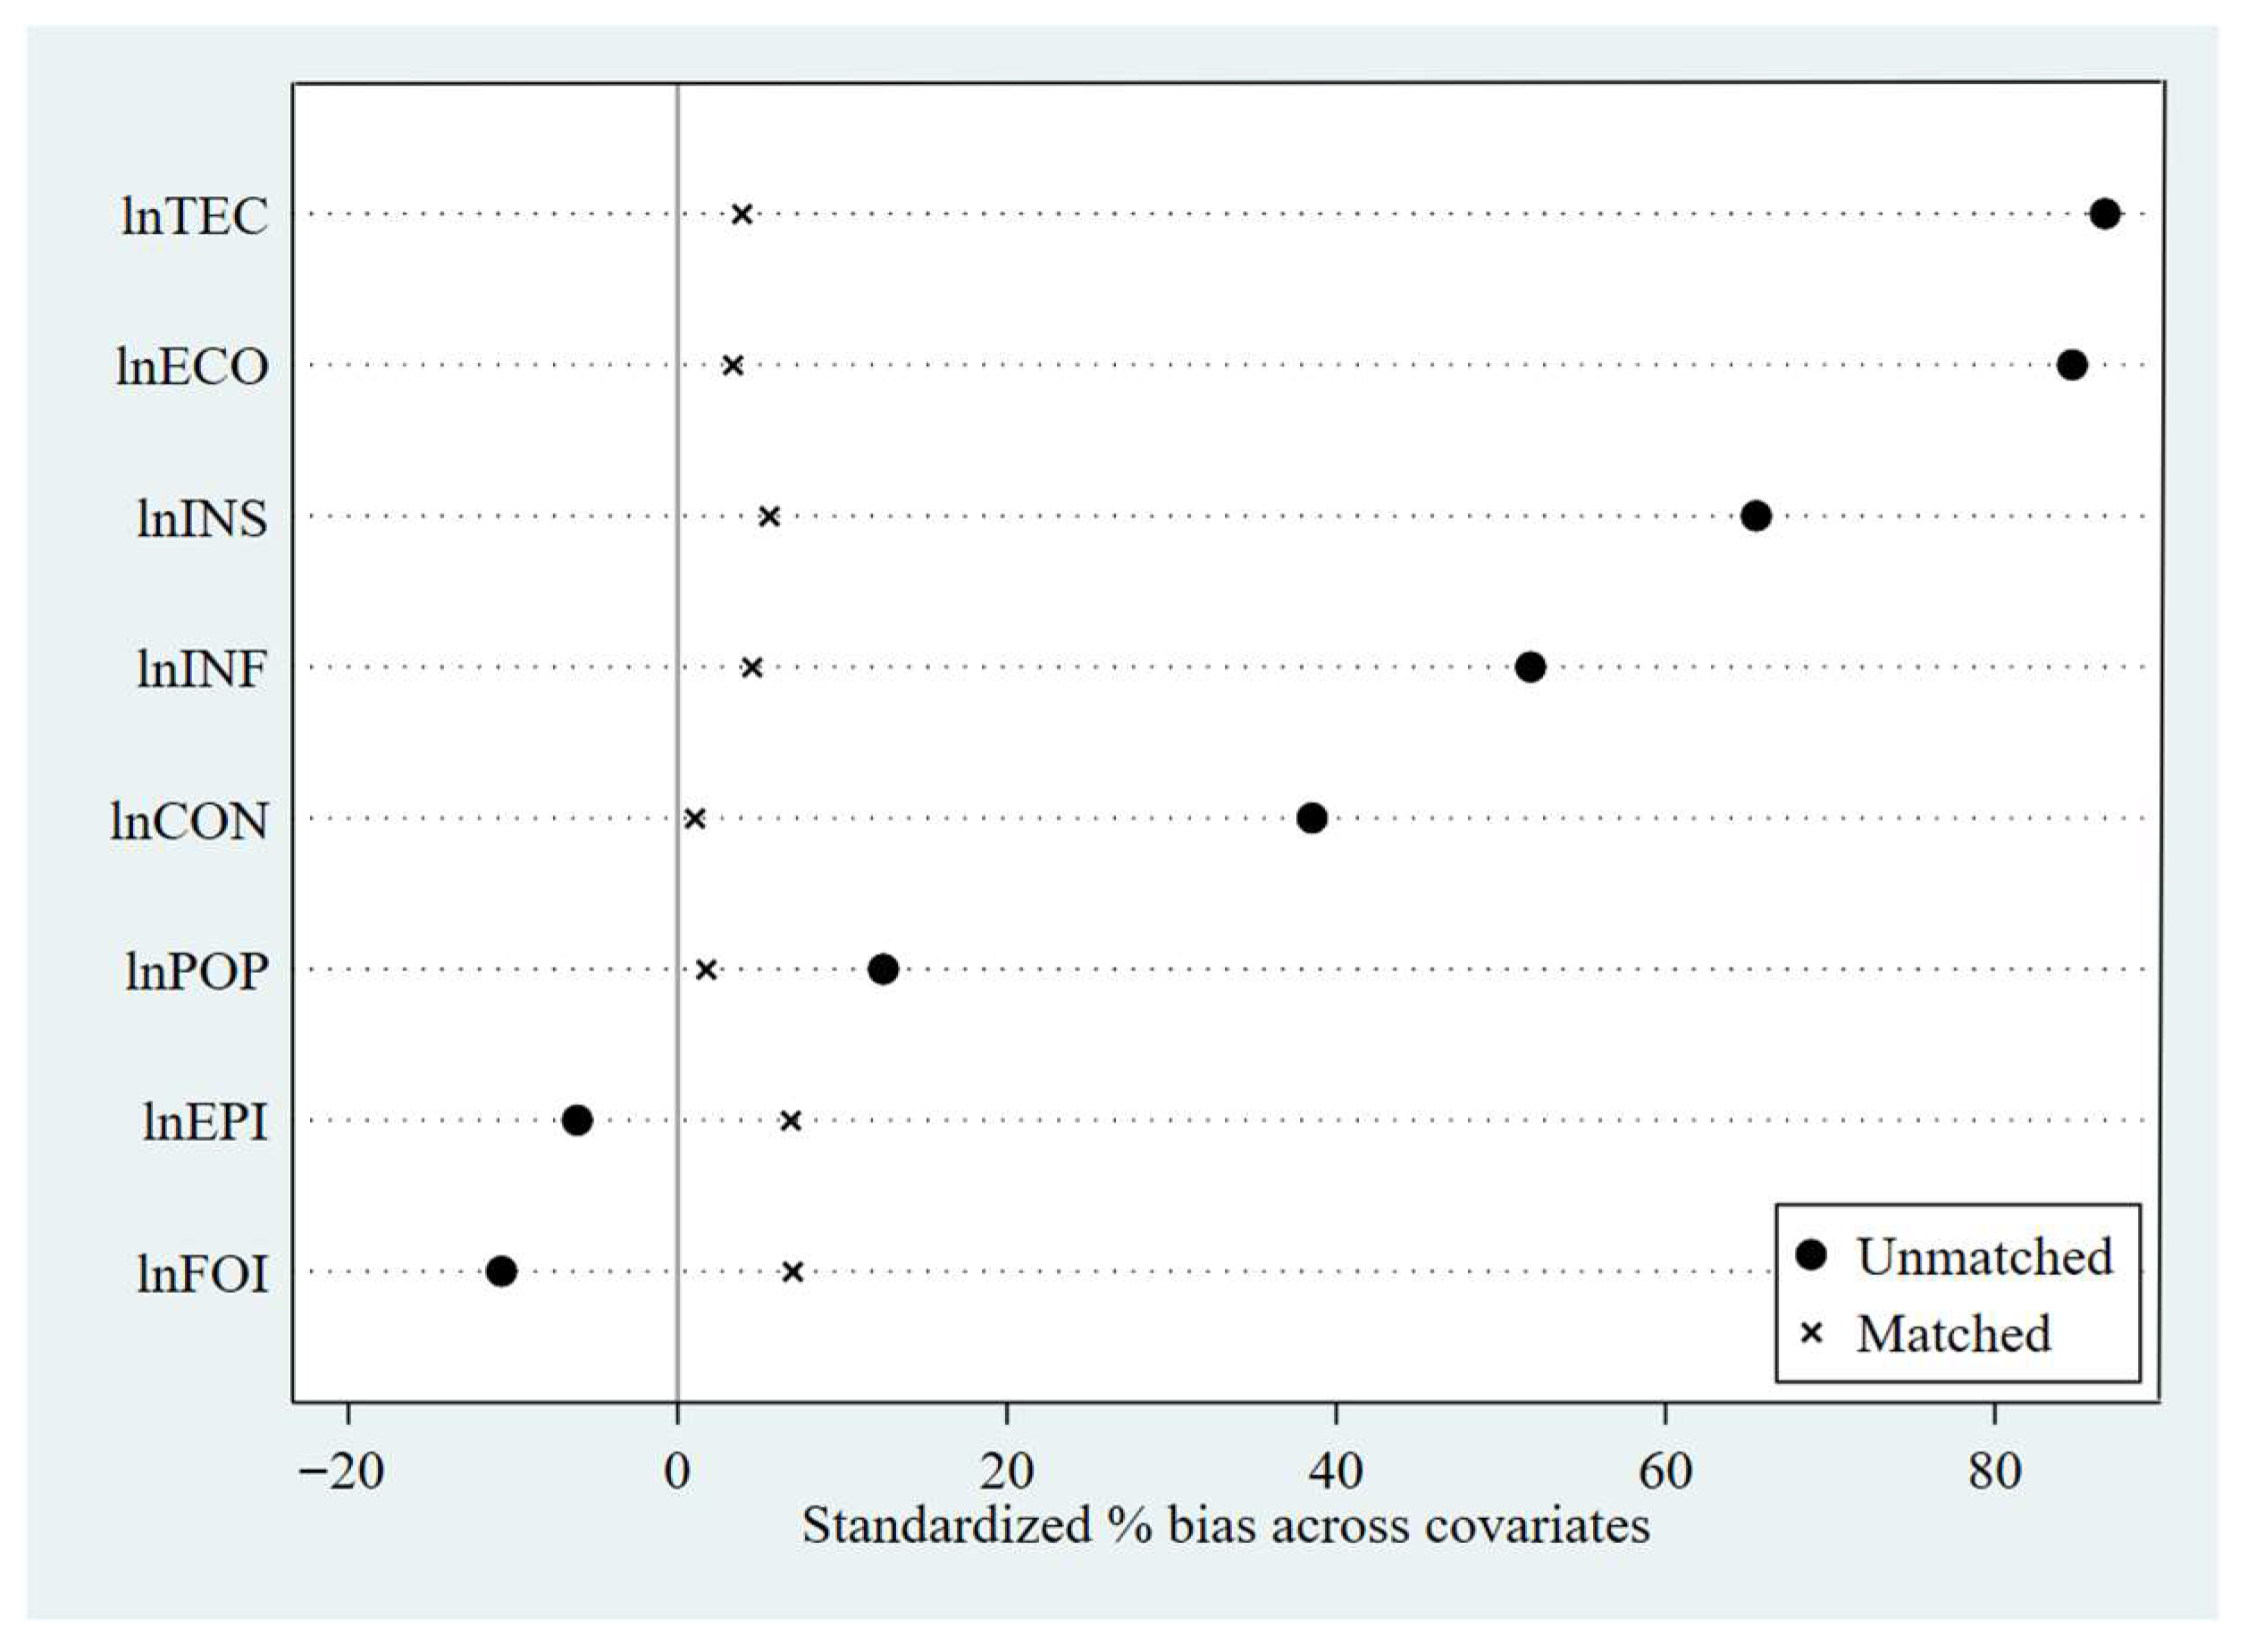
4.4.2. PSM–DID Estimation Results
5. Further Analysis
5.1. Heterogeneity Analysis
5.1.1. Heterogeneity in Geographic Location
5.1.2. Heterogeneity in City Type
5.2. Spatial Spillover Analysis
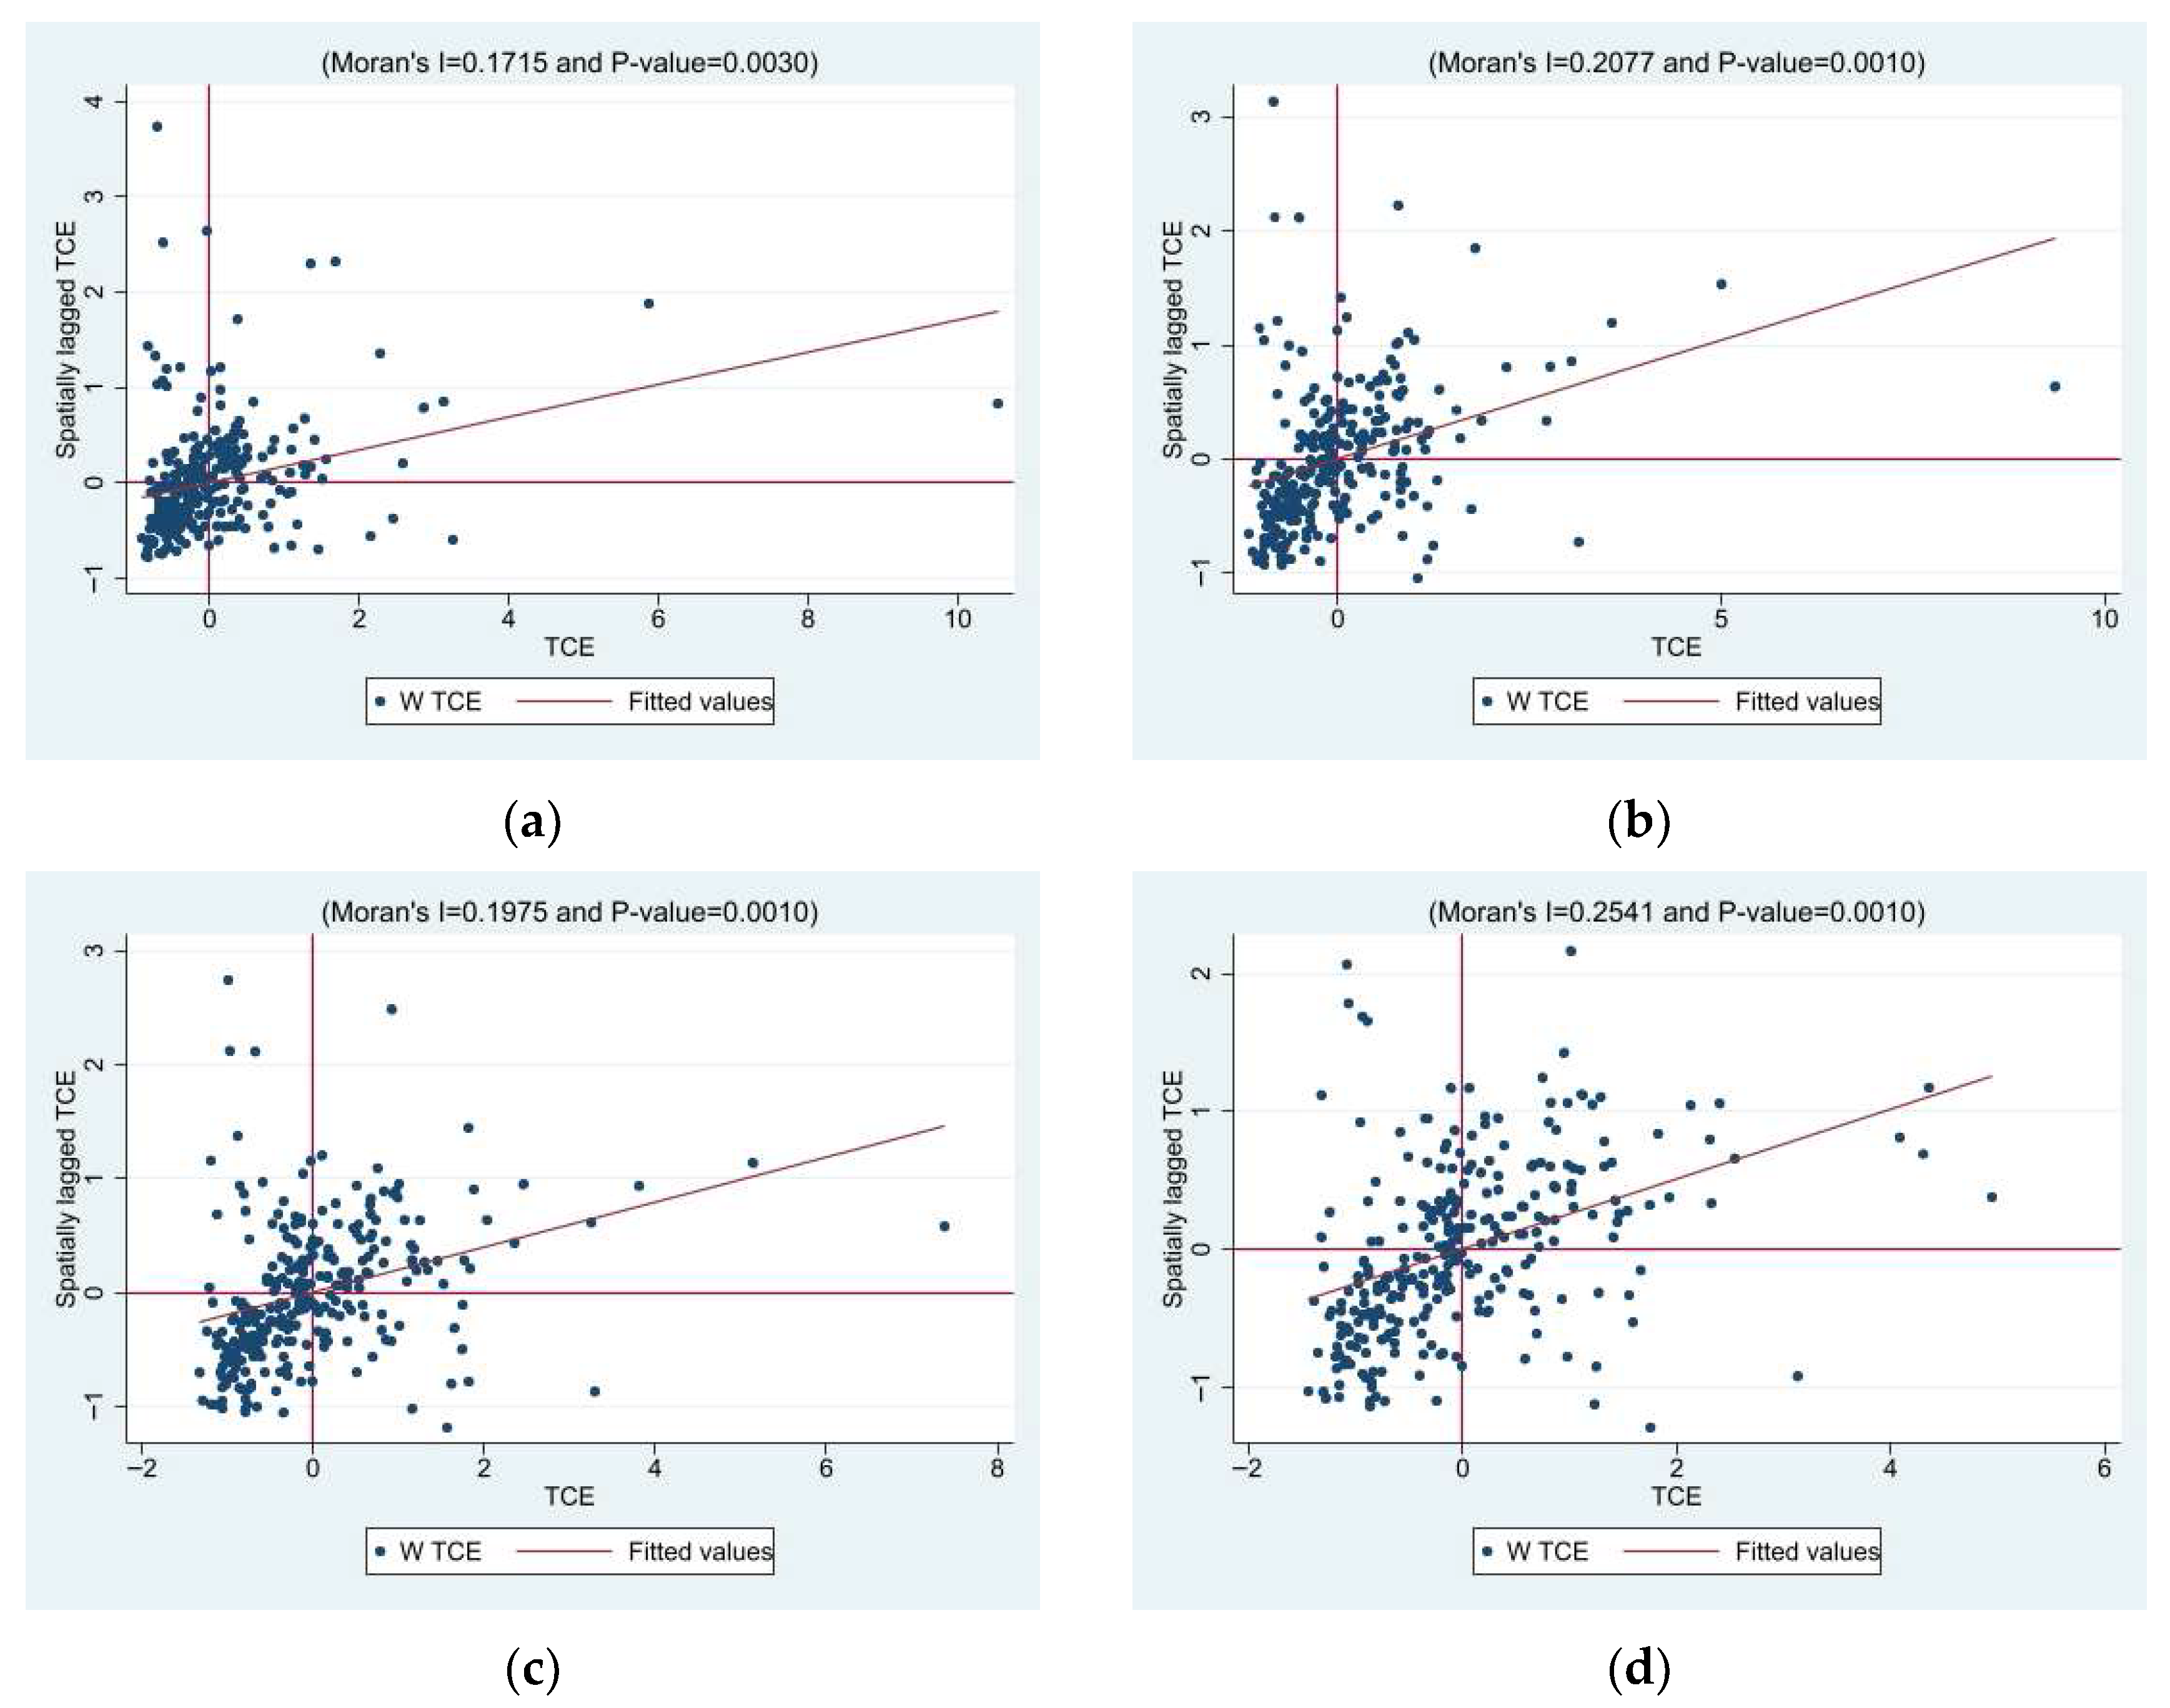
5.2.1. Spatial Autocorrelation and SDM Applicability Tests
5.2.2. Spatial Panel Regression Results
6. Conclusions and Policy Implications
- (1)
- We support the strong evidence that the LCCP can restrain transportation CO2 emissions. Local governments can apply this policy to reduce transportation CO2 emissions. Therefore, according to the overall concept of ‘expanding point by point,’ the carbon emission reduction experiences of pilot cities can be organised on a regular basis so as to form a replicable and effective model to facilitate the widespread promotion of low-carbon cities.
- (2)
- The results of the indirect mechanism identification show that the LCCPP can reduce transportation CO2 emissions through the improvement of urban public transportation levels and the popularisation of green mobility among residents. Therefore, more focus should be placed on improving urban public transportation levels in the construction of low-carbon cities and further increasing the incentives for low-carbon travel, such as the provision of subsidies and the construction of green transportation infrastructure. Simultaneously, it will be essential for governments and communities to enhance promotion and guidance to elevate the residents’ consciousness and sense of responsibility for low-carbon travel. In addition, the promotion and localised application of new energy vehicles should be strengthened to compensate for the lack of effectiveness of technological innovations at the city level.
- (3)
- The findings of the heterogeneity analysis indicate that the effectiveness of the LCCP toward lowering transportation CO2 emissions varies across different regions, with ineffective performance in central and high-economy cities and lower mitigation effects in northern and resource-based cities than in southern and non-resource-based cities. Therefore, authorities should prioritise these cities, scrutinise the reasons behind the LCCPP’s ineffectiveness and enhance policy supervision. Differentiated policy measures should be implemented, avoiding a uniform approach, and instead, tailored policy implementation plans should be developed that align with the specific characteristics of each city.
- (4)
- Finally, because there are obvious spatial spillover effects on transportation CO2 emission reduction when using the LCCPP, a cross-regional management coordination mechanism should be established based on the LCCPP to enhance interregional collaboration. Nonpilot cities should actively learn from the transportation management experience of pilot cities to reduce local transportation CO2 emissions.
7. Discussion
Author Contributions
Funding
Institutional Review Board Statement
Informed Consent Statement
Data Availability Statement
Conflicts of Interest
Appendix A
| (1) | (2) | (3) | (4) | (5) | (6) | (7) | (8) | (9) | |
|---|---|---|---|---|---|---|---|---|---|
| PUT | GRT | REG | |||||||
| Variables | lnCO2 | lnPUT | lnCO2 | lnCO2 | lnGRT | lnCO2 | lnCO2 | lnREG | lnCO2 |
| −0.023 *** | −0.011 | 0.010 *** | |||||||
| (0.005) | (0.018) | (0.004) | |||||||
| did | −0.055 *** | 0.072 *** | −0.053 *** | −0.055 *** | 0.020 | −0.055 *** | −0.055 *** | 0.036 *** | −0.056 *** |
| (0.006) | (0.024) | (0.006) | (0.006) | (0.024) | (0.006) | (0.006) | (0.019) | (0.006) | |
| lnx1 | 0.198 *** | −0.023 | 0.198 *** | 0.198 *** | 0.028 | 0.198 *** | 0.198 *** | 0.446 *** | 0.170 *** |
| (0.014) | (0.046) | (0.014) | (0.014) | (0.049) | (0.014) | (0.014) | (0.055) | (0.014) | |
| lnx2 | 0.186 *** | −0.048 | 0.184 *** | 0.186 *** | −0.836 *** | 0.178 *** | 0.186 *** | 1.459 *** | 0.156 *** |
| (0.028) | (0.121) | (0.028) | (0.028) | (0.109) | (0.029) | (0.028) | (0.128) | (0.028) | |
| lnx3 | 0.008 | 0.036 | 0.009 | 0.008 | −0.139 ** | 0.007 | 0.008 | 0.060* | −0.004 |
| (0.018) | (0.067) | (0.018) | (0.018) | (0.070) | (0.018) | (0.018) | (0.032) | (0.007) | |
| lnx4 | 0.001 | −0.076 *** | −0.001 | 0.001 | 0.057 | 0.001 | 0.001 | −0.047 | 0.002 |
| (0.005) | (0.024) | (0.005) | (0.005) | (0.037) | (0.005) | (0.005) | (0.052) | (0.005) | |
| lnx5 | 0.037 *** | 0.150 *** | 0.041 *** | 0.037 *** | −0.104 ** | 0.036 *** | 0.037 *** | 0.301 ** | 0.165 *** |
| (0.010) | (0.037) | (0.010) | (0.010) | (0.052) | (0.010) | (0.010) | (0.126) | (0.041) | |
| lnx6 | 0.015 ** | 0.065 ** | 0.017 *** | 0.015 ** | −0.066 | 0.015 ** | 0.015 ** | 0.114 *** | 0.019 *** |
| (0.006) | (0.033) | (0.006) | (0.006) | (0.044) | (0.006) | (0.006) | (0.032) | (0.006) | |
| lnx7 | 0.006 *** | 0.020 ** | 0.006 *** | 0.006 *** | 0.017 * | 0.006 *** | 0.006 *** | −0.010 | 0.005 *** |
| (0.002) | (0.008) | (0.002) | (0.002) | (0.009) | (0.002) | (0.002) | (0.008) | (0.002) | |
| lnx8 | 0.003 | 0.030 * | 0.004 | 0.003 | −0.005 | 0.003 | 0.003 | 0.013 | 0.010 ** |
| (0.004) | (0.017) | (0.004) | (0.004) | (0.019) | (0.004) | (0.004) | (0.016) | (0.004) | |
| Constant | 3.775 *** | −5.714 *** | 3.643 *** | 3.775 *** | 8.301 *** | 3.854 *** | 3.775 *** | −7.187 *** | 3.291 *** |
| (0.193) | (0.796) | (0.190) | (0.193) | (0.700) | (0.203) | (0.193) | (0.924) | (0.250) | |
| Observations | 4252 | 4252 | 4252 | 4260 | 4260 | 4260 | 4260 | 4260 | 4260 |
| R-squared | 0.990 | 0.841 | 0.990 | 0.990 | 0.626 | 0.990 | 0.990 | 0.953 | 0.990 |
| Year fix | Yes | Yes | Yes | Yes | Yes | Yes | Yes | Yes | Yes |
| City fix | Yes | Yes | Yes | Yes | Yes | Yes | Yes | Yes | Yes |
References
- Xu, B.; Lin, B. Factors affecting carbon dioxide (CO2) emissions in China’s transport sector: A dynamic nonparametric additive regression model. J. Clean. Prod. 2015, 101, 311–322. [Google Scholar] [CrossRef]
- López, L.R.; Dessì, P.; Cabrera-Codony, A.; Rocha-Melogno, L.; Kraakman, B.; Naddeo, V.; Balaguer, M.D.; Puig, S. CO2 in indoor environments: From environmental and health risk to potential renewablcarbon source. Sci. Total Environ. 2023, 856, 159088. [Google Scholar] [CrossRef] [PubMed]
- IEA (International Energy Agency). World Energy Outlook 2021. Available online: https://www.iea.org/reports/world-energy-outlook-2021 (accessed on 3 November 2025).
- Bai, C.; Chen, Z.; Wang, D. Transportation carbon emission reduction potential and mitigation strategy in China. Sci. Total Environ. 2023, 873, 162074. [Google Scholar] [CrossRef] [PubMed]
- Xie, X.; Zhong, Y.; Li, S.; Gou, Z. Pathways for reducing carbon emissions in county-level transportation: A life cycle perspective and multi-scenario analysis. Energy Strategy Rev. 2025, 58, 101678. [Google Scholar] [CrossRef]
- Yao, L.; Chen, W. Temporal and spatial evolution of low-carbon transportation efficiency and its influencing factors in China. Energy 2025, 315, 134357. [Google Scholar] [CrossRef]
- Li, H.; Wang, J.; Yang, X.; Wang, Y.; Wu, T. A holistic overview of the progress of China’s low-carbon city pilots. Sustain. Cities Soc. 2018, 42, 289–300. [Google Scholar] [CrossRef]
- Wang, H.; Zhang, R. Effects of environmental regulation on CO2 emissions: An empirical analysis of 282 cities in China. Sustain. Prod. Consum. 2022, 29, 259–272. [Google Scholar] [CrossRef]
- Zhang, S.; Cheng, L.; Ren, Y.; Yao, Y. Effects of carbon emission trading system on corporate green total factor productivity: Does environmental regulation play a role of green blessing? Environ. Res. 2024, 248, 118295. [Google Scholar] [CrossRef]
- Jiang, N.; Huang, J. Can transparency governance promote interregional coordinated carbon emission reduction? A new perspective from China provincial transparency index. Energy Strategy Rev. 2025, 58, 101649. [Google Scholar] [CrossRef]
- Ouyang, W.; Zhou, Y.; Wang, Y. Can command-and-control regulation reduce carbon emissions? Evidence from China. Environ. Impact Assess. Rev. 2025, 112, 107802. [Google Scholar] [CrossRef]
- Yu, X.; Chen, N.; Li, M. Carbon emission characteristics and carbon emission reduction paths of low-carbon pilot cities in China. China Popul. Resour. Environ. 2020, 30, 1–9. [Google Scholar]
- Jia, L.; Zhang, J.; Li, R.; Wang, L.; Wu, H.; Wang, P. Spatial correlation investigation of carbon emission efficiency in the Yangtze River Delta of China: The role of low-carbon pilot cities. Ecol. Indic. 2025, 172, 113282. [Google Scholar] [CrossRef]
- Qiu, S.; Wang, Z.; Liu, S. The policy outcomes of low-carbon city construction on urban green development: Evidence from a quasi-natural experiment conducted in China. Sustain. Cities Soc. 2021, 66, 102699. [Google Scholar] [CrossRef]
- Li, W.; Zhang, Y.; Xu, J.; Fang, S.; Li, Q.; Gong, W.; Zhang, R. Evaluation for the effect of low-carbon city pilot policy: Evidence from industry in China. Environ. Sci. Pollut. Res. 2024, 31, 8863–8882. [Google Scholar] [CrossRef]
- Sun, L.; Luo, L.; Dong, C.; Hua, H.; Shi, R. Effects of China’s pilot low-carbon city policy on carbon emission reduction in the hotel industry: A quasi-natural experiment in tourism cities. Energy Rep. 2024, 11, 3037–3049. [Google Scholar] [CrossRef]
- Wang, K.; Guan, R.; Gan, C. Does low carbon pilot contribute to improving the carbon emission efficiency of tourism?—An empirical test based on double difference. Chin. J. Popul. Resour. Environ. 2023, 33, 47–56. [Google Scholar]
- Zhang, H.; Huang, L.; Zhu, Y.; Si, H.; He, X. Does low-carbon city construction improve total factor productivity? Evidence from a quasi-natural experiment in China. Int. J. Environ. Res. Public Health 2021, 18, 11974. [Google Scholar] [CrossRef]
- Cheng, J.; Yi, J.; Dai, S. Can low-carbon city construction facilitate green growth? Evidence from China’s pilot low-carbon city initiative. J. Clean. Prod. 2019, 231, 1158–1170. [Google Scholar] [CrossRef]
- Song, M.; Zhao, X.; Shang, Y. The impact of low-carbon city construction on ecological efficiency: Empirical evidence from quasi-natural experiments. Resour. Conserv. Recycl. 2020, 157, 104777. [Google Scholar] [CrossRef]
- Zou, C.; Huang, Y.; Wu, S.; Hu, S. Does “low-carbon city” accelerate urban innovation? Evidence from China. Sustain. Cities Soc. 2022, 83, 103954. [Google Scholar] [CrossRef]
- Song, Y.; He, Y.; Sahut, J.M.; Shah, S.H. Can low-carbon city pilot policy decrease urban energy poverty? Energy Policy 2024, 186, 113989. [Google Scholar] [CrossRef]
- Yang, Z.; Yuan, Y.; Tan, Y. The impact and nonlinear relationship of low-carbon city construction on air quality: Evidence from a quasi-natural experiment in China. J. Clean. Prod. 2023, 422, 138588. [Google Scholar] [CrossRef]
- Wan, G.; Zhang, W.; Li, C. How does low-carbon city pilot policy catalyze companies toward ESG practices? Evidence from China. Econ. Anal. Policy 2024, 81, 1593–1607. [Google Scholar] [CrossRef]
- Fu, L.; Zhao, H.; Ma, F.; Chen, J. Estimating heterogeneous effects of China’s low-carbon pilot city policy on urban employment. J. Clean. Prod. 2024, 434, 139882. [Google Scholar] [CrossRef]
- Liu, X.; Li, Y.; Chen, X.; Liu, J. Evaluation of low carbon city pilot policy effect on carbon abatement in China: An empirical evidence based on time-varying DID model. Cities 2022, 123, 103582. [Google Scholar] [CrossRef]
- Lyu, J.; Liu, T.; Cai, B.; Qi, Y.; Zhang, X. Heterogeneous effects of China’s low-carbon city pilots policy. J. Environ. Manag. 2023, 344, 118329. [Google Scholar] [CrossRef]
- Du, M.; Feng, R.; Chen, Z. Blue sky defense in low-carbon pilot cities: A spatial spillover perspective of carbon emission efficiency. Sci. Total Environ. 2022, 846, 157509. [Google Scholar] [CrossRef]
- Yu, Y.; Zhang, N. Low-carbon city pilot and carbon emission efficiency: Quasi-experimental evidence from China. Energy Econ. 2021, 96, 105125. [Google Scholar] [CrossRef]
- Liu, X.; Xu, H. Does low-carbon pilot city policy induce low-carbon choices in residents’ living: Holistic and single dual perspective. J. Environ. Manag. 2022, 324, 116353. [Google Scholar] [CrossRef]
- Li, J.; Tang, F.; Zhang, S.; Zhang, C. The effects of low-carbon city construction on bus trips. J. Public Transp. 2023, 25, 100057. [Google Scholar] [CrossRef]
- Liu, W.; Chen, Y.; Zhu, P.; Tong, J. Can carbon reduction policies promote sustainable construction development? Evidence from China’s green building market. PLoS ONE 2024, 19, e0303149. [Google Scholar] [CrossRef]
- Li, X.; Xing, H. Better cities better lives: How low-carbon city pilots can lower residents’ carbon emissions. J. Environ. Manag. 2024, 351, 119889. [Google Scholar] [CrossRef]
- Gao, Q.; Yan, T. Study on the impact of low-carbon pilot city construction on carbon emission reduction of trade and circulation industry under the background of “double cycle”. Commer. Econ. Res. 2024, 39, 11–14. [Google Scholar]
- Yu, Z.; Chen, L.; Tong, H.; Chen, L.; Zhang, T.; Li, L.; Yuan, L.; Xiao, J.; Wu, R.; Bai, L.; et al. Spatial correlations of land-use carbon emissions in the Yangtze River Delta region: A perspective from social network analysis. Ecol. Indic. 2022, 142, 109147. [Google Scholar] [CrossRef]
- Tang, Z.; Yu, H.; Zou, J. Neighbor impacts of environmental regulation: The case of low-carbon pilot program in China. Energy 2023, 276, 127509. [Google Scholar] [CrossRef]
- Cao, Y.; Ren, W.; Yue, L. Environmental regulation and carbon emissions: New mechanisms in game theory. Cities 2024, 149, 104945. [Google Scholar] [CrossRef]
- Zhao, X.; Zhu, J. Impacts of two-way foreign direct investment on carbon emissions: From the perspective of environmental regulation. Environ. Sci. Pollut. Res. 2022, 29, 52705–52723. [Google Scholar] [CrossRef]
- Sun, J. Can Green Transport Policy Drive Urban Carbon Emission Reduction? Evidence from Pilot Cities of China’s Low-Carbon Transportation System. Front. Environ. Sci. 2025, 13, 1660200. [Google Scholar] [CrossRef]
- Lu, X.; Lu, Z. How does green technology innovation affect urban carbon emissions? Evidence from Chinese cities. Energy Build. 2024, 325, 115025. [Google Scholar] [CrossRef]
- Wang, L.; Shao, J.; Ma, Y. Does China’s low-carbon city pilot policy improve energy efficiency? Energy 2023, 283, 129048. [Google Scholar] [CrossRef]
- Wang, X. How does low carbon city pilot affect urban green technology innovation?—Based on the synergy perspective of government intervention and public participation. J. Lanzhou Univ. 2022, 4, 41–53. [Google Scholar]
- Yu, H.; Peng, F.; Yuan, T.; Li, D.; Shi, D. The effect of low-carbon pilot policy on low-carbon technological innovation in China: Reexamining the porter hypothesis using difference-in-difference-in-differences strategy. J. Innov. Knowl. 2023, 8, 100392. [Google Scholar] [CrossRef]
- Liu, K.; Huang, T.; Xia, Z.; Xia, X.; Wu, R. The impact assessment of low-carbon city pilot policy on urban green innovation: A batch-time heterogeneity perspective. Appl. Energy 2025, 377, 124489. [Google Scholar] [CrossRef]
- Huang, H.; He, G.; Xiao, Y. Carbon emission reduction effects of pilot policies for low-carbon cities. Resour. Sci. 2023, 45, 1044–1058. [Google Scholar]
- Pamucar, D.; Deveci, M.; Canıtez, F.; Paksoy, T.; Lukovac, V. A novel methodology for prioritizing zero-carbon measures for sustainable transport. Sustain. Prod. Consum. 2021, 27, 1093–1112. [Google Scholar] [CrossRef]
- Wang, A.; Weichenthal, S.; Lloyd, M.; Kris, H.; Shoshanna, S.; Marianne, H. Personal mobility choices and disparities in carbon emissions. Environ. Sci. Technol. 2023, 57, 8548–8558. [Google Scholar] [CrossRef]
- Zong, F.; Zeng, M.; Li, Y.X. Congestion pricing for sustainable urban transportation systems considering carbon emissions and travel habits. Sustain. Cities Soc. 2024, 101, 105198. [Google Scholar] [CrossRef]
- Cai, B.; Geng, Y.; Yang, W.; Yan, P.; Chen, Q.; Li, D.; Cao, L. How scholars and the public perceive a “low carbon city” in China. J. Clean. Prod. 2017, 149, 502–510. [Google Scholar] [CrossRef]
- Zhao, Y.; Lu, X.; Wang, W. Synergistic effect analysis of CO2 and PM2.5 emission reduction in low carbon cities. China Environ. Sci. 2023, 325, 465–476. [Google Scholar]
- Li, S.; Wang, J. Low-carbon city pilot policies, residents’ low-carbon literacy and enterprises’ green technology innovation. China Popul.-Resour. Environ. 2023, 4, 93–103. [Google Scholar]
- Hou, M.; Cui, X.; Chu, L.; Wang, H.; Xi, Z.; Deng, Y. Nonlinear effects of environmental regulation on PM2. 5 and CO2 in China: Evidence from a quantile-on-quantile approach. Energy 2024, 292, 130456. [Google Scholar] [CrossRef]
- Jiang, B.; He, Z.; Xue, W.; Yang, C.; Zhu, H.; Hua, Y.; Lu, B. China’s low-carbon cities pilot promotes sustainable carbon emission reduction: Evidence from quasi-natural experiments. Sustainability 2022, 14, 8996. [Google Scholar] [CrossRef]
- Wen, S.; Liu, H. Research on energy conservation and carbon emission reduction effects and mechanism: Quasi-experimental evidence from China. Energy Policy 2022, 169, 113180. [Google Scholar] [CrossRef]
- Xu, P. The impact of heterogeneous environmental regulations on regional spatial differences in net carbon emissions. Environ. Sci. Pollut. Res. 2023, 30, 1413–1427. [Google Scholar] [CrossRef] [PubMed]
- Wen, Z.; Zhang, L.; Hou, J.; Liu, H. The mediation effect test program and its application. J. Psychol. 2004, 36, 614–620. [Google Scholar]
- Yuan, C.; Zhang, S.; Jiao, P. Research on the spatial and temporal changes of total factor carbon emission efficiency and influencing factors of provincial transportation in China. Resour. Sci. 2017, 39, 687–697. [Google Scholar]
- Yang, W.; Wang, W.; Ouyang, S. The influencing factors and spatial spillover effects of CO2 emissions from transportation in China. Sci. Total Environ. 2019, 696, 133900. [Google Scholar] [CrossRef]
- Jung, M.C.; Kang, M.; Kim, S. Does polycentric development produce less transportation carbon emissions? Evidence from urban form identified by night-time lights across US metropolitan areas. Urban Clim. 2022, 44, 101223. [Google Scholar] [CrossRef]
- Zhao, P.; Tian, B.S.; Yang, Q.; Zhang, S. Influencing factors and their spatial–temporal heterogeneity of urban transport carbon emissions in China. Energies 2024, 17, 756. [Google Scholar] [CrossRef]
- Gehrsitz, M. The effect of low emission zones on air pollution and infant health. J. Environ. Econ. Manag. 2017, 83, 121–144. [Google Scholar] [CrossRef]
- Liddle, B. Urban transport pollution: Revisiting the environmental Kuznets curve. Int. J. Sustain. Transp. 2015, 9, 502–508. [Google Scholar] [CrossRef]
- Liu, F. The impact of China’s low-carbon city pilot policy on carbon emissions: Based on the multi-period DID model. Environ. Sci. Pollut. Res. 2023, 30, 81745–81759. [Google Scholar] [CrossRef] [PubMed]
- Xiao, R.; Ma, B.; Qian, L.; Shen, J. The impact of pilot policies of low-carbon cities on corporate green innovation and its mechanism of action. China Popul. Resour. Environ. 2023, 33, 125–137. [Google Scholar]
- Wang, C.T. Progressive Regression Analysis; Higher Education Press: Beijing, China, 2017. [Google Scholar]
- Chen, Q. Advanced Econometrics and Stata Applications; Higher Education Press: Beijing, China, 2014. [Google Scholar]
- Dai, Q.; Hao, W.; Cheng, Z.; Qiu, W. Has environmental regulation policy driven the real economy to “de-realization”? A quasi-natural experiment based on China’s carbon emissions trading pilot. J. Nat. Resour. 2024, 39, 1320–1340. [Google Scholar]
- Lim, J.; Kang, M.; Jung, C. Effect of national-level spatial distribution of cities on national transport CO2 emissions. Environ. Impact Assess. Rev. 2019, 77, 162–173. [Google Scholar] [CrossRef]
- Wen, S.; Jia, Z.; Chen, X. Can low-carbon city pilot policies significantly improve carbon emission efficiency? Empirical evidence from China. J. Clean. Prod. 2022, 346, 131131. [Google Scholar] [CrossRef]
- Huang, H.; Yi, M. Impacts and mechanisms of heterogeneous environmental regulations on carbon emissions: An empirical research based on DID method. Environ. Impact Assess. Rev. 2023, 99, 107039. [Google Scholar] [CrossRef]
- Zhang, H. Can pilot policies for low-carbon cities reduce carbon emissions?—Evidence from a quasi-natural experiment. Econ. Manag. 2020, 42, 25–41. [Google Scholar]
- Dong, Z.; Wu, Y.; Xu, Y. The increasing climate inequalities of urban carbon emissions: The distributional effect of low-carbon city pilot policy. Urban. Clim. 2023, 52, 101718. [Google Scholar] [CrossRef]
- Pan, A.; Zhang, W.; Shi, X.; Dai, L. Climate policy and low-carbon innovation: Evidence from low-carbon city pilots in China. Energy Econ. 2022, 112, 106129. [Google Scholar] [CrossRef]
- Lu, H.; Xiao, C.; Jiao, L.; Du, X.; Huang, A. Spatial-temporal evolution analysis of the impact of smart transportation policies on urban carbon emissions. Sustain. Cities Soc. 2024, 101, 105177. [Google Scholar] [CrossRef]
- Anselin, L.; Bera, A.K. Spatial dependence in linear regression models with an introduction to spatial econometrics. Stat. Textb. Monogr. 1998, 155, 237–290. [Google Scholar]
- Guo, L.; Liang, X. Research on the impact of carbon emissions trading policy on carbon emissions efficiency—An analysis based on spatial multi-period double difference model. Price Theory Pract. 2023, 39, 146–150+209. [Google Scholar]
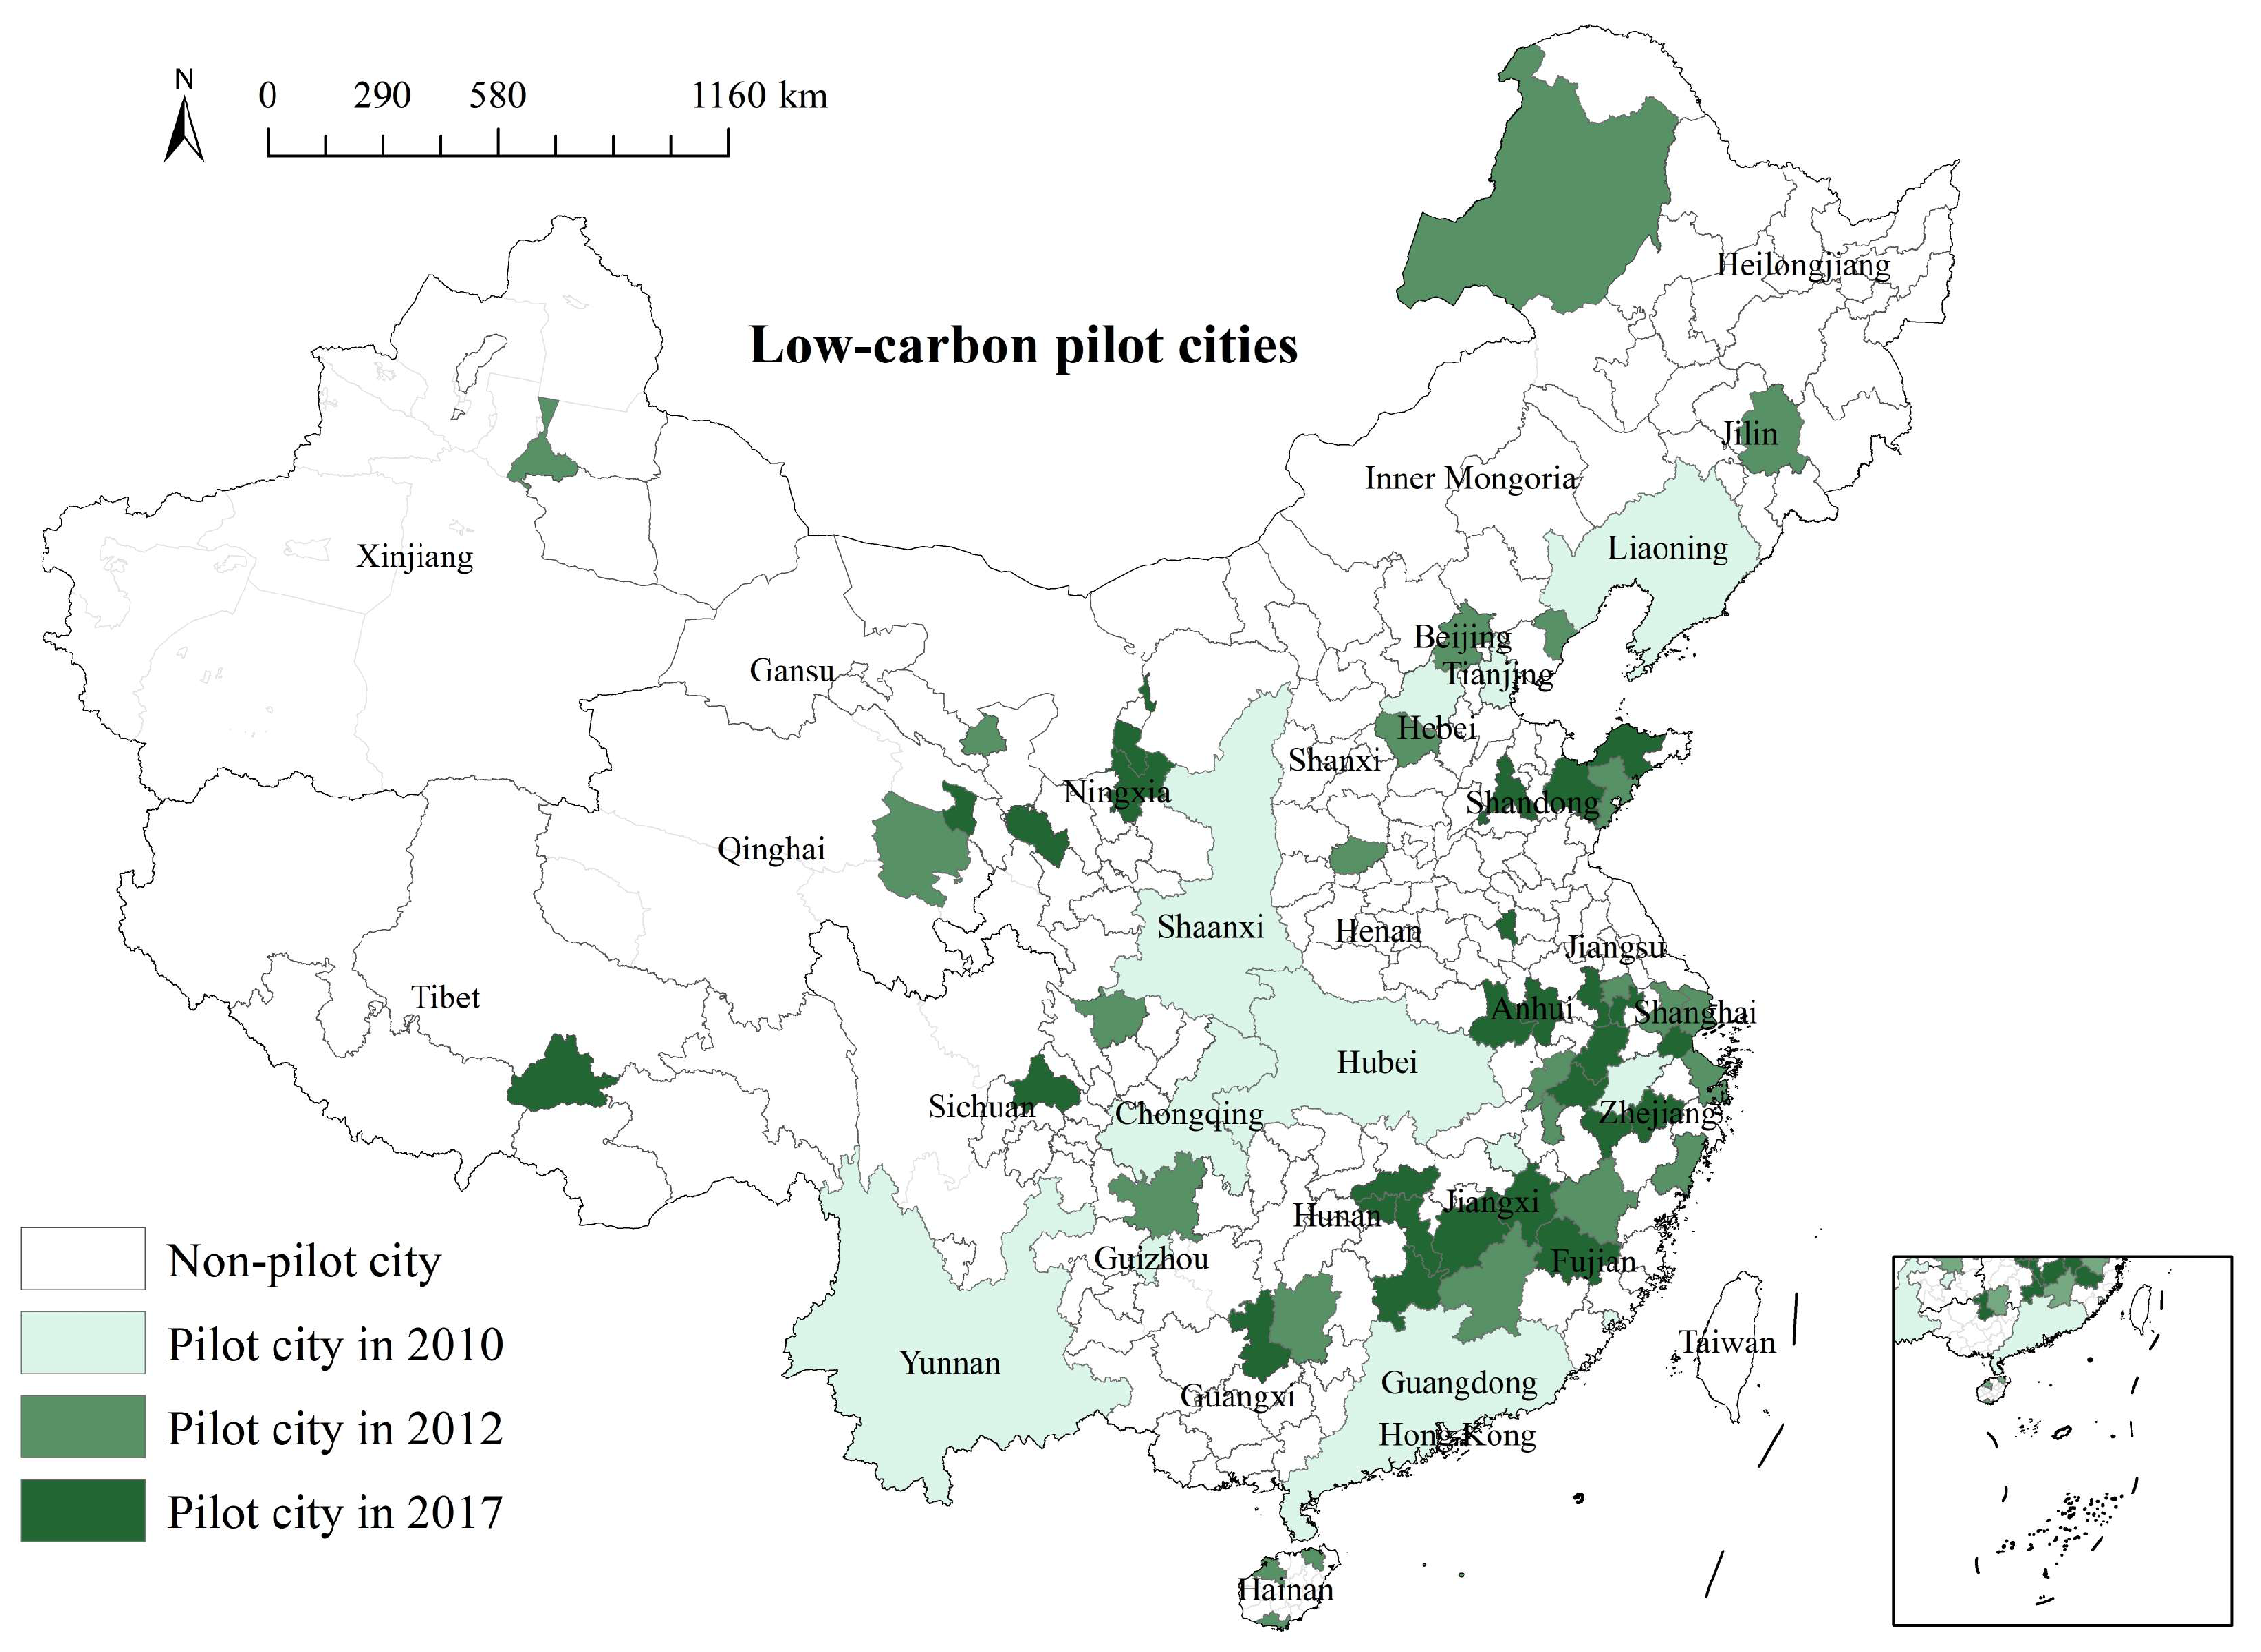
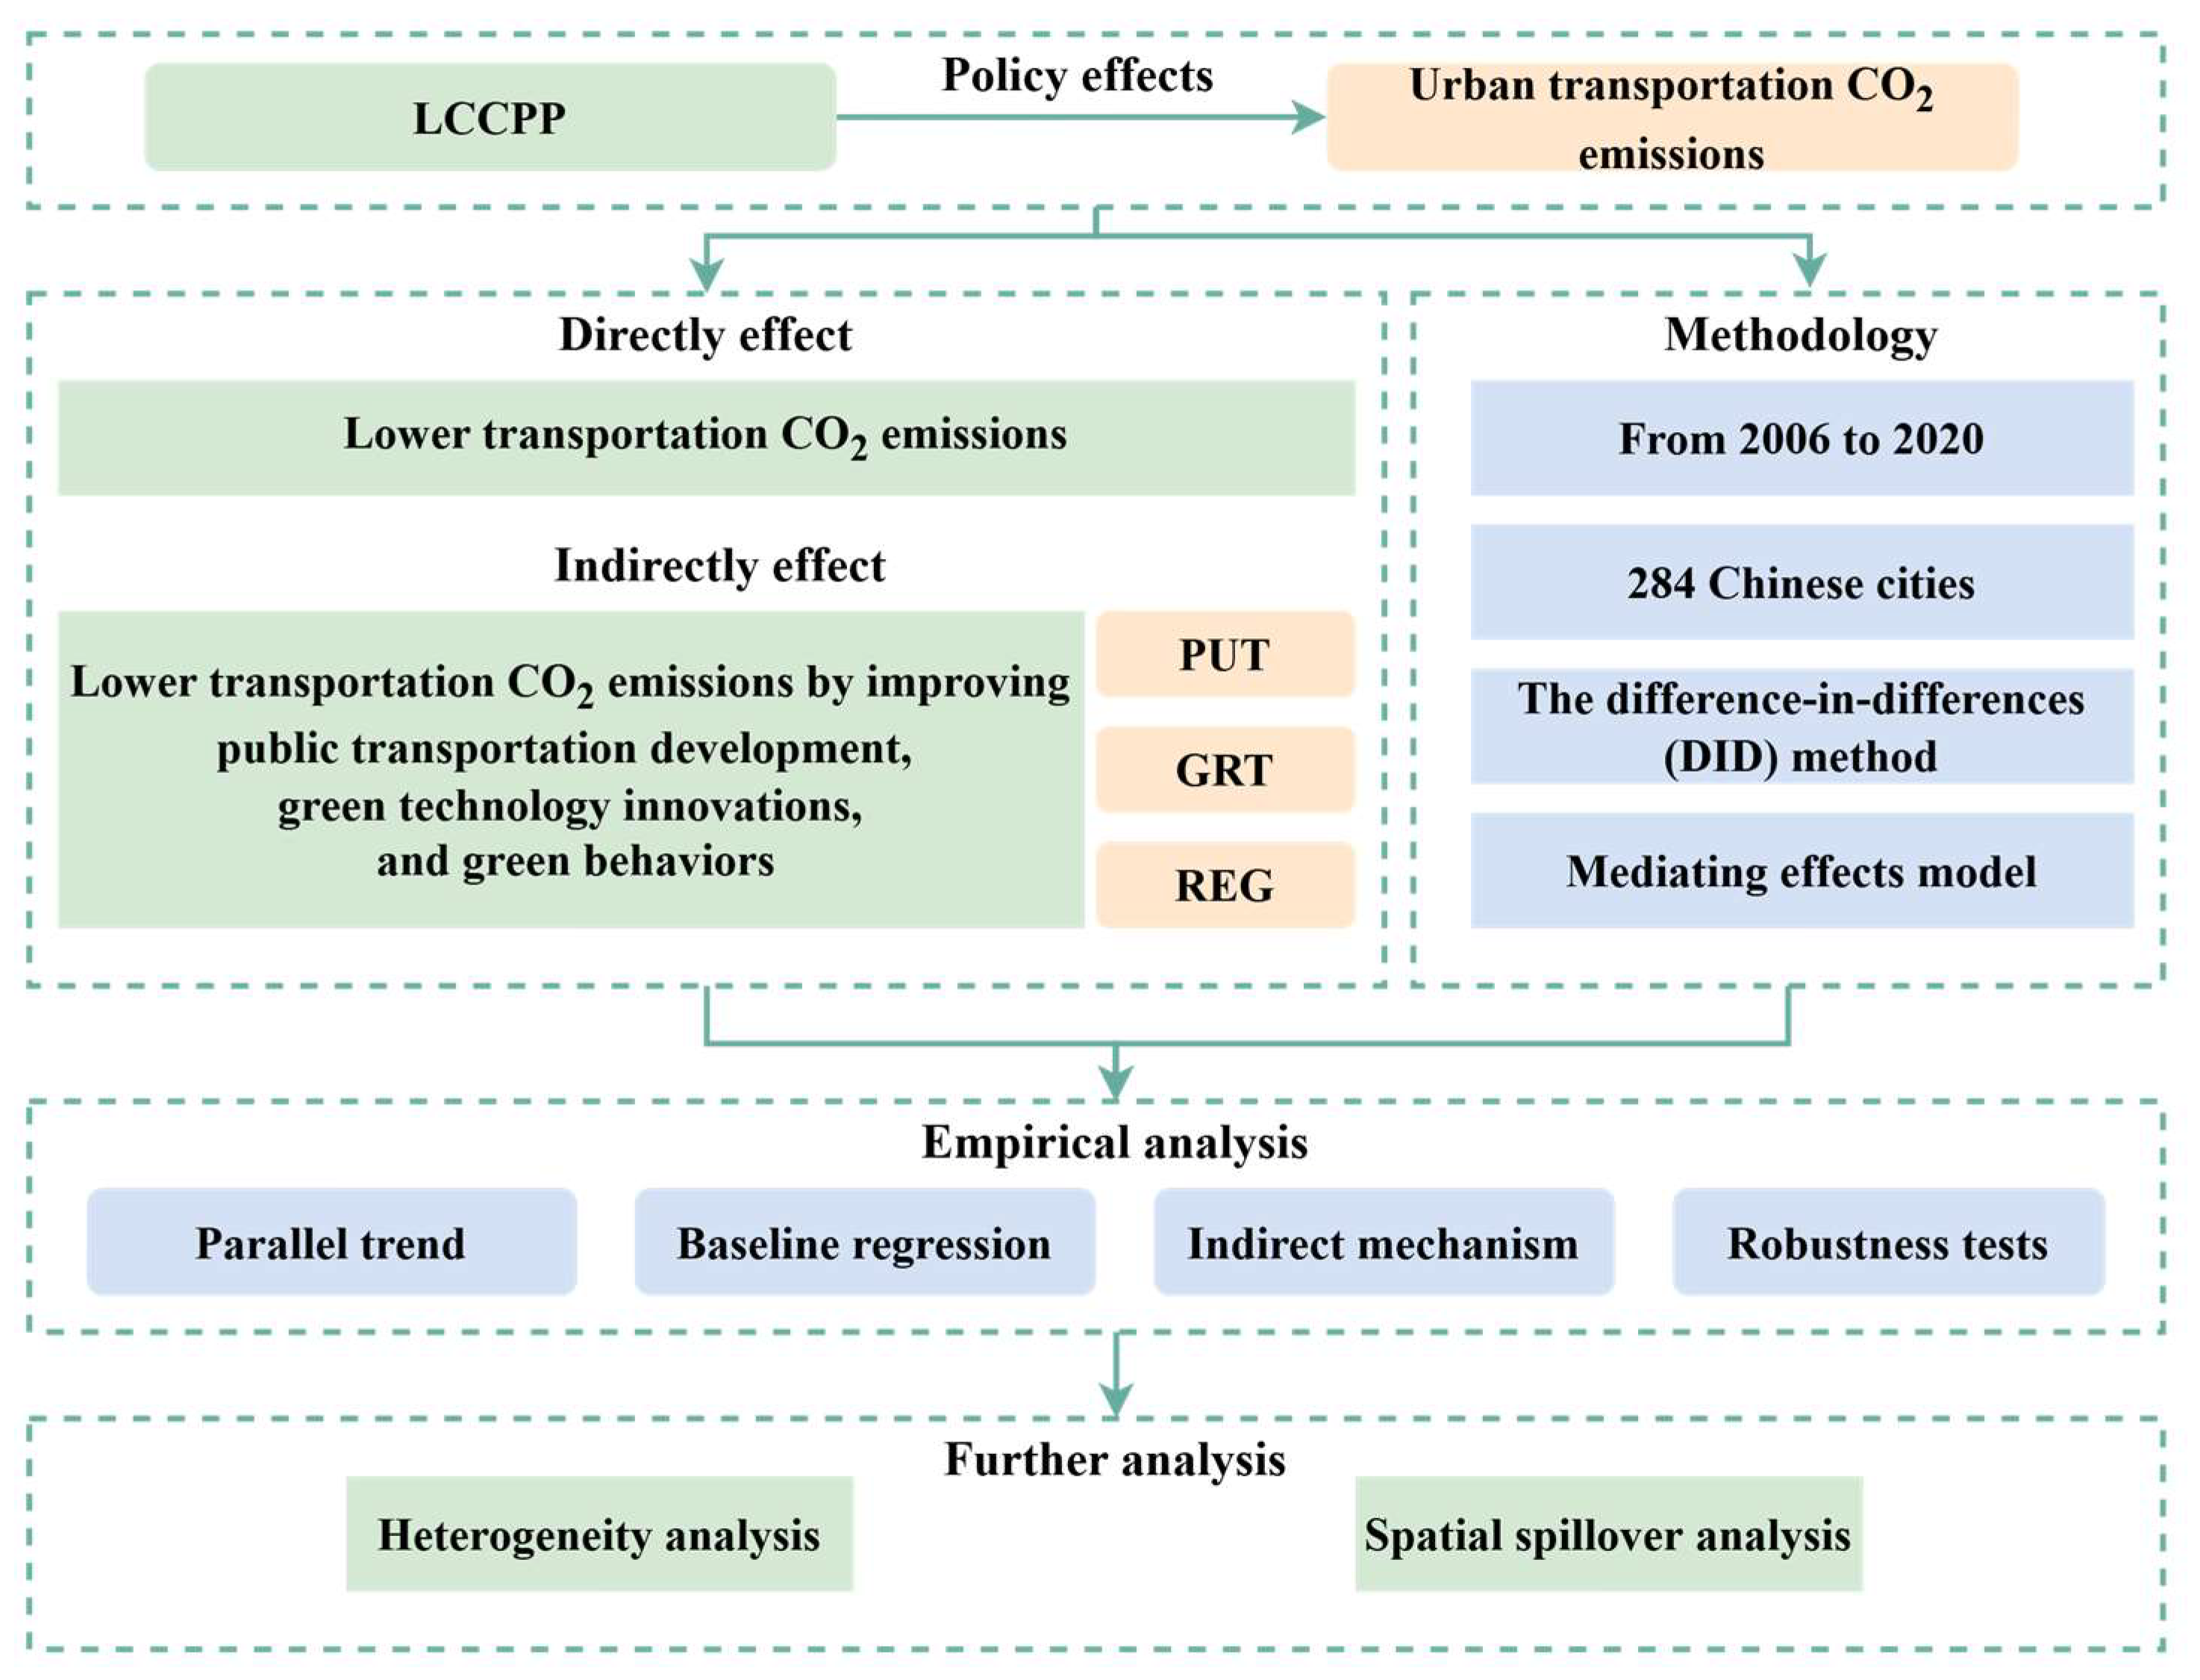
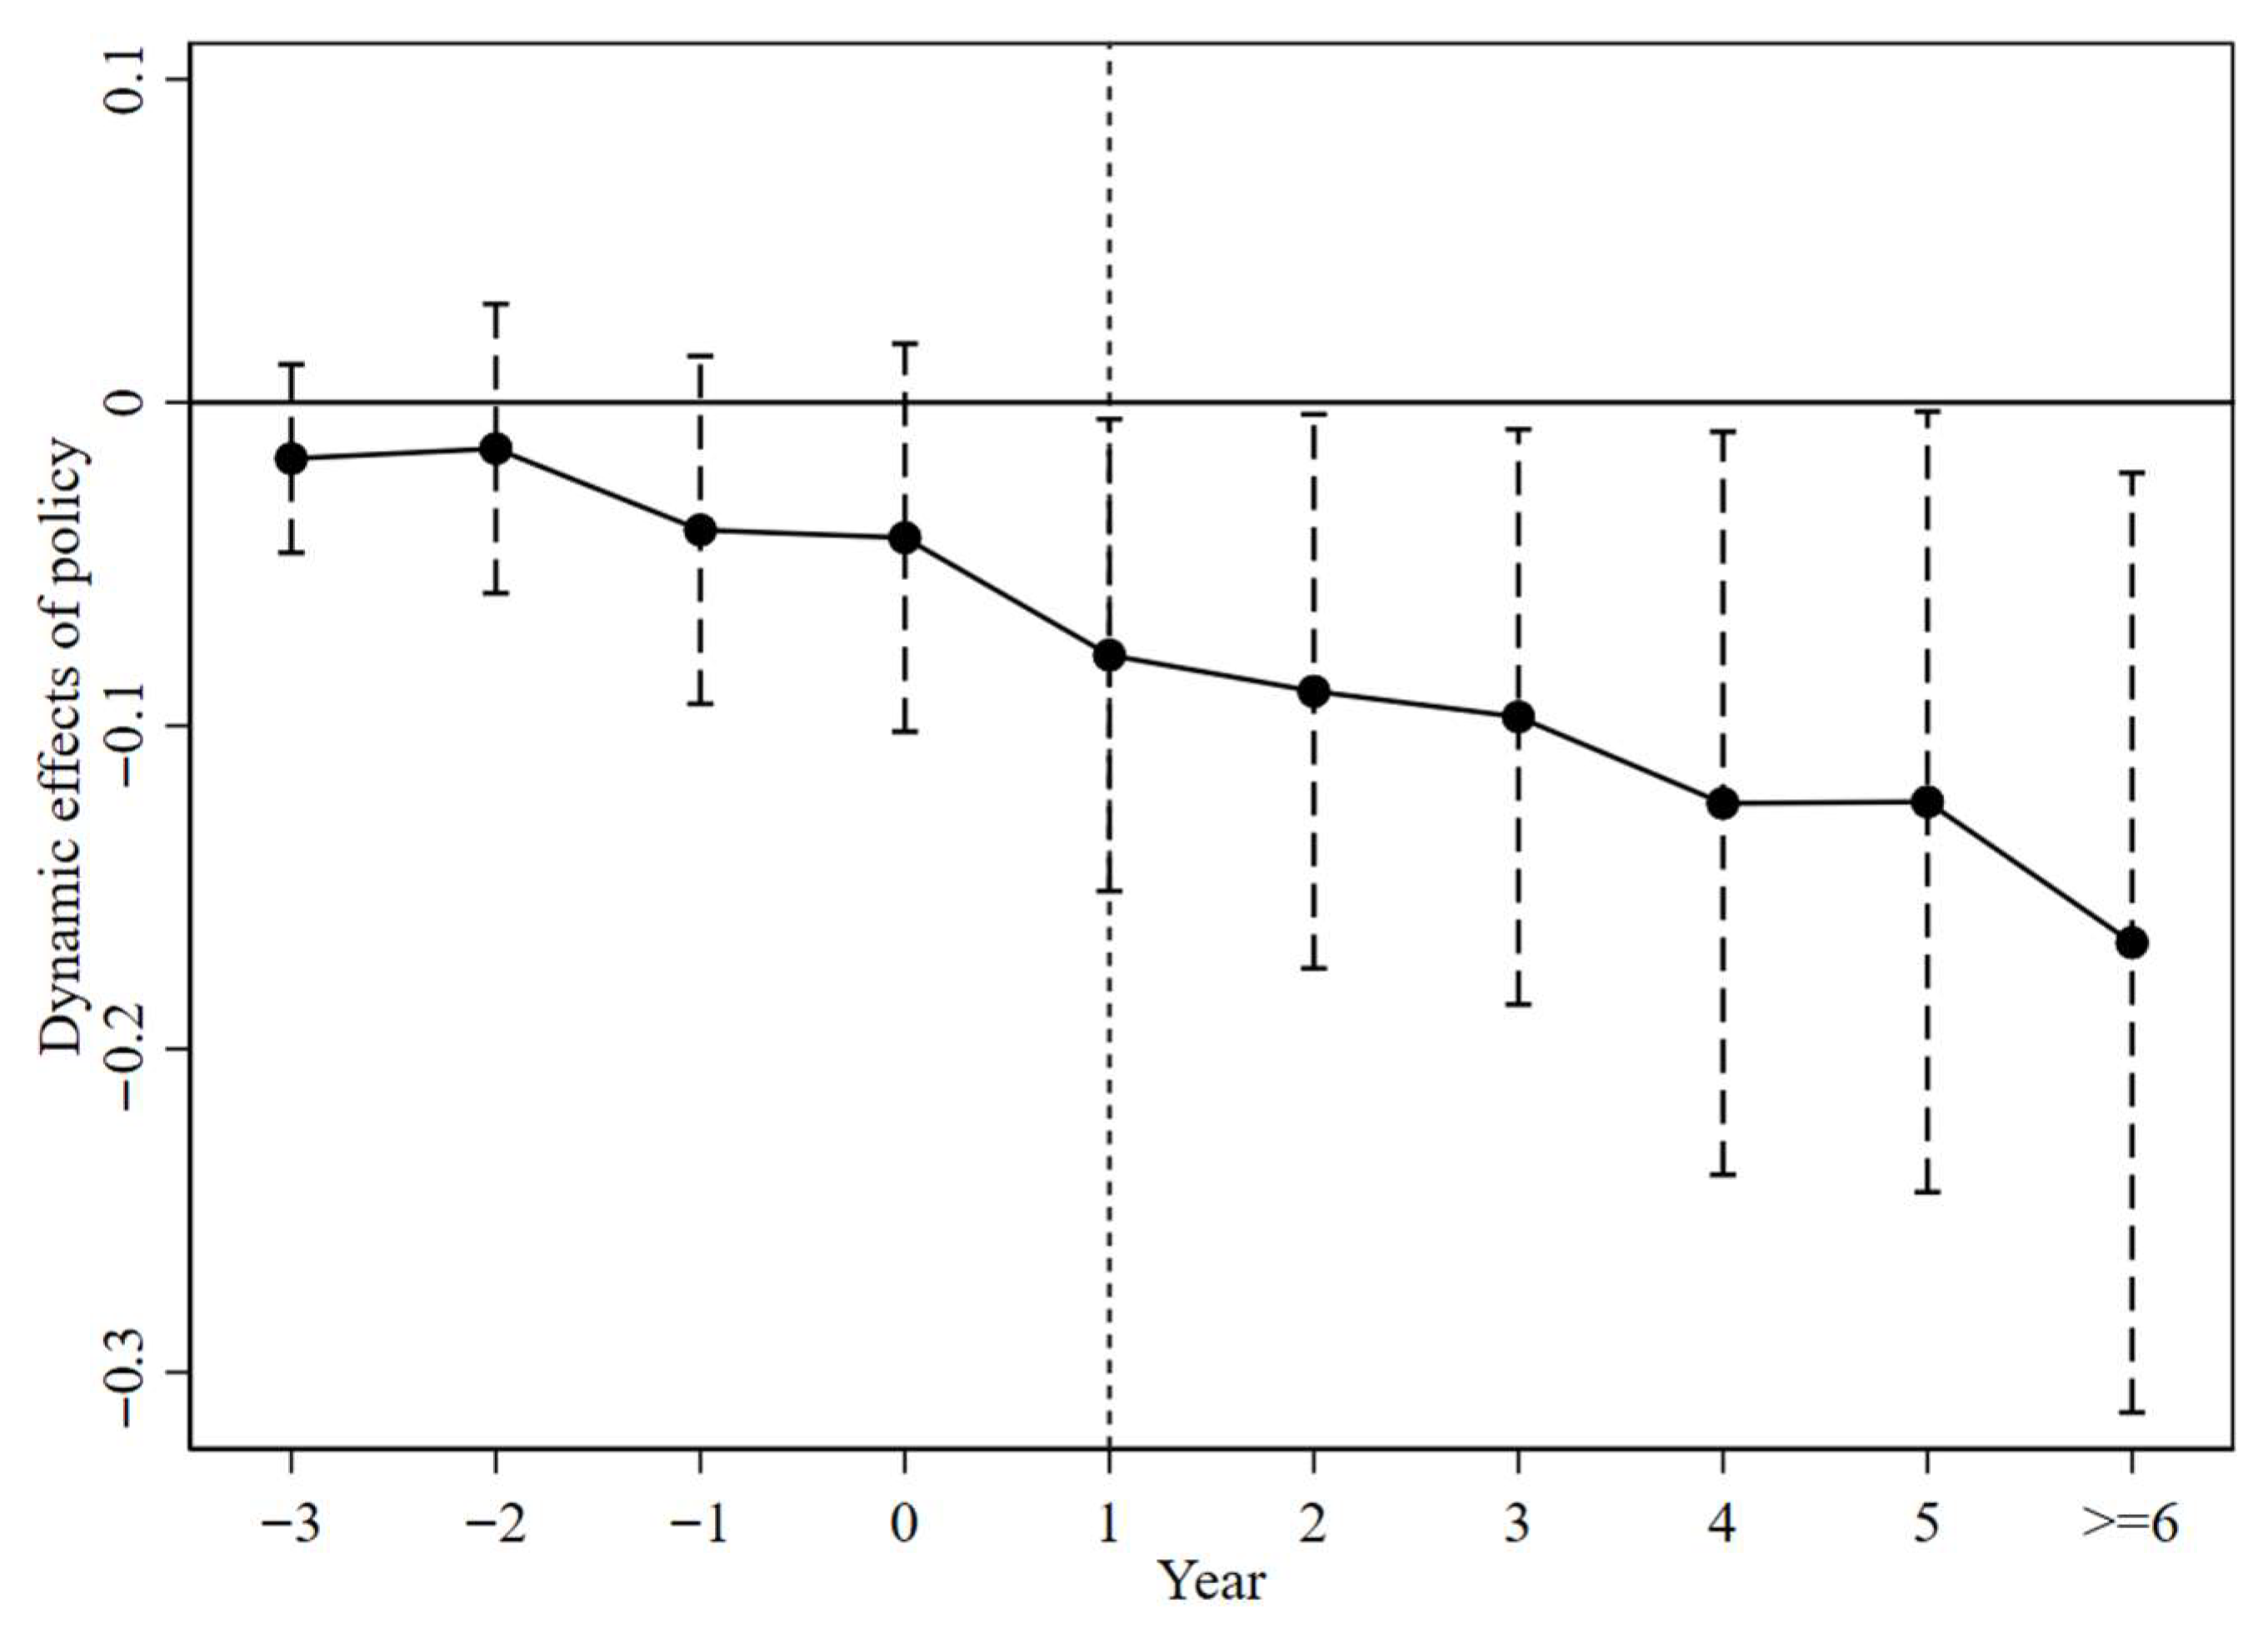
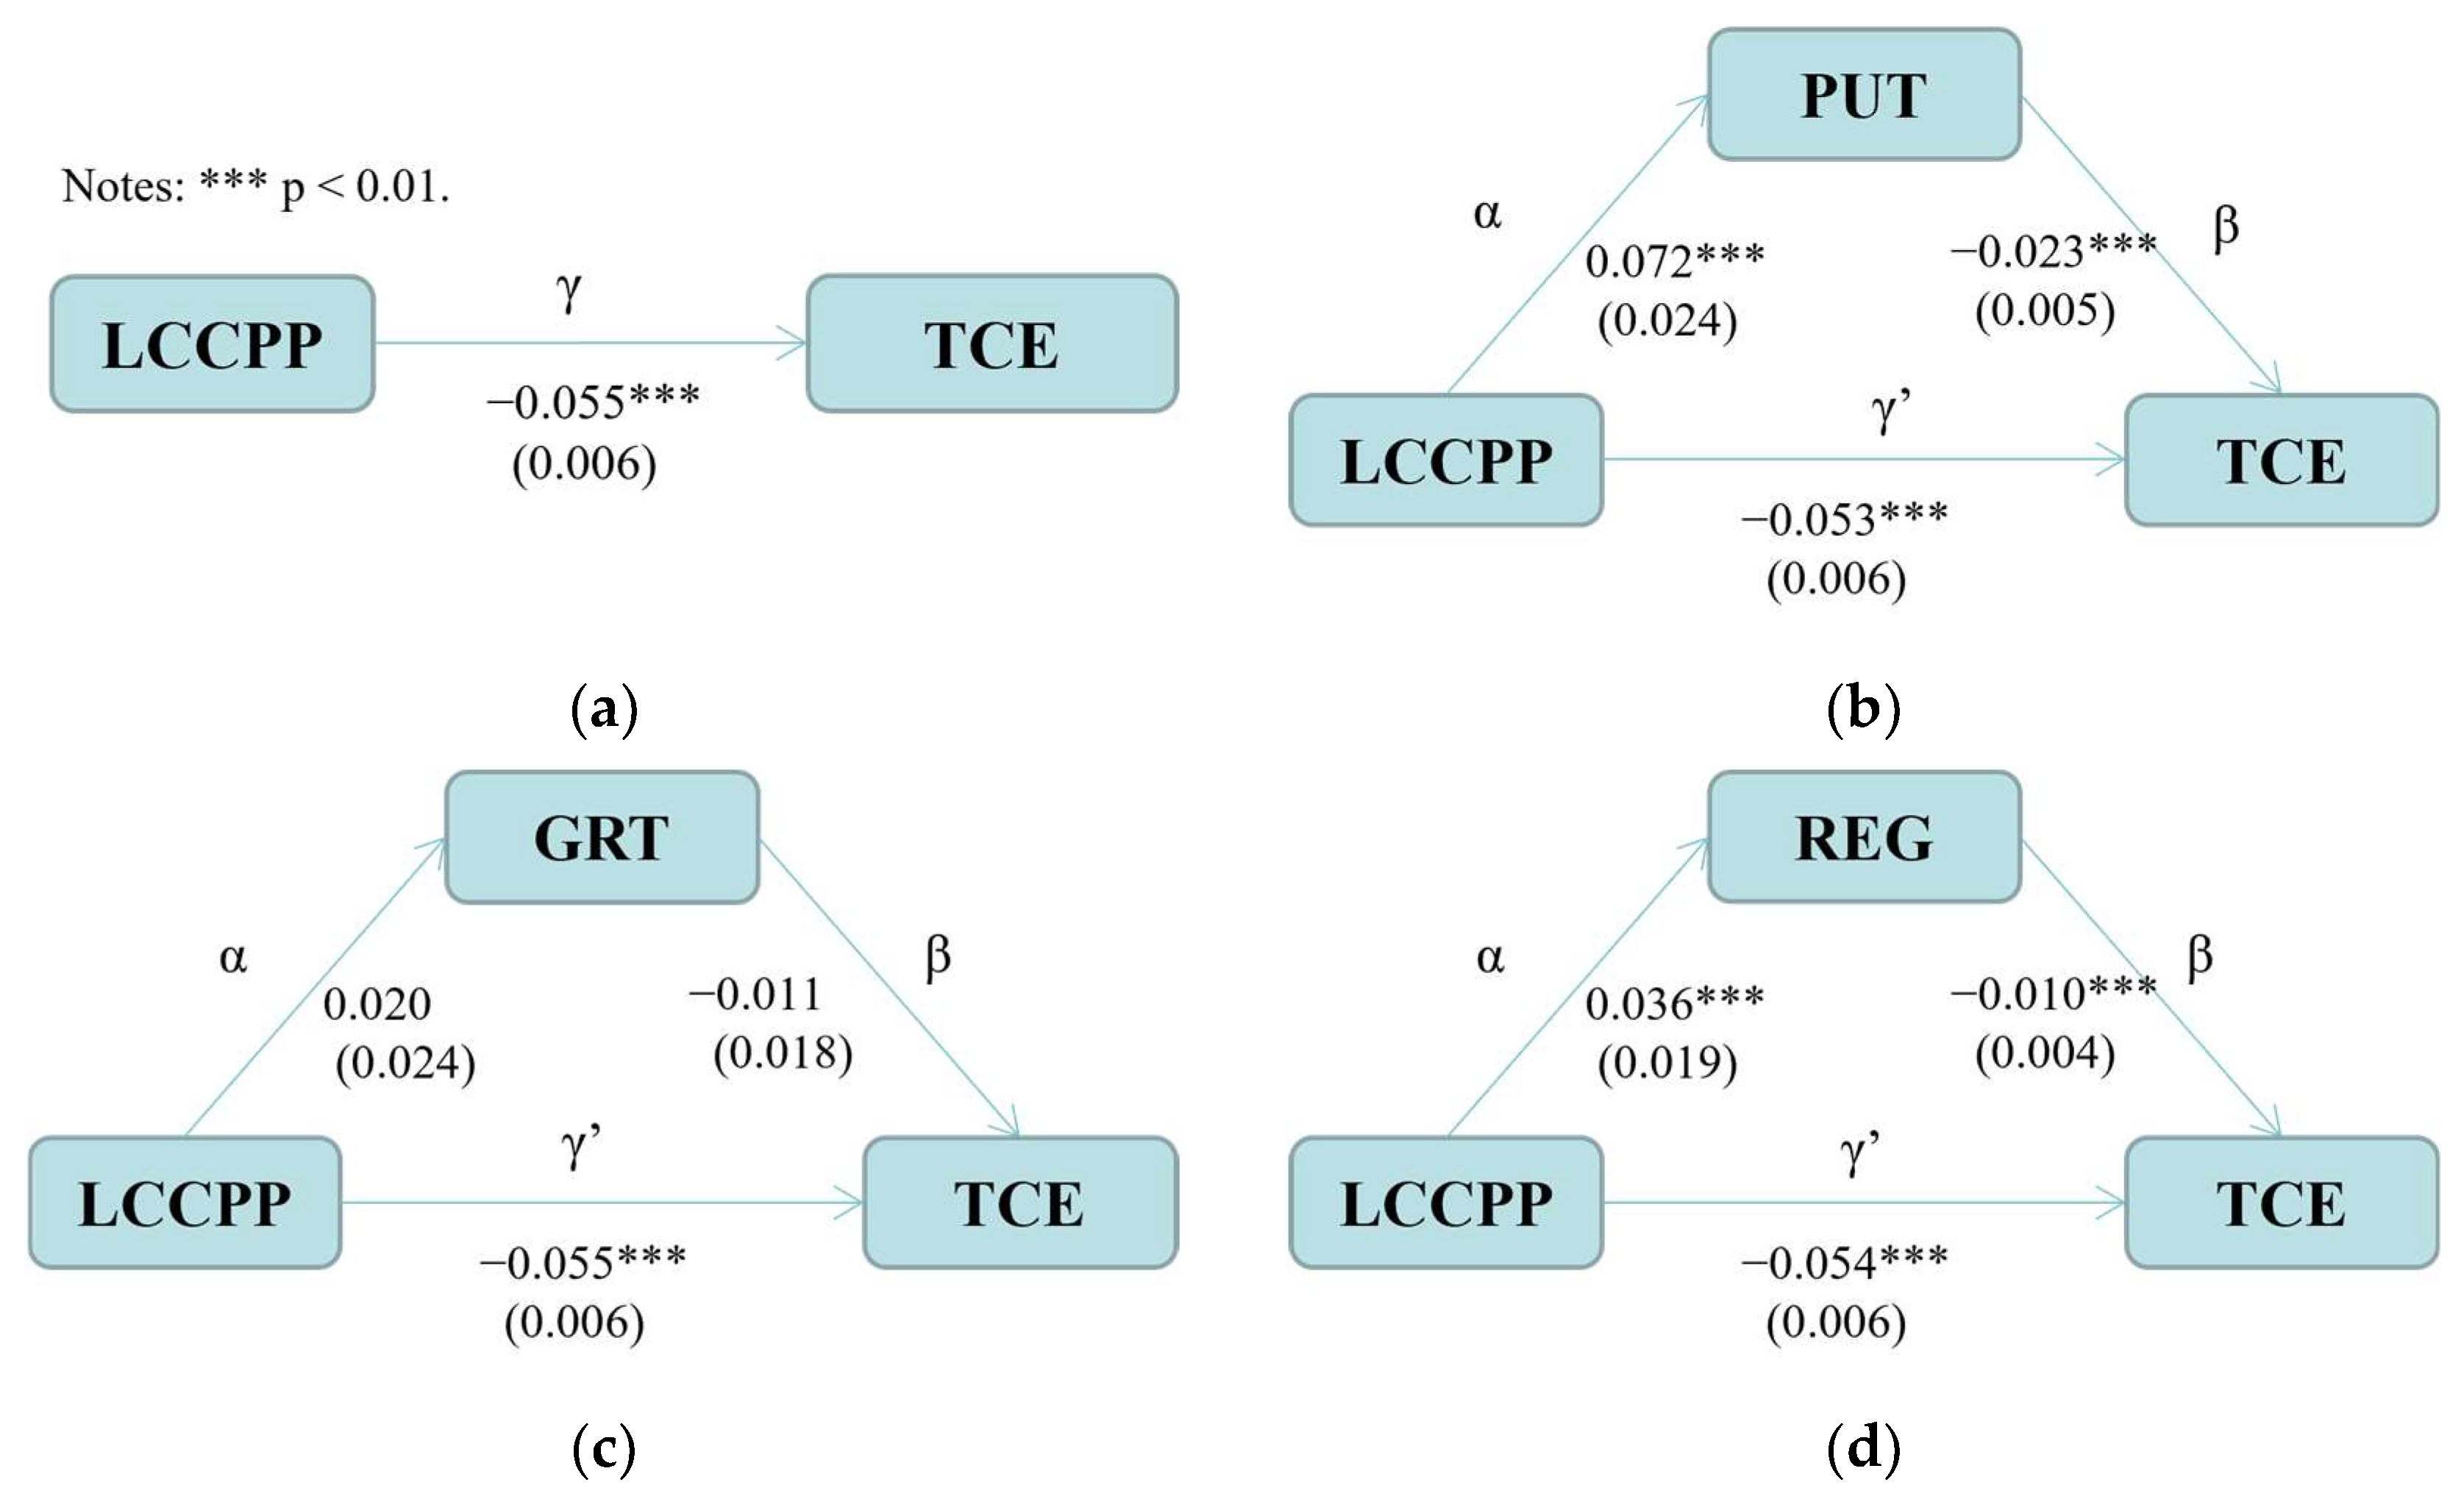
| Variable | Definition or Measurement | Unit |
|---|---|---|
| Urban transportation carbon emission (TCE) | CO2 emission of urban transportation industry measured by MEIC model | Tons |
| Difference-in-Difference (DID) | The cross-multiplier of the two variables Treated and Period | / |
| Economic development (ECO) | GDP per capita (GDP divided by the total population) | CNY per 10,000 people |
| Population (POP) | Total urban population at the end of year. | 10,000 people |
| Industrial structure (INS) | Proportion of the tertiary industry GDP/GDP. | / |
| Consumption Level (CON) | Total retail sales of consumer goods/GDP | / |
| Urban density (URD) | Urban total population/built-up area. | 10,000 people per km2 |
| Infrastructure level (INF) | Urban road area. | 10,000 square metres |
| Foreign investment level (FOI) | Overseas foreign direct investment/GDP | Ten thousand passengers per car |
| Environmental pollution index (EPI) | Calculated by entropy method (including industrial SO2 emissions, industrial wastewater emissions, industrial solid waste emissions) | / |
| Public transportation levels (PUT) | Public buses/Private car ownership. | / |
| Green technology innovations (GRT) | Number of green patent applications. | Pieces |
| Resident’s green mobility (REG) | Public transportation ridership | 10,000 people |
| Variables Set | Variables | Observation | Mean | Standard Deviation | Minimum | Maximum |
|---|---|---|---|---|---|---|
| Dependent variables | CO2 | 4260 | 254.7 | 268.6 | 8.972 | 2196 |
| Independent variables | DID | 4260 | 0.225 | 0.417 | 0 | 1 |
| Control variables | ECO | 4260 | 4.836 | 5.001 | 0.276 | 50.63 |
| POP | 4260 | 440.7 | 313.4 | 16.41 | 3416 | |
| INS | 4260 | 39.90 | 10.05 | 8.580 | 83.87 | |
| CON | 4260 | 0.367 | 0.107 | 3.11 × 10⁻⁵ | 0.996 | |
| URD | 4260 | 0.354 | 0.425 | 0.022 | 8.749 | |
| INF | 4260 | 1816 | 2483 | 14 | 31,012 | |
| FOI | 4260 | 0.0190 | 0.0239 | 1.77 × 10⁻⁶ | 0.390 | |
| EPI | 4260 | 0.0897 | 0.0890 | 0.001 | 0.939 | |
| Mediating variables | PUT | 4260 | 0.00512 | 0.00683 | 7.00 × 10⁻⁵ | 0.105 |
| GRT | 4260 | 250.7 | 797.2 | 2 | 12,534 | |
| REG | 4260 | 20,473 | 43,290 | 18 | 516,517 |
| ECO | POP | INS | CON | URD | INF | FOI | EPI | |
|---|---|---|---|---|---|---|---|---|
| Tolerance | 0.331 | 0.186 | 0.683 | 0.708 | 0.175 | 0.143 | 0.856 | 0.753 |
| Variance inflation factor (VIF) | 3.020 | 5.370 | 1.460 | 1.410 | 5.720 | 6.970 | 1.170 | 1.330 |
| Variables | (1) | (2) |
|---|---|---|
| CO2 | CO2 | |
| DID | −0.048 *** | −0.055 *** |
| (0.013) | (0.012) | |
| ECO | 0.198 *** | |
| (0.023) | ||
| POP | 0.186 *** | |
| (0.057) | ||
| INS | 0.008 | |
| (0.032) | ||
| CON | 0.001 | |
| (0.007) | ||
| URD | 0.037 ** | |
| (0.018) | ||
| INF | 0.015 | |
| (0.010) | ||
| FOI | 0.006 * | |
| (0.003) | ||
| EPI | 0.003 | |
| (0.008) | ||
| Constant | 4.690 *** | 3.775 *** |
| (0.012) | (0.373) | |
| Observations | 4260 | 4260 |
| R-squared | 0.823 | 0.990 |
| Year fix | Yes | Yes |
| City fix | Yes | Yes |
| (1) | (2) | (3) | |
|---|---|---|---|
| Variables | Nearest Neighbour Matching | Radius Matching | Nuclear Matching |
| CO2 | CO2 | CO2 | |
| DID | −0.030 *** | −0.054 *** | −0.053 *** |
| (0.009) | (0.006) | (0.006) | |
| CTPP | |||
| Control variables | Yes | Yes | Yes |
| Constant | 3.917 *** | 3.858 *** | 3.865 *** |
| (0.213) | (0.198) | (0.198) | |
| Observations | 1843 | 4253 | 4248 |
| R-squared | 0.997 | 0.990 | 0.990 |
| Year fix | Yes | Yes | Yes |
| City fix | Yes | Yes | Yes |
| Variables | (1) | (2) | (3) | (4) | (5) |
|---|---|---|---|---|---|
| East | Central | West | North | South | |
| CO2 | CO2 | CO2 | CO2 | CO2 | |
| DID | −0.076 *** | −0.008 | −0.065 *** | −0.017 * | −0.085 *** |
| (0.008) | (0.010) | (0.010) | (0.009) | (0.007) | |
| Control variables | Yes | Yes | Yes | Yes | Yes |
| Constant | 4.672 *** | 3.734 *** | 3.734 *** | 3.064 *** | 4.086 *** |
| (0.348) | (0.212) | (0.212) | (0.273) | (0.255) | |
| Observations | 1500 | 1500 | 1260 | 1950 | 2310 |
| R-squared | 0.875 | 0.865 | 0.865 | 0.818 | 0.874 |
| Number of cities | 100 | 100 | 84 | 130 | 154 |
| Year fix | Yes | Yes | Yes | Yes | Yes |
| City fix | Yes | Yes | Yes | Yes | Yes |
| Variables | (1) | (2) | (3) | (4) |
|---|---|---|---|---|
| High-Economy Cities | Low-Economy Cities | Resource-Based Cities | Non-Resource-Based Cities | |
| CO2 | CO2 | CO2 | CO2 | |
| DID | −0.039 | −0.147 ** | −0.029 *** | −0.064 *** |
| (0.079) | (0.066) | (0.010) | (0.007) | |
| Control variables | Yes | Yes | Yes | Yes |
| Constant | −1.832 * | 0.980 | 3.022 *** | 3.966 *** |
| (1.016) | (1.132) | (0.240) | (0.232) | |
| Number of cities | 99 | 185 | 113 | 171 |
| R-squared | 0.888 | 0.662 | 0.848 | 0.848 |
| Year fix | Yes | Yes | Yes | Yes |
| City fix | Yes | Yes | Yes | Yes |
| Year | Moran’s I | E (I) | SD (I) | Z-Statistic | p-Value |
|---|---|---|---|---|---|
| 2006 | 0.180 *** | −0.004 | 0.034 | 5.426 | 0.000 |
| 2007 | 0.177 *** | −0.004 | 0.034 | 5.317 | 0.000 |
| 2008 | 0.172 *** | −0.004 | 0.034 | 5.171 | 0.001 |
| 2009 | 0.193 *** | −0.004 | 0.034 | 5.743 | 0.000 |
| 2010 | 0.212 *** | −0.004 | 0.034 | 6.312 | 0.000 |
| 2011 | 0.219 *** | −0.004 | 0.034 | 6.468 | 0.000 |
| 2012 | 0.223 *** | −0.004 | 0.035 | 6.560 | 0.000 |
| 2013 | 0.226 *** | −0.004 | 0.035 | 6.617 | 0.000 |
| 2014 | 0.214 *** | −0.004 | 0.035 | 6.217 | 0.000 |
| 2015 | 0.206 *** | −0.004 | 0.035 | 6.055 | 0.000 |
| 2016 | 0.211 *** | −0.004 | 0.035 | 6.185 | 0.000 |
| 2017 | 0.211 *** | −0.004 | 0.035 | 6.181 | 0.000 |
| 2018 | 0.209 *** | −0.004 | 0.035 | 6.109 | 0.000 |
| 2019 | 0.207 *** | −0.004 | 0.035 | 6.059 | 0.000 |
| 2020 | 0.211 *** | −0.004 | 0.035 | 6.181 | 0.000 |
| Test | Test Statistics | p-Value | ||
|---|---|---|---|---|
| LM test | LM | Spatial error | 1738.7770 *** | 0.0000 |
| Spatial lag | 145.2860 *** | 0.0000 | ||
| Robust LM | Spatial error | 1599.3900 *** | 0.0000 | |
| Spatial lag | 5.9000 *** | 0.0150 | ||
| LR test | H0: SAR model | 102.7500 *** | 0.0000 | |
| H0: SEM model | 169.7400 *** | 0.0000 | ||
| Hausman test | Test of H0: Difference in coefficients not systematic | |||
| chi2(8) = 80.19 | Prob >= chi2 = 0.0000 | |||
| Variables | (1) | (2) | (3) | (4) | (5) | (6) | (7) |
|---|---|---|---|---|---|---|---|
| Main | WDID | Spatial | Variance | Direct Effect | Indirect Effect | Total Effect | |
| CO2 | CO2 | CO2 | CO2 | CO2 | CO2 | CO2 | |
| DID | −0.059 *** | −0.051 ** | −0.065 *** | −0.131 *** | −0.196 *** | ||
| (0.0162) | (0.0253) | (0.0161) | (0.0378) | (0.0377) | |||
| Control variables | Yes | Yes | Yes | Yes | Yes | ||
| rho | 0.453 *** | ||||||
| (0.0278) | |||||||
| sigma2_e | 0.108 *** | ||||||
| (0.00257) | |||||||
| Observations | 4260 | 4260 | 4260 | 4260 | 4260 | 4260 | 4260 |
| R-squared | 0.683 | 0.683 | 0.683 | 0.683 | 0.683 | 0.683 | 0.683 |
| Year fix | Yes | Yes | Yes | Yes | Yes | Yes | Yes |
| City fix | Yes | Yes | Yes | Yes | Yes | Yes | Yes |
Disclaimer/Publisher’s Note: The statements, opinions and data contained in all publications are solely those of the individual author(s) and contributor(s) and not of MDPI and/or the editor(s). MDPI and/or the editor(s) disclaim responsibility for any injury to people or property resulting from any ideas, methods, instructions or products referred to in the content. |
© 2025 by the authors. Licensee MDPI, Basel, Switzerland. This article is an open access article distributed under the terms and conditions of the Creative Commons Attribution (CC BY) license (https://creativecommons.org/licenses/by/4.0/).
Share and Cite
Tian, B.; Yuan, C.; Wang, H.; Mao, X.; Ma, N.; Zhao, J.; Guo, Y. Does Low-Carbon Pilot City Policy Reduce Transportation CO2 Emissions? Evidence from China. Sustainability 2025, 17, 9901. https://doi.org/10.3390/su17219901
Tian B, Yuan C, Wang H, Mao X, Ma N, Zhao J, Guo Y. Does Low-Carbon Pilot City Policy Reduce Transportation CO2 Emissions? Evidence from China. Sustainability. 2025; 17(21):9901. https://doi.org/10.3390/su17219901
Chicago/Turabian StyleTian, Beisi, Changwei Yuan, Hujun Wang, Xinhua Mao, Ningyuan Ma, Jiannan Zhao, and Yuchen Guo. 2025. "Does Low-Carbon Pilot City Policy Reduce Transportation CO2 Emissions? Evidence from China" Sustainability 17, no. 21: 9901. https://doi.org/10.3390/su17219901
APA StyleTian, B., Yuan, C., Wang, H., Mao, X., Ma, N., Zhao, J., & Guo, Y. (2025). Does Low-Carbon Pilot City Policy Reduce Transportation CO2 Emissions? Evidence from China. Sustainability, 17(21), 9901. https://doi.org/10.3390/su17219901


