Article

Does Low-Carbon Pilot City Policy Reduce Transportation CO2 Emissions? Evidence from China

1
School of Transportation Engineering, Chang’an University, Xi’an 710064, China
2
Engineering Research Center of Highway Infrastructure Digitalization, Ministry of Education, Chang’an University, Xi’an 710064, China
3
School of Civil Engineering, Shandong University, Jinan 250100, China
*
Author to whom correspondence should be addressed.
Sustainability 2025, 17(21), 9901; https://doi.org/10.3390/su17219901 (registering DOI)
Submission received: 5 October 2025 / Revised: 27 October 2025 / Accepted: 4 November 2025 / Published: 6 November 2025

Abstract

Transportation is one of the major carbon dioxide (CO2)-emitting industries, facing substantial reduction pressure under low-carbon sustainable development. Cities are key to reducing transportation CO2 emissions, and the Low-Carbon City Pilot Policy (LCCPP) is essential to advance the development of low-carbon cities and achieve peak-carbon and carbon-neutral targets. In this paper, we analyse the effect of the LCCP on transportation CO2 emissions using a multiperiod difference-in-differences (DID) method with data from 284 Chinese cities between 2006 and 2020. The results indicate a substantial reduction in urban transportation CO2 emissions through the LCCP, and that the enhancement of urban public transportation levels and residents’ green mobility are effective ways to accomplish this. This conclusion is upheld after conducting various robustness tests. Examination of the heterogeneity of the results and spatial analysis revealed that the LCCPP significantly reduced transportation CO2 emissions in eastern, western, and low-economy cities in China, but not in central and high-economy cities, that the reduction effect was better for southern, non-resource-based cities than for northern, resource-producing cities, and that it exerted notable spillover effects in surrounding cities. The results of this paper offer valid policy insights and practical guidance to maximise the CO2 reduction effects of the LCCP in the transportation sector.

1. Introduction

Greenhouse gas emissions, particularly CO2, significantly impact the environment and humanity [1,2]. The transportation industry accounts for about 24% of global GHG emissions [3], a share expected to rise, with China being the top CO2 emitter, where transport ranks third among emission sources [4,5]. Reducing transport sector emissions is crucial for meeting carbon reduction and neutrality goals [6].
Currently, governments have adopted a range of policies to control GHG emissions [7] and growing numbers of cities are taking low-carbon development as a key central strategy to address climate change. The inhibitory effect of environmental regulation on CO2 emissions is empirically demonstrated through numerous scholars [8,9,10,11], and the LCCP, as a key environmental regulation, has become an important policy for coping with climate warming and reducing CO2 emissions. In 2010, China formally launched its Low-Carbon City Pilot policy (LCCPP), subsequently broadening the scope in 2012 and 2017. The three batches of low-carbon pilot cities, as released by the National Development and Reform Commission (NDRC) of China, are spatially distributed and visualised using ArcGIS 10.8 software, as shown in Figure 1.
The LCCPP clearly indicates specific tasks, emphasising the acceleration of developing low-carbon industrial, energy, building, and transportation sectors, as well as changing individuals’ lifestyles. It actively explores innovative experiences and practices, and plans and builds urban transportation, energy, and other infrastructures in accordance with low-carbon concepts. At present, China has launched pilot programmes in 6 provinces and 81 cities [12,13], which have had obvious effects on reducing total urban carbon emissions [14], as well as the industrial [15] and hotel sectors’ carbon emissions, and have promoted the tourism industry’s carbon emission efficiency [16,17]. However, studies on the specific impacts of the policy on CO2 reduction in the transportation sector are limited; there is still important space for exploration.
To fill this gap, this paper evaluates the contribution of the LCCPP to urban transportation CO2 emissions and responds to the following research questions: (1) Does the LCCPP reduce transportation CO2 emissions in cities? (2) Does the effectiveness of the LCCPP vary according to the characteristics of different cities? (3) Does the implementation of the LCCPP impact the transportation CO2 emissions in the surrounding cities?
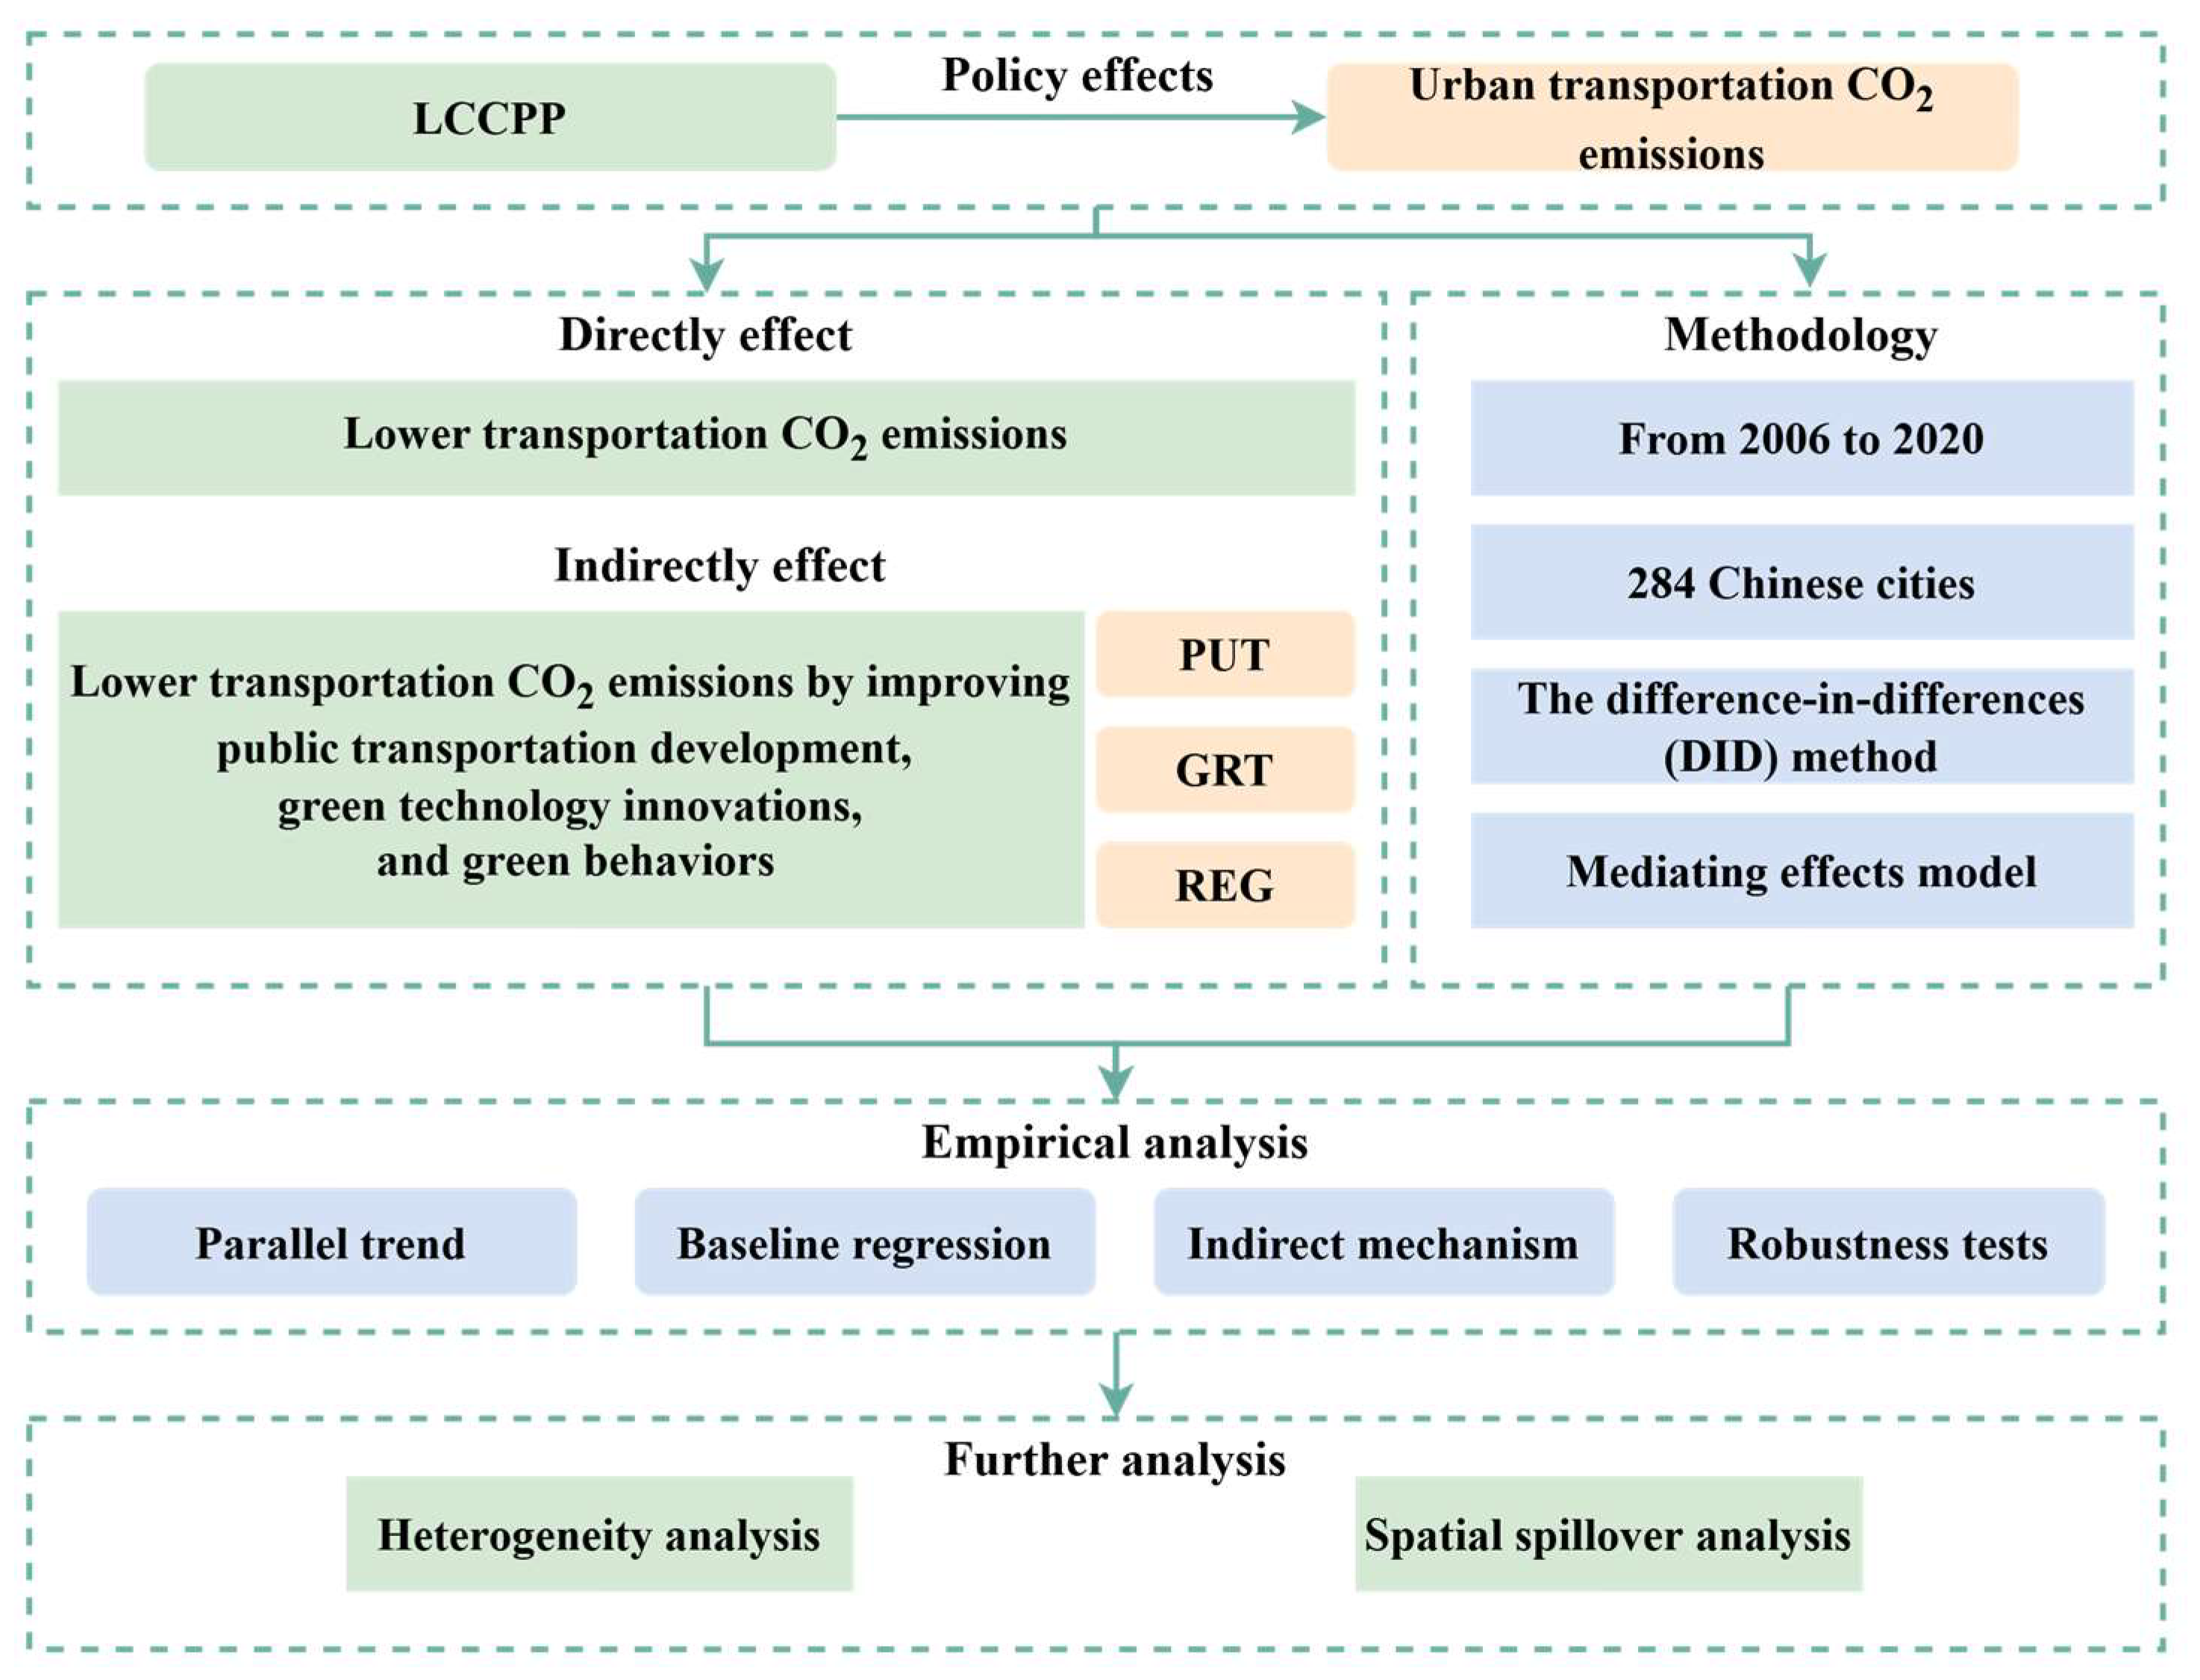
Regarding the above questions, this paper analyses the impacts of the LCCPP on transportation CO2 emissions using a multiperiod difference-in-differences (DID) approach with the panel data for 284 Chinese cities from 2006 to 2020. The primary novel contributions of this paper are highlighted in three main areas. First, in terms of policy evaluation, this study takes the Low-Carbon City Pilot Policy (LCCPP) as a quasi-natural experiment and focuses specifically on the city level to investigate its impact on transportation CO2 emissions. Most existing research on transport-related carbon emissions has been conducted at the provincial or regional scale, whereas this study provides new city-level empirical evidence that reveals more precise spatial and policy effects. In addition, by integrating the propensity score matching (PSM) method with the multi-period difference-in-differences (DID) model, the analysis effectively mitigates potential sample self-selection bias, thereby improving the robustness and credibility of the estimated results. Second, the study explores the heterogeneous impacts of the LCCPP across cities with different characteristics and regions, uncovering policy effects that vary according to city type and developmental context. These findings differ from prior studies that often emphasise uniform policy impacts. Third, this paper empirically verifies the spatial spillover effects of the LCCPP on transportation CO2 emissions in neighbouring cities, a dimension rarely examined in existing literature. Furthermore, the mechanism analysis reveals that while the LCCPP effectively promotes emission reduction through improvements in public transport and green mobility, technological innovation in transportation has not yet shown a significant carbon reduction effect, providing new insights that enrich and extend the existing understanding of low-carbon policy impacts. The detailed content framework is shown in Figure 2.
The remaining part of this paper is organised as follows: Section 2 provides a comprehensive review of the relevant literature. Section 3 outlines the methodology and details the data used in the analysis. Section 4 gives baseline regression results as well as the indirect mechanism thereof, complemented by a series of robustness checks. Section 5 examines heterogeneity as well as spatial spillover. Finally, Section 6 concludes with findings and policy implications.

2. Literature Review and Theoretical Hypotheses

2.1. Literature Review

The orderly advancement of low-carbon pilot work has brought analysis of the LCCPP’s effects to the attention of a wide range of scholars. By combing previous studies, we determined that the relevant literature focuses on two main areas.
One pertinent branch of literature examines the effects of the LCCPP. For instance, Zhang et al. [18] used a DID approach to evaluate its effect on urban total factor productivity (TFP) and concluded that LCCPP significantly enhanced TFP; however, the impacts on the various components of TFP varied. This conclusion parallels the study of Cheng et al. [19], who utilised a DID approach to determine that the policy significantly and consistently favours total green factor productivity. Consistent with these studies, Song et al. [20] and Zou et al. [21] demonstrated that LCCPP greatly improves the overall eco-efficiency and technological innovation capacity of cities; however, the degree of impact varied across different cities. In addition, scholars found that LCCPP can reduce urban energy poverty [22], improve urban air quality [23], and enhance corporate ESG practices [24], increasing urban employment [25].
The other branch of related literature explores the LCCPP’s effects on CO2 emissions, covering two main aspects. On one hand, there are some divergent findings regarding the impact of the LCCPP on CO2 emissions. For instance, Liu et al. [26] utilised data from 285 Chinese cities, concluding that the LCCPP significantly decreased carbon intensity but did not have notable effects on the total carbon emissions. Conversely, Lyu et al. [27] assessed the policy impacts of three batches of pilot cities based on 331 cities, and utilising DID modelling, they found that the LCCPP significantly lowered total and per capita CO2 emissions. In addition, Du et al. [28] and Yu et al. [29] evaluated the effects of pilot policies on CO2 emission efficiency using a DID model and PSM–DID model, respectively. The former discovered that policies greatly enhanced CO2 emission efficiency and produced lasting effects. The latter study revealed that, overall, the LCCPP notably enhanced CO2 emission efficiency in pilot scheme cities; however, the impact was significant in the second cohort but not in the first cohort. On the other hand, there have also been specialised studies that discovered that the LCCPP affects urban CO2 emissions by influencing residents’ travel patterns. Liu et al. [30] found that utilising DID and synthetic control approaches, the LCCPP enhanced residential lifestyle green transition by reducing domestic carbon emissions by approximately 15.3%. Li et al. [31] empirically investigated how the LCCPP affects public transit utilisation and found that developing low-carbon cities significantly increased transit ridership and the frequency of transit trips per capita.
To conclude, the LCCPP has demonstrated significant effectiveness in reducing total urban carbon emissions, with extensive research supporting its positive impact on decarbonizing the industrial and building sectors [15,32]. In recent years, a growing body of literature has also analysed its role in lowering carbon emissions from residents [33], tourism, the hotel industry [16], and the trade circulation industry [34]. Notably, a substantial portion of these emissions—whether total, residential, tourism-related, or trade circulation—is closely tied to transportation activities. These relationships underscore the indirect ways in which the LCCPP mitigates urban emissions through cascading environmental and behavioural changes, highlighting the policy’s critical role in achieving broader urban decarbonization goals. However, despite these insights, the existing literature has yet to systematically investigate the direct impact of LCCPP on transportation sector CO2 emissions. Most studies have concentrated on evaluating the policy’s effects on overall urban environmental outcomes and aggregate CO2 reductions, leaving a significant research gap regarding its specific influence on transportation decarbonization.
In view of this, we incorporate the implementation of the three batches of the LCCPP into a comprehensive analytical framework and employ a multiperiod difference-in-differences (DID) approach to rigorously evaluate the policy’s impact on transportation CO2 emissions. To enhance the robustness of our findings and mitigate potential selection bias among pilot cities, we incorporate controlled city attributes and apply the propensity score matching PSM–DID method. Additionally, recognising the interconnected nature of urban systems [35], we investigate the spatial spillover effects of the LCCPP on transportation CO2 emissions in surrounding cities. This study not only fills the current gap in the literature but also provides a more holistic understanding of the policy’s direct and indirect effects on transportation decarbonization. These contributions aim to inform more targeted and effective low-carbon strategies, advancing the broader goal of sustainable urban development.

2.2. Theoretical Hypotheses

The LCCPP clearly indicates specific tasks, emphasising the acceleration of developing low-carbon industrial, energy, building, and transportation sectors, as well as changing individuals’ lifestyles. It actively explores innovative experiences and practices, and plans and builds urban transportation, energy, and other infrastructures in accordance with low-carbon concepts. Thus, it is meaningful to study its effect on urban transportation CO2 emissions and its mechanisms of action on the relevant departments to assess the implementation effects and illustrate the experience of pilot cities.
Hypothesis 1.
Implementation of LCCP policy is conducive to urban transportation CO2 emissions reduction.
The inhibitory effect of environmental regulation on CO2 emissions has been empirically demonstrated by numerous scholars [36,37,38], For example, Sun (2025) found that the implementation of China’s Low-Carbon Transportation System (LCTS) pilot policy significantly reduced urban carbon emission intensity by an average of 17.3%, highlighting its effectiveness in promoting urban carbon reduction [39]. And the LCCPP, as a key environmental regulation, has become an important policy for coping with climate warming and reducing CO2 emissions. Existing studies have confirmed that the LCCPP can directly reduce urban CO2 emissions [40] and improve emission efficiency [41]. Considering that transportation is one of the major sources of urban carbon emissions, and its emission characteristics are closely linked to energy consumption and travel demand, it is reasonable to hypothesise that the implementation of the LCCPP will effectively promote reductions in transportation-related CO2 emissions.
Hypothesis 2.
The LCCP policy reduces urban transportation CO2 emissions by improving urban public transportation levels, green technology innovations, and residents’ green mobility.
The LCCPP promotes CO2 emission reduction through several pathways. On the one hand, it encourages cities to develop public transportation systems and increase the number of buses to reduce CO2 emissions [30]. On the other hand, it relies on measures including green technology innovation, industrial restructuring, and energy consumption reduction to facilitate carbon emission reduction targets [42,43,44]. For example, Huang Huan [45] argues the CO2 emission reduction effect of pilot policies from multiple perspectives. However, the extent to which technological advancements specifically contribute to transportation sector decarbonization remains underexplored and requires further investigation. In addition, green travel has been widely recognised a valid way to reduce CO2 emissions [46,47,48], and the LCCPP emphasises changing commuting habits to promote low-carbon urban development. Studies have shown that the pilot policy raises citizens’ awareness of low-carbon cities [49]. Some scholars have explored carbon reduction pathways in pilot policies from different perspectives, such as the public transportation environment [50] and resident participation [51]. Therefore, based on the above evidence, we propose that the LCCPP reduces transportation’s CO2 emissions by enhancing urban public transportation, green technology innovations, and residents’ green travel.
Hypothesis 3.
The effect of the LCCP policy on urban transportation CO2 emissions differs across cities and may exhibit spatial spillover effects.
Cities in China differ greatly in economic development, government administrative capacity, transportation infrastructure, and travel demand patterns. These variations shape the composition and efficiency of urban transportation systems, resulting in heterogeneous responses to environmental policies. Previous studies have shown that although the LCCPP effectively reduces CO2 emissions overall, its impact varies substantially among regions due to differences in local development contexts and policy implementation capacity [38,52,53,54,55]. Moreover, since transportation systems are spatially connected through intercity travel, logistics, and regional cooperation, the implementation of the LCCPP in one city may also influence transportation-related CO2 emissions in neighbouring cities through spillover effects. Therefore, it is reasonable to hypothesise that the LCCPP’s effects on transportation CO2 emissions not only differ across cities but also extend spatially to surrounding areas.

3. Methodology and Data

3.1. Multiperiod DID Model

Because this policy was initiated in three stages, we use a multiperiod DID approach to examine whether the policy in China reduces urban transportation CO2 emissions. The multiperiod DID baseline model is defined by the following:
Y i t = α + β D I D + γ C o n t r o l i t + σ t + η i + ε i t
where i and t are the observation city and observation year, respectively, and Y i t is the urban transportation CO2 emissions. DID denotes the virtual variable of the LCCP. C o n t r o l i t denotes control variables. α is a constant term, γ is the estimated coefficient of the control variable, σ t is a city-fixed effect, η i is a time-fixed effect, and ε i t is a random disturbance term. The parameter β is the LCCPP’s effect on urban transportation CO2 emissions, where a significant positive value indicates that it has increased urban transportation CO2 emissions, whereas a significant negative value implies that it has successfully decreased urban transportation CO2 emissions.

3.2. Mediating Effects Model

The mediating effect model [56] is introduced to verify the LCCP’s indirect effect mechanisms on urban transportation CO2 emissions. The specific model as follows:
M i t = α 1 + β 1 D I D + γ 1 C o n t r o l i t + σ t + η i + ε i t
Y i t = α 2 + β 2 D I D + ρ M + γ 2 C o n t r o l i t + σ t + η i + ε i t
where M i t is a mediating variable, ρ is the estimated coefficient of M i t . The remaining variables remain as defined in Model (1).

3.3. Data and Variables

Dependent variable
Herein, transportation CO2 emissions data for each city are sourced from the MEIC website (http://meicmodel.org.cn/, accessed on 9 April 2025), which is based on the Multi-resolution Emission Inventory Model for Climate and Air Pollution Research (MEIC) developed by Tsinghua University. The MEIC model generates high-resolution carbon emission data for five sectors: transportation, power, industry, residential, and agriculture. Transportation emissions data cover various modes such as rail, bus, truck, and motorcycle. Compared to traditional ‘top-down’ methods, this model offers a more comprehensive and detailed dataset.
Independent variable
The independent variable indicates whether a city is categorised as a low-carbon pilot region; it is the DID variable in the empirical model, DID being the cross-multiplier of two variables: Treated and Period. The value of the Treated variable is 1 when the city is chosen as a pilot city and 0 otherwise. The value of the Period variable is 1 in the present year and all years thereafter if the city is categorised as a pilot city in that year, and 0 otherwise.
Mediating variables
According to the relevant literature review and theoretical hypotheses, urban public transportation, green technology innovations, and residents’ green travel may be a valid way to reduce CO2 emissions in transportation. Consequently, we select these factors as mediating variables to examine their roles in the LCCPP’s impact on transportation CO2 emissions.
Control variables
Referring to existing research [57,58,59,60] and combining the current developments in the transportation industry, this paper mainly controls the following variables: economic development, population, industrial structure, consumption level, urban density, infrastructure level, foreign investment level, and environmental pollution index.
Data specification
Owing to data availability limitations, 284 prefecture-level Chinese cities were included, and the duration of the research spans from 2006 to 2020. Data for all indicators were obtained from the China Urban Statistical Yearbook, the China Statistical Yearbook and the EPS database. Table 1 presents the definitions of variables used in this paper, Table 2 presents the descriptive statistics, and Table 3 presents the tests for multicollinearity of variables. Meanwhile, all variables other than the dummy variables were converted to natural logarithms.

4. Empirical Analysis

4.1. Parallel Trend Test and Dynamic Effect Analysis

An essential premise of the DID approach is the need to satisfy the parallel trend. Following the approaches in the relevant literature [61], event analysis is employed in this paper to examine parallel trends. The approach used for testing the parallel trend hypothesis is as follows:
Y i t = α + k = 1 p β k D I D i t k + β D I D i t + k = 1 q β + k D I D i t + k + γ C o n t r o l i t + σ t + η i + ε i t
where β k and β + k are the magnitude of the impact in k periods before and after the enforcement of the policy, respectively. The remaining variables remain as defined in Equation (1).
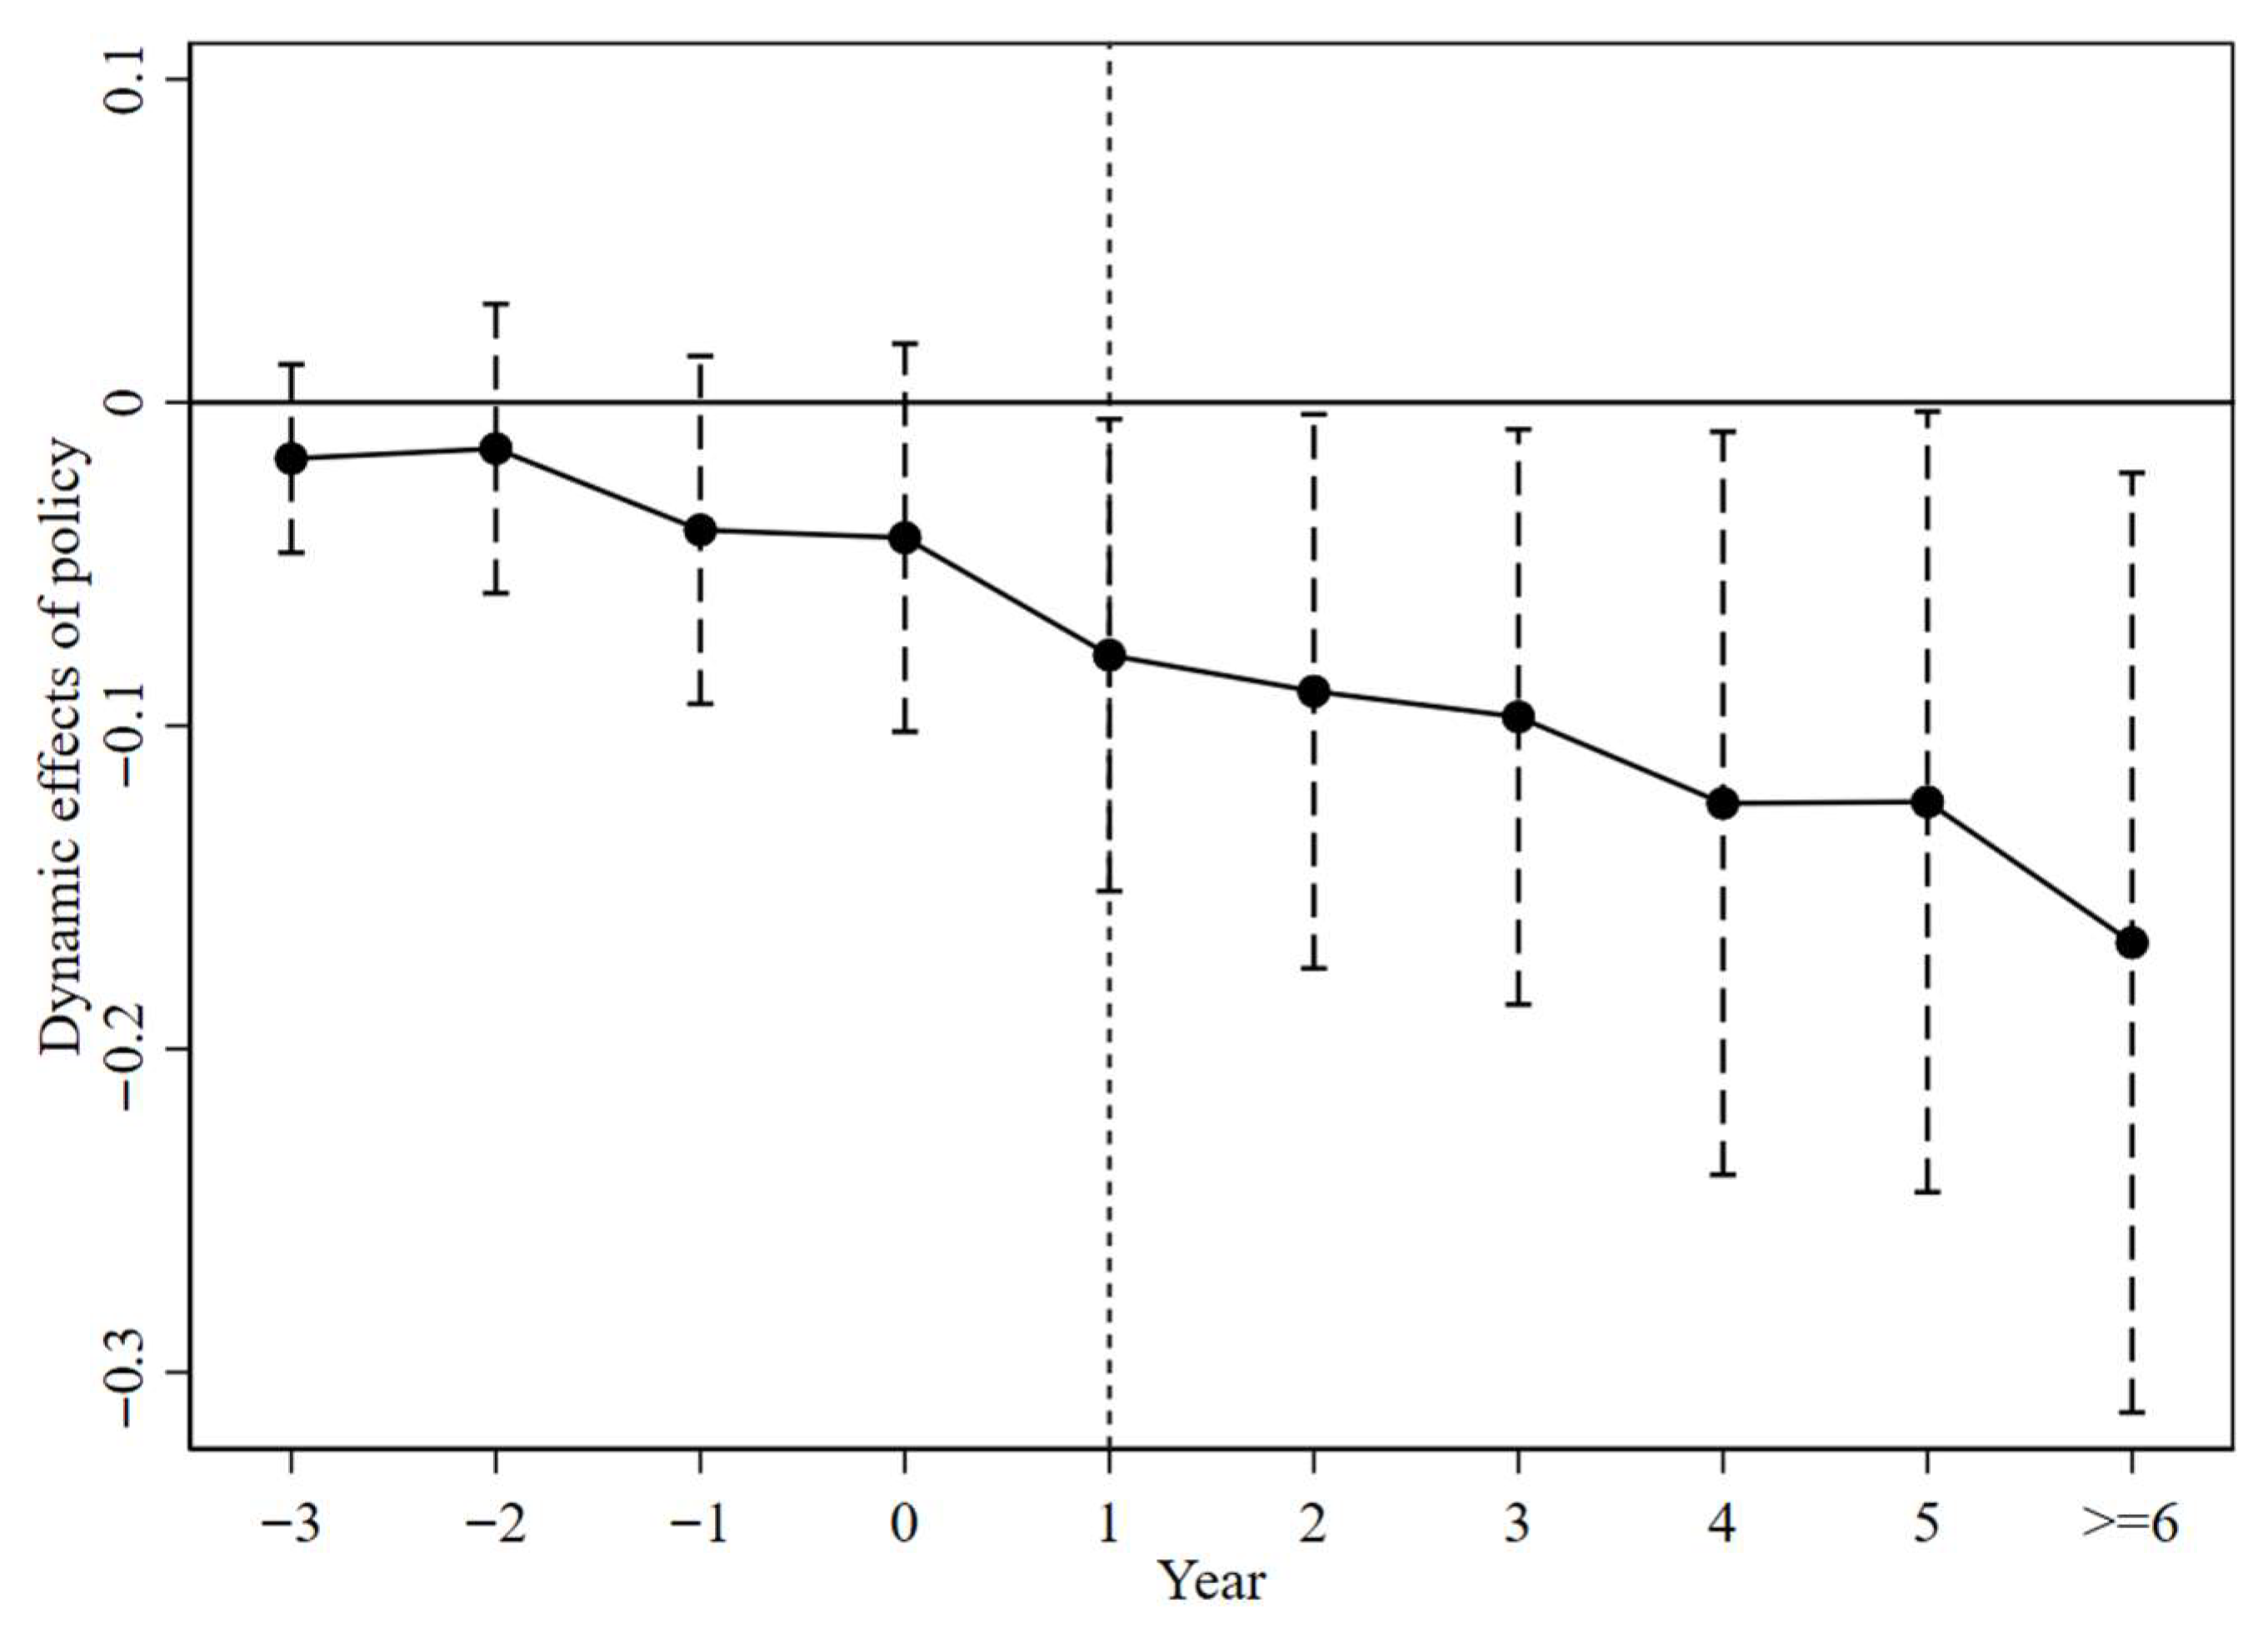
The consequences for the parallel trend test are shown in Figure 3, which summarises data for the three years before the start of the policy (including year three) as period 3, and data for the six years after the start of the policy (including year six) as period 6. Before the start of the pilot policy (period −3 to period −1), none of the policy shock coefficients significantly deviated from zero and all of them failed the significance test. This suggests that before the start of the LCCPP, a significant difference was not observed between treated and control groups, with the empirical model satisfying the parallel trend.
At the start of the policy (period 0), the policy shock coefficients are not statistically significant, reflecting that its impact is delayed and has not yet manifested itself in the current period. However, when the policy is implemented for 1 year and beyond (periods 1 to 6), the magnitude of the policy shock coefficients gradually increases, all of which achieve statistical significance. Therefore, with respect to dynamic effects, the LCCPP has increasingly contributed toward lowering transportation CO2 emissions for pilot cities.

4.2. Baseline Results

Table 4 shows the regression estimates of the LCCPP’s effect on transportation CO2 emissions. Columns 1 and 2 present findings from estimating policy effects without and with control variables, respectively, with city–time-fixed effects. In both scenarios, the regression coefficients corresponding to the main explaining variables became negative with a significance level of 0.01, indicating that the LCCP significantly contributed to reducing transportation CO2 emissions, demonstrating its full effectiveness in urban transportation CO2 reduction. Specifically, the implementation of the LCCPP reduced urban transportation CO2 emissions by 5.5%, which is likely attributed to the LCCP encouraging the growth of low-carbon transportation in cities, thereby reducing transportation CO2 emissions.
In the control variables, ECO, POP, URD, and FOI are the main reasons for increasing urban transportation CO2 emissions. For URD, some studies have shown that it can effectively reduce urban CO2 emissions [62], while conversely, some studies have found that it is a major cause of increased CO2 emissions in Chinese cities [58]. The effect of urban density on transportation CO2 emissions in China needs to be seriously considered by the relevant authorities, considering that the density of Chinese cities is much higher than that of Western cities.

4.3. Indirect Mechanism

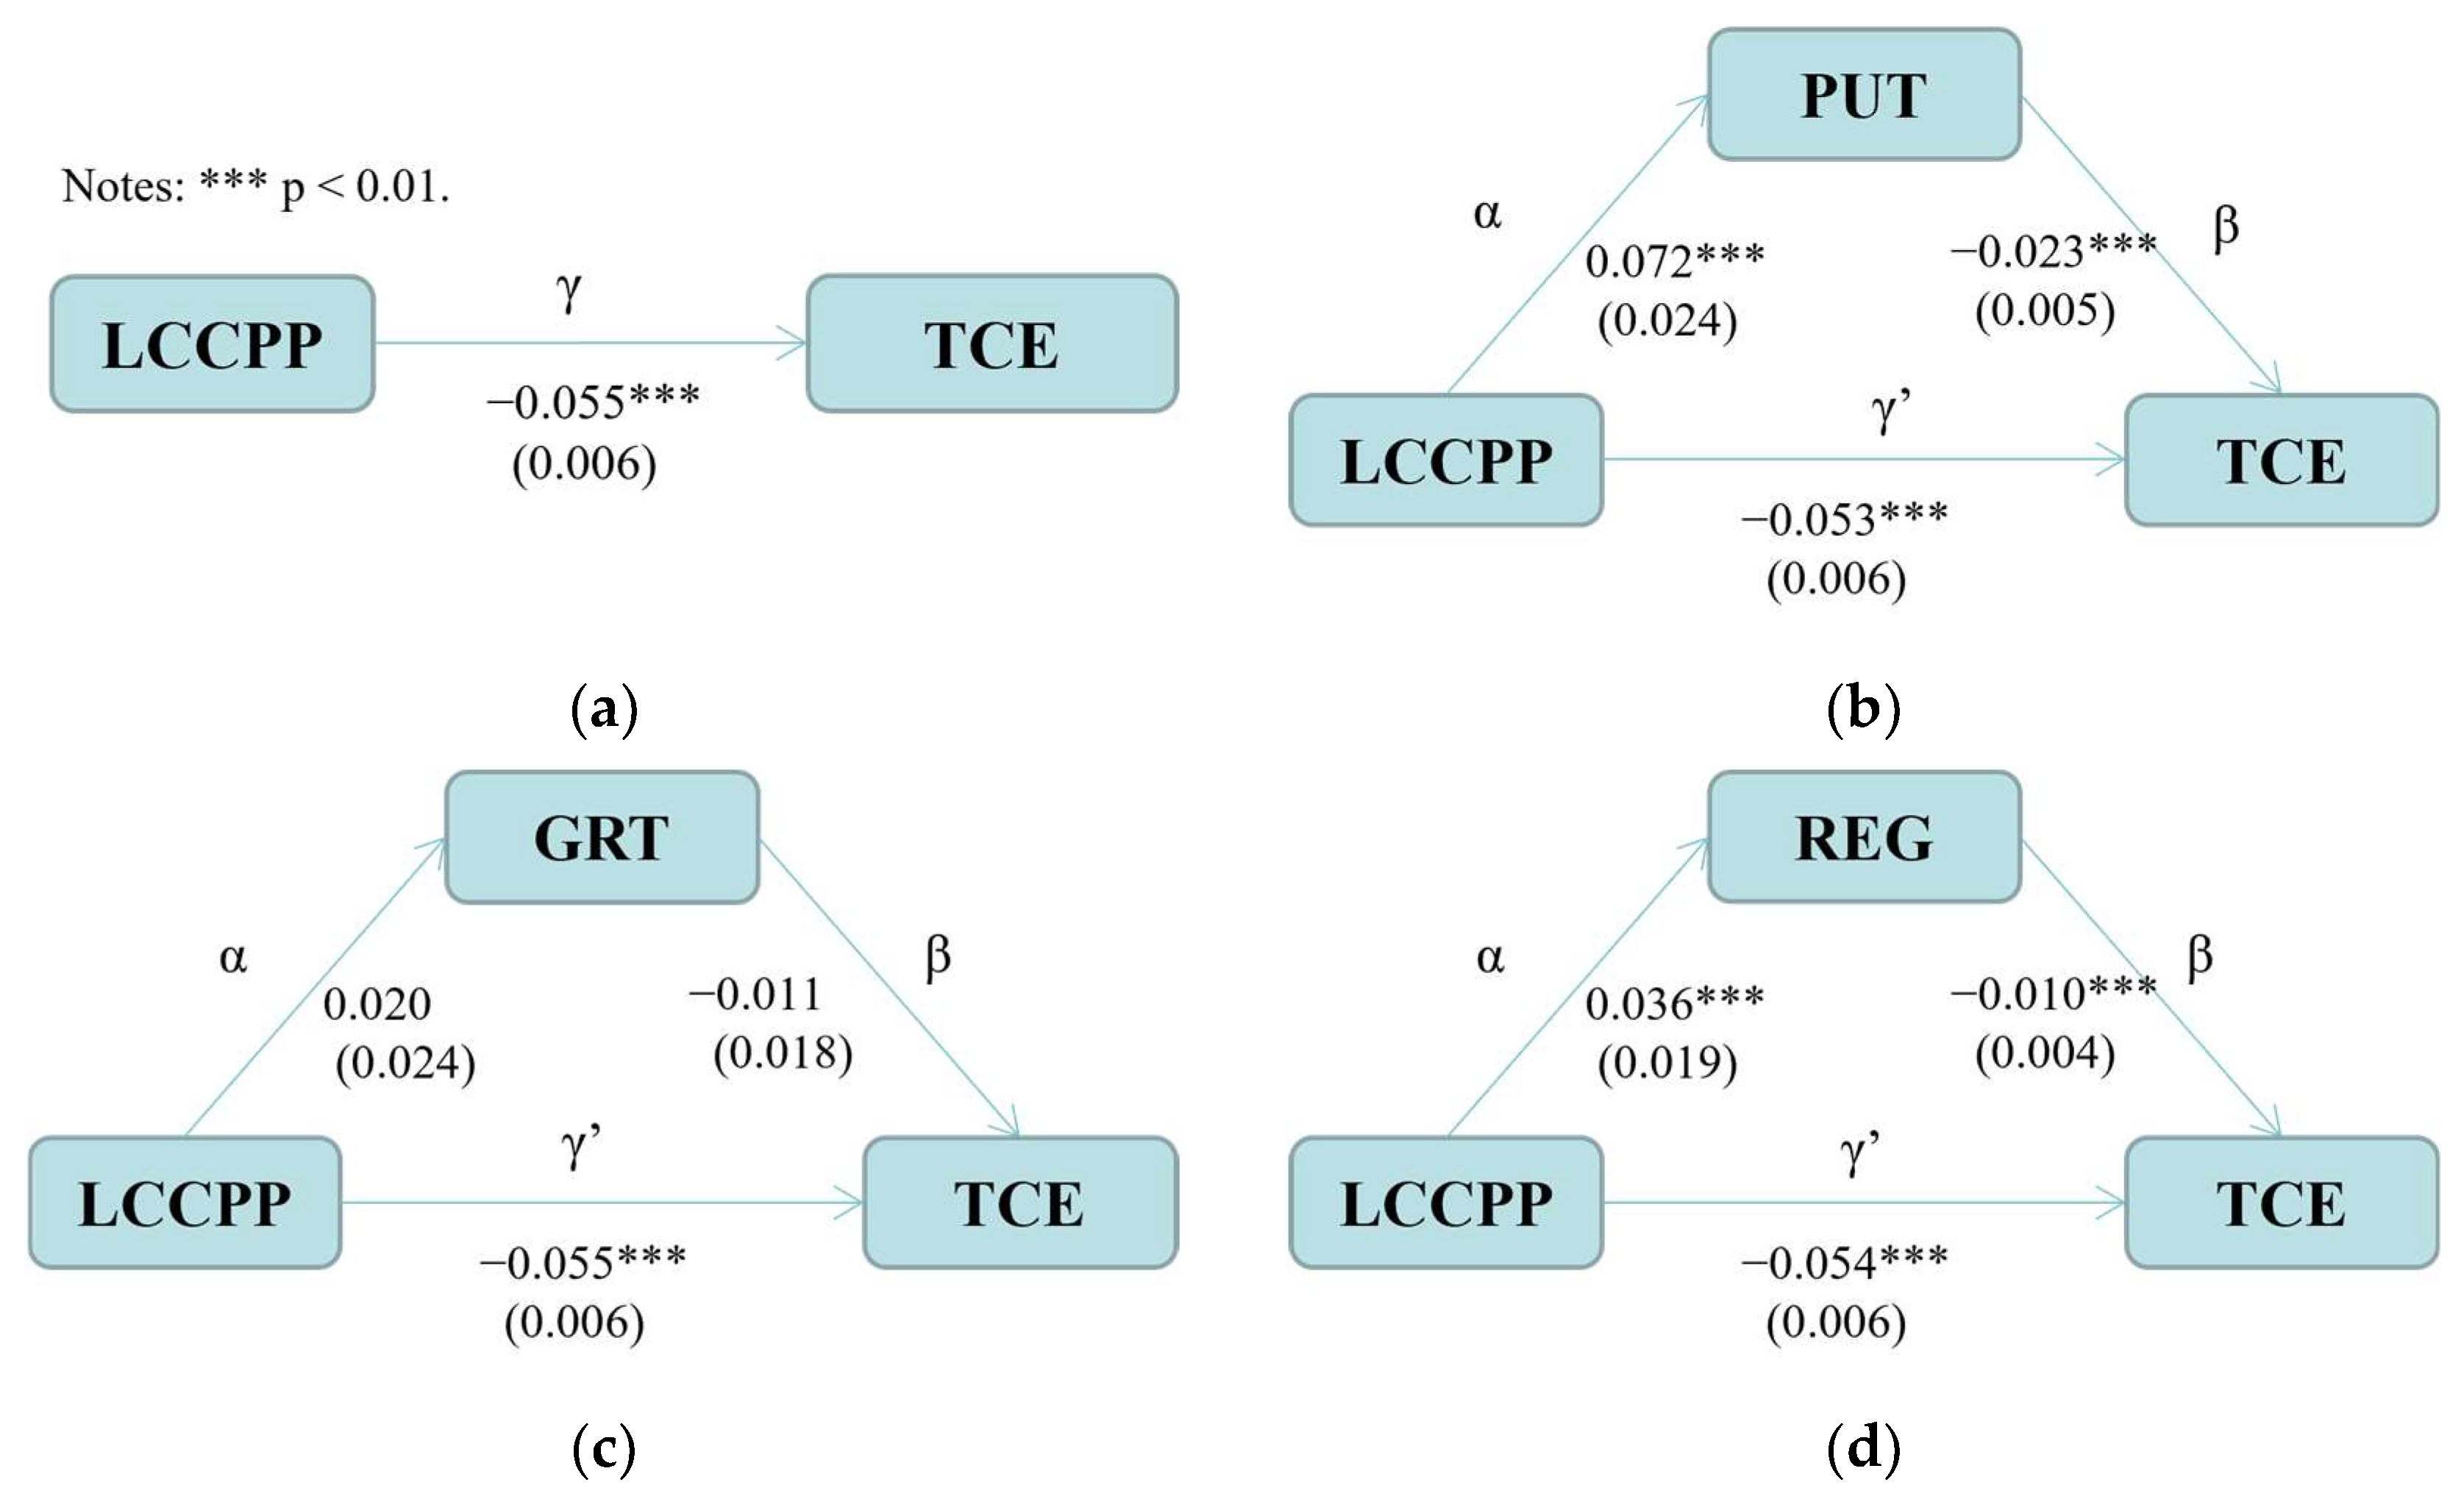
To further validate the indirect mechanisms of the effects of the LCCPP on transportation CO2 emissions, its effect is estimated based on models (3) and (4). Since the key to mechanism identification is the effect of local independent variables on its results, we only show the direct effects of key variables. The results are shown in Figure 4, and the overall test results are presented in Table A1 in Appendix A.
According to Figure 4a, the direct impact coefficient γ is −0.054, which indicates the direct effect of the LCCP on urban transportation CO2 emissions with a significance level of 1%. From Figure 4a,b, it can be found that the LCCP significantly improves the level of public transportation in a given city (α = 0.076 ***). The public transportation level variable reduces urban transportation CO2 emissions (β = −0.022 ***), and after identifying and stripping out the mediating effect, the marginal effect of the LCCPP on urban transportation CO2 emissions γ’ is −0.052 ***, which is smaller than the direct effect γ before the mediating effect is stripped out (−0.054 ***).
In Figure 4a,c, urban green technology innovation is improved by the implementation of the LCCP (α = 0.020), and the green technology innovation variable also reduces urban transportation CO2 emissions (β = −0.011), but neither of them is significant. This shows that the green technology innovation effect does not play a significant mediating role in the implementation of the LCCP, and the direct effect of urban transportation CO2 emissions is not realised through this mechanism. However, studies have shown that green technology innovations can contribute to a reduction in the overall CO2 emissions of cities [63]. This may be due to technology innovations in the industrial sector that have significantly reduced industrial energy emissions. However, transportation CO2 emissions are mainly determined by vehicle emissions, and technologies such as new energy vehicles may face higher costs and lower market acceptance at the initial stage, resulting in slower penetration and thus not yet contributing to a significant CO2 reduction.
Figure 4a,d shows that the LCCP significantly increases residents’ green mobility (α = 0.036 ***). The residents’ green mobility variable shows its influence on reducing urban transportation CO2 emissions (β = −0.010 ***), and after identifying and stripping off the mediating effect, the marginal effect of the LCCPP on urban transportation CO2 emissions γ’ is −0.054 ***, which is smaller than the direct effect of the mediating effect before stripping off the mediating effect γ (−0.055 ***). It shows that the residents’ green mobility effect has a significant mediating effect; the direct effect of urban transportation CO2 emissions can be realised through this mechanism.
In summary, from the results presented in Figure 4, it is clear that the LCCPP not only directly decreases transportation CO2 emissions; it also promotes a decrease in urban transportation CO2 emissions by enhancing the PUT and REG.

4.4. Robustness Tests

4.4.1. Placebo Test

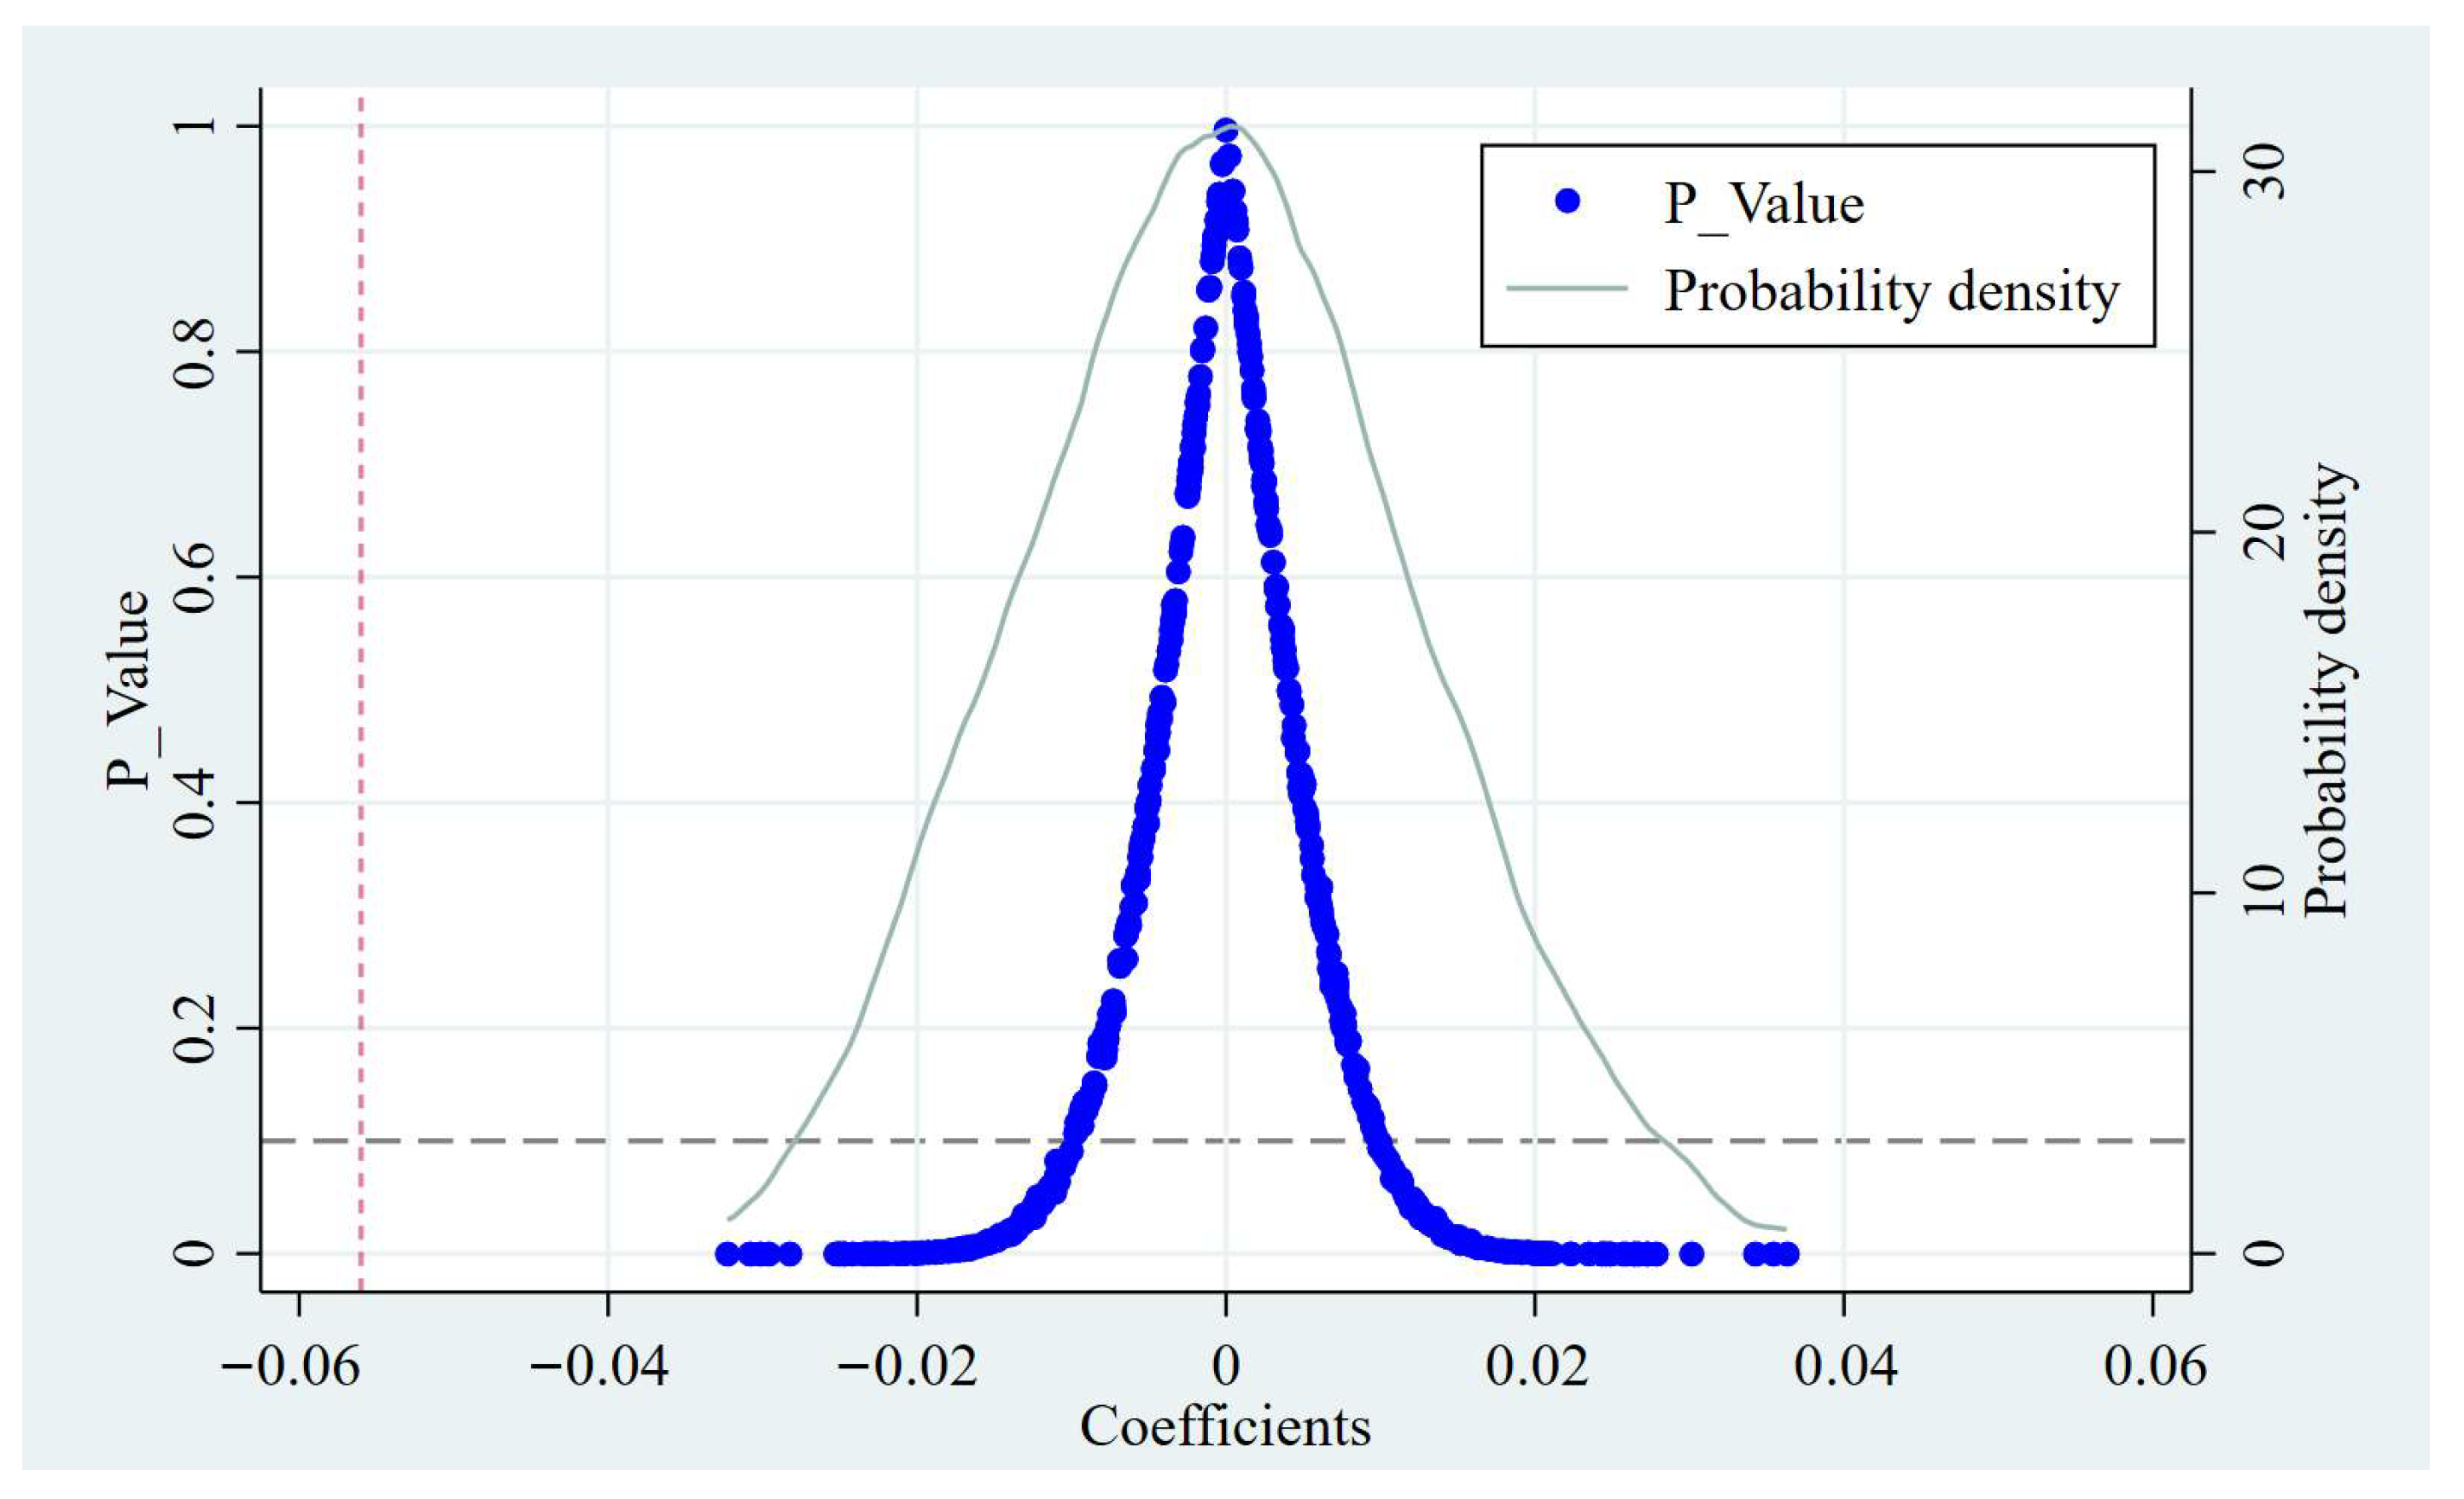
To eliminate the influence of unobservable factors on results according to time and region, a placebo test was conducted with reference to the study of Xiao et al. [64] and Li et al. [15]. This was performed as follows: pseudo-processing group ‘Treated’ was randomly generated and regressed by a computer, and then 500 random simulations were performed, and the coefficients and p values of P e r i o d × T r e a t e d were extracted and plotted as scatter plots, as shown in Figure 5.
As shown in Figure 5, estimated coefficients for the interaction terms are mainly clustered around 0, with most simulated coefficients having p values above 0.05, indicating insignificance at the 1% level. This finding suggests that baseline estimates are likely not random and thus unaffected by omitted variables, affirming the robustness of the core conclusions.

4.4.2. PSM–DID Estimation Results

Despite its important role in causality judgements, the DID approach still suffers from the problem of sample self-selectivity, such that the sample is not random, which leads to biased estimation results [65]. Therefore, rematching the sample using PSM methods can minimise differences among treated and control groups across all characteristics [66].
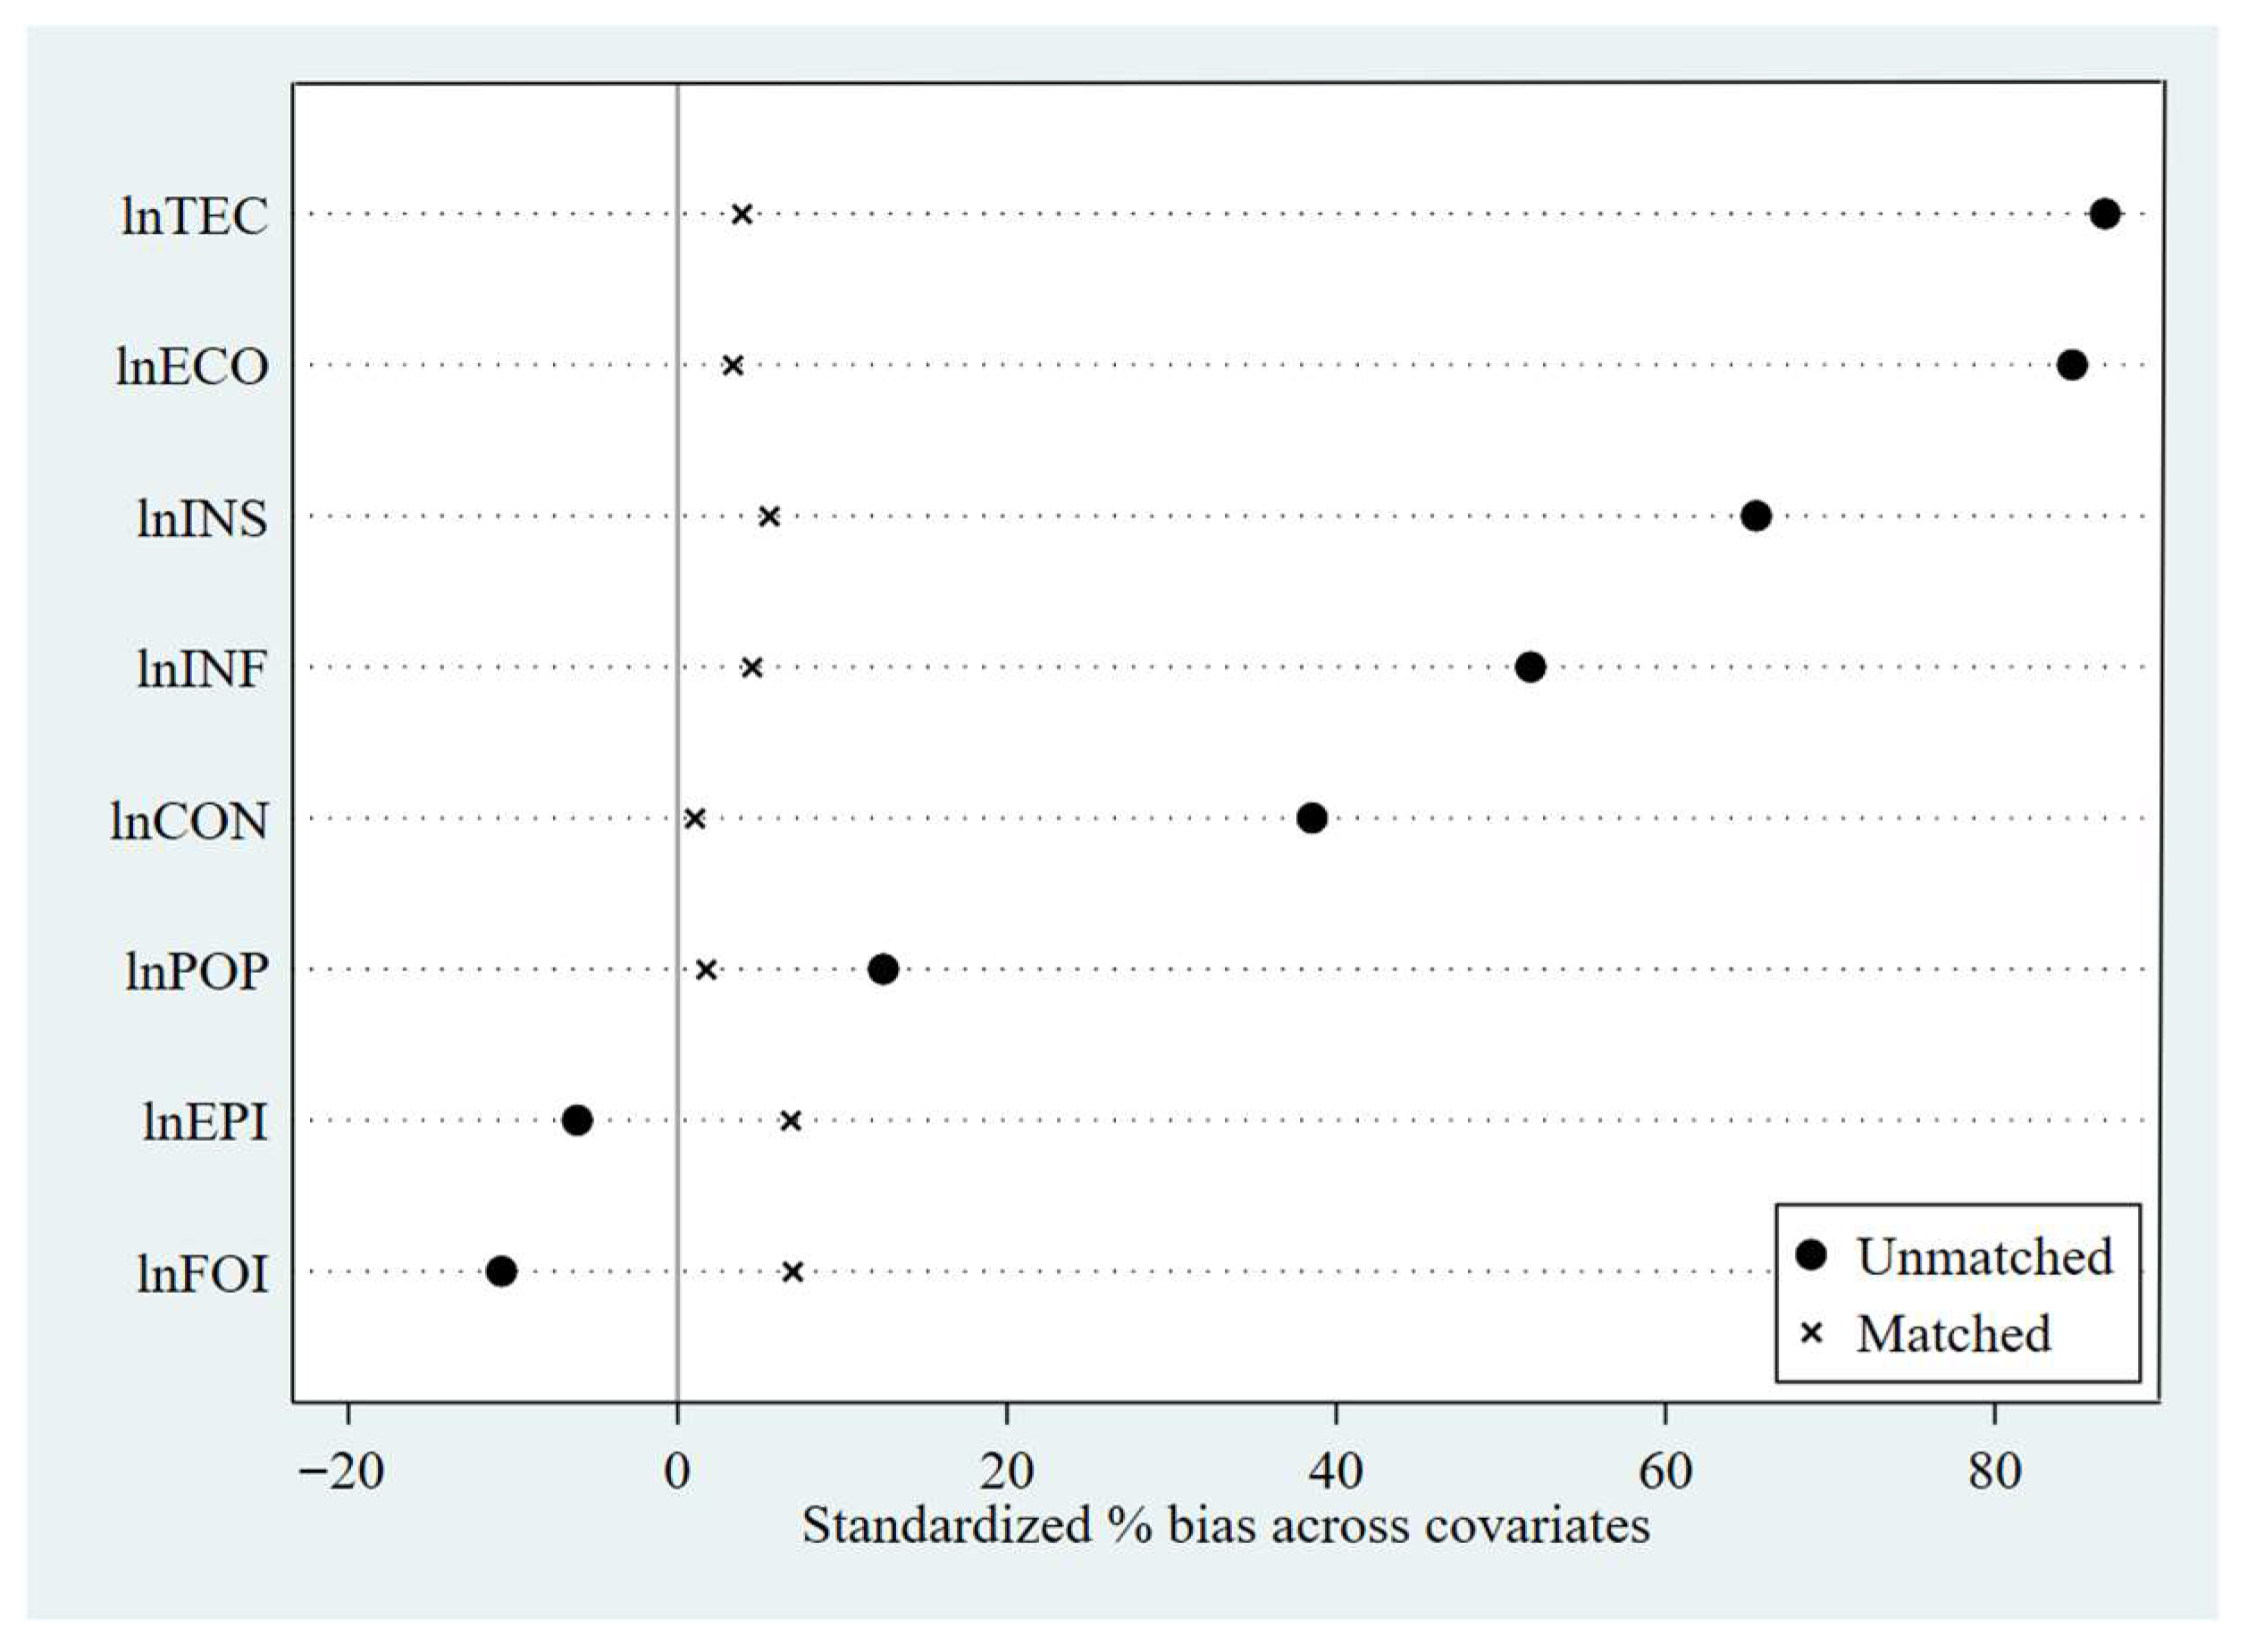
Considering the weak constraints of the LCCPP and the randomness in the selection of pilot cities, we utilise the PSM–DID approach to examine the baseline results, thereby mitigating the impact of these factors on the research results. During the matching process, the control variables in the treated and control groups were first tested for balance, as shown in Figure 6.
As shown in Figure 6, differences in control variables among the treated and control groups before and after matching are presented. Significant differences among the covariates were evident before matching, but post matching, the standardised bias of each covariate was largely balanced around the zero line. This indicates that PSM effectively mitigates systematic differences among the control variables in the two groups, achieving balance.
In addition, to avoid the potential impact of the matching method on the robustness of the conclusion, we refer to the existing literature to use nearest neighbour matching [54], radius matching, and nuclear matching methods [67] separately to match the samples, all fixing time and region effects. Table 5 presents DID estimation results after matching, which indicates that DID coefficients in columns 1–3 are all significantly negative, suggesting that the test conclusions are consistent with the previous ones after the PSM treatment eliminates self-selection bias among the samples, which further improves the robustness of the empirical conclusions.

5. Further Analysis

5.1. Heterogeneity Analysis

5.1.1. Heterogeneity in Geographic Location

The policy implementation and transportation CO2 emission levels of the sample cities may differ greatly [68,69,70]. Therefore, the sample cities were first divided into eastern, central, and western regions according to the classification of the National Bureau of Statistics of China. They were also divided into northern and southern cities based on the Qinling–Huaihe River Line, which is the natural and climatic boundary between northern and southern China. Regional heterogeneity tests were then conducted separately. Table 6 gives the regression results.
As shown in columns 1–3, it is clear that a gradient pattern is formed in the three major regions, namely, east (−0.076 ***), west (−0.065 ***), and central (−0.008). This indicates that the LCCPP as implemented in the east, central, and west regions has negative effects on transportation CO2 emissions in all cases, but the effects differ, with transport carbon reduction in the east showing an optimal effect with 7.6%, followed by the west with 6.5%, with central being the worst with only 0.8%. The reason is that eastern cities are generally more economically developed, their public transportation systems are more complete, and the popularity of green mobility among residents is higher, so the policy is more effective. Additionally, we found that DID coefficients in the central region’s cities were smaller and failed significance tests. This may reflect rapid traffic growth outpacing lagging public transit development coupled with resource allocation prioritising economic expansion over low-carbon initiatives, thus weakening the policy’s impact amid rising car ownership and structural constraints. For western cities, the LCCP’s CO2 reduction is also significant, which may be due to western cities’ smaller traffic volume and smaller transportation CO2 emissions, which makes the “carbon lock-in effect” weaker [71], enabling the policy effect to be exerted more quickly.
Columns 4 and 5 show that the LCCP reduces transportation CO2 emissions significantly in both southern and northern cities. According to estimated coefficients, the policy’s effect is significantly larger in the southern (−0.085 ***) than in the northern (−0.017 *) region. This indicates that the LCCP is more effective in the southern region. This is because the popularity of public transportation faces greater challenges in winter in the northern region, where winters are cold and long and people tend to use private cars to travel.

5.1.2. Heterogeneity in City Type

The effectiveness of LCCP policies may differ across cities [72,73]. Therefore, with reference to Lu et al. [74], cities were categorised into high-economy and low-economy cities based on gross domestic product per capita, and their economic levels’ heterogeneity was revisited.
Column 1 of Table 7 indicates that the LCCPP coefficient for the sample of high-economy cities is −0.039; however, it is not significant. Column 2 indicates that the LCCPP coefficient in the low-economy cities sample is −0.147 and is significant at a 5% level. This suggests that the LCCPP regarding transportation CO2 emission reductions has a significant role in low-economy cities, whereas it does not exert a significant role in high-economy cities. This may be due to the fact that in high-economy cities beyond leading eastern hubs, the policy’s impact is limited, as rapid urbanisation drives traffic demand and car ownership, outpacing public transit development. Resources often prioritise industrial growth over low-carbon infrastructure, and residents’ reliance on convenience reduces responsiveness to green incentives. Conversely, low-economy cities, with lower traffic volumes and less-entrenched high-carbon systems, face fewer transition barriers. Their residents, more sensitive to cost-saving policies (e.g., subsidised transit), adopt green travel readily, amplifying reductions from a lower baseline.
The sample was divided into resource-based and non-resource-based cities based on the categorisation criteria of the State Council’s National Sustainable Development Plan for Resource Cities (2013–2020) and then tested. Columns 3 and 4 of Table 7 of the DID-estimated coefficients are both significant at the 1% level, implying that in both types of cities, the LCCPP effectively decreases transportation CO2 emissions. However, regarding the values of the estimated DID coefficients, the estimated coefficient value is −0.064 for non-resource-based cities and −0.029 for resource-based cities, with the former being more than twice as high as the latter; thus the effect of the policy is better utilised in non-resource-based cities. This may be due to resource-based cities’ reliance on carbon-intensive industries and logistics, limiting transit shifts, while non-resource-based cities, with diversified economies and flexible infrastructure, more readily adopt green travel, enhancing transportation CO2 emission reductions.

5.2. Spatial Spillover Analysis

When variables are spatially correlated, ignoring spatial correlation can lead to bias [75]. Therefore, this paper further utilises the spatial estimation models to evaluate the impact of spatial spillovers of the LCCPP. The formula is as follows:
Y i t = φ j = 1 n w i j Y i t + α + β D I D + γ C o n t r o l i t + θ j = 1 n w i j D I D + λ j = 1 n w i j C o n t r o l i t + σ t + η i + ε i t
where φ is the spatial autoregressive coefficient for the dependent variable, w i j is the spatial weight matrix, and θ is the coefficient of spatial spillover. Other letters have the same implications as in Equation (1).

5.2.1. Spatial Autocorrelation and SDM Applicability Tests

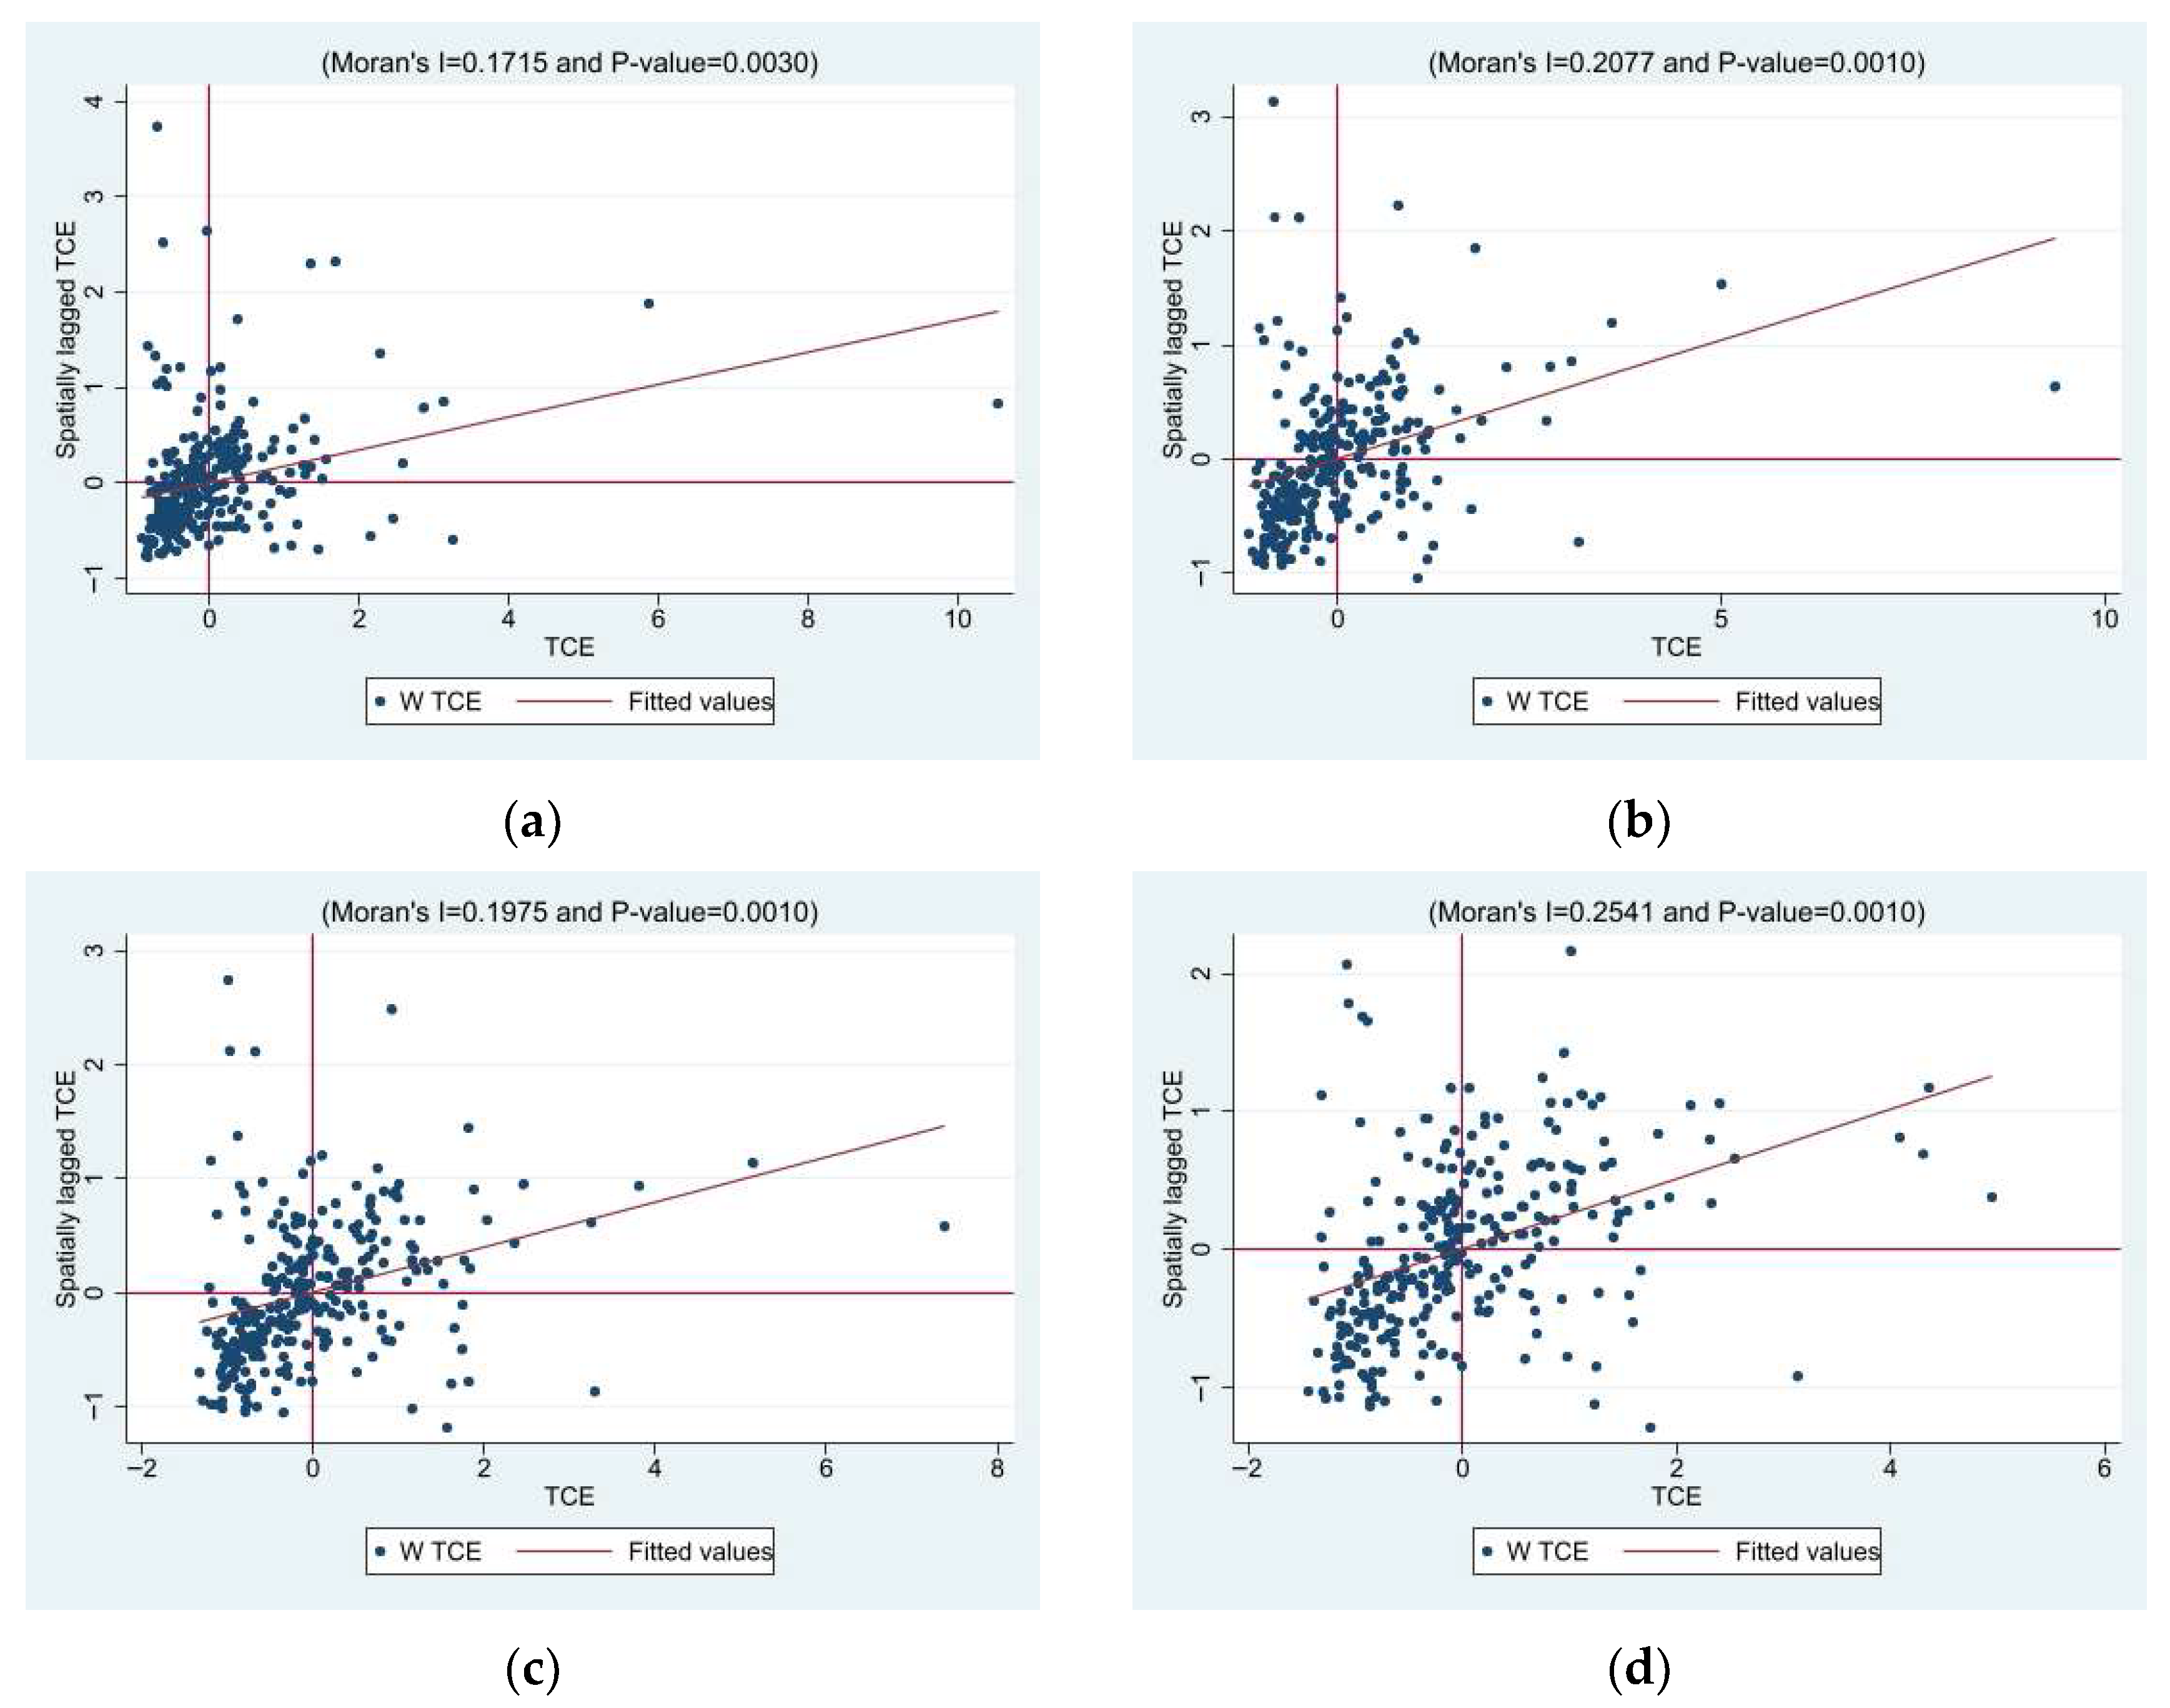
The spatial aggregation of transportation CO2 emissions in 284 cities across China from 2006 to 2020 was examined using Moran’s I index. As shown in Table 8, Moran’s I index is positive and passes the 1% significance level test, confirming the significant positive spatial correlation of transportation CO2 emissions in China, which can be used for the subsequent spatial econometric model applicability test. Meanwhile, Figure 7 shows the distribution of local Moran’s I, with the horizontal axis representing urban transportation CO2 emissions and the vertical axis representing their spatially lagged values. It can be clearly seen that the spatial dependence of urban transportation CO2 emissions has always existed, and most of the cities have clustering characteristics of ‘high–high’ and ‘low–low’.
Further testing and analysis are required to identify the most suitable spatial econometric model. The results of LM tests (Lagrange Multiplier tests), as shown in Table 9, demonstrate that the LM error and lag tests and the robust LM error and robust LM lag tests reject the original hypothesis at the 1% level. This reveals that spatial substantial correlation and spatial perturbation coexist, i.e., the use of SDM to estimate urban transportation CO2 emissions is better than SEM and SAR. Moreover, LR tests (Likelihood Ratio tests), which determine whether SDM degenerates into SEM and SAR, rejected the original hypothesis at a 1% significance level, suggesting that the SDM model is more appropriate. Furthermore, the Hausmann test results favour the fixed-effect model. Based on these findings, this paper employs fixed-effect SDM to further examine the spatial spillover effects of the LCCPP on transportation CO2 emissions.

5.2.2. Spatial Panel Regression Results

Table 10 presents the experimental findings concerning spatial impacts on transportation CO2 emissions by the LCCPP based on the SDM–DID model. The R2 and Sigma2 values of the SDM model are satisfactory, and DID coefficients at 1% level are significantly negative, which means that the transportation CO2 emission reduction by the LCCPP is obvious in the local area. In column 2, the coefficient of the spatial lag term WDID is −0.051 with significance at a 5% level, suggesting that the LCCPP exerts a notable spatial spillover effect toward reducing urban transportation CO2 emissions.
Comparing the regression coefficients of the base regression with those of the spatial Durbin regression coefficients, it can be found that ignoring the spatial spillover effect will underestimate the negative inhibitory impact of the policy to some degree. A possible explanation is that the policy’s effects stimulate transportation CO2 emission control measures in the region, where pilot cities can be regarded as the pioneer zones for CO2 emission control, under the incentive of a ‘demonstration effect’ [76]; the neighbouring cities will learn from their advanced management mode, which will promote the transportation CO2 emission reduction. Therefore, a comprehensive consideration of the spatial spillover effect of the LCCPP may improve the conclusions drawn from this study and draw them closer to the objective reality.
Because the estimated parameters of the SDM only explain the direct spatial effects of the LCCPP on transportation CO2 emissions, not the true partial regression coefficients, the marginal effects cannot be judged. Therefore, it is necessary to further decompose the policy’s effects into the direct, indirect, and total effects by utilising the partial differential decomposition method. Columns 5–7 in Table 10 present the detailed spatial estimation results.
First, in a spatial model, the estimated parameter of the direct effect is −0.065, and all of the results pass a 1% significance level test, which proves that the LCCPP at the city level exerts a significant suppression effect on transportation CO2 emissions. Second, the indirect effect reflects spatial spillover generated by the LCCPP on urban transportation CO2 emissions, and its coefficient is −0.131 and is significant at a 1% level, which proves that the LCCPP reduces the transportation CO2 emissions in the region and exerts a notable inhibitory effect on the transportation CO2 emission of the surrounding cities.

6. Conclusions and Policy Implications

Considering the LCCPP and transportation CO2 emissions in the same research framework, this paper uses 284 cities in China as its study object to examine the effects of the LCCP on urban transportation CO2 emissions. Relevant empirical tests are conducted through DID methods, and the following conclusions are drawn:
First, the baseline regression analysis and mechanism analysis findings show that the LCCP has directly and significantly promoted transportation CO2 emission reduction in cities, and the role of the LCCPP as a ‘booster’ of transportation CO2 emission reduction has been fully manifested. Second, the results of the indirect mechanism identification show that the LCCPP can effectively reduce CO2 emissions by upgrading public transportation levels and residents’ green mobility. However, green technological innovations in urban transportation, such as new energy vehicles (including battery electric, plug-in hybrid, and fuel cell vehicles), have not yet shown significant carbon reduction effects due to their higher costs and challenges in large-scale adoption. Therefore, the mechanism in Hypothesis 2 is partially verified. Third, the heterogeneity in the LCCPP is remarkable. Because of the higher public transportation level and green mobility penetration rate among residents in eastern cities, the negative LCCPP effects on transportation CO2 emissions are most obvious in eastern regions of China. Moreover, owing to lower emission baselines, higher policy sensitivity, favourable economic and geographic conditions, and less carbon-intensive logistics dependence, the policy is more effective in low-economy cities, southern cities, and non-resource-based cities. Finally, there are remarkable spatial spillover effects of the LCCPP on urban transportation CO2 emission control. Ignoring spatial spillover effects will to some extent underestimate the suppression of transportation CO2 emissions by the policy, as the contribution of the indirect effects to the total effect is higher than that of the direct effects, confirming that the LCCPP not only decreases transportation CO2 emissions in its local settings but also produces a radiation effect and a penetrating effect on CO2 emission control in other surrounding areas. Thus Hypothesis 3 is confirmed. Based on these conclusions, we suggest several policy implications.
(1)
We support the strong evidence that the LCCP can restrain transportation CO2 emissions. Local governments can apply this policy to reduce transportation CO2 emissions. Therefore, according to the overall concept of ‘expanding point by point,’ the carbon emission reduction experiences of pilot cities can be organised on a regular basis so as to form a replicable and effective model to facilitate the widespread promotion of low-carbon cities.
(2)
The results of the indirect mechanism identification show that the LCCPP can reduce transportation CO2 emissions through the improvement of urban public transportation levels and the popularisation of green mobility among residents. Therefore, more focus should be placed on improving urban public transportation levels in the construction of low-carbon cities and further increasing the incentives for low-carbon travel, such as the provision of subsidies and the construction of green transportation infrastructure. Simultaneously, it will be essential for governments and communities to enhance promotion and guidance to elevate the residents’ consciousness and sense of responsibility for low-carbon travel. In addition, the promotion and localised application of new energy vehicles should be strengthened to compensate for the lack of effectiveness of technological innovations at the city level.
(3)
The findings of the heterogeneity analysis indicate that the effectiveness of the LCCP toward lowering transportation CO2 emissions varies across different regions, with ineffective performance in central and high-economy cities and lower mitigation effects in northern and resource-based cities than in southern and non-resource-based cities. Therefore, authorities should prioritise these cities, scrutinise the reasons behind the LCCPP’s ineffectiveness and enhance policy supervision. Differentiated policy measures should be implemented, avoiding a uniform approach, and instead, tailored policy implementation plans should be developed that align with the specific characteristics of each city.
(4)
Finally, because there are obvious spatial spillover effects on transportation CO2 emission reduction when using the LCCPP, a cross-regional management coordination mechanism should be established based on the LCCPP to enhance interregional collaboration. Nonpilot cities should actively learn from the transportation management experience of pilot cities to reduce local transportation CO2 emissions.

7. Discussion

Although this study provides robust evidence that the Low-Carbon City Pilot Policy (LCCPP) significantly reduces carbon emissions from the transport sector, several limitations should be acknowledged. First, the carbon emission data used are derived from sectoral energy consumption and do not account for the full life-cycle emissions (LCA) associated with transport infrastructure, such as vehicle manufacturing, road construction, and maintenance. Future research could integrate LCA data to capture embodied emissions and improve the comprehensiveness of the assessment. Moreover, this study faces several other limitations. Potential interactions with concurrent environmental policies (e.g., carbon trading pilots, fuel standards, or new-energy vehicle subsidies) may partially affect the estimated effects. In addition, due to data availability, this study covers the period up to 2020, which may constrain the assessment of long-term policy impacts. Compared with previous research that generally finds technological innovation to be an effective driver of overall urban carbon reduction, our results suggest that such innovation has not yet played a significant role in reducing transportation-related CO2 emissions. This difference may be related to the relatively high costs, limited charging and supporting infrastructure, and the slow market penetration of new energy vehicles during the study period. As data on technological diffusion and policy performance continue to improve, future studies could update the dataset and conduct further empirical investigations to verify and extend this finding, while also employing micro-level travel or firm data to better capture spillover effects and long-term policy implications.

Author Contributions

Conceptualization, C.Y. and H.W.; Methodology, X.M. and Y.G.; Software, N.M.; Validation, N.M. and J.Z.; Formal analysis, Y.G.; Investigation, J.Z. and B.T.; Resources, H.W.; Data curation, X.M.; Writing—original draft preparation, B.T.; Writing—review and editing, B.T. and C.Y.; Visualisation, B.T.; Supervision, C.Y.; Project administration, C.Y.; Funding acquisition, C.Y. All authors have read and agreed to the published version of the manuscript.

Funding

This research was funded by the Natural Science Basic Research Plan in Shaanxi Province of China (grant No. 2021JC-27), the Shaanxi Provincial Key Science and Technology Innovation Group (grant No. 2023-CX-TD-11), the Key Research and Development Program of the Ministry of Science and Technology of China (grant No. 2020YFC1512004), the Ministry of Education of Humanities and Social Science Project (grant No. 24YJAZH208), the National Natural Science Foundation of China (grant No. 52102374), the Xi’an Municipal Bureau of Science and Technology Program Projects—Soft Subjects General Project (grant No. 25RKYJ0070), and the China Postdoctoral Science Foundation (grant No. 2025M771625), the Science and Technology Project of Shaanxi Provincial Department of Transportation in 2023 (grant No. 23-08R).

Institutional Review Board Statement

Not applicable.

Informed Consent Statement

Not applicable.

Data Availability Statement

The raw data supporting the conclusions of this article will be made available by the authors on request.

Conflicts of Interest

The authors declare no conflicts of interest.

Appendix A

Table A1. Test for the mediation mechanism.
(1)(2)(3)(4)(5)(6)(7)(8)(9)
PUTGRTREG
VariableslnCO2lnPUTlnCO2lnCO2lnGRTlnCO2lnCO2lnREGlnCO2
−0.023 *** −0.011 0.010 ***
(0.005) (0.018) (0.004)
did−0.055 ***0.072 ***−0.053 ***−0.055 ***0.020−0.055 ***−0.055 ***0.036 ***−0.056 ***
(0.006)(0.024)(0.006)(0.006)(0.024)(0.006)(0.006)(0.019)(0.006)
lnx10.198 ***−0.0230.198 ***0.198 ***0.0280.198 ***0.198 ***0.446 ***0.170 ***
(0.014)(0.046)(0.014)(0.014)(0.049)(0.014)(0.014)(0.055)(0.014)
lnx20.186 ***−0.0480.184 ***0.186 ***−0.836 ***0.178 ***0.186 ***1.459 ***0.156 ***
(0.028)(0.121)(0.028)(0.028)(0.109)(0.029)(0.028)(0.128)(0.028)
lnx30.0080.0360.0090.008−0.139 **0.0070.0080.060*−0.004
(0.018)(0.067)(0.018)(0.018)(0.070)(0.018)(0.018)(0.032)(0.007)
lnx40.001−0.076 ***−0.0010.0010.0570.0010.001−0.0470.002
(0.005)(0.024)(0.005)(0.005)(0.037)(0.005)(0.005)(0.052)(0.005)
lnx50.037 ***0.150 ***0.041 ***0.037 ***−0.104 **0.036 ***0.037 ***0.301 **0.165 ***
(0.010)(0.037)(0.010)(0.010)(0.052)(0.010)(0.010)(0.126)(0.041)
lnx60.015 **0.065 **0.017 ***0.015 **−0.0660.015 **0.015 **0.114 ***0.019 ***
(0.006)(0.033)(0.006)(0.006)(0.044)(0.006)(0.006)(0.032)(0.006)
lnx70.006 ***0.020 **0.006 ***0.006 ***0.017 *0.006 ***0.006 ***−0.0100.005 ***
(0.002)(0.008)(0.002)(0.002)(0.009)(0.002)(0.002)(0.008)(0.002)
lnx80.0030.030 *0.0040.003−0.0050.0030.0030.0130.010 **
(0.004)(0.017)(0.004)(0.004)(0.019)(0.004)(0.004)(0.016)(0.004)
Constant3.775 ***−5.714 ***3.643 ***3.775 ***8.301 ***3.854 ***3.775 ***−7.187 ***3.291 ***
(0.193)(0.796)(0.190)(0.193)(0.700)(0.203)(0.193)(0.924)(0.250)
Observations425242524252426042604260426042604260
R-squared0.9900.8410.9900.9900.6260.9900.9900.9530.990
Year fixYesYesYesYesYesYesYesYesYes
City fixYesYesYesYesYesYesYesYesYes
Notes: *** p < 0.01, ** p < 0.05, * p < 0.1.

References

  1. Xu, B.; Lin, B. Factors affecting carbon dioxide (CO2) emissions in China’s transport sector: A dynamic nonparametric additive regression model. J. Clean. Prod. 2015, 101, 311–322. [Google Scholar] [CrossRef]
  2. López, L.R.; Dessì, P.; Cabrera-Codony, A.; Rocha-Melogno, L.; Kraakman, B.; Naddeo, V.; Balaguer, M.D.; Puig, S. CO2 in indoor environments: From environmental and health risk to potential renewablcarbon source. Sci. Total Environ. 2023, 856, 159088. [Google Scholar] [CrossRef] [PubMed]
  3. IEA (International Energy Agency). World Energy Outlook 2021. Available online: https://www.iea.org/reports/world-energy-outlook-2021 (accessed on 3 November 2025).
  4. Bai, C.; Chen, Z.; Wang, D. Transportation carbon emission reduction potential and mitigation strategy in China. Sci. Total Environ. 2023, 873, 162074. [Google Scholar] [CrossRef] [PubMed]
  5. Xie, X.; Zhong, Y.; Li, S.; Gou, Z. Pathways for reducing carbon emissions in county-level transportation: A life cycle perspective and multi-scenario analysis. Energy Strategy Rev. 2025, 58, 101678. [Google Scholar] [CrossRef]
  6. Yao, L.; Chen, W. Temporal and spatial evolution of low-carbon transportation efficiency and its influencing factors in China. Energy 2025, 315, 134357. [Google Scholar] [CrossRef]
  7. Li, H.; Wang, J.; Yang, X.; Wang, Y.; Wu, T. A holistic overview of the progress of China’s low-carbon city pilots. Sustain. Cities Soc. 2018, 42, 289–300. [Google Scholar] [CrossRef]
  8. Wang, H.; Zhang, R. Effects of environmental regulation on CO2 emissions: An empirical analysis of 282 cities in China. Sustain. Prod. Consum. 2022, 29, 259–272. [Google Scholar] [CrossRef]
  9. Zhang, S.; Cheng, L.; Ren, Y.; Yao, Y. Effects of carbon emission trading system on corporate green total factor productivity: Does environmental regulation play a role of green blessing? Environ. Res. 2024, 248, 118295. [Google Scholar] [CrossRef]
  10. Jiang, N.; Huang, J. Can transparency governance promote interregional coordinated carbon emission reduction? A new perspective from China provincial transparency index. Energy Strategy Rev. 2025, 58, 101649. [Google Scholar] [CrossRef]
  11. Ouyang, W.; Zhou, Y.; Wang, Y. Can command-and-control regulation reduce carbon emissions? Evidence from China. Environ. Impact Assess. Rev. 2025, 112, 107802. [Google Scholar] [CrossRef]
  12. Yu, X.; Chen, N.; Li, M. Carbon emission characteristics and carbon emission reduction paths of low-carbon pilot cities in China. China Popul. Resour. Environ. 2020, 30, 1–9. [Google Scholar]
  13. Jia, L.; Zhang, J.; Li, R.; Wang, L.; Wu, H.; Wang, P. Spatial correlation investigation of carbon emission efficiency in the Yangtze River Delta of China: The role of low-carbon pilot cities. Ecol. Indic. 2025, 172, 113282. [Google Scholar] [CrossRef]
  14. Qiu, S.; Wang, Z.; Liu, S. The policy outcomes of low-carbon city construction on urban green development: Evidence from a quasi-natural experiment conducted in China. Sustain. Cities Soc. 2021, 66, 102699. [Google Scholar] [CrossRef]
  15. Li, W.; Zhang, Y.; Xu, J.; Fang, S.; Li, Q.; Gong, W.; Zhang, R. Evaluation for the effect of low-carbon city pilot policy: Evidence from industry in China. Environ. Sci. Pollut. Res. 2024, 31, 8863–8882. [Google Scholar] [CrossRef]
  16. Sun, L.; Luo, L.; Dong, C.; Hua, H.; Shi, R. Effects of China’s pilot low-carbon city policy on carbon emission reduction in the hotel industry: A quasi-natural experiment in tourism cities. Energy Rep. 2024, 11, 3037–3049. [Google Scholar] [CrossRef]
  17. Wang, K.; Guan, R.; Gan, C. Does low carbon pilot contribute to improving the carbon emission efficiency of tourism?—An empirical test based on double difference. Chin. J. Popul. Resour. Environ. 2023, 33, 47–56. [Google Scholar]
  18. Zhang, H.; Huang, L.; Zhu, Y.; Si, H.; He, X. Does low-carbon city construction improve total factor productivity? Evidence from a quasi-natural experiment in China. Int. J. Environ. Res. Public Health 2021, 18, 11974. [Google Scholar] [CrossRef]
  19. Cheng, J.; Yi, J.; Dai, S. Can low-carbon city construction facilitate green growth? Evidence from China’s pilot low-carbon city initiative. J. Clean. Prod. 2019, 231, 1158–1170. [Google Scholar] [CrossRef]
  20. Song, M.; Zhao, X.; Shang, Y. The impact of low-carbon city construction on ecological efficiency: Empirical evidence from quasi-natural experiments. Resour. Conserv. Recycl. 2020, 157, 104777. [Google Scholar] [CrossRef]
  21. Zou, C.; Huang, Y.; Wu, S.; Hu, S. Does “low-carbon city” accelerate urban innovation? Evidence from China. Sustain. Cities Soc. 2022, 83, 103954. [Google Scholar] [CrossRef]
  22. Song, Y.; He, Y.; Sahut, J.M.; Shah, S.H. Can low-carbon city pilot policy decrease urban energy poverty? Energy Policy 2024, 186, 113989. [Google Scholar] [CrossRef]
  23. Yang, Z.; Yuan, Y.; Tan, Y. The impact and nonlinear relationship of low-carbon city construction on air quality: Evidence from a quasi-natural experiment in China. J. Clean. Prod. 2023, 422, 138588. [Google Scholar] [CrossRef]
  24. Wan, G.; Zhang, W.; Li, C. How does low-carbon city pilot policy catalyze companies toward ESG practices? Evidence from China. Econ. Anal. Policy 2024, 81, 1593–1607. [Google Scholar] [CrossRef]
  25. Fu, L.; Zhao, H.; Ma, F.; Chen, J. Estimating heterogeneous effects of China’s low-carbon pilot city policy on urban employment. J. Clean. Prod. 2024, 434, 139882. [Google Scholar] [CrossRef]
  26. Liu, X.; Li, Y.; Chen, X.; Liu, J. Evaluation of low carbon city pilot policy effect on carbon abatement in China: An empirical evidence based on time-varying DID model. Cities 2022, 123, 103582. [Google Scholar] [CrossRef]
  27. Lyu, J.; Liu, T.; Cai, B.; Qi, Y.; Zhang, X. Heterogeneous effects of China’s low-carbon city pilots policy. J. Environ. Manag. 2023, 344, 118329. [Google Scholar] [CrossRef]
  28. Du, M.; Feng, R.; Chen, Z. Blue sky defense in low-carbon pilot cities: A spatial spillover perspective of carbon emission efficiency. Sci. Total Environ. 2022, 846, 157509. [Google Scholar] [CrossRef]
  29. Yu, Y.; Zhang, N. Low-carbon city pilot and carbon emission efficiency: Quasi-experimental evidence from China. Energy Econ. 2021, 96, 105125. [Google Scholar] [CrossRef]
  30. Liu, X.; Xu, H. Does low-carbon pilot city policy induce low-carbon choices in residents’ living: Holistic and single dual perspective. J. Environ. Manag. 2022, 324, 116353. [Google Scholar] [CrossRef]
  31. Li, J.; Tang, F.; Zhang, S.; Zhang, C. The effects of low-carbon city construction on bus trips. J. Public Transp. 2023, 25, 100057. [Google Scholar] [CrossRef]
  32. Liu, W.; Chen, Y.; Zhu, P.; Tong, J. Can carbon reduction policies promote sustainable construction development? Evidence from China’s green building market. PLoS ONE 2024, 19, e0303149. [Google Scholar] [CrossRef]
  33. Li, X.; Xing, H. Better cities better lives: How low-carbon city pilots can lower residents’ carbon emissions. J. Environ. Manag. 2024, 351, 119889. [Google Scholar] [CrossRef]
  34. Gao, Q.; Yan, T. Study on the impact of low-carbon pilot city construction on carbon emission reduction of trade and circulation industry under the background of “double cycle”. Commer. Econ. Res. 2024, 39, 11–14. [Google Scholar]
  35. Yu, Z.; Chen, L.; Tong, H.; Chen, L.; Zhang, T.; Li, L.; Yuan, L.; Xiao, J.; Wu, R.; Bai, L.; et al. Spatial correlations of land-use carbon emissions in the Yangtze River Delta region: A perspective from social network analysis. Ecol. Indic. 2022, 142, 109147. [Google Scholar] [CrossRef]
  36. Tang, Z.; Yu, H.; Zou, J. Neighbor impacts of environmental regulation: The case of low-carbon pilot program in China. Energy 2023, 276, 127509. [Google Scholar] [CrossRef]
  37. Cao, Y.; Ren, W.; Yue, L. Environmental regulation and carbon emissions: New mechanisms in game theory. Cities 2024, 149, 104945. [Google Scholar] [CrossRef]
  38. Zhao, X.; Zhu, J. Impacts of two-way foreign direct investment on carbon emissions: From the perspective of environmental regulation. Environ. Sci. Pollut. Res. 2022, 29, 52705–52723. [Google Scholar] [CrossRef]
  39. Sun, J. Can Green Transport Policy Drive Urban Carbon Emission Reduction? Evidence from Pilot Cities of China’s Low-Carbon Transportation System. Front. Environ. Sci. 2025, 13, 1660200. [Google Scholar] [CrossRef]
  40. Lu, X.; Lu, Z. How does green technology innovation affect urban carbon emissions? Evidence from Chinese cities. Energy Build. 2024, 325, 115025. [Google Scholar] [CrossRef]
  41. Wang, L.; Shao, J.; Ma, Y. Does China’s low-carbon city pilot policy improve energy efficiency? Energy 2023, 283, 129048. [Google Scholar] [CrossRef]
  42. Wang, X. How does low carbon city pilot affect urban green technology innovation?—Based on the synergy perspective of government intervention and public participation. J. Lanzhou Univ. 2022, 4, 41–53. [Google Scholar]
  43. Yu, H.; Peng, F.; Yuan, T.; Li, D.; Shi, D. The effect of low-carbon pilot policy on low-carbon technological innovation in China: Reexamining the porter hypothesis using difference-in-difference-in-differences strategy. J. Innov. Knowl. 2023, 8, 100392. [Google Scholar] [CrossRef]
  44. Liu, K.; Huang, T.; Xia, Z.; Xia, X.; Wu, R. The impact assessment of low-carbon city pilot policy on urban green innovation: A batch-time heterogeneity perspective. Appl. Energy 2025, 377, 124489. [Google Scholar] [CrossRef]
  45. Huang, H.; He, G.; Xiao, Y. Carbon emission reduction effects of pilot policies for low-carbon cities. Resour. Sci. 2023, 45, 1044–1058. [Google Scholar]
  46. Pamucar, D.; Deveci, M.; Canıtez, F.; Paksoy, T.; Lukovac, V. A novel methodology for prioritizing zero-carbon measures for sustainable transport. Sustain. Prod. Consum. 2021, 27, 1093–1112. [Google Scholar] [CrossRef]
  47. Wang, A.; Weichenthal, S.; Lloyd, M.; Kris, H.; Shoshanna, S.; Marianne, H. Personal mobility choices and disparities in carbon emissions. Environ. Sci. Technol. 2023, 57, 8548–8558. [Google Scholar] [CrossRef]
  48. Zong, F.; Zeng, M.; Li, Y.X. Congestion pricing for sustainable urban transportation systems considering carbon emissions and travel habits. Sustain. Cities Soc. 2024, 101, 105198. [Google Scholar] [CrossRef]
  49. Cai, B.; Geng, Y.; Yang, W.; Yan, P.; Chen, Q.; Li, D.; Cao, L. How scholars and the public perceive a “low carbon city” in China. J. Clean. Prod. 2017, 149, 502–510. [Google Scholar] [CrossRef]
  50. Zhao, Y.; Lu, X.; Wang, W. Synergistic effect analysis of CO2 and PM2.5 emission reduction in low carbon cities. China Environ. Sci. 2023, 325, 465–476. [Google Scholar]
  51. Li, S.; Wang, J. Low-carbon city pilot policies, residents’ low-carbon literacy and enterprises’ green technology innovation. China Popul.-Resour. Environ. 2023, 4, 93–103. [Google Scholar]
  52. Hou, M.; Cui, X.; Chu, L.; Wang, H.; Xi, Z.; Deng, Y. Nonlinear effects of environmental regulation on PM2. 5 and CO2 in China: Evidence from a quantile-on-quantile approach. Energy 2024, 292, 130456. [Google Scholar] [CrossRef]
  53. Jiang, B.; He, Z.; Xue, W.; Yang, C.; Zhu, H.; Hua, Y.; Lu, B. China’s low-carbon cities pilot promotes sustainable carbon emission reduction: Evidence from quasi-natural experiments. Sustainability 2022, 14, 8996. [Google Scholar] [CrossRef]
  54. Wen, S.; Liu, H. Research on energy conservation and carbon emission reduction effects and mechanism: Quasi-experimental evidence from China. Energy Policy 2022, 169, 113180. [Google Scholar] [CrossRef]
  55. Xu, P. The impact of heterogeneous environmental regulations on regional spatial differences in net carbon emissions. Environ. Sci. Pollut. Res. 2023, 30, 1413–1427. [Google Scholar] [CrossRef] [PubMed]
  56. Wen, Z.; Zhang, L.; Hou, J.; Liu, H. The mediation effect test program and its application. J. Psychol. 2004, 36, 614–620. [Google Scholar]
  57. Yuan, C.; Zhang, S.; Jiao, P. Research on the spatial and temporal changes of total factor carbon emission efficiency and influencing factors of provincial transportation in China. Resour. Sci. 2017, 39, 687–697. [Google Scholar]
  58. Yang, W.; Wang, W.; Ouyang, S. The influencing factors and spatial spillover effects of CO2 emissions from transportation in China. Sci. Total Environ. 2019, 696, 133900. [Google Scholar] [CrossRef]
  59. Jung, M.C.; Kang, M.; Kim, S. Does polycentric development produce less transportation carbon emissions? Evidence from urban form identified by night-time lights across US metropolitan areas. Urban Clim. 2022, 44, 101223. [Google Scholar] [CrossRef]
  60. Zhao, P.; Tian, B.S.; Yang, Q.; Zhang, S. Influencing factors and their spatial–temporal heterogeneity of urban transport carbon emissions in China. Energies 2024, 17, 756. [Google Scholar] [CrossRef]
  61. Gehrsitz, M. The effect of low emission zones on air pollution and infant health. J. Environ. Econ. Manag. 2017, 83, 121–144. [Google Scholar] [CrossRef]
  62. Liddle, B. Urban transport pollution: Revisiting the environmental Kuznets curve. Int. J. Sustain. Transp. 2015, 9, 502–508. [Google Scholar] [CrossRef]
  63. Liu, F. The impact of China’s low-carbon city pilot policy on carbon emissions: Based on the multi-period DID model. Environ. Sci. Pollut. Res. 2023, 30, 81745–81759. [Google Scholar] [CrossRef] [PubMed]
  64. Xiao, R.; Ma, B.; Qian, L.; Shen, J. The impact of pilot policies of low-carbon cities on corporate green innovation and its mechanism of action. China Popul. Resour. Environ. 2023, 33, 125–137. [Google Scholar]
  65. Wang, C.T. Progressive Regression Analysis; Higher Education Press: Beijing, China, 2017. [Google Scholar]
  66. Chen, Q. Advanced Econometrics and Stata Applications; Higher Education Press: Beijing, China, 2014. [Google Scholar]
  67. Dai, Q.; Hao, W.; Cheng, Z.; Qiu, W. Has environmental regulation policy driven the real economy to “de-realization”? A quasi-natural experiment based on China’s carbon emissions trading pilot. J. Nat. Resour. 2024, 39, 1320–1340. [Google Scholar]
  68. Lim, J.; Kang, M.; Jung, C. Effect of national-level spatial distribution of cities on national transport CO2 emissions. Environ. Impact Assess. Rev. 2019, 77, 162–173. [Google Scholar] [CrossRef]
  69. Wen, S.; Jia, Z.; Chen, X. Can low-carbon city pilot policies significantly improve carbon emission efficiency? Empirical evidence from China. J. Clean. Prod. 2022, 346, 131131. [Google Scholar] [CrossRef]
  70. Huang, H.; Yi, M. Impacts and mechanisms of heterogeneous environmental regulations on carbon emissions: An empirical research based on DID method. Environ. Impact Assess. Rev. 2023, 99, 107039. [Google Scholar] [CrossRef]
  71. Zhang, H. Can pilot policies for low-carbon cities reduce carbon emissions?—Evidence from a quasi-natural experiment. Econ. Manag. 2020, 42, 25–41. [Google Scholar]
  72. Dong, Z.; Wu, Y.; Xu, Y. The increasing climate inequalities of urban carbon emissions: The distributional effect of low-carbon city pilot policy. Urban. Clim. 2023, 52, 101718. [Google Scholar] [CrossRef]
  73. Pan, A.; Zhang, W.; Shi, X.; Dai, L. Climate policy and low-carbon innovation: Evidence from low-carbon city pilots in China. Energy Econ. 2022, 112, 106129. [Google Scholar] [CrossRef]
  74. Lu, H.; Xiao, C.; Jiao, L.; Du, X.; Huang, A. Spatial-temporal evolution analysis of the impact of smart transportation policies on urban carbon emissions. Sustain. Cities Soc. 2024, 101, 105177. [Google Scholar] [CrossRef]
  75. Anselin, L.; Bera, A.K. Spatial dependence in linear regression models with an introduction to spatial econometrics. Stat. Textb. Monogr. 1998, 155, 237–290. [Google Scholar]
  76. Guo, L.; Liang, X. Research on the impact of carbon emissions trading policy on carbon emissions efficiency—An analysis based on spatial multi-period double difference model. Price Theory Pract. 2023, 39, 146–150+209. [Google Scholar]
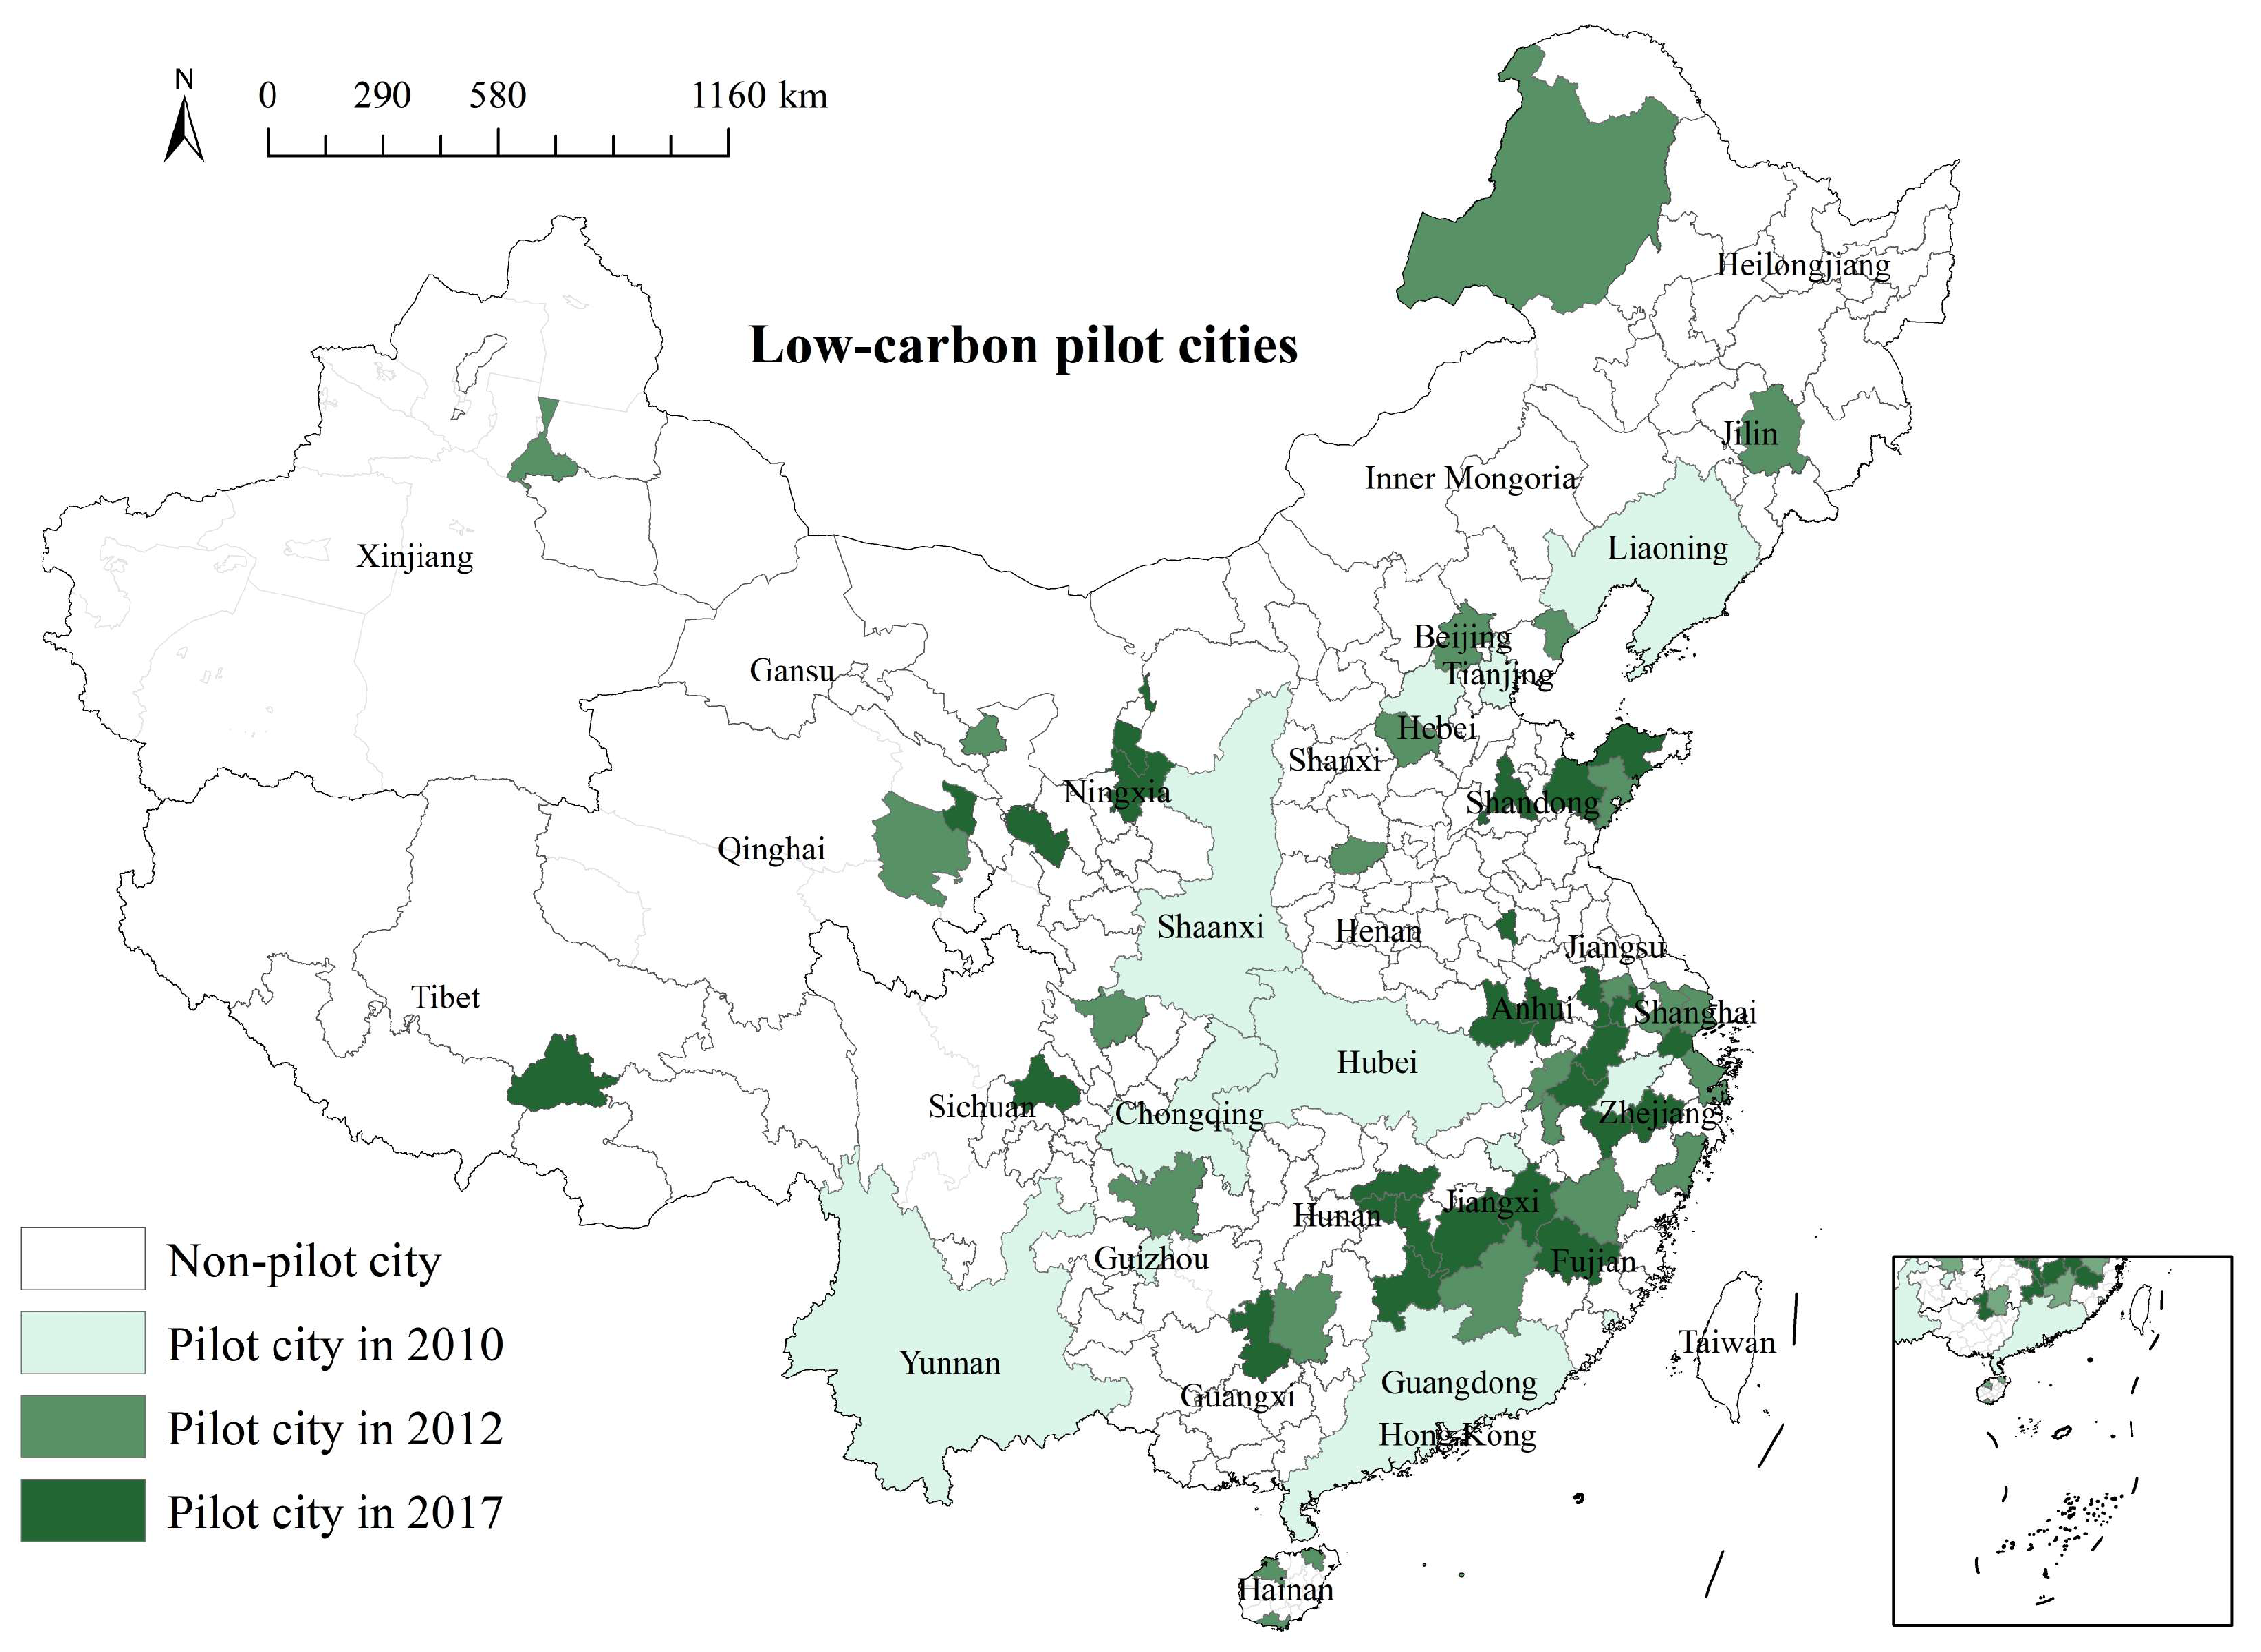
Figure 1. Location of pilot cities.
Sustainability 17 09901 g001
Figure 2. The content framework.
Sustainability 17 09901 g002
Figure 3. Parallel trend test.
Sustainability 17 09901 g003
Figure 4. Mechanism analysis. (a) Effects of baseline regression modelling. (b) Mediating effects of public transportation levels. (c) Mediating effects of green technology innovation. (d) Mediating effects of residents’ green mobility.
Sustainability 17 09901 g004
Figure 5. Placebo test.
Sustainability 17 09901 g005
Figure 6. Standardised deviation of control variables before and after matching.
Sustainability 17 09901 g006
Figure 7. Correlation test. (a) The Moran scatterplot of TCE in 2006; (b) The Moran scatterplot of TCE in 2010; (c) The Moran scatterplot of TCE in 2015; (d) The Moran scatterplot of TCE in 2020.
Sustainability 17 09901 g007
Table 1. Definition of variables.
VariableDefinition or MeasurementUnit
Urban transportation carbon emission (TCE)CO2 emission of urban transportation industry measured by MEIC modelTons
Difference-in-Difference (DID)The cross-multiplier of the two variables Treated and Period/
Economic development (ECO)GDP per capita (GDP divided by the total population)CNY per 10,000 people
Population (POP)Total urban population at the end of year.10,000 people
Industrial structure (INS)Proportion of the tertiary industry GDP/GDP./
Consumption Level (CON)Total retail sales of consumer goods/GDP/
Urban density (URD)Urban total population/built-up area.10,000 people per km2
Infrastructure level (INF)Urban road area.10,000 square metres
Foreign investment level (FOI)Overseas foreign direct investment/GDPTen thousand passengers per car
Environmental pollution index (EPI)Calculated by entropy method (including industrial SO2 emissions, industrial wastewater emissions, industrial solid waste emissions)/
Public transportation levels (PUT)Public buses/Private car ownership./
Green technology innovations (GRT)Number of green patent applications.Pieces
Resident’s green mobility (REG)Public transportation ridership10,000 people
Table 2. Descriptive statistics.
Variables SetVariablesObservationMeanStandard DeviationMinimumMaximum
Dependent variablesCO24260254.7268.68.9722196
Independent variablesDID42600.2250.41701
Control variablesECO42604.8365.0010.27650.63
POP4260440.7313.416.413416
INS426039.9010.058.58083.87
CON42600.3670.1073.11 × 10−50.996
URD42600.3540.4250.0228.749
INF4260181624831431,012
FOI42600.01900.02391.77 × 10−60.390
EPI42600.08970.08900.0010.939
Mediating variablesPUT42600.005120.006837.00 × 10−50.105
GRT4260250.7797.2212,534
REG426020,47343,29018516,517
Table 3. Test for multicollinearity.
ECOPOPINSCONURDINFFOIEPI
Tolerance0.3310.1860.6830.7080.1750.1430.8560.753
Variance inflation factor (VIF)3.0205.3701.4601.4105.7206.9701.1701.330
Note: Tolerances less than 0.1 and variance inflation factor values greater than 10 indicate possible multicollinearity.
Table 4. The DID regression results.
Variables(1)(2)
CO2CO2
DID−0.048 ***−0.055 ***
(0.013)(0.012)
ECO 0.198 ***
(0.023)
POP 0.186 ***
(0.057)
INS 0.008
(0.032)
CON 0.001
(0.007)
URD 0.037 **
(0.018)
INF 0.015
(0.010)
FOI 0.006 *
(0.003)
EPI 0.003
(0.008)
Constant4.690 ***3.775 ***
(0.012)(0.373)
Observations42604260
R-squared0.8230.990
Year fixYesYes
City fixYesYes
Notes: Robust standard errors in parentheses, *** p < 0.01, ** p < 0.05, * p < 0.1.
Table 5. Robustness tests.
(1)(2)(3)
VariablesNearest Neighbour MatchingRadius MatchingNuclear Matching
CO2CO2CO2
DID−0.030 ***−0.054 ***−0.053 ***
(0.009)(0.006)(0.006)
CTPP
Control variablesYesYesYes
Constant3.917 ***3.858 ***3.865 ***
(0.213)(0.198)(0.198)
Observations184342534248
R-squared0.9970.9900.990
Year fixYesYesYes
City fixYesYesYes
Notes: *** p < 0.01.
Table 6. Heterogeneity regression.
Variables(1)(2)(3)(4)(5)
EastCentralWestNorthSouth
CO2CO2CO2CO2CO2
DID−0.076 ***−0.008−0.065 ***−0.017 *−0.085 ***
(0.008)(0.010)(0.010)(0.009)(0.007)
Control variablesYesYesYesYesYes
Constant4.672 ***3.734 ***3.734 ***3.064 ***4.086 ***
(0.348)(0.212)(0.212)(0.273)(0.255)
Observations15001500126019502310
R-squared0.8750.8650.8650.8180.874
Number of cities10010084130154
Year fixYesYesYesYesYes
City fixYesYesYesYesYes
Notes: *** p < 0.01, * p < 0.1.
Table 7. Heterogeneous results based on city type.
Variables(1)(2)(3)(4)
High-Economy CitiesLow-Economy CitiesResource-Based CitiesNon-Resource-Based Cities
CO2CO2CO2CO2
DID−0.039−0.147 **−0.029 ***−0.064 ***
(0.079)(0.066)(0.010)(0.007)
Control variablesYesYesYesYes
Constant−1.832 *0.9803.022 ***3.966 ***
(1.016)(1.132)(0.240)(0.232)
Number of cities99185113171
R-squared0.8880.6620.8480.848
Year fixYesYesYesYes
City fixYesYesYesYes
Notes: *** p < 0.01, ** p < 0.05, * p < 0.1.
Table 8. Results of Moran’s I index measurement.
YearMoran’s IE (I)SD (I)Z-Statisticp-Value
20060.180 ***−0.0040.0345.4260.000
20070.177 ***−0.0040.0345.3170.000
20080.172 ***−0.0040.0345.1710.001
20090.193 ***−0.0040.0345.7430.000
20100.212 ***−0.0040.0346.3120.000
20110.219 ***−0.0040.0346.4680.000
20120.223 ***−0.0040.0356.5600.000
20130.226 ***−0.0040.0356.6170.000
20140.214 ***−0.0040.0356.2170.000
20150.206 ***−0.0040.0356.0550.000
20160.211 ***−0.0040.0356.1850.000
20170.211 ***−0.0040.0356.1810.000
20180.209 ***−0.0040.0356.1090.000
20190.207 ***−0.0040.0356.0590.000
20200.211 ***−0.0040.0356.1810.000
Note: *** p < 0.01.
Table 9. LM and LR tests.
TestTest Statisticsp-Value
LM testLMSpatial error1738.7770 ***0.0000
Spatial lag145.2860 ***0.0000
Robust LMSpatial error1599.3900 ***0.0000
Spatial lag5.9000 ***0.0150
LR testH0: SAR model102.7500 ***0.0000
H0: SEM model169.7400 ***0.0000
Hausman testTest of H0: Difference in coefficients not systematic
chi2(8) = 80.19Prob >= chi2 = 0.0000
Note: *** p < 0.01.
Table 10. Spatial spillover effects of the LCCPP.
Variables(1)(2)(3)(4)(5)(6)(7)
MainWDIDSpatialVarianceDirect EffectIndirect EffectTotal Effect
CO2CO2CO2CO2CO2CO2CO2
DID−0.059 ***−0.051 ** −0.065 ***−0.131 ***−0.196 ***
(0.0162)(0.0253) (0.0161)(0.0378)(0.0377)
Control variablesYesYes YesYesYes
rho 0.453 ***
(0.0278)
sigma2_e 0.108 ***
(0.00257)
Observations4260426042604260426042604260
R-squared0.6830.6830.6830.6830.6830.6830.683
Year fixYesYesYesYesYesYesYes
City fixYesYesYesYesYesYesYes
Notes: *** p < 0.01, ** p < 0.05.
Disclaimer/Publisher’s Note: The statements, opinions and data contained in all publications are solely those of the individual author(s) and contributor(s) and not of MDPI and/or the editor(s). MDPI and/or the editor(s) disclaim responsibility for any injury to people or property resulting from any ideas, methods, instructions or products referred to in the content.