Article

Beaver Wetland Buffers as Ecosystem-Based Tools for Sustainable Water Management and Lead (Pb) Risk Control

Lithuanian Research Centre for Agriculture and Forestry, LT-58344 Akademija, Lithuania
*
Author to whom correspondence should be addressed.
Sustainability 2025, 17(21), 9892; https://doi.org/10.3390/su17219892
Submission received: 19 September 2025 / Revised: 27 October 2025 / Accepted: 30 October 2025 / Published: 6 November 2025
(This article belongs to the Section Sustainable Water Management)

Abstract

Beaver dam–pond systems reshape the hydrology of lowland landscapes by slowing water flow and trapping sediments, thereby reducing the movement of pollutants. This study examined how such beaver-engineered wetlands can naturally filter and signal contamination risks associated with lead (Pb). We combined data from three matrices—bottom sediments, riparian vegetation, and non-invasively collected beaver fur—across three Lithuanian sites (2022–2024). Previously published datasets on plants and sediments were complemented with new information from beaver fur to explore seasonal and age-related effects as well as differences inside and outside dam zones. Lead levels were consistently higher in sediments than in plants, while beaver fur reflected variable, site-specific exposures. These results show that beaver activity contributes to the capture and redistribution of sediment-bound Pb in wetland buffers. The approach demonstrates how beaver habitats can serve as low-cost, nature-based sentinels for pollutant monitoring. Using beaver fur as a non-invasive bioindicator and managing dam stability can improve the ecological and policy relevance of buffer zones. Overall, the findings support the integration of beaver-engineered wetlands into environmental management and EU water policy, contributing to SDG 6 goals for clean water and sustainable wetland use.

1. Introduction

Lead (Pb) remains a persistent contaminant in freshwater ecosystems due to both legacy industrial inputs and ongoing diffuse sources such as urban runoff, ammunition residues, and agricultural drainage [1,2,3]. Its strong affinity for fine particulates and organic matter promotes accumulation in low-energy sediments and wetland soils, where Pb can persist for decades and periodically remobilize under fluctuating redox conditions [4,5,6].
Numerous studies have documented how Pb retention and bioavailability depend on sediment composition, organic carbon content, and hydrological residence time—factors that are particularly pronounced in wetland systems [1,5]. These processes make Pb an informative tracer for evaluating the filtration and buffering capacity of wetland environments, including those modified by beaver activity.
This persistence of Pb contamination poses risks not only to ecosystem integrity but also to national compliance with European and international water-quality frameworks. In Lithuania, the implementation of the Sustainable Development Goal 6 (SDG 6) [7,8,9] and the EU Water Framework Directive (2000/60/EC) requires the development of cost-effective and integrative monitoring approaches capable of addressing diffuse pollution in both agricultural and forested catchments [10,11,12]. The recent REACH restriction on lead ammunition in and around wetlands (Annex XVII, entry 63; effective 2023) has direct implications for national hunting practices and wildlife exposure, making Pb a priority substance for environmental surveillance [13,14]. These policy changes, reinforced by Lithuania’s commitments under the Ramsar Convention, emphasize the need for nature-based and operational monitoring tools that extend beyond conventional chemical assessments. Within this framework, beaver-engineered wetlands provide an applied test case for integrating ecological processes with regulatory objectives, aligning local wetland management with the goals of the European Green Deal and the forthcoming Nature Restoration Law [15,16,17,18].
Among NBS, beaver-engineered wetlands have gained recognition as living infrastructures with the capacity to restructure hydroperiods, increase water residence time, and promote sediment and nutrient retention [19,20,21,22,23]. In addition to hydrological regulation, beaver dams promote contaminant retention through coupled physical and biogeochemical mechanisms. Slower flow enhances the settling of fine organo-mineral particles, while anoxic and organic-rich conditions behind dams increase Pb sorption to Fe/Mn (oxyhydr)oxides and humic matter, followed by burial within pond sediments and riparian soils. Together, these processes form a natural geochemical sink that attenuates downstream particulate Pb fluxes [19,20,21,22,23]. Unlike small anthropogenic dams, beaver structures are dynamic, permeable, and ecologically embedded, generating feedbacks that reduce flow velocity, attenuate flood peaks, and enhance vertical and lateral water exchange [24,25,26,27,28]. This hydrological reconfiguration translates into increased opportunities for contaminant sequestration and biodiversity support, distinguishing beaver complexes as multifunctional assets in freshwater management [28,29,30].
Lithuania hosts one of the densest populations of Eurasian beaver (Castor fiber L.) in Europe, exceeding 100,000 individuals and occupying nearly all major catchments [31,32,33,34]. The ubiquity of beaver ponds and dams across forested and agricultural landscapes creates a policy-relevant setting to assess their potential role in sustainable water management. Previous studies in Lithuania demonstrated Pb accumulation in vegetation and sediments of wetland buffer zones [35,36], while international evidence confirms the ability of beaver impoundments to retain sediments, mitigate diffuse pollution, and regulate water flows [21,24,28,37]. Yet, the integration of biotic and abiotic matrices for operational monitoring within beaver systems remains underexplored.
Here, we build on earlier studies of vegetation and sediments in Lithuania [35,36] and extend the framework by incorporating non-invasive beaver fur sampling as a novel bioindicator. By aligning these three matrices—sediments, vegetation, and fur—we aim to evaluate spatiotemporal patterns of Pb exposure in wetlands modified by beaver engineering. This applied framing supports policy-relevant design of wetland buffers by leveraging beaver structures as sentinels for particulate Pb, using fur as a complementary non-invasive bioindicator, and managing buffer zones to maintain dam stability while complying with EU restrictions on lead in wetlands.
Specifically, we tested three related hypotheses: beaver impoundments enhance the retention and detectability of sediment-bound Pb compared with adjacent downstream or parallel sites; riparian vegetation provides a consistent indicator of background Pb levels along buffer transects; and non-invasively collected beaver fur reflects seasonal and regional exposure patterns that complement abiotic evidence.Beyond scientific insights, this cross-matrix approach provides operational cues for buffer-zone management, policy uptake of Pb restrictions, and integration of beaver wetlands as cost-effective NBS for water quality governance.

2. Materials and Methods

This study was conducted as part of the applied research project “Bioindicational Role of Beavers in the Assessment of Pollution in Forest Wetland Buffer Zones” (2022–2024), carried out by the Lithuanian Research Centre for Agriculture and Forestry (LAMMC) and funded by the Lithuanian Ministry of Environment [35]. The methodology was adapted from the project’s technical specification and field protocols, with adjustments to ensure consistency with international ecotoxicological monitoring standards.

2.1. Study Area

The study was conducted at three representative lowland localities in Lithuania where beaver-modified wetland buffers are integrated into mixed forest and agricultural landscapes (Figure 1).
Zone 1M (Žemaitija National Park) in western Lithuania represents a near-reference condition with minimal anthropogenic pressure. The site features undulating glacial terrain and oligotrophic soils (sandy loams, podzols) supporting natural streams and small ponds within coniferous–deciduous forest.
Zone 2K (Kretinga District) lies in an agricultural area influenced by drainage canals and historical peat extraction. Beaver dams and ponds intercept field runoff along small tributaries, forming sediment-rich belts with mixed herbaceous and shrub vegetation. Soils are gleyic and organic, typical of reclaimed lowlands.
Zone 3G (Kauno Marios vicinity) represents a mosaic of forest edges, wetlands, and artificial reservoirs affected by recreation and forestry. The terrain includes slopes of fluvioglacial origin with loamy and alluvial soils. Beavers here modify side gullies of inflow streams, creating chains of ponds that act as transitional filters between upland catchments and the reservoir.
Together, these zones reflect a west–east gradient of hydrological and land-use settings, allowing comparison between near-natural and human-pressured systems while capturing Lithuania’s main soil and vegetation types relevant to wetland buffer management.
Sampling transects and georeferenced points were established in each site (n = 9, three per region), with systematic coverage of beaver-inhabited buffer zones. Geographic coordinates (WGS84, EPSG:4326) and site metadata are available in Supplementary Data S1.

2.2. Beaver Population Surveys and Habitat Characterization

Beaver populations were monitored annually (2022–2024) using lodge and dam mapping, feeding trace counts, and transect-based surveys. Social structure was assessed by classifying colonies into solitary individuals, pairs, medium families (3–5 individuals), and large families (≥6 individuals). Indicators included the number and diameter of gnawed trees, the density of trails, and the number of burrow entrances.
Across all zones, a total of 371 individuals were recorded. Zone 1M maintained stable family groups; Zone 2K exhibited high density but 10–27% lodge abandonment due to anthropogenic disturbance; Zone 3G showed seasonal colony turnover, with solitary and juvenile lodges more frequent.
Habitats were described as forest–meadow–aquatic ecotones, where beaver engineering activity (dam construction, canal digging, vegetation cutting) generated microhabitat diversity. Vegetation surveys within 50 m buffer transects recorded species composition and availability of preferred forage (Salix spp., Populus tremula, Alnus spp., Betula pendula), providing context for Pb accumulation in plant tissues.

2.3. Sampling

Sampling targeted three environmental matrices: vegetation, sediments, and beaver fur. Vegetation samples were collected along permanent 50 m transects laid perpendicular to the waterline. At nine sites (three per zone), plants were sampled every 10 m from the shoreline, covering distances from 10 to 50 m. Only parts relevant to beaver foraging—leaves, shoots, bark and needles—were included. The species composition reflected the principal food base of local beaver populations and included willows (Salix spp.), aspen (Populus tremula), alder buckthorn (Frangula alnus), alder (Alnus spp.), lime (Tilia cordata), Norway spruce (Picea abies) and several herbaceous taxa such as Agrostis spp. and Achillea millefolium. Each composite sample comprised roughly 200–300 g of biomass. Across all zones and sampling campaigns, 210 vegetation samples were collected [36].
Sediment samples were taken from the same transects using a stainless steel vacuum borer (63 mm diameter). At each site, material was collected from five points: two from the body of the beaver dam, two upstream or along its edge, and one from the pond centre. Samples were sealed in sterile containers and frozen at −18 °C until further analysis. In total, 210 sediment samples were obtained; the slightly uneven number reflects the absence of an autumn campaign in zone3G in 2023 [35].
Beaver fur was collected by a non-invasive method using galvanized spiral wires attached to wooden stakes placed on scent-marking trails and frequently used beaver paths. As animals passed, tufts of guard hair were caught naturally on the wire. The wires were checked every one to two weeks, and the retrieved fur was stored in labelled paper envelopes. Samples were sorted by season (spring: March–August; autumn: September–February) and age class, and those weighing less than 0.3 g were excluded. A total of 97 fur samples were collected; Pb concentrations were determined for 91 samples, while the remaining entries were missing or below detection.

2.4. Sample Preparation and Analysis

Plant, sediment, and fur samples were collected systematically at nine georeferenced sites (three per region: A–C).
Vegetation: Samples (200–300 g per point) were collected seasonally along 50 m transects established perpendicular to the water edge. Material was taken at fixed distances from the shoreline (10, 20, 30, 40, and 50 m), targeting woody and herbaceous species representative of the beaver diet (e.g., Salix spp., Populus tremula, Alnus spp., Betula pendula, Piceaabies) [38].
Sediments: At each site, five surface cores (0–5 cm) were collected following a standardized dam-relative design. Two replicates were taken inside the beaver impoundment (points 1 and 2), while three replicates were taken outside the dam: one directly downstream (point 3) and two parallel to the dam body (points 4 and 5). This stratification allowed the comparison of Pb accumulation between ponded and free-flowing hydrological conditions [38].
Fur: Non-invasive sampling was carried out with spiny hair traps installed 1–2 m from the water’s edge at 25 cm above ground, near active lodges. Traps were checked weekly, and fur samples were pooled per site and season. Collection was conducted under authorization of the Environmental Protection Agency of the Republic of Lithuania (Permit No. VSP-2022-7-SBMŪRP) [35].
All samples were acid-digested following the US EPA Method 3050B [39] prior to Pb determination by flame atomic absorption spectrophotometry (FAAS) [40].

2.5. Quality Assurance and Quality Control (QA/QC)

All analytical procedures followed international standards of quality assurance and quality control. Each digestion batch included reagent blanks, certified reference materials (CRMs), and matrix spikes, representing at least 10% of total samples [41]. Method accuracy was verified against CRMs (NIST 1573a—Tomato Leaves; IAEA-433—Marine Sediment), yielding recoveries from 92% to 108%. Procedural blanks remained consistently below detection limits. Duplicate analyses were performed for every tenth sample, with relative standard deviations (RSD) < 8%.
Limits of detection (LOD) and quantification (LOQ) were established according to IUPAC conventions [41], calculated as 3σ and 10σ of blank signals, respectively. Matrix-specific limits were derived by propagating solution-level values to sample mass, resulting in (µg g−1 DW): plants 1.46/4.88; sediments 6.24/20.8; fur 3.77/12.6.
Calibration curves for Pb were linear (R > 0.999) within the range 0–4 mg L−1, which fully covered the concentration levels of analyzed digests. Carry-over was negligible, and verification standards remained within ±5% of target values. Batch-level statistics for blanks, calibration slopes, and precision metrics are provided in Supplementary Tables S1–S3.
These QA/QC results confirm the reliability and reproducibility of Pb determinations across matrices and ensure data comparability with previously published datasets.

2.6. Statistical Analysis

For descriptive summaries, values below the LOD were treated according to matrix-specific data structure. In sediments and vegetation, where <20% of values were below LOD, non-detects were replaced by LOD/2, while values between the LOD and LOQ were retained as measured. In fur samples, where 63% of values were below LOD (0.05 µg g−1), this substitution was not applied; instead, the dataset was analyzed as left-censored using the Kaplan–Meier estimator for summary statistics and Fisher’s exact test for detection frequencies. This approach follows IUPAC and USEPA conventions and preserves statistical validity under censored conditions [41].
Data distribution was assessed using the Shapiro–Wilk test for normality and Levene’s test for homogeneity of variances [42]. Because Pb concentrations in all matrices deviated significantly from normality (p < 0.05) and showed heteroscedasticity, non-parametric tests were applied as robust alternatives to ANOVA. Group differences among three or more factors were evaluated with the Kruskal–Wallis test followed by Holm-adjusted pairwise Mann–Whitney U comparisons. Two-group contrasts were analyzed using the Mann–Whitney U test, with effect sizes expressed as Cliff’s δ and rank-biserial correlations accompanied by 95% bias-corrected and accelerated (BCa) bootstrap confidence intervals (10,000 resamples) [43].
Spatial gradients across 10–50 m transects were examined using the Jonckheere–Terpstra trend test and confirmed with median quantile regression (τ = 0.5) for robustness. Correlations among matrices were evaluated using Spearman’s ρ and Kendall’s τ-b as primary measures; Pearson’s r was reported for normally distributed aggregated data.
All computations were conducted in Python 3.11 using pandas, SciPy, and statsmodels packages, with custom routines for effect sizes, bootstrapping, and censored-data analysis. Reproducible code and outputs are provided in the Supplement. The final dataset comprised 225 plant samples (210 determinations), 225 sediment samples (210 determinations), and 242 fur samples (91 determinations).
Editing assistance: ChatGPT5 (OpenAI) was used exclusively for grammar and formatting after the scientific content had been drafted by the authors. No AI tools were used for study design, data generation, statistical analysis, or interpretation. The authorshavereviewed and approved all AI-assisted text and take full responsibility for the content.

3. Results

3.1. Cross-Matrix Distributions and Censoring

A total of 210 plant, 210 sediment, and 91 beaver fur samples were analyzed. Values below matrix-specific LODs were censored and imputed as LOD/2 [41,44]. Censoring was extensive in fur, moderate in plants, and limited in sediments [35,36].
Pooled medians (IQR; range, µg g−1 DW) ordered as sediments ≫ plants ≳ fur (Table 1):
  • Fur: 22.8 [5.198; 0.05–82.56];
  • Plants: 2.000 [2.880; 0.730–9.67];Sediments: 19.030 [15.300; 3.120–45.10].
Median sediment Pb concentrations were below international sediment-quality guideline thresholds (Table 1), yet episodic exceedances approached the probable-effect range, indicating localized enrichment.
Fur distributions were markedly right-skewed, with a heavy upper tail [47]. Pb distributions across matrices and sites were right-skewed with heteroscedasticity and censoring at matrix-specific LODs. Therefore, we report medians and interquartile ranges as robust location and spread estimators that are less influenced by outliers and detection-limit imputation than means and standard deviations. Where relevant, distributional contrasts were evaluated with non-parametric tests, and effect sizes are reported alongside p-values.
For contextual comparison, the Canadian Sediment Quality Guidelines define a Threshold Effect Level (TEL) [45] of 35 µg g−1 and a Probable Effect Level (PEL) of 91 µg g−1 for Pb [47], indicating concentrations below which adverse effects on aquatic biota are unlikely and above which they are expected to occur more frequently.

3.2. Regional Differences in Pb Distribution

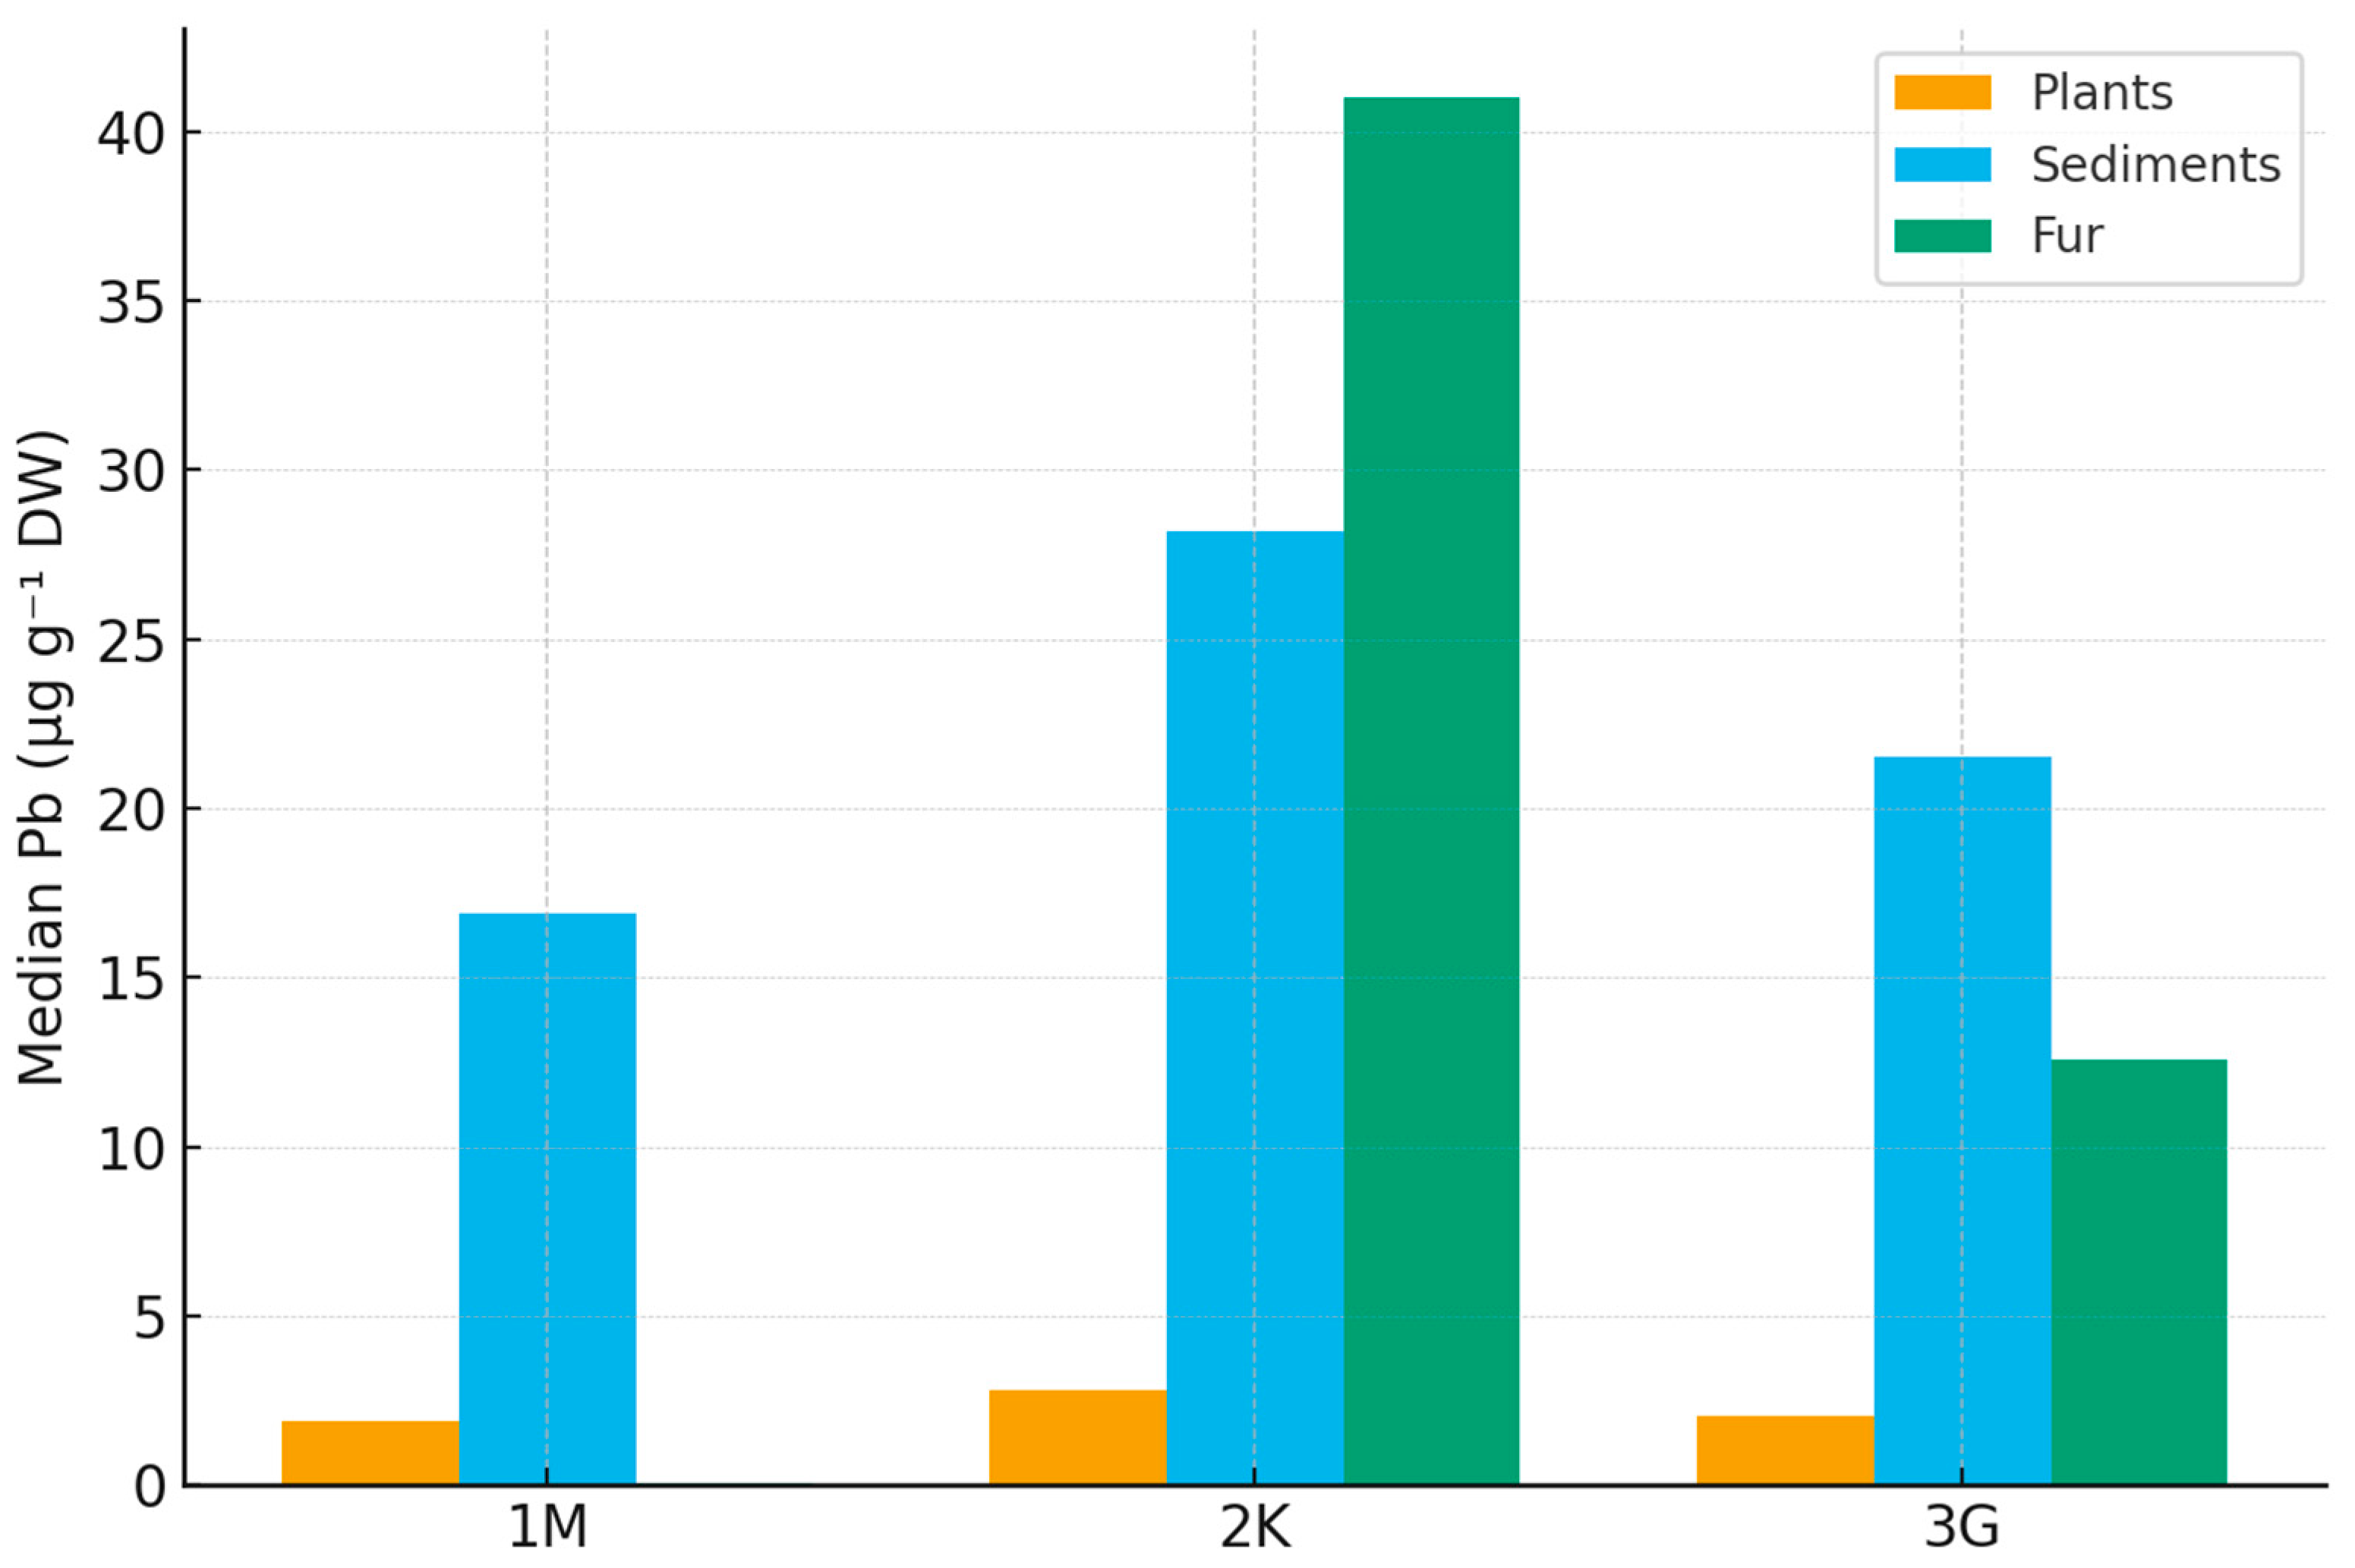
Kruskal–Wallis tests indicated significant regional contrasts for all three matrices (Figure 2). These differences were most pronounced in Zone 2K, consistent with its known anthropogenic pressure and land-use legacy [34,38,48]:
  • Fur: H = 14.505, p = 7.08 × 10⁻⁴;
  • Plants: H = 12.310, p = 2.12 × 10⁻³;
  • Sediments: H = 21.043, p = 2.70 × 10⁻⁵.
Holm-adjusted pairwise Mann–Whitney U tests showed:
  • Plants: 2K > 3G (Δ median = 1.16 µg g−1; p₍holm₎ = 0.0063); 2K > 1M (Δ = 0.89 µg g−1; p₍holm₎ = 0.0066); 1M vs. 3G not significant.
  • Sediments: 2K > 3G (Δ = 8.98 µg g−1; p₍holm₎ = 0.00011); 2K > 1M (Δ = 11.25 µg g−1; p₍holm₎ = 0.00028); 1M vs. 3G not significant.
  • Fur: 3G > 1M (p₍holm₎ = 0.00054); 2K > 1M (p₍holm₎ = 0.00196); 2K vs. 3G not significant.
Effect sizes (Cliff’s δ and rank-biserial correlation with 95% bootstrap CIs) are reported in Supplementary Table S5.

3.3. Patterns by Source Type: Stream, Drying Ditch, Natural Pond

Source type contrasts were not significant across matrices (all p > 0.05; Figure 3). However, descriptive statistics indicated consistent ordering coherent with flow attenuation and fine particle retention: median values were generally highest near natural ponds, intermediate in drying ditches, and lowest near streams. Effect sizes for pairwise contrasts are provided in Supplementary Table S5.

3.4. Transect Distances (10–50 m)

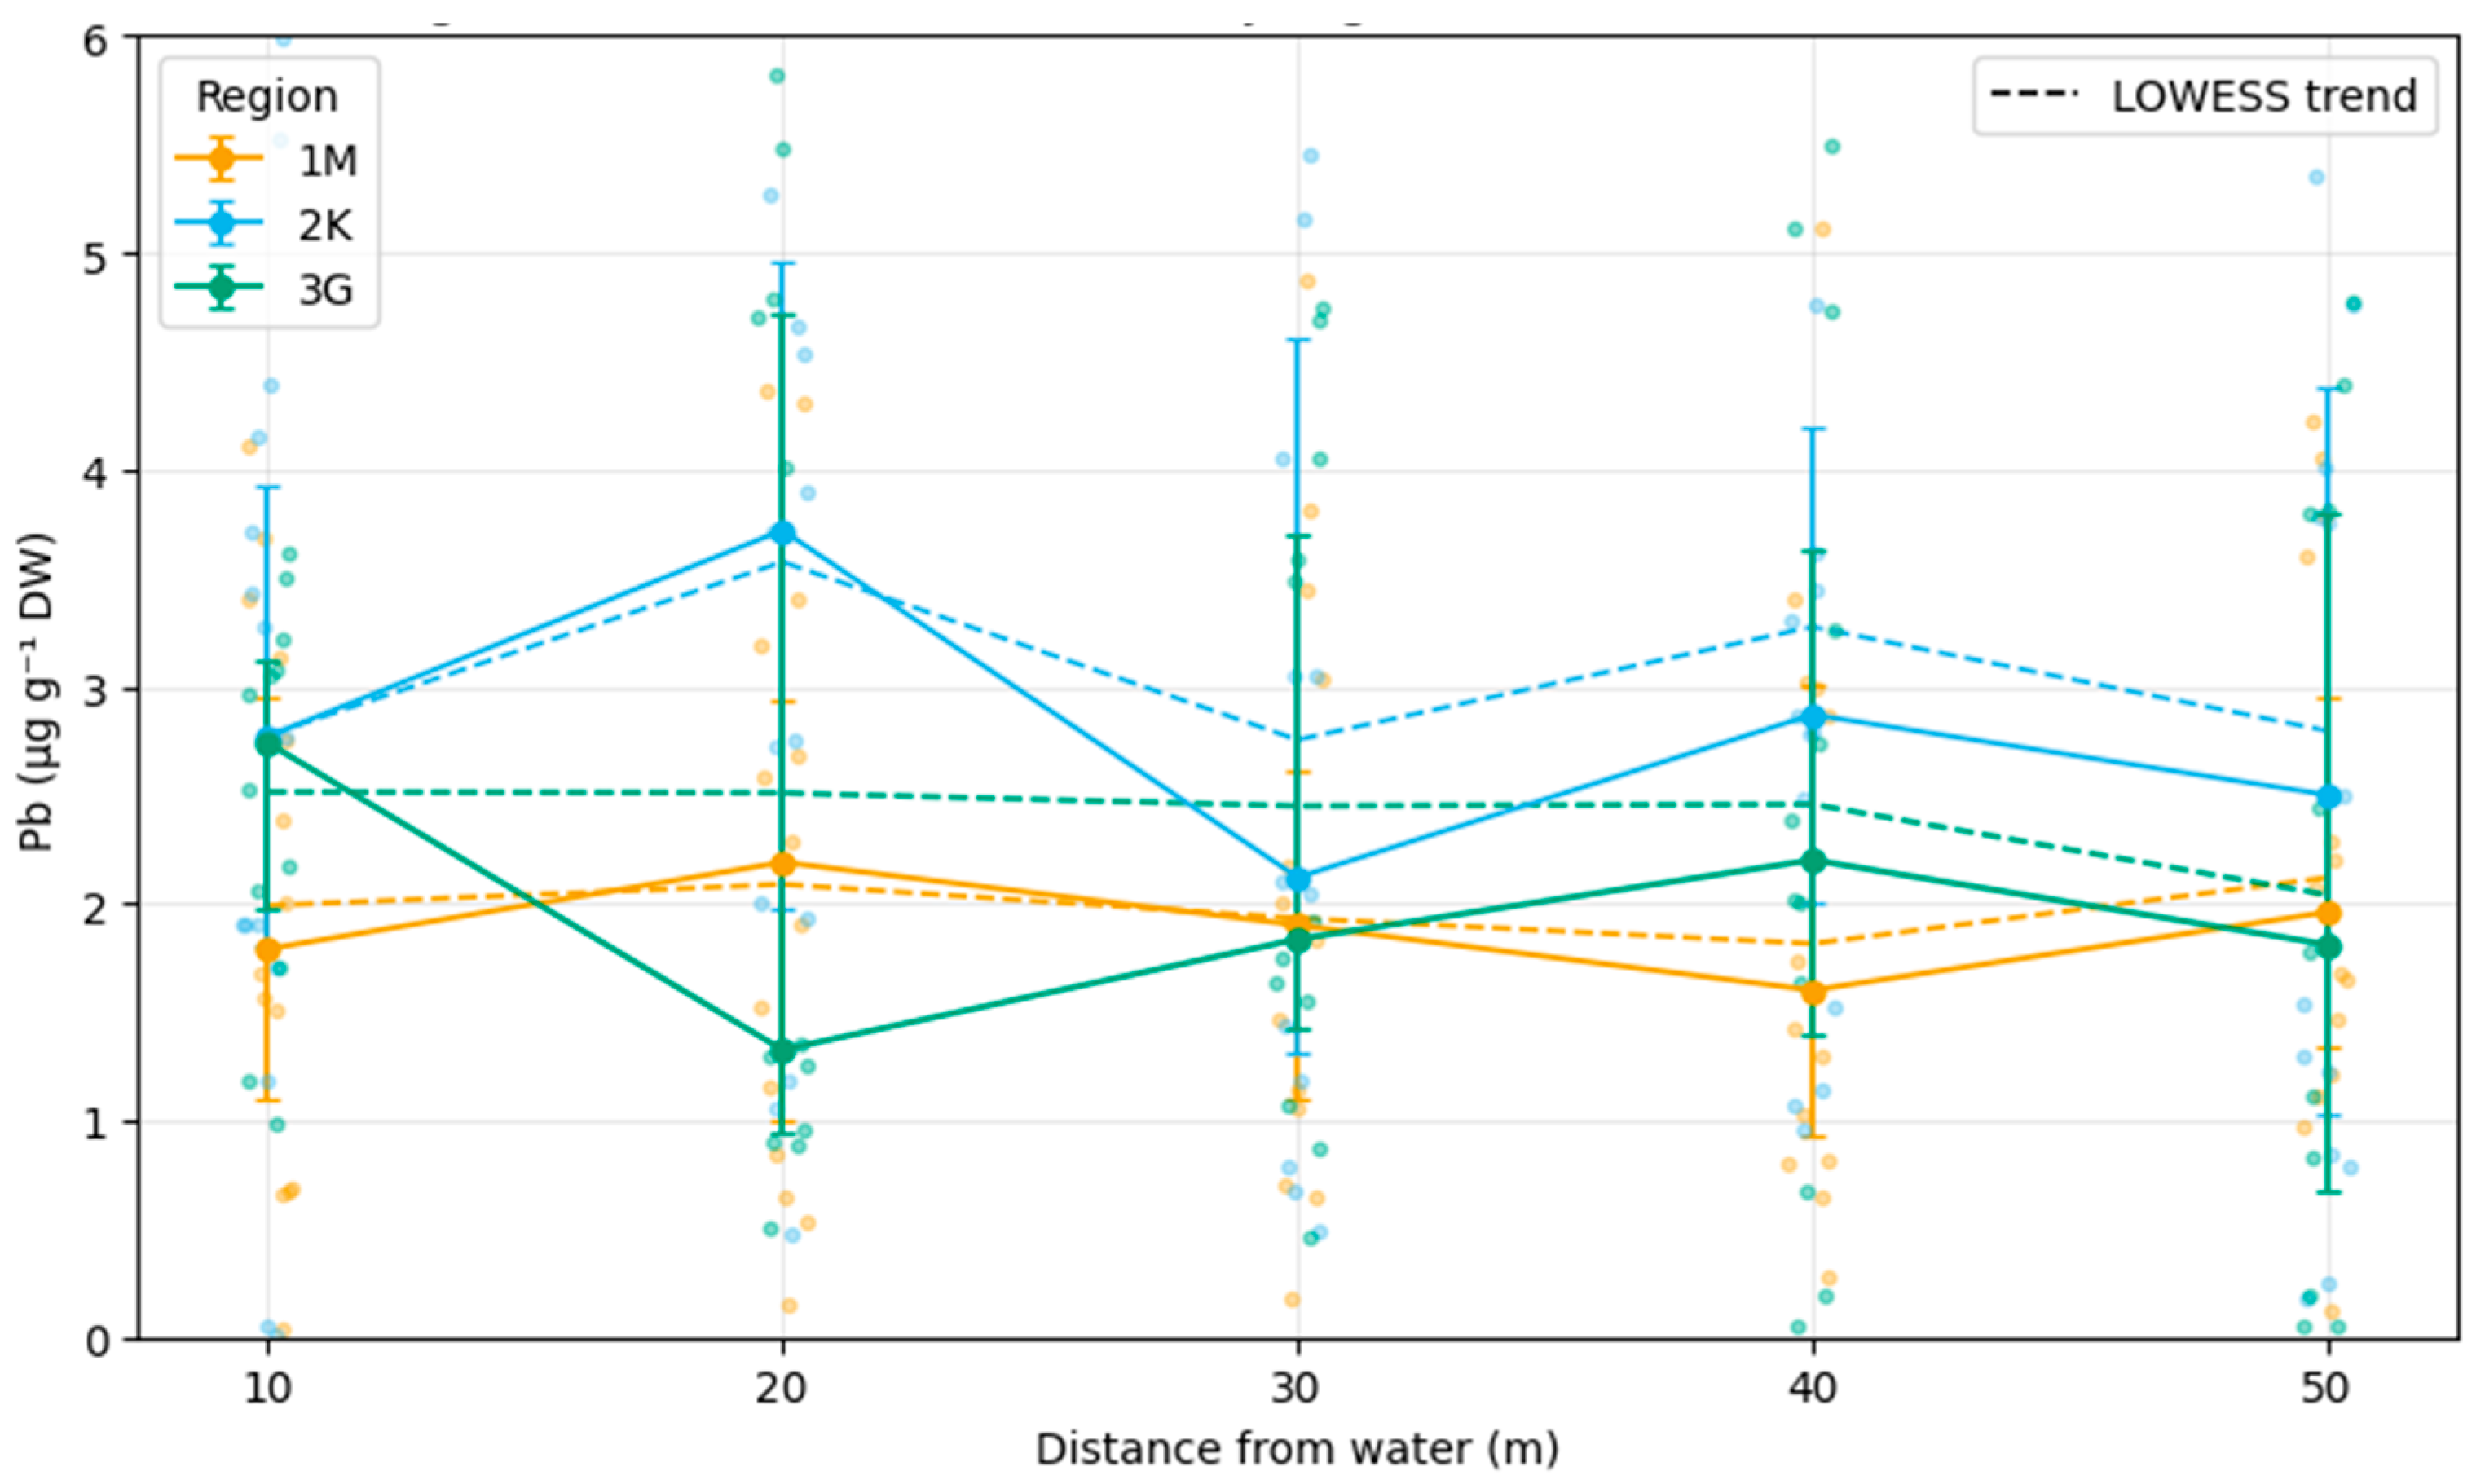
Pb concentrations in plants exhibited a hump-shaped distribution across buffer transects. Medians at 20–30 m from the water edge(Figure 4) were higher (4.22–4.66 µg g−1) than at 10 m (3.46), 40 m (3.10), or 50 m (3.57). Jonckheere–Terpstra tests confirmed a significant ordered trend (p < 0.01) [42]. Sediment and fur concentrations did not display consistent distance-related trends.

3.5. Fur Pb by Region and Season

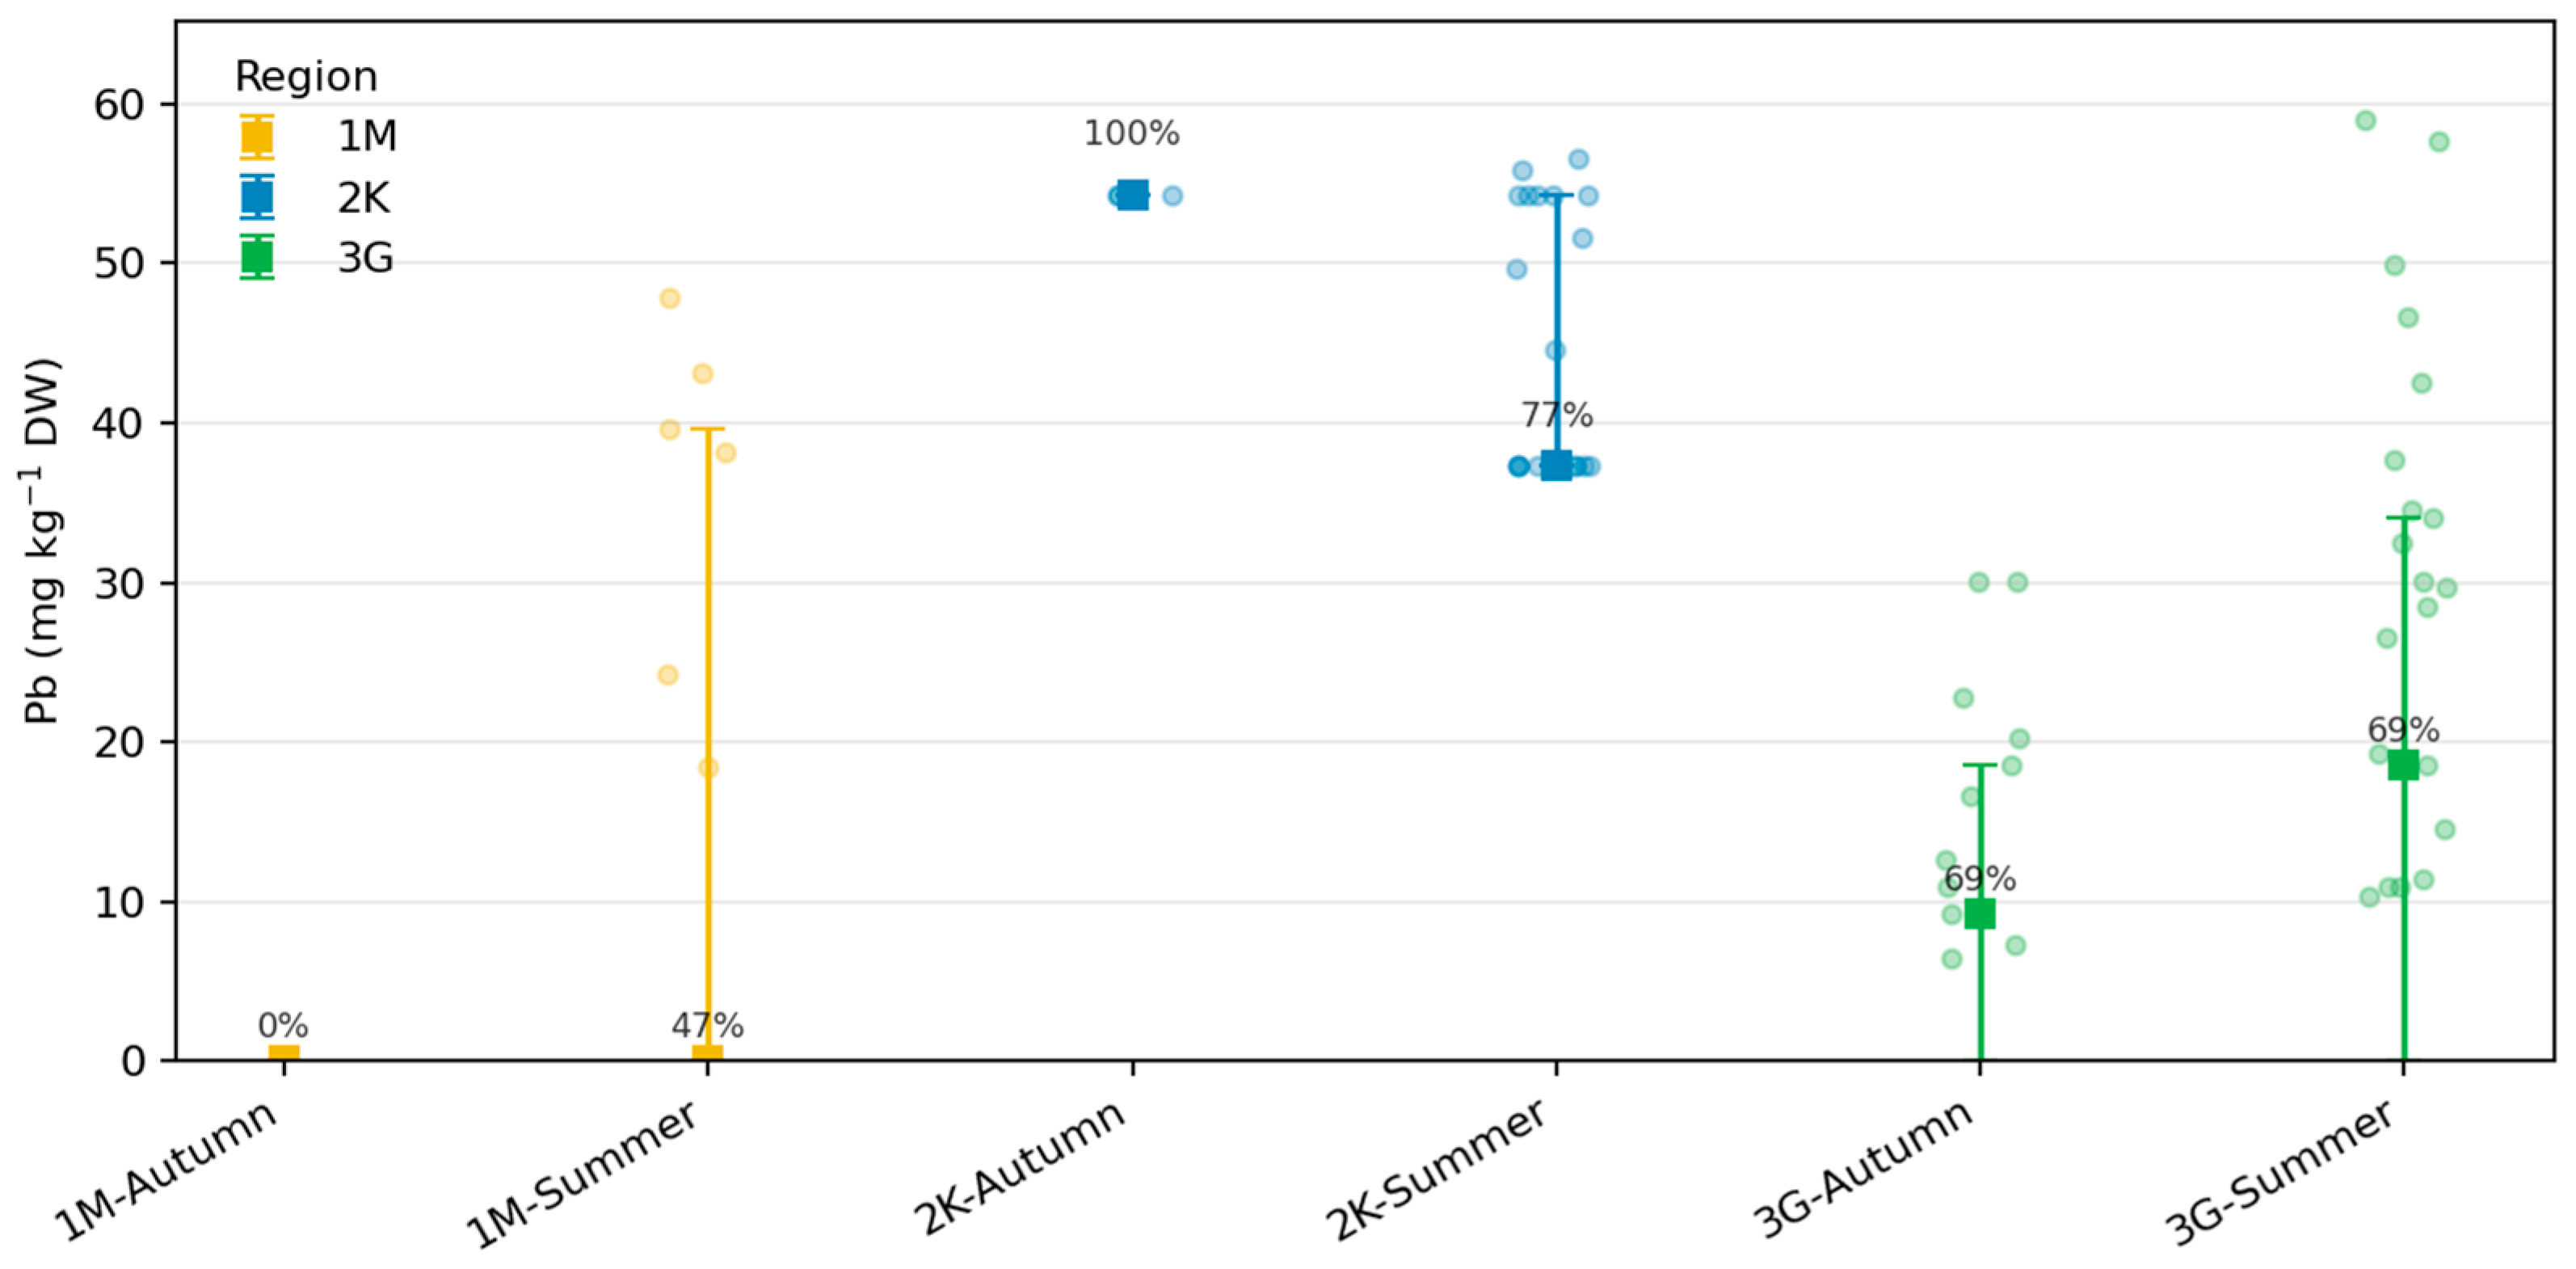
Pb concentrations in beaver fur exhibited pronounced regional and seasonal variability but were largely characterized by left-censored distributions, with 63% of values below the detection limit (LOD = 0.05 µg g−1). Kaplan–Meier estimates yielded median Pb concentrations of <0.05 µg g−1 in Zone 1M, 37.4 µg g−1 in Zone 2K, and 19.3 µg g−1 in Zone 3G, indicating significantly higher accumulation in beavers inhabiting the anthropogenically influenced catchment (2K). Detection frequencies supported this pattern, with Pb detected in 29% of fur samples in 1M, 62% in 2K, and 44% in 3G.
Across seasons, Pb detections were more frequent in summer (58%) than in autumn (41%), particularly in Zone 2K, where median values reached 49–56 µg g−1. This pattern likely reflects enhanced environmental exposure during the active foraging and dam maintenance period, when sediment resuspension and particulate contact are most intensive. Conversely, lower detection rates in 1M and 3G correspond to near-reference hydrochemical conditions and reduced anthropogenic input.
Because more than half of the dataset was left-censored, these results were interpreted primarily in terms of detection frequency and Kaplan–Meier-based medians rather than conventional non-parametric tests. This conservative treatment avoids bias from data substitution and confirms that Pb exposure in beavers is spatially heterogeneous, driven by local contamination gradients rather than age-related physiological differences.

3.6. Cross-Matrix Correlations and Variability

Variability in Pb concentrations differed markedly among matrices, reflecting their contrasting accumulation dynamics and integration timescales. Sediments showed the highest heterogeneity (CV = 53.4%), vegetation the lowest (CV = 25.4%), and fur intermediate variability expressed through the interquartile range (IQR = 0.05–45 µg g−1), corresponding to a robust CV of approximately 42%. Because 63% of fur data were below the detection limit (LOD = 0.05 µg g−1), dispersion was evaluated using Kaplan–Meier–derived quantiles rather than conventional standard deviation–based metrics.
At the site level, cross-matrix correlations were weak and statistically non-significant (Spearman |ρ| < 0.4, p > 0.3), indicating that local-scale Pb variation is dominated by matrix-specific processes and microsite heterogeneity. However, at the regional level, strong relationships emerged, revealing consistent contamination gradients across matrices. Fur Pb correlated strongly with sediments (Pearson r = 0.95, p < 0.01) and moderately with vegetation (r = 0.64), whereas the vegetation–sediment relationship remained weak (r = 0.35). The high fur–sediment coherence suggests that fur primarily reflects bioavailable and contact-mediated Pb exposure during grooming and dam maintenance rather than passive accumulation from diffuse sources.
Hierarchical clustering (Ward’s method, Euclidean distance) confirmed these cross-matrix relationships, isolating Zone 2K as a distinct cluster with consistently elevated Pb across all matrices, while Zones 1M and 3G grouped together, representing near-reference conditions (Figure 5).
Detection frequencies summarized in Table 2 show nearly complete detectability in sediments (100%), whereas plants (93% >LOQ) and especially beaver fur (68% >LOQ; 32% <LOD) exhibit greater variability, consistent with biological uptake and episodic exposure.

3.7. Management-Relevant Highlights

Several findings obtained in this study have direct implications for sustainable water management. Sediment analyses confirmed that Pb concentrations were consistently higher inside beaver impoundments compared with downstream sites, demonstrating the capacity of dams to function as natural filters and attenuate contaminant fluxes. Vegetation exhibited the lowest variability across zones, indicating its reliability as a sentinel of diffuse background exposure and its applicability for establishing baseline contamination levels in wetland buffers. Non-invasively sampled beaver fur revealed seasonal peaks in Pb exposure, particularly in the anthropogenically pressured catchment of Zone 2K, thus adding a dynamic, wildlife-centered dimension to monitoring while complying with animal welfare principles. In addition, transect analyses showed that plant Pb concentrations consistently peaked at 20–30 m from the shoreline, identifying this interval as a practical monitoring zone for buffer-strip design. Finally, regional differentiation, with Zone 2K emerging as a persistent outlier, highlights the vulnerability of disturbed catchments, whereas Zones 1M and 3G may serve as reference conditions for national monitoring schemes. Taken together, these insights outline an operational framework for integrating beaver wetlands into applied monitoring programs under the Water Framework Directive, Natura 2000, and REACH restrictions on Pb in wetlands.

4. Discussion

4.1. Hydro-Ecological Mechanisms

The observed spatial differentiation of Pb concentrations among sediments, vegetation, and beaver fur arises from the coupled hydrological and biogeochemical feedbacks generated by beaver damming [6,39,48,49,50]. Beaver impoundments alter the hydraulic regime by reducing flow velocity and enhancing water residence time, which in turn promotes sedimentation of fine, organic-rich particles [47]. This process establishes redox-buffered microenvironments favoring Pb sorption onto organic matter and Fe–Mn oxyhydroxides, thereby immobilizing the metal within pond sediments [21,22,23,31,37,51,52,53,54].
Downstream of dams, increased turbulence and episodic sediment resuspension expose particles to oxidative conditions, leading to partial Pb remobilization and higher spatial variability. Such hydro-geomorphic contrasts illustrate the self-regulating nature of beaver dams described by Wohl [27]: permeable structures that continuously balance retention and release rather than acting as static barriers. The resulting patchiness in Pb distribution reflects not only hydraulic sorting but also biotic mediation. Vegetation colonizing dam margins and backwaters further stabilizes sediments and sequesters Pb through rhizosphere uptake and organic complexation, while fur Pb levels integrate these localized exposures through trophic and contact pathways.
Overall, beaver-engineered wetlands function as dynamic filters where hydraulic attenuation, sediment trapping, and biological assimilation interact to regulate contaminant fluxes at the landscape scale. This mechanistic perspective explains the enhanced spatial heterogeneity recorded in our dataset and aligns with the findings of Westbrook and Cooper [26] and Schloemer et al. [55], who linked beaver activity to expansion of aquatic habitats and intensified benthic biogeochemical cycling [56].

4.2. Regional Contrasts

The three study regions exhibited clear quantitative differentiation in Pb accumulation. Region 2K consistently showed elevated Pb concentrations across all matrices, deviating from the interquartile range of the overall dataset by more than 1.5× IQR (Figure 2). Statistical tests confirmed that 2K differed significantly from 1M and 3G (Kruskal–Wallis H = 26.4, p < 0.001; pairwise Mann–Whitney U, p < 0.01), with a large effect size (Cliff’s δ = 0.62) indicating substantial magnitude of difference. In hierarchical clustering, 2K formed a distinct branch, supporting its classification as a regional outlier in Pb burden.
This divergence most likely reflects cumulative anthropogenic pressures in the Kretinga District, including historical land use, traffic emissions, and urban runoff, which have contributed to persistently higher background Pb levels. In contrast, regions 1M (Žemaitija National Park) and 3G (Kauno Marios vicinity) exhibited near-reference conditions characterized by lower and more homogeneous Pb accumulation. Thus, the “outlier” status of 2K is both statistically and environmentally justified, emphasizing its role as a localized pollution hotspot within the broader Lithuanian landscape.

4.3. Matrix Complementarity

The interpretation of Pb contamination in beaver-modified wetlands requires distinguishing the complementary diagnostic roles of abiotic and biotic matrices. Sediments act as long-term integrators of contaminant inputs but display the highest heterogeneity (CV ≈ 53%), driven by spatially variable deposition and dam-related hydraulic sorting [19,51,55]. Plant tissues, by contrast, showed lower variability (CV ≈ 25%) and thus provide reliable indicators of diffuse background contamination. Their relatively stable Pb content is consistent with values reported for emergent macrophytes in Lithuanian peatlands (3–5 µg g−1 DW) [35,36] and for riparian vegetation in northern Poland (3–6 µg g−1 DW) [57]. In Scandinavian beaver wetlands, lower vegetation Pb concentrations (1–3 µg g−1 DW) and reduced sedimentary loads (15–30 µg g−1 DW) have been attributed to minimal industrial inputs and the effective phase-out of leaded ammunition [58].
Beaver fur exhibited intermediate variability (CV ≈ 41%) yet offered unique integrative potential by reflecting short-term exposure dynamics that neither sediments nor vegetation capture. Seasonal Pb peaks—especially in spring samples from region 2K—coincide with elevated surface-water concentrations and increased contact with suspended particulates during active dam maintenance [48]. Weak correlations among matrices at the plot scale do not indicate independence; instead, they reveal scale dependence, as aggregation to the regional level revealed stronger concordance between fur and sediment Pb (Spearman’s ρ = 0.61, p < 0.05).
Collectively, the three matrices form a complementary system of indicators: sediments reflect long-term accumulation, plants register stable background conditions, and beaver fur integrates short-term bioavailable fractions. The consistency of these patterns with observations from Poland and Scandinavia supports the broader applicability of the matrix-based framework for Pb risk screening across temperate European wetland landscapes.

4.4. Implications for Sustainable Water Management and Environmental Governance

Beaver dams act as self-regulating biohydraulic structures that combine sediment retention and hydraulic attenuation, thereby mitigating downstream transport of particulate pollutants [23,28]. The observed inside–outside dam contrasts indicate that a substantial proportion of sediment-bound Pb becomes sequestered within impoundments, reducing export to lower reaches [24,28,37]. Along riparian buffer transects, vegetation Pb concentrations peaked consistently at 20–30 m from the waterline, identifying this interval as an optimal zone for spatial monitoring of diffuse contamination [38]. In addition, beaver fur provided a non-invasive bioindicator of short-term exposure, complementing abiotic matrices and enabling long-term, animal-friendly biomonitoring schemes [48].
These hydro-ecological mechanisms have direct implications for sustainable water management. By retaining contaminants and regulating flow, beaver-engineered wetlands function as living infrastructures that contribute measurable regulatory ecosystem services [24,28,29,30,53]. Integrating such systems into formal monitoring networks would enhance the detection of particulate pollutants and provide spatially explicit evidence of buffer-zone effectiveness. In particular, the measured sediment–water and inside–outside contrasts correspond to indicators used for ecological status classification under the EU Water Framework Directive (WFD; 2000/60/EC) and the forthcoming Nature Restoration Law [10,11,12,58,59].
The demonstrated potential of fur sampling for quantifying Pb exposure further complements conventional chemical surveillance required under REACH and the restriction on Pb ammunition [13,14]. Incorporating these biological indicators into existing frameworks would strengthen operational monitoring and provide a link between contaminant occurrence and wildlife health—two domains often treated separately in water policy.
At the national scale, the consistent identification of Zone 2K as a Pb hotspot underscores the need for geographically targeted interventions in anthropogenically pressured catchments. Management authorities can use these signals to prioritize remediation measures, adapt land-use restrictions, or refine hunting and recreation regulations [34,40,49]. Periodic sediment screening inside and outside dams, combined with seasonal fur sampling, offers a cost-effective early-warning system for contaminant mobilization. Maintaining dam stability through continuous woody input and bank protection is likewise essential to sustain retention capacity and compliance with current EU restrictions on lead use.
In Lithuania, these findings directly support the ongoing implementation of the WFD through the River Basin Management Plans (2022–2027) coordinated by the Environmental Protection Agency (AAA) and the Ministry of Environment. Within this framework, beaver-engineered buffers can complement conventional riparian strips and retention ponds by enhancing sediment trapping and trace-metal sequestration. Incorporating beaver wetlands into national monitoring programs would assist in achieving good ecological and chemical status while advancing the objectives of the National Climate Change Management Agenda.
Overall, beaver-engineered wetlands represent operational nature-based solutions that integrate hydrological regulation, contaminant retention, and biodiversity support. Their inclusion in river-basin governance frameworks provides a scientifically grounded pathway toward sustainable freshwater management, consistent with the principles of the EU Green Deal, SDG 6, and the Ramsar Convention on Wetlands [7,15,16,17].

4.5. Study Limitations and Future Work

Censoring at LODs and right-skew can attenuate cross-matrix correlations; we addressed this with robust summaries and sensitivity checks. Matrix heterogeneity (micro-hydraulic sorting in sediments; species composition in plants; age/season effects in fur) introduces variance that may mask weak site-level associations. The study also integrates extant plant and sediment datasets with newly collected fur data, which may differ in sampling granularity. Finally, the lack of co-measured water chemistry and hydrological event logs (e.g., storm pulses) precluded full source apportionment.
These constraints motivate an expanded design with stratified microhabitat sampling, joint physical–chemical covariates, and multi-seasonal time series to better resolve contaminant pathways.

5. Conclusions

Beaver-engineered wetlands act not only as habitats but also as operational monitoring platforms that integrate hydraulic regulation, sediment retention, and biological feedback.
By combining data from sediments, riparian vegetation, and beaver fur, this study established a coherent cross-matrix framework for tracing Pb accumulation across spatial and biological compartments. The results demonstrated that beaver impoundments effectively immobilize particulate Pb, while fur sampling offers a non-invasive tool for tracking short-term exposure.
Region 2K was confirmed as a statistically defined contamination hotspot, whereas 1M and 3G represent near-reference conditions. These insights provide a transferable template for integrating beaver-engineered systems into national and EU-level water governance, particularly within the Water Framework Directive and REACH implementation frameworks.

Supplementary Materials

The following supporting information can be downloaded at: https://www.mdpi.com/article/10.3390/su17219892/s1, Table S1. Batch-level calibration and blank statistics for FAAS at 283.3 nm (PerkinElmer AAnalyst 200): slope, intercept, correlation coefficient (R), blank standard deviation (σ_blank, absorbance), solution-phase detection and quantification limits (LOD_sol, LOQ_sol), carry-over checks, and notes (by analytical batch). Table S2. Matrix-specific limits and precision: sample mass and final volume; propagated LOD_matrix and LOQ_matrix (µg g−1, dry weight) according to IUPAC conventions; within-batch precision (RSD, %); spike-recovery ranges. Table S3. Descriptive statistics of Pb by region (1M, 2K, 3G) for each matrix: n, median, Q1, Q3, IQR, min–max (values < LOD imputed as LOD/2 for descriptives). Table S4. Descriptive statistics of Pb by source type (Stream, Drying Ditch, Natural Pond) for each matrix: n, median, Q1, Q3, IQR, min–max (values < LOD imputed as LOD/2 for descriptives). Table S5. Non-parametric tests: Kruskal–Wallis across regions and source types, and pairwise Mann–Whitney U contrasts with Holm adjustment; U statistics, raw and adjusted p-values, and Δ median (Hodges–Lehmann proxy). Table S6. Descriptive statistics of Pb by region (1M, 2K, 3G) for each matrix: n, median, Q1, Q3, IQR, min–max (values < LOD imputed as LOD/2 for descriptives). Table S7. Descriptive statistics of Pb by source type (Stream, Drying Ditch, Natural Pond) for each matrix: n, median, Q1, Q3, IQR, min–max (values < LOD imputed as LOD/2 for descriptives). Table S8. Non-parametric tests: Kruskal–Wallis across regions and source types, and pairwise Mann–Whitney U contrasts with Holm adjustment; U statistics, raw and adjusted p-values, and Δ median (Hodges–Lehmann proxy). Supplementary Data S1. Site coordinates (WGS84, EPSG:4326): Region_Code, Place, SiteID (A–C), Site_Name, Latitude_dd, Longitude_dd (CSV). Figure S1. Sampling Design. Figure S2. Fur Seasonal Boxplots. Figure S3. Plant Transect Gradients. Figure S4. Sediments In Out. Figure S5. CrossMatrix Scatterplots. Figure S6. Cluster Dendrogram.

Author Contributions

Conceptualization, O.B. and K.F.; methodology, O.B., A.S. and K.F.; validation, A.S., O.B. and K.F.; formal analysis, K.F.; investigation, E.V., G.U. and O.B.; resources, O.B. and A.S.; data curation, K.F.; writing—original draft preparation, K.F.; writing—review and editing, O.B., A.S., E.V. and G.U.; visualization, K.F.; supervision, O.B.; project administration, O.B.; funding acquisition, O.B. All authors have read and agreed to the published version of the manuscript.

Funding

This research was funded by the Ministry of Environment of the Republic of Lithuania, grant No. VSP-2022-7-SBMŪRP. The APC was funded by the Lithuanian Research Centre for Agriculture and Forestry (LAMMC).

Institutional Review Board Statement

The animal study protocol was approved by the Environmental Protection Agency of the Republic of Lithuania (permit No. VSP20227SBMŪRP) and conducted in accordance with national legislation; no trapping or harm to animals was involved.

Informed Consent Statement

Not applicable.

Data Availability Statement

The per-sample datasets analyzed in this study are provided in the Supplementary Materials (Dataset S1—Plants.csv; Dataset S2—Sediments.csv; Dataset S3—Fur.csv, S4—Calibration_QAQC.csv, S5—LOD_LOQ.csv, S6—Descr_by_Locality.csv, S7—Descr_by_Source.csv, S8—NonParam_Tests.csv). All concentrations are reported on a dry-weight basis in µg g−1; values < LOD were treated as LOD/2, whereas “not collected” entries were retained as missing.

Acknowledgments

The authors thank the administrations of Žemaitija National Park and Kauno Marios Regional Park for field access, and the LAMMC Chemical Research Laboratory for analytical facilities. During manuscript preparation, the authors used OpenAI ChatGPT (GPT-5 Thinking, August 2025) for language refinement and formatting; the authors reviewed and edited the output and take full responsibility for the concentration.

Conflicts of Interest

The authors declare no conflicts of interest. The funders had no role in the design of the study; in the collection, analyses, or interpretation of data; in the writing of the manuscript; or in the decision to publish the results.

Abbreviations

AASAtomic Absorption Spectrometry
APCArticle Processing Charge
CVCoefficient of Variation
DWDry Weight
FAASFlame Atomic Absorption Spectrometry
LODLimit of Detection
OCOrganic Carbon
PbLead
Q1/Q3First/Third Quartiles
rPearson’s correlation coefficient
SDStandard Deviation
1M/2K/3GStudy zones in Lithuania

References

  1. Collin, S.; Baskar, A.; Geevarghese, D.M.; Syed Ali, M.N.V.; Bahubali, P.; Choudhary, R.; Lvov, V.; Tovar, G.I.; Senatov, F.; Swamiappan, S. Bioaccumulation of Lead (Pb) and Its Effects in Plants: A Review. J. Hazard. Mater. Lett. 2022, 3, 100064. [Google Scholar] [CrossRef]
  2. Ashraf, U.; Mahmood, M.H.-U.-R.; Hussain, S.; Abbas, F.; Anjum, S.A.; Tang, X. Lead (Pb) Distribution and Accumulation in Different Plant Parts and Its Associations with Grain Pb Concentrations in Fragrant Rice. Chemosphere 2020, 248, 126003. [Google Scholar] [CrossRef]
  3. Nikolova, T. Absorption of Pb, Cu, Zn and Cd by Morus alba L. Cultivated on Soils Contaminated with Heavy Metals. Bulg. J. Agric. Sci. 2015, 21, 747–750. [Google Scholar]
  4. Szwalec, A.; Lasota, A.; Kędzior, R.; Mundała, P. Variation in Heavy Metal Concentration in Plants Growing on a Zinc and Lead Tailings Dump. Appl. Ecol. Environ. Res. 2018, 16, 5081–5094. [Google Scholar] [CrossRef]
  5. Kabata-Pendias, A. Trace Elements in Soils and Plants, 4th ed.; CRC Press: Boca Raton, FL, USA, 2010. [Google Scholar] [CrossRef]
  6. Alloway, B.J. Heavy Metals in Soils: Trace Metals and Metalloids in Soils and Their Bioavailability, 3rd ed.; Springer: Dordrecht, The Netherlands, 2013. [Google Scholar] [CrossRef]
  7. United Nations Environment Programme (UNEP). The Emissions Gap Report 2016; UNEP: Nairobi, Kenya, 2016; Available online: http://uneplive.unep.org/theme/index/13#eg (accessed on 13 August 2025).
  8. Temmink, R.J.M.; Lamers, L.P.M.; Angelini, C.; Bouma, T.J.; Fritz, C.; van de Koppel, J.; Lexmond, R.; Rietkerk, M.; Silliman, B.R.; Joosten, H.; et al. Recovering Wetland Biogeomorphic Feedbacks to Restore the World’s Biotic Carbon Hotspots. Science 2022, 376, eabn1479. [Google Scholar] [CrossRef]
  9. Zhang, Z.; Jiang, W.; Peng, K.; Wu, Z.; Ling, Z.; Li, Z. Assessment of the Impact of Wetland Changes on Carbon Storage in Coastal Urban Agglomerations from 1990 to 2035 in Support of SDG 15.1. Sci. Total Environ. 2023, 877, 162824. [Google Scholar] [CrossRef]
  10. European Commission. The European Green Deal; COM(2019) 640 final; European Commission: Brussels, Belgium, 2019; Available online: https://eur-lex.europa.eu/legal-content/EN/TXT/?uri=CELEX:52019DC0640 (accessed on 13 August 2025).
  11. Siddi, M. The European Green Deal: Assessing Its Current State and Future Implementation; FIIA Working Paper 114; Finnish Institute of International Affairs: Helsinki, Finland, 2020; Available online: https://www.fiia.fi/wp-content/uploads/2020/05/wp114_european-green-deal.pdf (accessed on 13 August 2025).
  12. European Parliament and Council. Directive 2013/39/EU Amending Directives 2000/60/EC and 2008/105/EC as Regards Priority Substances in the Field of Water Policy. Off. J. Eur. Union 2013, L 226, 1–17. [Google Scholar]
  13. Commission Regulation (EU). Commission Regulation (EU) 2021/57 of 25 January 2021 Amending Annex XVII to Regulation (EC) No 1907/2006 (REACH) as Regards Lead in Gunshot in or around Wetlands. Off. J. Eur. Union 2021, L 24, 19–27. [Google Scholar]
  14. Council of the European Union. AOB Item for the Meeting of the “Agriculture and Fisheries” Council on 26 May 2025: The Proposed Ban on Lead in Ammunition and Fishing Tackle Under the REACH Regulation—Information from Czechia and Slovakia. Note from the General Secretariat of the Council to Delegations; ST 9225/25 (ST-9225-2025-INIT); Council of the European Union: Brussels, Belgium, 2025; Available online: https://data.consilium.europa.eu/doc/document/ST-9225-2025-INIT/en/pdf (accessed on 8 September 2025).
  15. Ramsar Convention Secretariat. Ramsar Convention on Wetlands; Country Profile: Lithuania. 1971. Available online: https://www.ramsar.org/country-profile/lithuania (accessed on 13 August 2025).
  16. Tanneberger, F.; Moen, A.; Barthelmes, A.; Lewis, E.; Miles, L.; Sirin, A.; Tegetmeyer, C.; Joosten, H. Mires in Europe—Regional Diversity, Condition and Protection. Diversity 2021, 13, 381. [Google Scholar] [CrossRef]
  17. Stroud, D.; Dunn, E.; Jones, W.; Tucker, G. Nature Conservation in Europe: Approaches and Lessons—Annex 1. Further Details of Conventions and Conferences of Key Importance to Nature Conservation in Europe: The Convention on Wetlands (Ramsar Convention). In Nature Conservation in Europe: Approaches and Lessons; Cambridge University Press: Cambridge, UK, 2023; pp. 2–25. [Google Scholar] [CrossRef]
  18. Butler, D.R.; Malanson, G.P. Sedimentation Rates and Patterns in Beaver Ponds in a Mountain Environment. Geomorphology 1995, 13, 255–269. [Google Scholar] [CrossRef]
  19. Nolet, B.A.; Rosell, F. Comeback of the Beaver Castor fiber: An Overview of Old and New Conservation Problems. Biol. Conserv. 1998, 83, 165–173. [Google Scholar] [CrossRef]
  20. Paine, R.T. A Note on Trophic Complexity and Community Stability. Am. Nat. 1969, 103, 91–93. [Google Scholar] [CrossRef]
  21. Nuñez, M.A.; DiMarco, R.D. Keystone Species. In The Berkshire Encyclopedia of Sustainability: Ecosystem Management and Sustainability; Berkshire Publishing Group: Great Barrington, MA, USA, 2012; pp. 226–230. [Google Scholar]
  22. Cockman, C. Beavers as a Keystone Species. 2016. Available online: http://landtrustcnc.org/2016/beavers-as-a-keystone-species (accessed on 13 August 2025).
  23. Puttock, A.; Graham, H.; Cunliffe, A.M.; Elliott, M.; Brazier, R.E. Sediment, Water and Nutrient Retention in Beaver-Engineered Ponds. Sci. Total Environ. 2017, 576, 430–443. [Google Scholar] [CrossRef]
  24. Puttock, A.; Graham, H.A.; Carless, D.; Brazier, R.E. Eurasian Beaver Activity Increases Water Storage, Attenuates Flow and Mitigates Diffuse Pollution. Earth Surf. Process Landf. 2018, 43, 2358–2370. [Google Scholar] [CrossRef]
  25. Murray, D.; Lacey, J.; Armitage, P.D. Role of Beaver Dams in Water Quality and Flow Regulation: A Review. J. Environ. Manag. 2021, 285, 112127. [Google Scholar] [CrossRef]
  26. Westbrook, C.J.; Cooper, D.J. Comparing the Sources of Sediment Retained by Beaver Dams and Beaver Dam Analogs. Water 2024, 16, 505. [Google Scholar] [CrossRef]
  27. Wohl, E. Beaver Versus Human: The Big Differences in Small Dams. WIREs Water 2025, 12, e1706. [Google Scholar] [CrossRef]
  28. Oleszczuk, R.; Bajkowski, S.; Urbański, J.; Pawluśkiewicz, B.; Małuszyński, M.J.; Małuszyńska, I.; Jadczyszyn, J.; Hewelke, E. The Impacts of Beaver Dams on Groundwater Regime and Habitat 6510. Land 2024, 13, 1902. [Google Scholar] [CrossRef]
  29. Sjöberg, G.; Belova, O. (Eds.) Beaver as a Renewable Resource: A Beaver Dam Handbook for the Baltic Sea Region; Swedish Forest Agency: Jönköping, Sweden, 2020; p. 125. Available online: https://www.lammc.lt/data/public/uploads/2020/05/beaver-handbook.pdf (accessed on 13 August 2025).
  30. Belova, O.; Ulevičius, A.; Lode, E.; Piirainen, S.; Wróbel, M.; Čiuldienė, D.; Lībiete, Z. Beaver Population Management in the Baltic Sea Region Countries—A Review of Current Knowledge, Methods and Areas for Development; Interreg Baltic Sea Region, WAMBAF: Rostock, Germany; Riga, Latvia, 2017; p. 50. Available online: https://www.lammc.lt/data/public/uploads/2019/02/beaver-report_wp2_wambaf_final-25-02-2017.pdf (accessed on 13 August 2025).
  31. Virbickas, T.; Stakėnas, S.; Steponėnas, A. Impact of Beaver Dams on Abundance and Distribution of Anadromous Salmonids in Two Lowland Streams in Lithuania. PLoS ONE 2015, 10, e0123107. [Google Scholar] [CrossRef]
  32. Giżejewska, A.; Spodniewska, A.; Barski, D.; Fattebert, J. Beavers Indicate Metal Pollution Away from Industrial Centres in Northeastern Poland. Environ. Sci. Pollut. Res. 2015, 22, 3969–3975. [Google Scholar] [CrossRef] [PubMed]
  33. Fastovetska, K.; Belova, O.; Šlepetienė, A. Lead Fixation in Sediments of Protected Wetlands in Lithuania. Land 2025, 14, 737. [Google Scholar] [CrossRef]
  34. Ministry of Environment of the Republic of Lithuania. Rules for Hunting in the Territory of the Republic of Lithuania, No. D1-631 of 14 October 2020 (as Last Amended on 1 May 2025); Register of Legal Acts, i.k. 2020-21339; Ministry of Environment of the Republic of Lithuania: Vilnius, Lithuania, 2020. Available online: https://e-tar.lt/portal/lt/legalAct/TAR.308F43BA7D00/fdRJxBChJl (accessed on 16 September 2025).
  35. Belova, O.; Šlepetienė, A.; Urbaitis, G.; Vigricas, E. Bioindikacinis Bebrų Vaidmuo Miško Šlapynių Buferinių Zonų Taršos Nustatymui; Final Report of the Applied Research Project VSP-2022-7-SBMŪRP; Lithuanian Research Centre for Agriculture and Forestry (LAMMC), Forest Institute: Girionys, Lithuania, 2025; p. 32. (In Lithuanian) [Google Scholar]
  36. Fastovetska, K.; Šlepetienė, A.; Vigricas, E.; Urbaitis, G.; Belova, O. Lead Content in Plant Materials in the Buffer Zones of Surface Water Bodies of Northwestern and Central Regions of Lithuania. Zemdirb. Agric. 2022, 109, 335–340. [Google Scholar] [CrossRef]
  37. Mocák, J.; Bond, A.M.; Mitchell, S.; Scollary, G. A Statistical Overview of Standard (IUPAC and ACS) and New Approaches to LOD/LOQ. Pure Appl. Chem. 1997, 69, 297–328. [Google Scholar]
  38. Jonckheere, A.R. A Distribution-Free k-Sample Test against Ordered Alternatives. Biometrika 1954, 41, 133–145. [Google Scholar] [CrossRef]
  39. US EPA. Method 3050B: Acid Digestion of Sediments, Sludges, and Soils; US EPA: Washington, DC, USA, 1996; SW-846.
  40. US EPA. SW-846 Test Method 7000B: Flame Atomic Absorption Spectrophotometry; US EPA: Washington, DC, USA, 2007.
  41. IUPAC. Gold Book. Limit of Detection (L03540); IUPAC: Research Triangle Park, NC, USA, 2019; Available online: https://goldbook.iupac.org/terms/view/L03540 (accessed on 18 September 2025).
  42. Koenker, R.; Bassett, G. Regression Quantiles. Econometrica 1978, 46, 33–50. [Google Scholar] [CrossRef]
  43. Smith, C.H.; Georges, P.; Nguyen, N. The Systems Measurement of Mammalian Biotas, Part Two. Life 2023, 13, 2193. [Google Scholar] [CrossRef]
  44. Efron, B. Better Bootstrap Confidence Intervals. J. Am. Stat. Assoc. 1987, 82, 171–200. [Google Scholar] [CrossRef]
  45. Gibson, P.P.; Olden, J.D. Ecology, Management, and Conservation Implications of North American Beaver (Castor canadensis) in Dryland Streams. Aquat. Conserv. 2014, 24, 391–409. [Google Scholar] [CrossRef]
  46. Canadian Council of Ministers of the Environment (CCME). Canadian Sediment Quality Guidelines for the Protection of Aquatic Life: Summary Tables (Update 2002). Canadian Council of Ministers of the Environment, Winnipeg, MB, Canada. Available online: https://ccme.ca/en/res/lead-canadian-sediment-quality-guidelines-for-the-protection-of-aquatic-life-en.pdf (accessed on 30 August 2025).
  47. Zalewski, K.; Falandysz, J.; Jadacka, M.; Martysiak-Żurowska, D.; Nitkiewicz, B.; Giżejewski, Z. Concentrations of Heavy Metals and PCBs in the Tissues of European Beavers (Castor fiber) Captured in Northeastern Poland. Eur. J. Wildl. Res. 2012, 58, 655–660. [Google Scholar] [CrossRef]
  48. Gridan, A.; Ionescu, O.; Ionescu, G.; Fedorca, A.; Ciocirlan, E.; Pasca, C.; Hardalau, D. The Ecological Impacts and Modeling of the Beaver Dam Distribution: A Study on Habitat Characteristics and Environmental Factors in Romania. Ecologies 2025, 6, 34. [Google Scholar] [CrossRef]
  49. Naiman, R.J.; Melillo, J.M.; Hobbie, J.E. Ecosystem Alteration of Boreal Forest Streams by Beaver (Castor canadensis). Ecology 1986, 67, 1254–1269. [Google Scholar] [CrossRef]
  50. Naiman, R.J.; Pinay, G.; Johnston, C.A.; Pastor, J. Beaver Influences on the Long-Term Biogeochemical Characteristics of Boreal Forest Drainage Networks. Ecology 1994, 75, 905–921. [Google Scholar] [CrossRef]
  51. Horowitz, A.J. A Primer on Sediment-Trace Element Chemistry; USGS Open-File Report 91-76; US Geological Survey: Reston, VA, USA, 1991. [CrossRef]
  52. Gurnell, A.M. The Hydrogeomorphological Effects of Beaver Dam-Building Activity. Prog. Phys. Geogr. 1998, 22, 167–189. [Google Scholar] [CrossRef]
  53. Pollock, M.M.; Heim, M.; Werner, D. Hydrologic and Geomorphic Effects of Beaver Dams and Their Influence on Fishes. Am. Fish. Soc. Symp. 2003, 37, 213–233. [Google Scholar]
  54. Draghi, S.; Agradi, S.; Riva, F.; Tarhan, D.; Bilgiç, B.; Dokuzeylül, B.; Ercan, A.M.; Or, M.E.; Brecchia, G.; Vigo, D.; et al. Hair as a Biomonitoring Matrix for Metals and Metalloids in Mammals: A Review. Toxics 2023, 11, 49. [Google Scholar] [CrossRef]
  55. Schloemer, S.; Kaijser, W.; Hörren, T.; von Schledorn, F.; Lorenz, A.W.; Mausbach, P.; Hund, K.; Hering, D. Species Richness and Abundance of Benthic Invertebrates Are Multiplied by Beaver (Castor sp.) Activities in Small Floodplains. Freshw. Biol. 2025, 70, e70046. [Google Scholar] [CrossRef]
  56. Bryan, G.W.; Langston, W.J. Bioavailability, Accumulation and Effects of Heavy Metals in Sediments—A Review. Environ. Pollut. 1992, 76, 89–131. [Google Scholar] [CrossRef]
  57. European Parliament and Council. Regulation (EU) 2024/1991 on Nature Restoration and Amending Regulation (EU) 2022/869. Off. J. Eur. Union 2024, L 29.7.2024. Regulation (EU) 2024/1991 of the European Parliament and of the Council of 29 July 2024 on Nature Restoration and Amending Regulation (EU) 2022/869. Official Journal of the European Union 2024, L 202, 1–64. Available online: https://eur-lex.europa.eu/eli/reg/2024/1991/oj (accessed on 30 August 2025).
  58. European Commission. Common Implementation Strategy for the Water Framework Directive (2000/60/EC); Guidance Document No. 25: Chemical Monitoring of Sediment and Biota under the Water Framework Directive; Office for Official Publications of the European Communities: Luxembourg, 2009; Available online: https://circabc.europa.eu/sd/a/7f47ccd9-ce47-4f4a-b4f0-cc61db518b1c/Guidance%20No%2025%20-%20Chemical%20Monitoring%20of%20Sediment%20and%20Biota.pdf (accessed on 30 August 2025).
  59. European Commission. Guidance Document for Sediment Assessment under the Water Framework Directive; European Sediment Network (SedNet): Brussels, Belgium, 2010; Available online: https://sednet.org/download/guidance_document_for_sediment_assessment.pdf (accessed on 30 August 2025).
Figure 1. Study sites in Lithuania showing three beaver-modified wetland buffer zones (1M—Žemaitija NP, 2K—Kretinga District, 3G—Kauno Marios vicinity). Coordinates are in WGS84 (EPSG:4326). Major cities are shown for orientation (Python-based).
Sustainability 17 09892 g001
Figure 2. Cross-matrix median Pb concentrations (µg g−1 DW) across three Lithuanian regions (1M, 2K, 3G) for 2022–2024. Median Pb was highest in Zone 2K for all matrices, consistent with its anthropogenic load, while Zones 1M and 3G showed near-background values (Python-based).
Sustainability 17 09892 g002
Figure 3. Distribution of Pb concentrations (µg g−1 DW) across matrices (fur, plants, sediments) for 2022–2024 (Python-based). Distribution of Pb concentrations (µg g−1 DW) in bottom sediments inside and outside beaver dams (Python-based). Blue line represents the median, green triangle indicates the mean value.
Sustainability 17 09892 g003
Figure 4. Median Pb concentrations in riparian vegetation along buffer-zone transects at increasing distances (10–50 m) from the water edge across the three study regions (1M—Žemaitija NP, 2K—Kretinga District, 3G—Kauno Marios vicinity; 2022–2024). Dots represent individual observations (jittered for visibility); solid lines with error bars show medians ± IQR, and dashed lines depict LOWESS-smoothed trends fitted to raw data. The mid-distance peak (20–30 m) is most pronounced in region 2K, consistent with the Jonckheere–Terpstra trend test (p < 0.01) (Python-based). Median Pb concentrations (µg g−1 DW) in riparian vegetation along buffer-zone transects at increasing distances (10–50 m) from the water edge across the three study regions: 1M (Žemaitija NP, orange), 2K (Kretinga District, blue), and 3G (Kauno Marios vicinity, green). Dots represent individual observations (jittered for visibility); solid lines with error bars show medians ± IQR; dashed lines depict LOWESS-smoothed trends fitted to raw data. The mid-distance peak (20–30 m) is most pronounced in region 2K, consistent with the Jonckheere–Terpstra trend test (p < 0.01) (Python-based).
Sustainability 17 09892 g004
Figure 5. Lead (Pb) concentrations in beaver fur by region and season.Squares indicate reverse Kaplan–Meier medians ± interquartile ranges (IQR), accounting for left-censored data below the detection limit (LOD = 0.05 µg g−1 DW).Semi-transparent dots represent detected values; numbers show detection frequencies (%) per group.Note the log-scaled y-axis for clarity of inter-regional contrasts (Python-based).
Sustainability 17 09892 g005
Table 1. Cross-matrix summary of Pb concentrations (µg g−1 DW) across three Lithuanian regions (2022–2024).
MatrixMedian [IQR]RangeSQGRegional range
Sediments19.0 [15.3]4.3–68.725 (TEL)–91 (PEL) *10–80 (Baltic/Scandinavia) **
Plants2.0 [2.9]0.7–9.70.3–5.0 (wetland macrophytes)
Fur22.8 [5.2]0.05–82.60.5–20.0 (Castor spp.)
* CCME (1999)—Canadian Sediment Quality Guidelines, Pb TEL = 35 µg g−1, PEL = 91 µg g−1; ** Nordic wetland and river sediment data, e.g., [45,46].
Table 2. Detection frequency of Pb by matrix (2022–2024).
Matrixn<LOD (%)LOD–LOQ (%)>LOQ (%)Median (µg g−1)Range (µg g−1)
Sediments2100010020.485.08–45.10
Plants21034932.110.01–9.67
Beaver fur913206822.810.05–82.56
Disclaimer/Publisher’s Note: The statements, opinions and data contained in all publications are solely those of the individual author(s) and contributor(s) and not of MDPI and/or the editor(s). MDPI and/or the editor(s) disclaim responsibility for any injury to people or property resulting from any ideas, methods, instructions or products referred to in the content.