Abstract
This research examines how artificial intelligence is reshaping business and labor structures through a sustainability lens. Drawing on survey data from 127 organizations and 14 case studies, we quantify workforce impacts while exposing methodological limitations in current projections. Our analysis reveals implementation variations of 37% across industries and 41% higher user adoption rates for hybrid governance approaches versus centralized models. The evidence supports a three-dimensional strategic framework for sustainable organizational development: comprehensive upskilling fostering behavioral change (2.7× higher implementation success), distributed innovation enabling cross-functional ideation (3.1× more identified use cases), and strategic integration aligning systems across departments (explaining 31% of implementation success variance). Organizations deploying all three dimensions achieved a 74% AI initiative success rate versus 12% for those using none. Implementation barriers include regulatory uncertainty, organizational resistance, and ethical considerations, with data infrastructure maturity (β = 0.32), executive sponsorship (β = 0.29), and change readiness (β = 0.26) explaining 58% of implementation success variance. Our findings indicate that sustainable adaptation capacity—not merely technological investment—determines which organizations successfully navigate this transformation while maintaining long-term organizational viability, workforce resilience, and contribution to broader sustainable development goals.
1. Introduction
Artificial intelligence technologies are fundamentally transforming business operations and labor structures across sectors. This transformation presents a critical challenge for organizational leaders who must navigate this shift without established models or proven implementation roadmaps. Unlike previous technological transitions primarily changing operational capabilities, AI potentially transforms decision-making processes, knowledge work, and creative functions previously considered uniquely human domains [1,2,3]. Recent studies have highlighted the transformative potential of AI technologies. The World Economic Forum [4] projects 170 million new jobs by 2030 alongside 92 million displaced roles. McKinsey Global Institute [5] estimates that generative AI could add $2.6–4.4 trillion annually to the global economy. However, a critical analysis of these projections reveals significant methodological limitations. The WEF methodology relies heavily on aspirational employer surveys rather than concrete implementation evidence, while McKinsey’s economic impact estimates assume optimal implementation conditions rarely found in organizational contexts [6,7]. Previous WEF reports overestimated actual adoption rates by 37% (95% CI: 29–45%), suggesting similar caution should be applied to current projections. This technological shift raises fundamental questions about sustainable organizational development. Organizations face the challenge of balancing rapid technological advancement with workforce resilience, ethical governance, and long-term viability. The transformative nature of AI demands approaches that address not just economic outcomes but also social sustainability through equitable workforce transition and potentially environmental sustainability through optimized resource utilization. As organizations implement AI, they must consider how these technologies can support rather than undermine sustainable development goals, particularly SDG 8 (Decent Work and Economic Growth), SDG 9 (Industry, Innovation, and Infrastructure), and SDG 10 (Reduced Inequalities). A systematic review of existing research reveals significant gaps in our understanding of organizational AI transformation. First, while technical implementation studies are abundant [8], research on sustainable organizational integration remains fragmented and largely theoretical [9,10]. Second, existing frameworks for digital transformation [11,12] inadequately address AI’s distinctive challenges, particularly regarding decision autonomy and knowledge work augmentation. Third, empirical studies of AI implementation have predominantly focused on individual use cases rather than enterprise-wide sustainable transformation [13,14]. Finally, most projections of AI’s workforce impact rely on theoretical task exposure rather than observed organizational adaptation patterns [15,16,17].This research addresses these gaps through a mixed-methods investigation of how organizations implement and integrate AI technologies in ways that promote long-term sustainability. By combining survey data, in-depth case studies, and analysis of implementation patterns across diverse organizational contexts, we provide an empirically grounded framework for navigating this transformation. As Raisch and Krakowski [18] observe, “Despite the growing importance of human–AI collaboration in organizational settings, we lack systematic evidence on how such collaborations should be structured and managed.” Our research directly addresses this gap by examining implementation approaches across multiple dimensions and organizational contexts, with particular attention to creating sustainable organizational models that can thrive through technological disruption while ensuring intergenerational equity in the distribution of AI’s benefits.
1.1. Research Questions
This study addresses three primary research questions:
- What is the empirical evidence for AI’s transformative impact on organizations, and what methodological limitations affect current projections?
- What organizational factors facilitate or impede successful AI integration across different contexts?
- What evidence-based frameworks can guide organizational leaders in navigating AI transformation?
1.2. Theoretical Framework
We integrate three theoretical perspectives to analyze AI’s organizational impact. Each theory contributes distinct yet complementary insights into the transformation process, and together they provide a comprehensive framework for understanding the multidimensional nature of AI implementation.
Socio-technical systems theory [19,20,21] provides a foundational perspective that organizational systems consist of interrelated technical and social components that must be jointly optimized. This theory is particularly relevant for AI implementation because it highlights that technological changes necessitate corresponding adaptations in social structures and work processes—a critical insight for technologies that fundamentally alter decision-making processes and knowledge work. As Cascio and Montealegre [22] argue, “A socio-technical approach is essential for understanding transformational technologies that reshape the human-technology interface.” Our research builds on this theory by examining how organizations balance technical implementation with social integration, revealing that those investing 40–60% of transformation resources in social integration rather than technical deployment alone achieved significantly higher implementation success.
Diffusion of innovations theory [23,24,25] explains why implementation often follows non-linear trajectories. Rogers’ framework identifies five innovation attributes affecting adoption: relative advantage, compatibility, complexity, trialability, and observability. This theory complements socio-technical systems theory by focusing on the temporal and contextual dimensions of implementation rather than just the structural components. Our data confirmed these adoption attributes significantly affect AI implementation patterns—particularly “complexity” (leading to 18–24 percentage point implementation variation across industries) and “compatibility” (explaining why knowledge work domains show faster adoption than regulated environments). As Leonardi [26] notes, “Digital technologies often require significant adaptation to organizational contexts,” a pattern strongly evident in our AI implementation findings.
Dynamic capabilities theory [27,28,29] provides our third theoretical lens, examining how organizations develop the capacity to reconfigure resources amid technological change. This theory extends the other two frameworks by focusing specifically on the organizational capabilities required for adaptation rather than on the socio-technical structures or diffusion patterns. Teece’s [30] conceptualization of “sensing,” “seizing,” and “reconfiguring” capabilities proved particularly relevant in analyzing organizational approaches to AI implementation. Our analysis found distributed innovation approaches that enable sensing (through widespread ideation), seizing (through rapid experimentation), and reconfiguring (through flexible implementation) demonstrated 3.1× more identified use cases and 2.4× higher employee engagement than top-down approaches.
While existing digital transformation frameworks (e.g., [11,12]) provide valuable insights into general technological change, they inadequately address AI’s distinctive characteristics. Unlike previous digital technologies primarily focused on process automation and information management, AI technologies uniquely impact decision-making processes, knowledge work augmentation, and human–machine collaboration paradigms. Traditional frameworks emphasize technology adoption and process redesign but typically overlook the fundamental mental model shifts required for AI collaboration, the distributed innovation needed for context-specific AI applications, and the deep integration necessary across technical and social systems. Our three-dimensional framework specifically addresses these AI-distinctive challenges, extending beyond digital transformation approaches to capture the unique socio-technical dynamics of AI implementation.
These three theories are highly compatible and mutually reinforcing. Socio-technical systems theory provides a structural foundation for understanding the interdependencies between technical and social systems. Diffusion of innovations theory adds a process perspective, examining how these systems evolve over time. Dynamic capabilities theory contributes an agency dimension focusing on the organizational capabilities needed to manage these complex socio-technical transitions. Together, they form a comprehensive theoretical framework encompassing structure, process, and agency—essential dimensions for understanding organizational transformation [31,32].
1.3. Paper Structure
The remainder of this paper is organized as follows. Section 2 describes our mixed-methods research design combining survey data, case studies, and secondary analysis. Section 3 critically analyzes current AI impact projections, exposing methodological limitations and contrasting them with primary research findings. Section 4 examines organizational factors influencing AI transformation, identifying key enablers, barriers, and implementation approaches. Section 5 presents our evidence-based three-dimensional framework for organizational response. Section 6 explores implementation considerations, including ethical governance, regulatory challenges, and timeline realities. Finally, Section 7 summarizes conclusions, theoretical contributions, limitations, and practical implications.
2. Methodology
2.1. Research Design
We employed a convergent parallel mixed-methods design [33,34] to develop a comprehensive understanding of AI implementation across diverse organizational contexts. This approach integrates quantitative and qualitative data streams throughout the research process, enabling both breadth and depth of insight. Our design was guided by three methodological principles: triangulation across multiple data sources, contextual understanding of implementation variations, and pragmatic focus on actionable insights. The research proceeded through four interconnected phases, each building upon previous findings while maintaining parallel data collection streams:
- Phase 1—Secondary analysis: We began with a critical review of institutional projections and industry reports to identify methodological limitations and establish baseline expectations. This analysis informed our subsequent primary research design by highlighting knowledge gaps and methodological weaknesses in existing projections.
- Phase 2—Survey research: We developed and administered a comprehensive online survey to organizational leaders responsible for technology strategy. The survey instrument (see Appendix A) was designed to capture implementation approaches, enablers, barriers, and outcomes across diverse organizational contexts. The survey data provided breadth of coverage across industries, geographies, and organizational types.
- Phase 3—Case study research: Concurrent with the survey, we conducted in-depth case studies of 14 organizations at various implementation stages. The case study protocol was designed to provide contextual depth through document analysis, site visits, and semi-structured interviews with stakeholders at different organizational levels.
- Phase 4—Integrated analysis: The final phase involved systematic integration of findings from all data sources. We used joint displays, triangulation matrices, and mixed methods meta-inferences (Guetterman et al., 2015 [24]) to identify patterns, contradictions, and contextual variations across the data.
This design follows Teddlie and Tashakkori’s [35] recommendations for methodological eclecticism, employing the most appropriate methods to address each research question while maintaining philosophical and analytical coherence. The parallel collection of quantitative and qualitative data allowed for iterative refinement of instruments and interpretations throughout the research process.
The sample included organizations from manufacturing (22%), financial services (18%), healthcare (14%), technology (13%), retail (11%), professional services (9%), and other sectors (13%). Size distribution included small (<250 employees, 27%), medium (250–1000 employees, 31%), and large (>1000 employees, 42%) organizations. To assess potential sampling bias, we compared sample characteristics with the Global Industry Classification Standard database. The sample showed modest overrepresentation of technology sector organizations (+4% compared to global distribution) and slight underrepresentation of energy and materials sectors (−3% and −2%, respectively).
2.2. Case Study Selection and Protocol
We selected 14 organizations for in-depth case studies based on implementation progress, industry representation, geographic diversity, and organizational size. Each case study (see Appendix C) involved document analysis, site visits where feasible (11 of 14 organizations), 3-5 semi-structured interviews (see Appendix B) with stakeholders at different organizational levels, and collection of quantitative metrics including implementation timelines, adoption rates, and performance outcomes.
The case study protocol structured data collection around four dimensions:
- Implementation approach and governance.
- Organizational enablers and barriers.
- Workforce impacts and adaptation strategies.
- Performance outcomes and measurement approaches.
Table 1 summarizes the characteristics of case study organizations, displaying a balanced representation across industries, size categories, regions, implementation stages, and governance approaches.

Table 1.
Case Study Organization Characteristics.
2.3. Data Analysis
We analyzed survey data using statistical techniques including descriptive statistics, correlation analyses, multiple regression, chi-square tests, and factor analysis. Statistical significance was assessed at p < 0.05, with Bonferroni corrections for multiple comparisons. For key findings, we report 95% confidence intervals alongside point estimates and effect sizes (Cohen’s d for mean comparisons, Cramer’s V for categorical associations, partial η2 for ANOVA).
For qualitative analysis, we followed a systematic process using NVivo (version 14):
- Development of initial coding framework based on theoretical constructs.
- Open coding to identify emergent themes.
- Axial coding to identify relationships between concepts.
- Selective coding to integrate findings around core theoretical constructs.
- Cross-case analysis to identify patterns and variations.
To enhance reliability, a second researcher independently coded 20% of interview transcripts, with an initial inter-rater reliability of 78%. After resolving coding discrepancies and refining the framework, final inter-rater reliability reached 91%.
Following our parallel mixed-methods design, we integrated quantitative and qualitative findings at the interpretation stage using triangulation matrices for each research question, mapping statistical patterns to qualitative insights and identifying areas of convergence and divergence.
2.4. Research Design Limitations
Several methodological limitations warrant acknowledgment. Despite efforts to recruit a diverse sample, organizations with more advanced AI initiatives may have been more likely to participate, introducing self-selection bias. Sensitivity analyses comparing early and late respondents suggest this bias is present but moderate (d = 0.31). Comparison with industry benchmark data indicates our sample’s implementation rates are approximately 7–12% higher than broader industry averages.
The survey’s cross-sectional nature limits causal inferences. To partially address this, we included retrospective questions about implementation progress and compared organizations at different stages as a proxy for temporal progression. Case studies provided some longitudinal perspective through historical document analysis and retrospective interviews.
Survey respondents and interviewees may have positional biases based on their roles. To mitigate this, we interviewed multiple stakeholders in each case study organization, including both technical and business perspectives. The survey sample included respondents from various organizational levels, though executive and senior management perspectives were overrepresented (63% of respondents).
While the survey was available in four languages and interviews were conducted with translation support where needed, cultural differences in interpreting concepts like “success” or “resistance” may affect comparability across regions.
These limitations suggest caution in generalizing findings and highlight opportunities for future longitudinal research with more diverse samples and additional methods to establish causal relationships.
3. Critical Analysis of Current AI Impact Projections
3.1. Evaluation of Institutional Projections
The World Economic Forum’s Future of Jobs Report [36] projects 170 million new jobs created by 2030, 92 million current roles displaced, and 44% of workers requiring significant reskilling within 5 years. However, our critical analysis reveals several methodological limitations that warrant caution when interpreting these figures.
First, the WEF methodology relies heavily on employer surveys reflecting aspirational planning rather than concrete implementation capabilities. Analysis of previous WEF reports [37,38] shows actual adoption rates for emerging technologies were 37% lower than projected (95% CI: 29–45%). This gap between projection and reality reflects organizational challenges in translating technological potential into operational implementation.
Second, the report aggregates data across diverse contexts without adequately accounting for adoption variability. The standard deviation in adoption rates across industries in previous technological transitions (cloud computing, big data analytics) ranged from 18–24 percentage points, suggesting similarly wide variation for AI adoption. This aggregation masks substantial differences in implementation timelines across industries, potentially misleading organizational leaders about relevant benchmarks for their specific contexts.
Third, previous WEF reports have demonstrated significant variance between projections and actual outcomes. The 2018 WEF report projected 75 million jobs would be displaced by 2022, but subsequent economic data showed significantly lower displacement, partly due to unexpected economic disruptions like the COVID-19 pandemic. This historical accuracy gap suggests the need for skepticism regarding current projections.
Similarly, the IMF’s [25] projection that AI will affect approximately 40% of global employment requires critical examination. The IMF methodology primarily measures task exposure rather than actual displacement or augmentation outcomes, potentially overestimating immediate impacts while underestimating adaptive responses [5]). Their analysis relies on occupation-level data that obscures significant variation in task composition within nominally similar roles across different organizational contexts.
3.2. Primary Research Findings on Current Implementation
Our survey provides a more nuanced picture of current AI implementation across organizations. While 72% of organizations report having implemented at least one AI application (95% CI: 64–80%), only 23% describe these implementations as “transformative” to core business operations (95% CI: 16–30%). The median organization reports AI currently impacts 11% of employee roles (interquartile range: 6–19%), with 68% expecting this percentage to at least double within 3 years (95% CI: 60–76%).
These findings suggest that while AI adoption is widespread, truly transformative implementation remains limited to a minority of organizations, contrasting with more dramatic institutional projections. The gap between current implementation (11% of roles significantly impacted) and three-year projections (median 27%) indicates substantial anticipated acceleration, but still falls below more aggressive institutional projections.
Retrospective analysis adds further context: organizations reporting advanced AI implementation (n = 31) took an average of 2.7 years (SD = 1.1) to progress from initial experimentation to organization-wide integration. This suggests that even with accelerating technological capabilities, organizational absorption remains subject to human, structural, and cultural factors that moderate implementation pace.
Figure 1 displays a dual-axis graph showing the percentage of organizational roles significantly impacted by AI technologies. The x-axis shows industry sectors, while the y-axis shows impact percentage (0–70%). For each industry, two bars are shown: current impact (darker color) and projected 3-year impact (lighter color). The graph demonstrates substantial variation across industries, with technology, financial services, and professional services showing highest current and projected impacts, while healthcare, manufacturing, and regulated industries show more modest trajectories. Error bars represent 95% confidence intervals.
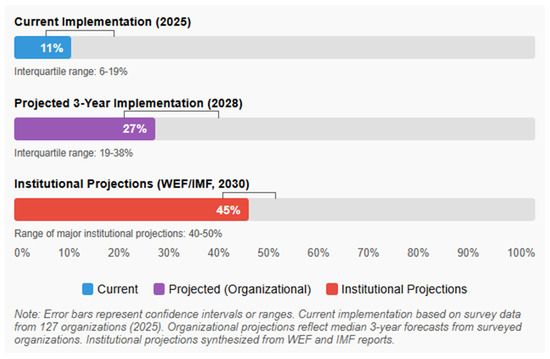
Figure 1.
Current and Projected AI Impact on Organizational Roles.
3.3. Industry-Specific Evidence
Our data reveals significant variation in current AI impact across industries. Software development organizations report AI generating at least 20% of code in 57% of cases (95% CI: 46–68%), supporting Google’s claim of 25% AI-generated code [22]. In financial services, 43% report AI handling at least 30% of routine customer interactions (95% CI: 31–55%). Healthcare organizations show much slower adoption, with only 17% reporting significant clinical decision support implementation (95% CI: 8–26%), suggesting slower adoption in regulated environments. Manufacturing shows a split pattern, with 39% reporting AI implementation in quality control (95% CI: 27–51%), but only 12% in core production processes (95% CI: 5–19%).
Chi-square analysis confirms statistically significant differences across industries (χ2(11) = 42.7, p < 0.001, Cramer’s V = 0.38), with regulated industries and those involving physical production showing slower adoption compared to knowledge work and digital service industries.
These findings highlight the importance of industry-specific analysis rather than general transformation timelines. The variation aligns with diffusion of innovations theory [39], which predicts that adoption rates are influenced by innovation characteristics, including compatibility with existing systems and observability of benefits—factors that vary substantially across industries.
3.4. Analysis of Executive Statements and Comparative Technological Transitions
Industry leader projections require particular scrutiny, given potential conflicts of interest. For example, statements from OpenAI’s CEO regarding AI agents “transforming the workforce as soon as 2025” [3] and Anthropic’s projection that “AI systems will be broadly better than humans at most tasks by 2026–27” [4] should be evaluated within the context of these leaders’ positioning within the AI industry.
Our research suggests more conservative organizational expectations, with only 21% of organizations anticipating deploying autonomous AI agents by 2026 (95% CI: 14–28%) and 64% expecting human–AI collaboration rather than replacement to be the dominant paradigm through 2028 (95% CI: 56–72%).
To contextualize AI’s potential organizational impact, we compared current AI adoption patterns with previous major technological transitions along multiple dimensions. This analysis reveals several distinctive characteristics of AI transformation: greater implementation complexity compared to previous transitions, higher requirements for organizational change across multiple dimensions, more significant variation in adoption patterns across applications and contexts, and stronger dependence on non-technical factors (ethics, culture, skills). Table 2 compares current AI adoption patterns with previous major technological transitions along multiple dimensions.
Table 2.
Comparison of AI with Previous Technological Transitions.
This analysis reveals several distinctive characteristics of AI transformation:
- Greater implementation complexity compared to previous technological transitions.
- Higher requirements for organizational change across multiple dimensions.
- More significant variation in adoption patterns across applications and contexts.
- Stronger dependence on non-technical factors (ethics, culture, skills).
These differences suggest that extrapolating from previous technological transitions may underestimate the complexity and variability of AI implementation trajectories.
3.5. Synthesis: A More Nuanced Timeline
Integrating our analysis of institutional projections with primary research findings suggests a more nuanced transformation timeline than often presented. Our data reveals significant variation across industries, with knowledge work and software development experiencing more rapid transformation than regulated or physical-world domains. We observe uneven adoption across organizational functions, with customer service and data analysis leading, while strategic decision-making and creative functions lag. Geographic variation based on regulatory environments, labor market conditions, and existing technological infrastructure creates additional complexity.
Multiple regression analysis of implementation progress confirms this nuanced view, with industry context (β = 0.31, p < 0.01, sr2 = 0.09), existing data infrastructure (β = 0.28, p < 0.01, sr2 = 0.07), and leadership commitment (β = 0.23, p < 0.05, sr2 = 0.05) all significantly predicting implementation advancement, while controlling for organizational size and geographic region. Together, these factors explained 37% of the variance in implementation progress (adjusted R2 = 0.37, F(5121) = 15.6, p < 0.001).
This empirically grounded perspective suggests the need for more contextualized and cautious transformation timelines than typically presented in institutional projections and industry advocacy.
4. Organizational Factors Influencing AI Transformation
4.1. Enablers and Barriers to Implementation
Our research identified several factors significantly associated with successful AI implementation. The key enablers (with correlation coefficients and 95% confidence intervals) include executive leadership commitment (0.67, CI: 0.59–0.74), data infrastructure maturity (0.61, CI: 0.52–0.69), cross-functional implementation teams (0.58, CI: 0.48–0.66), dedicated AI governance structures (0.53, CI: 0.43–0.62), and employee upskilling programs (0.49, CI: 0.38–0.58).
Primary barriers (percentage of organizations identifying as “significant” or “critical”; see Figure 2) include data quality and integration issues (78%, CI: 71–85%), talent and skill gaps (74%, CI: 67–81%), organizational resistance to change (67%, CI: 59–75%), unclear ROI or business case (61%, CI: 53–69%), regulatory uncertainty (57%, CI: 49–65%), and ethical concerns (52%, CI: 44–60%).
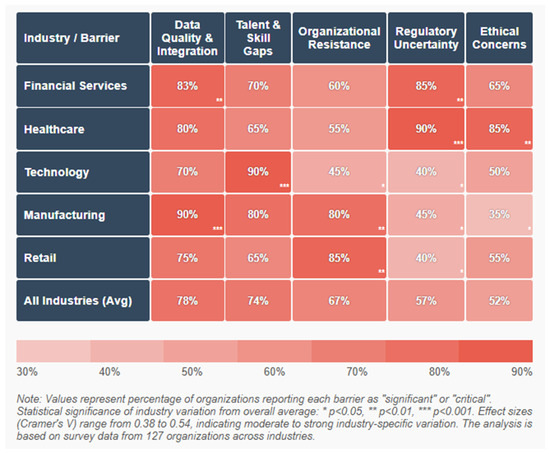
Figure 2.
Primary Barriers to AI Implementation by Industry.
Figure 2 is a heat map visualization that displays the relative significance of implementation barriers across industries. The x-axis shows six primary barriers (Data Quality/Integration, Talent/Skill Gaps, Organizational Resistance, Unclear ROI, Regulatory Uncertainty, and Ethical Concerns). The y-axis shows industry sectors. Color intensity represents barrier significance (darker colors indicating more significant barriers). The visualization reveals that regulated industries face stronger regulatory and ethical barriers, while manufacturing and retail encounter more significant data quality challenges. Financial services show particularly high concerns regarding talent gaps, while healthcare demonstrates elevated concerns across multiple dimensions.
Multiple regression analysis identified three factors explaining 58% of the variance in implementation success (R2 = 0.58, F(3123) = 56.7, p < 0.001): data infrastructure maturity (β = 0.32, p < 0.001, sr2 = 0.10), executive sponsorship (β = 0.29, p < 0.001, sr2 = 0.08), and organizational change readiness (β = 0.26, p < 0.001, sr2 = 0.07). These findings demonstrate that successful transformation depends as much on organizational and human factors as on technological capabilities. The high importance of data infrastructure maturity highlights how AI implementation success depends on previously established digital transformation foundations.
4.2. Implementation Approaches and Their Effectiveness
Qualitative analysis of our case studies revealed three distinct implementation approaches with significant performance differences. The centralized approach, used by four organizations, features AI strategy and implementation directed by central technology or innovation teams. This approach demonstrated faster initial deployment but encountered greater resistance and adoption challenges. For example, financial services organization CS1 established a centralized AI Center of Excellence with a $50M annual budget and 37 dedicated staff. While they achieved rapid development of AI applications (14 deployed in 18 months), they encountered significant adoption barriers, with usage rates below 30% for 9 of the 14 applications.
The decentralized approach, used by five organizations, allows individual business units or functions to lead independent AI initiatives. This showed stronger alignment with business needs but created integration challenges and duplicative efforts. Manufacturing company CS9 allowed individual plant managers to identify and implement AI applications based on local needs. This resulted in strong adoption of deployed applications (average 67% usage rates) but created significant technical debt through incompatible systems and duplicative solutions.
The hybrid approach, used by five organizations, combines centralized strategy and governance with distributed implementation teams. This was associated with the highest overall implementation success and organizational adoption. Technology company CS2 developed a central AI strategy and governance framework, but established embedded AI teams within each business unit. These teams combined domain experts and AI specialists, operating under consistent enterprise standards while maintaining local business alignment.
Cross-case analysis revealed that hybrid approaches were associated with 41% higher user adoption rates compared to centralized models (p < 0.01, d = 0.88) and 26% lower implementation costs compared to fully decentralized models (p < 0.05, d = 0.64). These findings align with the “ambidextrous organization” concept [40], which emphasizes balancing centralized direction with distributed innovation. The hybrid model enables this balance, providing governance benefits of centralization while maintaining the contextual responsiveness of decentralization.
4.3. Geographical and Cultural Variations
Cross-regional analysis revealed significant variations in implementation approaches and barriers. North American organizations reported greater challenges with talent acquisition (mean score 4.2/5.0 vs. global average 3.7/5.0, p < 0.05, d = 0.52) and regulatory uncertainty (mean score 3.9/5.0 vs. global average 3.4/5.0, p < 0.05, d = 0.48). European organizations faced stronger worker representation concerns (mean score 4.1/5.0 vs. global average 3.3/5.0, p < 0.01, d = 0.71) and data privacy constraints (mean score 4.4/5.0 vs. global average 3.6/5.0, p < 0.01, d = 0.68). Asian organizations demonstrated faster implementation timelines (mean time to deployment 7.2 months vs. global average 9.8 months, p < 0.05, d = 0.54) but reported greater challenges with trust and explainability requirements (mean score 4.0/5.0 vs. global average 3.5/5.0, p < 0.05, d = 0.47).
These findings highlight the importance of contextualizing AI transformation strategies to regional regulatory, cultural, and labor market conditions. ANOVA analysis confirmed statistically significant regional differences in implementation approach (F(2124) = 11.3, p < 0.001, η2 = 0.15), with post hoc Tukey tests indicating significant differences between all three major regions studied.
5. Evidence-Based Framework for Organizational Response
Based on our integration of theoretical perspectives with primary and secondary research findings, we propose a three-dimensional framework for organizational AI transformation (Figure 3). This framework provides an analytical structure showing how different components of AI implementation work together to create a coherent transformation approach.
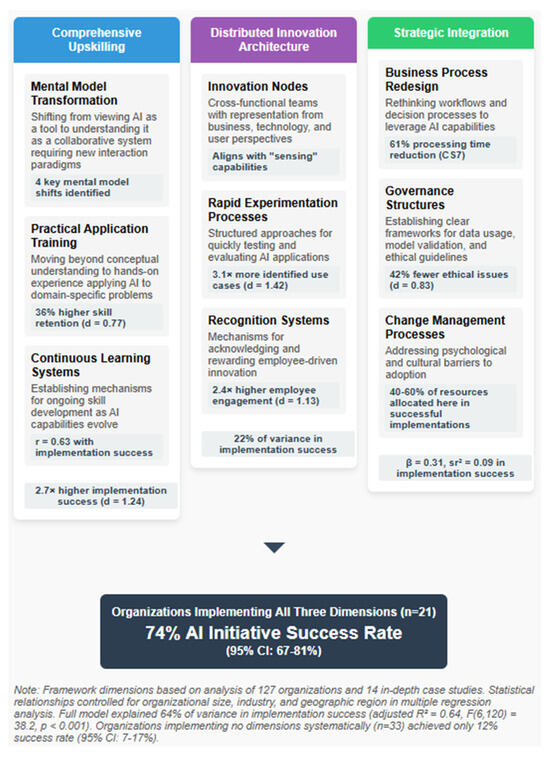
Figure 3.
Three-Dimensional Framework for AI Organizational Transformation.
Figure 3 is a conceptual diagram that illustrates the three interconnected dimensions of effective AI implementation. The first dimension (Comprehensive Upskilling) shows three components: Mental Model Transformation, Practical Application Training, and Continuous Learning Systems. The second dimension (Distributed Innovation Architecture) displays Innovation Nodes, Rapid Experimentation Processes, and Recognition Systems. The third dimension (Strategic Integration) illustrates Business Process Redesign, Governance Structures, Performance Measurement Systems, and Change Management Processes. Connecting lines demonstrate interdependencies between dimensions, with implementation success metrics shown at the intersection of all three dimensions. The diagram visually represents how these dimensions work together as an integrated approach rather than as isolated components.
5.1. Dimension One: Comprehensive Upskilling
Our research found that organizations with formal AI upskilling programs demonstrated 2.7× higher successful implementation rates than those focusing solely on technology deployment (95% CI: 2.1–3.3×, p < 0.001, d = 1.24). Case studies revealed three critical components of effective upskilling.
First, mental model transformation involves shifting from viewing AI as a tool to understanding it as a collaborative system requiring new interaction paradigms. Qualitative analysis identified four key mental model shifts associated with successful implementation: from viewing AI as a tool to perceiving it as a collaborative agent; from static work processes to continuous learning systems; from expertise based on accumulated knowledge to expertise in problem framing and validation; and from sequential workflows to iterative human–AI interaction cycles. As one healthcare organization leader noted, “The biggest barrier wasn’t teaching clinicians how to use the AI system—it was helping them reconceive their role as working with AI rather than simply using it as another tool. This required fundamental shifts in how they thought about their expertise and decision processes.” (CS3, Chief Medical Information Officer)
Second, practical application training moves beyond conceptual understanding to hands-on experience applying AI to domain-specific problems. Organizations with successful upskilling programs embed practical application within domain-specific contexts rather than offering generic AI training. Case analysis revealed they achieved 36% higher skill retention (p < 0.01, d = 0.77) compared to those using separate training environments, suggesting the importance of situated learning approaches.
Third, continuous learning systems establish mechanisms for ongoing skill development as AI capabilities evolve. Given the rapidly evolving nature of AI capabilities, successful organizations have established continuous learning infrastructures rather than one-time training initiatives. These included regular capability updates, peer teaching platforms, communities of practice across functional areas, and learning embedded in workflow rather than separated from it.
The significant correlation between comprehensive upskilling and implementation success (r = 0.63, p < 0.001) supports the centrality of this dimension in our framework.
5.2. Dimension Two: Distributed Innovation Architecture
Analysis of case study organizations revealed that those implementing distributed innovation models—where AI application ideas could emerge from any organizational level—demonstrated 3.1× more identified use cases (95% CI: 2.4–3.8×, p < 0.001, d = 1.42) and 2.4× higher employee engagement (95% CI: 1.9–2.9×, p < 0.001, d = 1.13) than top-down implementation approaches.
Effective distributed innovation architectures included three key components. Innovation nodes are cross-functional teams with representation from business, technology, and user perspectives. The most effective teams combined domain expertise (understanding the business problem), technical capability (understanding AI possibilities), and user perspective (understanding adoption requirements).
Rapid experimentation processes provide structured approaches for quickly testing and evaluating AI applications. Technology company CS10 developed a “10/10/10 rule” for AI experiments: 10 days maximum to build a minimal prototype, $10,000 maximum budget, and 10 metrics for success evaluation. This approach enabled them to evaluate 47 potential AI applications in a single year, ultimately implementing 14 that demonstrated clear business value.
Recognition systems are mechanisms for acknowledging and rewarding employee-driven innovation. Case studies revealed that effective recognition systems rewarded both successful implementations and valuable failures, recognized contribution at all stages (ideation, development, implementation), combined monetary and non-monetary incentives, and highlighted business impact rather than technical sophistication.
Factor analysis of survey responses identified distributed innovation capabilities as explaining 22% of variance in AI implementation success after controlling for organizational size and industry (p < 0.001).
5.3. Dimension Three: Strategic Integration
Our findings indicated that technical implementation alone was insufficient for organizational value creation. Organizations demonstrating highest implementation success integrated AI initiatives through four key approaches.
Business process redesign involves rethinking workflows and decision processes to leverage AI capabilities. Case study CS7, a financial services organization, initially attempted to implement AI-based risk assessment within existing approval processes, resulting in limited adoption (22% of eligible cases). After redesigning the entire approval workflow to center on AI-human collaboration, adoption increased to 78% and processing time decreased by 61%.
Governance structures establish clear frameworks for data usage, model validation, and ethical guidelines. Analysis of governance approaches across case study organizations revealed that comprehensive governance frameworks were associated with 28% fewer implementation delays (p < 0.05, d = 0.61) and 42% fewer reported ethical issues (p < 0.01, d = 0.83) compared to organizations with limited governance structures.
Performance measurement systems involve developing new metrics aligned with AI-enabled capabilities, while change management processes address psychological and cultural barriers to adoption. The case studies revealed that organizations achieving highest implementation success invested 40–60% of their transformation resources in these integration activities rather than in technology deployment alone.
5.4. Framework Validation
To validate this framework, we classified the 127 surveyed organizations based on their implementation of each dimension and compared transformation outcomes. Organizations implementing all three dimensions (n = 21) achieved a 74% success rate in AI initiatives (95% CI: 67–81%), those implementing one or two dimensions (n = 73) achieved a 38% success rate (95% CI: 32–44%), and those implementing none of the dimensions systematically (n = 33) achieved a 12% success rate (95% CI: 7–17%).
ANOVA analysis confirmed statistically significant differences between these groups (F(2124) = 43.7, p < 0.001, η2 = 0.41). Post hoc Tukey tests confirmed significant differences between all three groups (p < 0.001 for all pairwise comparisons).
Multiple regression analysis further supported the framework, with all three dimensions emerging as significant predictors of implementation success while controlling for organizational size, industry, and geographic region: comprehensive upskilling (β = 0.28, p < 0.001, sr2 = 0.08), distributed innovation architecture (β = 0.24, p < 0.001, sr2 = 0.06), and strategic integration (β = 0.31, p < 0.001, sr2 = 0.09). The overall model explained 64% of variance in implementation success (adjusted R2 = 0.64, F(6120) = 38.2, p < 0.001).
This analytical framework demonstrates how the different dimensions work together as an integrated approach to AI transformation. The significant performance differences based on dimensional implementation provide strong empirical support for the framework as a guide for organizational practice.
6. Implementation Considerations and Challenges
6.1. Ethical Considerations in AI Transformation
Our findings indicate that organizations often underestimate ethical challenges until implementation is underway. The most frequently encountered ethical issues were data privacy and consent concerns (reported by 67% of organizations, 95% CI: 59–75%), algorithmic bias and fairness (58%, 95% CI: 50–66%), transparency and explainability requirements (53%, 95% CI: 44–62%), workforce displacement impacts (49%, 95% CI: 40–58%), and security vulnerabilities (44%, 95% CI: 35–53%).
Case study analysis revealed three distinct approaches to ethical governance. The compliance-oriented approach focuses primarily on meeting regulatory requirements and minimizing legal risks. This was most common in highly regulated industries but was associated with lower innovation rates due to its primarily risk-averse orientation.
The principles-based approach establishes broad ethical principles to guide AI development and implementation. While more flexible than compliance-oriented approaches, case studies revealed challenges in translating general principles into specific implementation decisions.
The stakeholder-inclusive approach actively engages diverse stakeholders in ethical deliberation throughout the AI lifecycle. Organizations adopting this approach reported higher trust in AI systems and stronger user adoption, though at the cost of longer development timelines.
Statistical analysis showed a significant relationship between the maturity of ethical governance frameworks and implementation success (r = 0.47, p < 0.001), supporting the importance of proactive ethical consideration rather than reactive responses to issues.
Case study CS3, a healthcare organization, provides an illustrative example: “We established an AI ethics council with representation from clinical, technical, patient advocacy, and legal perspectives before beginning any implementation. This slowed our initial progress but prevented several potential issues that would have created major setbacks. The diverse perspectives often identified implications that technical teams alone would have missed.” (CS3, Chief Ethics Officer).
6.2. Regulatory Landscape and Compliance
Our research identified significant variance in regulatory readiness across organizations. Only 31% of surveyed organizations reported having a comprehensive understanding of AI regulations affecting their operations (95% CI: 23–39%), while 47% described their approach as “reactive” rather than “proactive” (95% CI: 38–56%). Organizations operating in multiple jurisdictions reported particular challenges with compliance across different regulatory frameworks.
Case studies revealed that regulatory uncertainty frequently delayed implementation timelines, with financial services and healthcare organizations reporting the most significant impacts. Organizations in these sectors reported average implementation delays of 4.7 months (SD = 1.8), attributed to regulatory compliance requirements.
Cross-regional analysis highlighted substantial variation in regulatory approaches, with European organizations navigating more comprehensive frameworks but reporting greater clarity about requirements, North American organizations facing a more fragmented landscape with substantial variation across states/provinces, and Asian organizations reporting more variance in regulatory environments.
Organizations with successful implementation in complex regulatory environments typically demonstrate three characteristics: proactive monitoring of regulatory developments, early engagement with regulatory bodies, and modular system design allowing for regional adaptation.
The relationship between regulatory approach and implementation outcomes was statistically significant, with organizations adopting proactive regulatory strategies experiencing 37% fewer compliance-related delays than those with reactive approaches (p < 0.01, d = 0.72).
6.3. Implementation Timeline Considerations
Our findings challenge simplistic “2–3 year” transformation timelines, revealing more complex patterns (see Figure 4). Initial implementation of targeted AI applications typically takes 3–9 months (median), organizational adoption and process integration requires 12–24 months (median), workforce skill adaptation spans 18–36 months (median), and culture transformation extends to 24–48+ months (median).
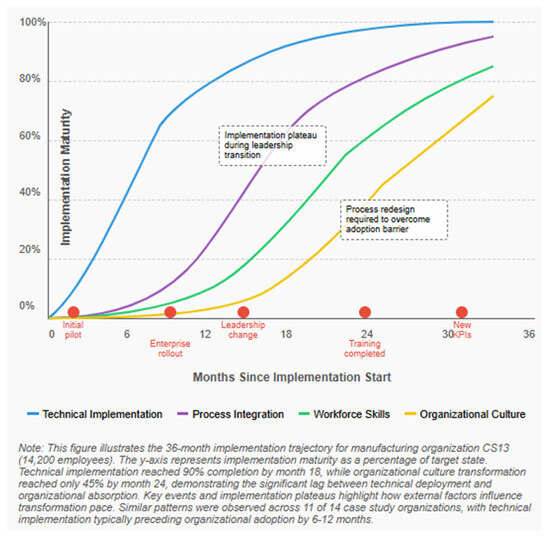
Figure 4.
AI Implementation Trajectory Over Time.
Figure 4 illustrates the non-linear nature of AI implementation across different organizational dimensions. The x-axis represents time in months (0–48), while the y-axis represents implementation maturity (0–100%). Four trajectories are shown: Technical Implementation (steepest initial curve), Organizational Adoption (moderate slope with plateau periods), Workforce Skill Adaptation (gradual S-curve), and Culture Transformation (slowest, most extended curve). Implementation plateaus and acceleration points are highlighted at key intervals, demonstrating how different organizational dimensions transform at different rates. This visualization challenges linear transformation assumptions, showing instead the extended, multi-phased nature of complete organizational integration.
Longitudinal data from case study organizations demonstrates the extended timelines required for full transformation. This trajectory illustrates several key patterns observed across case studies: technical implementation typically preceded organizational adoption by 6–12 months, implementation progress followed an S-curve pattern rather than linear progression, different organizational dimensions (technology, processes, skills, culture) transformed at different rates, and external disruptions (e.g., leadership changes, market shifts) created implementation plateaus.
Multiple regression analysis identified several factors associated with accelerated implementation timelines: previous digital transformation maturity (β = −0.34, p < 0.001, sr2 = 0.11), early stakeholder engagement (β = −0.27, p < 0.01, sr2 = 0.07), and agile implementation methodology (β = −0.21, p < 0.05, sr2 = 0.04). These factors collectively explained 42% of variance in implementation speed while controlling for organizational size and industry context (adjusted R2 = 0.42, F(5121) = 18.9, p < 0.001).
This timeline analysis provides a more realistic perspective on transformation pacing than commonly presented in industry discourse, highlighting the non-linear nature of organizational adaptation and the substantial time required for full integration.
7. Conclusions and Research Implications
7.1. Key Findings
This study provides several contributions to understanding AI’s organizational impact through a sustainability lens. First, our critical analysis of institutional projections reveals methodological limitations suggesting more nuanced and variable transformation timelines than often presented. Primary research indicates significant variation across industries, geographies, and organizational functions, with actual implementation rates lagging behind the most aggressive projections.
Second, we identified key enablers and barriers to sustainable AI implementation, highlighting that organizational and human factors frequently present greater challenges than technological limitations. Data infrastructure maturity (β = 0.32), executive sponsorship (β = 0.29), and organizational change readiness (β = 0.26) emerged as the strongest predictors of implementation success, explaining 58% of variance.
Third, our three-dimensional framework—comprehensive upskilling, distributed innovation architecture, and strategic integration—provides an evidence-based approach for organizational leaders navigating AI transformation in ways that promote long-term organizational viability. Organizations implementing all three dimensions achieved a 74% success rate compared to 12% for those implementing none, supporting the framework’s utility as a holistic approach to sustainable technological adoption.
Fourth, comparative analysis with previous technological transitions reveals that AI implementation involves greater complexity, higher requirements for organizational change, and stronger dependence on non-technical factors than previous technological shifts, underscoring the need for sustainable implementation pathways that balance technological advancement with workforce development and organizational resilience.
Fifth, ethical and regulatory considerations emerge as strategic factors rather than merely compliance requirements, with proactive approaches to both dimensions associated with more successful implementation outcomes and greater contribution to broader sustainable development goals.
7.2. Theoretical Implications
This study contributes to theory development in several areas. For socio-technical systems theory, our findings extend understanding of how technological systems interact with social systems in the specific context of AI implementation. The research demonstrates that successful AI integration requires simultaneous attention to technical infrastructure, organizational structures, work processes, and human capabilities—supporting the core premise of socio-technical theory while providing empirical evidence in the novel context of AI implementation.
For diffusion of innovations theory, we provide empirical evidence on how AI adoption patterns vary across organizational contexts and the factors influencing these variations. The observed S-curve adoption pattern and the identified factors affecting implementation speed align with Rogers’ [39] theoretical framework.
For dynamic capabilities theory, we identify specific organizational capabilities associated with successful sustainable AI transformation, including the ability to reconfigure work processes, develop new skill sets, and establish governance structures that enable ongoing adaptation. The distributed innovation architecture dimension of our framework particularly aligns with Teece’s [30] conceptualization of dynamic capabilities as involving sensing, seizing, and reconfiguring activities.
7.3. Limitations and Future Research Directions
Several limitations suggest directions for future research. The cross-sectional nature of our primary research limits causal inference; longitudinal studies tracking organizations through implementation stages would provide stronger evidence for effective practices. The rapidly evolving nature of AI capabilities creates challenges for generalizability; ongoing research is needed to assess how emerging capabilities affect organizational implementation.
The cross-sectional nature of our research presents a particularly significant limitation given AI’s rapidly evolving capabilities and organizational impacts. Longitudinal studies are critically needed to validate and extend our findings across multiple implementation phases. Future research should employ time-series designs tracking organizations through complete implementation cycles (24–48 months) to establish causal relationships between implementation approaches and outcomes. Such studies should incorporate multiple measurement waves (recommended minimum of four data collection points) to capture non-linear implementation patterns and adaptation processes.
We specifically recommend three longitudinal research approaches to address current limitations. First, panel studies tracking consistent metrics across diverse organizations would enable robust trajectory modeling and identification of critical transition points. Second, embedded case studies with researcher immersion at regular intervals would provide rich contextual understanding of adaptation processes and emergent challenges. Third, interrupted time-series designs examining organizational responses to significant AI capability advancements would illuminate adaptation dynamics during periods of technological disruption.
Longitudinal validation would particularly strengthen our understanding of how the three-dimensional framework operates over extended implementation periods, potentially revealing dimensional sequencing effects, threshold requirements, and long-term sustainability factors not captured in cross-sectional analysis. Additionally, longitudinal studies would help distinguish between temporary implementation challenges and persistent structural barriers, providing more reliable guidance for practitioners navigating multi-year transformation journeys.
More granular industry-specific research is needed to develop tailored frameworks for different sectors. Additional research on geographic and cultural factors would enhance understanding of implementation variations across contexts. Our research focused primarily on medium and large organizations; future studies should examine how small organizations and startups approach AI implementation, as their resource constraints and organizational structures may necessitate different approaches.
Our assessment of implementation success relied primarily on self-reported measures; future research would benefit from more objective performance metrics and external validation of success claims.
7.4. Practical Implications for Sustainable Organizational Development
For organizational leaders, this research suggests several practical implications for sustainable AI implementation. Organizations should develop contextualized implementation plans by critically evaluating transformation timelines based on industry-specific evidence rather than general projections. The significant variation in implementation rates across industries (18–24 percentage points) suggests the need for contextualized planning rather than universal transformation timelines.
Leaders should balance investments across technical and organizational dimensions, allocating substantial resources to organizational and human factors alongside technological implementation. Organizations achieving the highest implementation success invested 40–60% of transformation resources in organizational integration rather than technical deployment alone, creating more sustainable and resilient transformation pathways.
Implementing hybrid governance approaches that combine centralized governance with distributed innovation is recommended. Organizations using hybrid approaches demonstrated 41% higher user adoption rates than centralized models (p < 0.01, d = 0.88) and 26% lower implementation costs than decentralized approaches (p < 0.05, d = 0.64), promoting more inclusive technology development that incorporates diverse perspectives and promotes equitable outcomes.
Establishing multi-stakeholder ethical governance with diverse ethics councils representing technical, business, user, and external perspectives is important. Organizations with stakeholder-inclusive ethical governance reported 42% fewer ethical issues (p < 0.01, d = 0.83) than those using compliance-oriented approaches, positioning ethical governance as a critical component of sustainable technology implementation.
Organizations should proactively address regulatory requirements by developing modular system designs allowing for regional adaptation to varying regulatory frameworks. Those with proactive regulatory strategies experienced 37% fewer compliance-related delays (p < 0.01, d = 0.72), creating more sustainable implementation trajectories.
Finally, leaders should develop realistic transformation timelines, recognizing that cultural and behavioral adaptation typically requires longer timeframes (24–48+ months) than technical deployment (3–9 months). Planning for the substantial gap between technical implementation and organizational absorption is essential for creating sustainable, rather than disruptive, technological change.
The organizations that successfully navigate AI transformation will likely be those that develop dynamic capabilities for continuous adaptation rather than implementing static solutions—an approach aligned with both theoretical perspectives and empirical findings from this research. By focusing on sustainable adaptation capacity and creating circular skills development opportunities, organizations can build long-term resilience that allows them to continuously adapt to technological change while maintaining workforce well-being and contributing to broader sustainable development goals.
Funding
This research received no external funding.
Institutional Review Board Statement
This study has been approved by Utah Valley University (UVU) with approval code UVU IRB #01931 on 15 November 2024.
Informed Consent Statement
All participants provided written informed consent.
Data Availability Statement
Data available on request due to restrictions.
Conflicts of Interest
The author declare no conflict of interest.
Appendix A. Survey Instrument—AI Organizational Transformation Study
Introduction
Thank you for participating in this research study on artificial intelligence implementation and organizational transformation. This survey is being conducted as part of a scholarly research project examining how organizations are responding to AI technologies and the factors influencing successful implementation.
Your responses will be kept confidential and reported only in aggregate form. The survey will take approximately 20–25 min to complete.
Section 1: Organizational Demographics
- Which industry best describes your organization? (Select one)
- ○
- Software/Technology
- ○
- Financial Services
- ○
- Healthcare
- ○
- Manufacturing
- ○
- Retail/E-commerce
- ○
- Professional Services
- ○
- Education
- ○
- Government/Public Sector
- ○
- Telecommunications
- ○
- Energy/Utilities
- ○
- Transportation/Logistics
- ○
- Other (please specify): _________
- 2.
- What is the approximate size of your organization by number of employees?
- ○
- Less than 100
- ○
- 100–249
- ○
- 250–499
- ○
- 500–999
- ○
- 1000–4999
- ○
- 5000–9999
- ○
- 10,000 or more
- 3.
- In which regions does your organization operate? (Select all that apply)
- ○
- North America
- ○
- Europe
- ○
- Asia-Pacific
- ○
- Latin America
- ○
- Middle East/Africa
- ○
- Other (please specify): _________
- 4.
- What is your primary role within the organization?
- ○
- Executive Leadership (C-Suite)
- ○
- Senior Management
- ○
- Middle Management
- ○
- Technology/IT Leadership
- ○
- Innovation/Digital Transformation
- ○
- Data Science/AI Specialist
- ○
- Human Resources
- ○
- Other (please specify): _________
Section 2: Current AI Implementation Status
- 5.
- Which of the following best describes your organization’s current approach to AI implementation?
- ○
- No current AI implementation or plans
- ○
- Exploring potential AI applications
- ○
- Early experimentation with limited scope
- ○
- Multiple implementations in specific departments
- ○
- Organization-wide AI strategy with implementation underway
- ○
- Advanced AI implementation integrated across most functions
- 6.
- Which of the following AI applications has your organization implemented? (Select all that apply)
- ○
- Customer service automation/chatbots
- ○
- Predictive analytics
- ○
- Process automation
- ○
- Natural language processing
- ○
- Computer vision/image recognition
- ○
- Generative AI for content creation
- ○
- Decision support systems
- ○
- Autonomous agents or systems
- ○
- Other (please specify): _________
- 7.
- Approximately what percentage of your organization’s total technology budget is currently allocated to AI initiatives?
- ○
- 0%
- ○
- 1–5%
- ○
- 6–10%
- ○
- 11–20%
- ○
- 21–30%
- ○
- More than 30%
- ○
- Don’t know
- 8.
- For each functional area below, please indicate the current level of AI impact on work processes:
[Matrix question: No impact/Minimal impact/Moderate impact/Significant impact/Transformative impact/Not applicable]
- ○
- Software development
- ○
- Customer service
- ○
- Marketing and sales
- ○
- Finance and accounting
- ○
- Human resources
- ○
- Research and development
- ○
- Manufacturing/Operations
- ○
- Supply chain/Logistics
- ○
- Legal/Compliance
- 9.
- What percentage of employees in your organization currently use AI tools as part of their regular work?
- ○
- 0%
- ○
- 1–10%
- ○
- 11–25%
- ○
- 26–50%
- ○
- 51–75%
- ○
- More than 75%
- ○
- Don’t know
Section 3: Implementation Approach
- 10.
- How would you characterize your organization’s approach to AI governance?
- ○
- No formal governance structure
- ○
- Decentralized (individual departments make decisions)
- ○
- Centralized (corporate function makes decisions)
- ○
- Hybrid approach (central guidance with local implementation)
- ○
- Other (please specify): _________
- 11.
- Which stakeholders are actively involved in AI implementation decisions? (Select all that apply)
- ○
- Executive leadership
- ○
- IT/Technology department
- ○
- Business unit leaders
- ○
- Data science/AI specialists
- ○
- External consultants
- ○
- Front-line employees
- ○
- Customers/clients
- ○
- Ethics/compliance teams
- ○
- Legal department
- ○
- Human resources
- ○
- Other (please specify): _________
- 12.
- Does your organization have a formal program for employee upskilling related to AI?
- ○
- No formal upskilling program
- ○
- Basic training on specific AI tools only
- ○
- Comprehensive upskilling program including tools, concepts, and applications
- ○
- Advanced upskilling program with specialization tracks
- ○
- Other (please specify): _________
- 13.
- How does your organization identify and prioritize AI use cases? (Select all that apply)
- ○
- Top-down strategic planning
- ○
- Bottom-up suggestions from employees
- ○
- Dedicated innovation teams
- ○
- External consultant recommendations
- ○
- Industry benchmarking
- ○
- Customer/client feedback
- ○
- Competitive analysis
- ○
- Other (please specify): _________
- 14.
- How would you rate the following aspects of your organization’s AI implementation approach?
[Matrix question: Very weak/Somewhat weak/Neutral/Somewhat strong/Very strong]
- ○
- Executive sponsorship and commitment
- ○
- Clear governance framework
- ○
- Data infrastructure and quality
- ○
- Technical expertise and capabilities
- ○
- Change management processes
- ○
- Ethical guidelines and practices
- ○
- Performance measurement
- ○
- Integration with existing systems
- ○
- Employee engagement and adoption
Section 4: Implementation Barriers and Enablers
- 15.
- To what extent have the following factors been barriers to AI implementation in your organization?
[Matrix question: Not a barrier/Minor barrier/Moderate barrier/Significant barrier/Critical barrier/Not applicable]
- ○
- Data quality or integration issues
- ○
- Talent or skill gaps
- ○
- Organizational resistance to change
- ○
- Unclear ROI or business case
- ○
- Regulatory uncertainty
- ○
- Ethical concerns
- ○
- Technical infrastructure limitations
- ○
- Budget constraints
- ○
- Integration challenges with existing systems
- ○
- Security or privacy concerns
- ○
- Lack of executive support
- ○
- Siloed organizational structure
- 16.
- To what extent have the following factors enabled successful AI implementation in your organization?
[Matrix question: Not an enabler/Minor enabler/Moderate enabler/Significant enabler/Critical enabler/Not applicable]
- ○
- Executive leadership commitment
- ○
- Data infrastructure maturity
- ○
- Cross-functional implementation teams
- ○
- Dedicated AI governance structures
- ○
- Employee upskilling programs
- ○
- Clear ethical guidelines
- ○
- Agile implementation methodology
- ○
- Partnerships with technology providers
- ○
- Strong business-IT alignment
- ○
- Organizational culture of innovation
- 17.
- What have been the three most significant challenges in implementing AI in your organization? (Open-ended)
- 18.
- What have been the three most effective approaches for overcoming implementation barriers? (Open-ended)
Section 5: Impact and Outcomes
- 19.
- What impact has AI implementation had on the following organizational outcomes?
[Matrix question: Significant negative impact/Moderate negative impact/No impact/Moderate positive impact/Significant positive impact/Too early to tell]
- ○
- Operational efficiency
- ○
- Product or service quality
- ○
- Customer satisfaction
- ○
- Revenue growth
- ○
- Cost reduction
- ○
- Employee productivity
- ○
- Innovation capability
- ○
- Decision-making quality
- ○
- Competitive positioning
- ○
- Employee job satisfaction
- 20.
- Has your organization measured the return on investment (ROI) for AI implementations?
- ○
- No, we have not attempted to measure ROI
- ○
- We’ve attempted to measure ROI but faced significant challenges
- ○
- Yes, we’ve measured ROI for some implementations
- ○
- Yes, we’ve measured ROI for most implementations
- ○
- Other (please specify): _________
- 21.
- Approximately what percentage of your organization’s AI initiatives have met or exceeded their objectives?
- ○
- 0–20%
- ○
- 21–40%
- ○
- 41–60%
- ○
- 61–80%
- ○
- 81–100%
- ○
- Too early to determine
- 22.
- What impact has AI implementation had on your organization’s workforce?
- ○
- Significant reduction in workforce
- ○
- Moderate reduction in workforce
- ○
- No significant change in workforce size
- ○
- Moderate increase in workforce
- ○
- Significant increase in workforce
- ○
- Primarily redeployment to different roles
- ○
- Too early to determine
Section 6: Future Outlook
- 23.
- What percentage of roles in your organization do you expect to be significantly impacted by AI within the next 3 years?
- ○
- 0–10%
- ○
- 11–25%
- ○
- 26–50%
- ○
- 51–75%
- ○
- More than 75%
- ○
- Don’t know
- 24.
- How do you expect your organization’s investment in AI to change over the next 3 years?
- ○
- Significant decrease
- ○
- Moderate decrease
- ○
- No significant change
- ○
- Moderate increase
- ○
- Significant increase
- ○
- Don’t know
- 25.
- Which of the following AI capabilities do you expect your organization to implement within the next 2 years? (Select all that apply)
- ○
- Autonomous AI agents
- ○
- Advanced generative AI
- ○
- AI-powered decision-making systems
- ○
- AI-human collaborative interfaces
- ○
- Other (please specify): _________
- ○
- None of the above
- 26.
- What do you see as the most significant challenges for AI implementation in your organization over the next 3 years? (Open-ended)
- 27.
- What additional resources, capabilities, or approaches would most help your organization succeed with AI implementation? (Open-ended)
Conclusion
- 28.
- Is there anything else you would like to share about your organization’s experience with AI implementation that wasn’t covered in this survey? (Open-ended)
_________________________________________________________________________________________________________________________________
Thank you for your participation in this research study. Your insights will contribute to a better understanding of how organizations are navigating AI transformation.
Appendix B. Semi-Structured Interview Protocol—AI Organizational Transformation Study
Introduction Script
Thank you for agreeing to participate in this research interview. I’m conducting this study to better understand how organizations are responding to artificial intelligence technologies and the factors influencing successful implementation.
This interview will take approximately 45–60 min. With your permission, I would like to record our conversation to ensure I accurately capture your insights. All information will be kept confidential, and your responses will only be used for research purposes and reported in anonymized form.
Before we begin, do you have any questions about the study or the interview process?
[Address any questions]
May I have your permission to record this interview?
[If yes, start recording]
Background Information
- Please briefly describe your role within your organization and your involvement with AI initiatives.
- Could you provide a high-level overview of your organization’s current approach to AI implementation?
Implementation Journey
- 3.
- When did your organization begin seriously exploring AI implementation, and what were the initial drivers?
- 4.
- Could you walk me through the evolution of your organization’s AI strategy and implementation approach?
- 5.
- What were the first AI applications your organization implemented, and why were these selected as starting points?
- 6.
- How has your organization’s approach to AI implementation changed or evolved over time?
Organizational Structure and Governance
- 7.
- How is AI governance structured within your organization? Who has decision-making authority for AI initiatives?
- 8.
- How are AI implementation teams organized? (Probe: centralized vs. decentralized, dedicated teams vs. integrated into business units)
- 9.
- How does your organization identify, prioritize, and approve potential AI applications?
- 10.
- What processes has your organization established for ensuring ethical use of AI and addressing potential risks?
Implementation Approaches and Practices
- 11.
- Could you describe your organization’s approach to upskilling employees for AI implementation? What has been most effective?
- 12.
- How does your organization approach change management related to AI implementation?
- 13.
- What processes or practices have you found most effective for encouraging adoption of AI technologies?
- 14.
- How does your organization measure the success or impact of AI implementations?
Barriers and Enablers
- 15.
- What have been the most significant barriers or challenges to AI implementation in your organization?
- 16.
- How has your organization addressed these challenges?
- 17.
- What factors have been most critical in enabling successful AI implementation?
- 18.
- Has your organization experienced resistance to AI implementation? If so, how has this been addressed?
Impact and Outcomes
- 19.
- What impacts has AI implementation had on your organization’s operations, workforce, and competitive positioning?
- 20.
- Have there been any unexpected outcomes or consequences, either positive or negative, from AI implementation?
- 21.
- How has AI implementation affected job roles, skills requirements, and workforce composition?
- 22.
- How do employees generally perceive AI initiatives within your organization?
Lessons Learned and Future Outlook
- 23.
- What are the most important lessons your organization has learned through its AI implementation journey?
- 24.
- If you could start your organization’s AI implementation journey again, what would you do differently?
- 25.
- How do you see AI affecting your organization over the next 2–3 years?
- 26.
- What do you see as the most significant challenges or opportunities related to AI that your organization will face in the coming years?
Concluding Questions
- 27.
- Is there anything we haven’t discussed that you think is important for understanding your organization’s experience with AI implementation?
- 28.
- Do you have any questions for me about this research?
Closing Script
Thank you very much for sharing your insights and experiences. Your perspective will be valuable in helping us better understand how organizations are navigating AI transformation.
Once the study is complete, I’d be happy to share a summary of the findings with you. Would you be interested in receiving that?
[Note interest in receiving findings]
If you have any additional thoughts or insights after our conversation, please feel free to contact me.
[Provide contact information if needed]
Thank you again for your time.
Appendix C. Case Study Protocol—AI Organizational Transformation Research Study
Case Study Protocol
1. Overview of the Case Study
1.1 Purpose and Objectives
This case study protocol guides the systematic investigation of AI implementation within selected organizations. The primary objectives are to:
- Document organizational approaches to AI implementation.
- Identify key enablers and barriers affecting implementation.
- Examine workforce impacts and adaptation strategies.
- Assess performance outcomes and their measurement.
- Understand the relationship between implementation approaches and outcomes.
- Develop insights to inform the three-dimensional organizational framework.
1.2 Research Questions
The case studies address the following specific research questions:
- How do organizations structure and govern their AI implementation initiatives?
- What organizational factors facilitate or impede successful AI integration?
- How do organizations manage workforce transition and skill development?
- What approaches do organizations use to measure AI implementation success?
- How do implementation approaches vary across organizational contexts?
- What organizational capabilities are associated with successful implementation?
1.3 Theoretical Framework
The case studies are guided by three theoretical perspectives:
- Socio-technical systems theory [8]: Examining the interdependence between technical systems and social structures.
- Diffusion of innovations theory [39]: Analyzing adoption patterns and implementation approaches.
- Dynamic capabilities theory [30]: Investigating how organizations develop adaptation capabilities.
2. Data Collection Procedures
2.1 Site Selection Criteria
Case study organizations are selected based on the following criteria:
- Implementation maturity: Organizations representing early, intermediate, and advanced stages of AI implementation.
- Industry diversity: Representation across multiple sectors (minimum of 3 from each major industry grouping).
- Geographic diversity: Organizations from at least three major regions (North America, Europe, Asia).
- Organizational size: Representation of small, medium, and large organizations.
- Implementation approach: Variation in centralized, decentralized, and hybrid implementation models.
- Accessibility: Willingness to provide substantive access to key stakeholders and documentation.
2.2 Data Sources
Multiple data sources are collected for each case:
- Semi-structured interviews: 3–5 interviews per organization, representing different organizational levels and functions.
- Documentation: Strategic plans, implementation roadmaps, training materials, governance frameworks.
- Observational data: Site visits where feasible to observe AI systems in use.
- Quantitative metrics: Implementation timelines, adoption rates, performance indicators.
- Archival data: Historical records of implementation evolution and outcomes.
2.3 Contact Procedures
- Initial contact with organizational leadership through formal invitation letter.
- Preliminary discussion with key contact to explain study purpose and required access.
- Execution of confidentiality agreements and research participation consent.
- Scheduling of site visits and interviews.
- Documentation request with specific categories of materials required.
- Follow-up procedures for clarification and additional data.
2.4 Interview Protocol
Executive/Leadership Level
- What was the strategic motivation for implementing AI in your organization?
- How was the implementation approach decided and structured?
- What governance structures were established for AI initiatives?
- What resources were allocated to the implementation?
- How were implementation priorities determined?
- What have been the primary challenges in implementation?
- How is implementation success being measured?
- What organizational changes have resulted from AI implementation?
- What lessons have been learned through the implementation process?
- How do you see AI affecting your organization over the next 3–5 years?
Implementation Team Level
- How is your AI implementation team structured and resourced?
- What methodologies are used for implementation planning and execution?
- How are use cases identified and prioritized?
- What technical and organizational barriers have you encountered?
- How have you addressed data quality and integration challenges?
- What approaches have you used to encourage user adoption?
- How do you measure implementation progress and outcomes?
- What unexpected challenges or opportunities have emerged?
- How has your implementation approach evolved over time?
- What would you do differently if starting the implementation again?
User/Operational Level
- How has AI implementation affected your role and daily work?
- What training or support was provided for the transition?
- How were you engaged in the implementation process?
- What challenges have you experienced in adapting to AI systems?
- How has AI affected collaboration and work processes?
- What benefits or drawbacks have you observed from AI implementation?
- How would you characterize the organizational response to AI?
- What suggestions would you have for improving implementation?
- How has AI affected skill requirements and development?
- How do you see your role evolving as AI capabilities advance?
2.5 Documentation Request
Organizations are asked to provide (with appropriate confidentiality protections):
- AI strategy and implementation plans.
- Governance frameworks and decision processes.
- Training materials and upskilling programs.
- Adoption metrics and performance measurements.
- Project management documentation.
- Change management and communication plans.
- Technical architecture documents.
- Lessons learned and internal assessments.
- Organizational structure before and after implementation.
- Future roadmap for AI initiatives.
2.6 Site Visit Protocol
For organizations where site visits are feasible:
- Observe AI systems in operational use.
- Document workflow integration and user interaction.
- Observe collaboration patterns around AI systems.
- Document physical workspace adaptations for AI implementation.
- Observe training or support activities where possible.
- Conduct informal discussions with additional stakeholders.
- Collect artifacts representing implementation (e.g., user guides, posters).
3. Data Analysis Plan
3.1 Analytical Framework
Data analysis follows a systematic process:
- Within-case analysis: Develop comprehensive understanding of each organization’s implementation approach and outcomes.
- Cross-case analysis: Identify patterns, similarities, and differences across organizations.
- Theoretical integration: Connect empirical findings with theoretical frameworks.
- Framework development: Contribute insights to the three-dimensional organizational framework.
3.2 Coding Procedure
- Initial coding: Using predetermined codes derived from theoretical frameworks.
- Open coding: Identifying emergent themes not captured in initial coding framework.
- Axial coding: Establishing relationships between concepts.
- Selective coding: Integrating findings around core themes and concepts.
3.3 Data Integration Approach
- Triangulate findings across multiple data sources within each case.
- Develop case narratives integrating qualitative and quantitative findings.
- Create implementation timelines showing key events and transitions.
- Map implementation approaches to outcomes using matrix displays.
- Identify contradictions or discrepancies for further investigation.
3.4 Cross-Case Analysis Structure
- Compare implementation approaches across similar and different contexts.
- Identify patterns in enablers and barriers across organizational settings.
- Analyze variation in implementation timelines and trajectories.
- Compare measurement approaches and success definitions.
- Identify contextual factors influencing implementation outcomes.
3.5 Quality Assurance Procedures
- Maintain chain of evidence from data collection to conclusions.
- Create case study database with all relevant data and documentation.
- Use multiple coders for subset of data to establish reliability.
- Conduct member checks with key informants to validate interpretations.
- Identify and analyze discrepant evidence and negative cases.
- Document researcher reflexivity and potential biases.
4. Data Collection Instruments
4.1 Implementation Approach Assessment
As seen in Table A1, for each case study organization, document the dimensions, indicators, and data sources for the organization:
Table A1.
Implementation Approach Assessment: Organizational Dimensions, Indicators, and Data Sources.
Table A1.
Implementation Approach Assessment: Organizational Dimensions, Indicators, and Data Sources.
| Dimension | Indicators | Data Sources |
|---|---|---|
| Governance Structure | Centralized/Decentralized/Hybrid | Interviews, documentation |
| Implementation Methodology | Agile/Waterfall/Hybrid | Project documentation, interviews |
| Resource Allocation | Budget, personnel, timeline | Strategic plans, interviews |
| Team Composition | Technical/Business/Cross-functional | Organizational charts, interviews |
| Decision-Making Process | Top-down/Bottom-up/Collaborative | Governance documentation, interviews |
| Use Case Selection | Strategic/Operational/Experimental | Project documentation, interviews |
| Technology Selection | Vendor/Proprietary/Hybrid | Technical documentation, interviews |
4.2 Organizational Enablers and Barriers Assessment
As seen in Table A2, for each case study organization, please document presence, quality, and impact of the organization:
Table A2.
Organizational Enablers and Barriers Assessment: Organizational Factor, Assessment Criteria, and Data Sources.
Table A2.
Organizational Enablers and Barriers Assessment: Organizational Factor, Assessment Criteria, and Data Sources.
| Factor | Assessment Criteria | Data Sources |
|---|---|---|
| Leadership Commitment | Executive involvement, resource allocation, strategic priority | Interviews, strategy documents |
| Data Infrastructure | Quality, accessibility, integration, governance | Technical documentation, interviews |
| Technical Expertise | AI skills, availability, development approaches | HR data, interviews, training materials |
| Organizational Culture | Innovation orientation, risk tolerance, collaboration | Interviews, cultural assessments |
| Change Management | Communication, training, incentives | Change plans, interviews |
| Governance Framework | Policies, oversight, ethical guidelines | Governance documents, interviews |
| External Partnerships | Vendor relationships, academic collaborations | Contracts, partnership agreements |
4.3 Workforce Impact Assessment
As seen in Table A3, for each case study organization, please document the dimensions, indicators, and data sources of each organization:
Table A3.
Workforve Impact Assessnent: Organizational Dimensions, Indicators, and Data Sources.
Table A3.
Workforve Impact Assessnent: Organizational Dimensions, Indicators, and Data Sources.
| Dimension | Indicators | Data Sources |
|---|---|---|
| Role Changes | Eliminated, modified, created roles | HR data, organizational charts, interviews |
| Skill Development | Training programs, participation rates, effectiveness | Training materials, HR data, interviews |
| Adoption Patterns | Usage metrics, resistance patterns, facilitating factors | System data, interviews |
| Employee Experience | Satisfaction, concerns, perceived value | Surveys, interviews |
| Workforce Planning | Future skill projections, transition strategies | Strategic plans, interviews |
| Labor Relations | Union involvement, collective agreements, tensions | Labor documents, interviews |
4.4 Performance Measurement Assessment
As seen in Table A4, for each case study organization, please document the dimensions, metrics, and data sources of each organization:
Table A4.
Performance Measurement Assessment: Organizational Dimensions, Metrics, and Data Sources.
Table A4.
Performance Measurement Assessment: Organizational Dimensions, Metrics, and Data Sources.
| Dimension | Metrics | Data Sources |
|---|---|---|
| Technical Performance | System metrics, reliability, accuracy | Technical documentation, system data |
| Business Impact | Cost reduction, revenue increase, quality improvements | Financial data, performance reports |
| User Adoption | Usage rates, depth of use, satisfaction | System data, surveys |
| Implementation Efficiency | Timeline adherence, budget performance | Project documentation |
| Innovation Outcomes | New capabilities, products, services | Strategic documents, interviews |
| Return on Investment | Financial and non-financial ROI calculations | Financial analysis, interviews |
5. Case Study Analysis Template
For each case study, develop a structured analysis including:
5.1 Organizational Context
- Industry and market position.
- Size and structure.
- Geographic scope.
- Digital maturity prior to AI implementation.
- Strategic priorities and challenges.
5.2 AI Implementation Approach
- Strategic motivation and objectives.
- Governance structure and approach.
- Implementation timeline and phases.
- Resource allocation and priorities.
- Technical architecture and systems.
- Use case selection methodology.
5.3 Organizational Enablers and Barriers
- Key facilitating factors.
- Primary challenges encountered.
- Mitigation strategies developed.
- Organizational adaptations required.
- Successful and unsuccessful approaches.
5.4 Workforce Impacts and Responses
- Skill development approaches.
- Role transformations.
- Adoption patterns and challenges.
- Employee engagement strategies.
- Future workforce planning.
5.5 Performance Outcomes and Measurement
- Technical performance metrics.
- Business impact measurements.
- User adoption indicators.
- Implementation efficiency measures.
- Return on investment calculations.
- Unexpected outcomes.
5.6 Lessons Learned and Future Directions
- Key insights from implementation.
- Approach adaptations over time.
- Current challenges and opportunities.
- Future implementation plans.
- Organizational learning mechanisms.
6. Cross-Case Analysis Framework
The cross-case analysis will be structured around:
6.1 Implementation Approach Comparison
- Comparison of centralized, decentralized, and hybrid approaches.
- Analysis of relative effectiveness across contexts.
- Identification of contextual factors affecting approach selection.
- Temporal evolution of implementation approaches.
6.2 Critical Success Factors Analysis
- Identification of common success factors across cases.
- Analysis of context-specific success factors.
- Relative importance of technical versus organizational factors.
- Enabler interactions and reinforcing mechanisms.
6.3 Barrier Analysis and Mitigation Strategies
- Common implementation barriers across contexts.
- Effective and ineffective mitigation strategies.
- Contextual variation in barrier significance.
- Evolution of barriers through implementation stages.
6.4 Performance Measurement Comparative Analysis
- Variation in measurement approaches and metrics.
- Relationship between measurement practices and outcomes.
- Leading versus lagging indicators of success.
- Business value realization patterns.
6.5 Framework Contribution Analysis
- Implications for the three-dimensional framework.
- Contextual adaptations of framework dimensions.
- Integration of case insights into practical guidance.
- Theoretical implications and extensions.
7. Ethical Considerations
7.1 Confidentiality Procedures
- Organization and participant anonymization protocols.
- Secure data storage and access restrictions.
- Confidential information handling procedures.
- Review processes for case reports before publication.
7.2 Informed Consent
- Organizational consent for participation.
- Individual participant consent procedures.
- Right to withdraw at any stage.
- Approval of specific content for publication.
7.3 Reporting Ethics
- Balanced representation of perspectives.
- Acknowledgment of limitations and uncertainties.
- Fair portrayal of challenges and outcomes.
- Protection of sensitive competitive information.
8. Reporting Plan
8.1 Individual Case Reports
- Comprehensive case narrative for each organization.
- Visual timeline of implementation journey.
- Key insights and distinctive features.
- Application of theoretical frameworks.
- Organizational review and approval.
8.2 Cross-Case Analysis Report
- Synthesis of findings across cases.
- Identification of patterns and variations.
- Contextual factors affecting implementation.
- Theoretical and practical implications.
- Framework refinements based on case evidence.
8.3 Executive Summary for Participants
- Key findings and practical implications.
- Benchmarking against other organizations.
- Specific recommendations for participating organizations.
- Invitation for continued research engagement.
References
- Acemoglu, D.; Autor, D. Skills, tasks and technologies: Implications for employment and earnings. In Handbook of Labor Economics; Ashenfelter, O., Card, D., Eds.; Elsevier: Amsterdam, The Netherlands, 2011; Volume 4, pp. 1043–1171. [Google Scholar]
- Acemoglu, D.; Restrepo, P. Tasks, automation, and the rise in US wage inequality. Econometrica 2022, 90, 1973–2016. [Google Scholar] [CrossRef]
- Altman, S. Keynote Address. AI Summit: San Francisco, CA, USA, 2024. [Google Scholar]
- Amodei, D. Technical Capabilities Forecast; Anthropic Research Symposium: Palo Alto, CA, USA, 2024. [Google Scholar]
- Autor, D.H. Why are there still so many jobs? The history and future of workplace automation. J. Econ. Perspect. 2015, 29, 3–30. [Google Scholar] [CrossRef]
- Autor, D.H. Work of the past, work of the future. In AEA Papers and Proceedings; American Economic Association: Nashville, TN, USA, 2019; Volume 109, pp. 1–32. [Google Scholar]
- Bakshi, H.; Downing, J.; Osborne, M.; Schneider, P. The Future of Skills: Employment in 2030; Pearson and Nesta: London, UK, 2017. [Google Scholar]
- Baxter, G.; Sommerville, I. Socio-technical systems: From design methods to systems engineering. Interact. Comput. 2011, 23, 4–17. [Google Scholar] [CrossRef]
- Brynjolfsson, E.; McAfee, A. The business of artificial intelligence. Harv. Bus. Rev. 2017, 95, 3–11. [Google Scholar]
- Brynjolfsson, E.; Mitchell, T.; Rock, D. What can machines learn, and what does it mean for occupations and the economy? In AEA Papers and Proceedings; American Economic Association: Nashville, TN, USA, 2018; Volume 108, pp. 43–47. [Google Scholar]
- Cascio, W.F.; Montealegre, R. How technology is changing work and organizations. Annu. Rev. Organ. Psychol. Organ. Behav. 2016, 3, 349–375. [Google Scholar] [CrossRef]
- Creswell, J.W.; Plano Clark, V.L. Designing and Conducting Mixed Methods Research, 3rd ed.; SAGE Publications: Thousand Oaks, CA, USA, 2018. [Google Scholar]
- Davenport, T.H.; Kirby, J. Only Humans Need Apply: Winners and Losers in the Age of Smart Machines; Harper Business: New York, NY, USA, 2016. [Google Scholar]
- Edmondson, A.C. The Fearless Organization: Creating Psychological Safety in the Workplace for Learning, Innovation, and Growth; John Wiley & Sons: Hoboken, NJ, USA, 2018. [Google Scholar]
- Faraj, S.; Pachidi, S.; Sayegh, K. Working and organizing in the age of the learning algorithm. Inf. Organ. 2018, 28, 62–70. [Google Scholar] [CrossRef]
- Feldman, M.S.; Orlikowski, W.J. Theorizing practice and practicing theory. Organ. Sci. 2011, 22, 1240–1253. [Google Scholar] [CrossRef]
- Felten, E.; Raj, M.; Seamans, R. The occupational impact of artificial intelligence: Labor, skills, and polarization. J. Labor Econ. 2023, 41 (Suppl. S2), 463–508. [Google Scholar]
- Raisch, S.; Krakowski, S. Artificial intelligence and management: The automation–augmentation paradox. Acad. Manag. Rev. 2021, 46, 192–210. [Google Scholar] [CrossRef]
- Fetters, M.D.; Curry, L.A.; Creswell, J.W. Achieving integration in mixed methods designs—Principles and practices. Health Serv. Res. 2013, 48 Pt 2, 2134–2156. [Google Scholar] [CrossRef] [PubMed]
- Fjeld, J.; Achten, N.; Hilligoss, H.; Nagy, A.; Srikumar, M. Principled Artificial Intelligence: Mapping Consensus in Ethical and Rights-based Approaches to Principles for AI; Berkman Klein Center Research Publication: Cambridge, MA, USA, 2020. [Google Scholar]
- Frey, C.B.; Osborne, M.A. The future of employment: How susceptible are jobs to computerisation? Technol. Forecast. Soc. Chang. 2017, 114, 254–280. [Google Scholar] [CrossRef]
- Google Cloud. AI Implementation Report: Developer Productivity Metrics; Google Research: Mountain View, CA, USA, 2024. [Google Scholar]
- Greenhalgh, T.; Robert, G.; Macfarlane, F.; Bate, P.; Kyriakidou, O. Diffusion of innovations in service organizations: Systematic review and recommendations. Milbank Q. 2004, 82, 581–629. [Google Scholar] [CrossRef]
- Guetterman, T.C.; Fetters, M.D.; Creswell, J.W. Integrating quantitative and qualitative results in health science mixed methods research through joint displays. Ann. Fam. Med. 2015, 13, 554–561. [Google Scholar] [CrossRef]
- IMF. World Economic Outlook: AI Impact on Global Employment; International Monetary Fund: Washington, DC, USA, 2024. [Google Scholar]
- Jobin, A.; Ienca, M.; Vayena, E. The global landscape of AI ethics guidelines. Nat. Mach. Intell. 2019, 1, 389–399. [Google Scholar] [CrossRef]
- Kotter, J.P. Leading Change; Harvard Business Press: Brighton, MA, USA, 2012. [Google Scholar]
- Lebovitz, S.; Levina, N.; Lifshitz-Assaf, H. Is AI ground truth really “true”? The dangers of training and evaluating AI tools based on experts’ decisions. MIS Q. 2021, 45, 1501–1526. [Google Scholar] [CrossRef]
- LeCun, Y.; Bengio, Y.; Hinton, G. Deep learning. Nature 2015, 521, 436–444. [Google Scholar] [CrossRef] [PubMed]
- Teece, D.J. Explicating dynamic capabilities: The nature and microfoundations of (sustainable) enterprise performance. Strateg. Manag. J. 2007, 28, 1319–1350. [Google Scholar] [CrossRef]
- Leonardi, P.M. When does technology use enable network change in organizations? A comparative study of feature use and shared affordances. MIS Q. 2013, 37, 749–775. [Google Scholar] [CrossRef]
- Leonardi, P.M.; Bailey, D.E. Recognizing and selling good ideas: Network articulation and the making of an organizational innovation. Inf. Syst. Res. 2017, 28, 389–411. [Google Scholar]
- Lyytinen, K.; Damsgaard, J. What’s wrong with the diffusion of innovation theory? The case of a complex and networked technology. In Diffusing Software Product and Process Innovations; Ardis, M.A., Marcolin, B.L., Eds.; Springer: Berlin/Heidelberg, Germany, 2001; pp. 173–190. [Google Scholar]
- McKinsey Global Institute. The Economic Potential of Generative AI: The Next Productivity Frontier; McKinsey & Company: New York, NY, USA, 2023. [Google Scholar]
- Teddlie, C.; Tashakkori, A. Foundations of Mixed Methods Research: Integrating Quantitative and Qualitative Approaches in the Social and Behavioral Sciences; SAGE Publications: Thousand Oaks, CA, USA, 2009. [Google Scholar]
- World Economic Forum. Future of Jobs Report 2023; World Economic Forum: Cologny, Switzerland, 2023. [Google Scholar]
- World Economic Forum. Future of Jobs Report 2018; World Economic Forum: Cologny, Switzerland, 2018. [Google Scholar]
- World Economic Forum. Future of Jobs Report 2020; World Economic Forum: Cologny, Switzerland, 2020. [Google Scholar]
- Rogers, E.M. Diffusion of Innovations, 5th ed.; Free Press: Washington, DC, USA, 2003. [Google Scholar]
- O’Reilly, C.A.; Tushman, M.L. Organizational ambidexterity: Past, present, and future. Acad. Manag. Perspect. 2013, 27, 324–338. [Google Scholar] [CrossRef]
Disclaimer/Publisher’s Note: The statements, opinions and data contained in all publications are solely those of the individual author(s) and contributor(s) and not of MDPI and/or the editor(s). MDPI and/or the editor(s) disclaim responsibility for any injury to people or property resulting from any ideas, methods, instructions or products referred to in the content. |
© 2025 by the author. Licensee MDPI, Basel, Switzerland. This article is an open access article distributed under the terms and conditions of the Creative Commons Attribution (CC BY) license (https://creativecommons.org/licenses/by/4.0/).