Article

A Decade-Long Assessment of Water Quality Variability in the Yelek River Basin (Kazakhstan) Using Remote Sensing and GIS

by
Ainur Mussina
1,
Aliya Aktymbayeva
1,
Zhanara Zhanabayeva
1,*,
Shamshagul Mashtayeva
1,
Mark G. Macklin
2,
Aina Rysmagambetova
1,
Raibanu Akhmetova
1 and
Almas Alimbay
1,*
1
Geography and Environmental Sciences Faculty, Al-Farabi Kazakh National University, Almaty 050040, Kazakhstan
2
Lincoln Centre for Water and Planetary Health, University of Lincoln, Lincoln LN6 7TS, UK
*
Authors to whom correspondence should be addressed.
Sustainability 2025, 17(21), 9809; https://doi.org/10.3390/su17219809
Submission received: 21 September 2025 / Revised: 25 October 2025 / Accepted: 29 October 2025 / Published: 4 November 2025

Abstract

This study investigates the seasonal variability of water quality in the Yelek River Basin, Western Kazakhstan, using data from 2010 to 2025 that combine remote sensing, GIS, and hydrochemical monitoring data. This research addresses growing pressures on river systems from both natural and anthropogenic factors. Archival records from Kazhydromet and recent field measurements were analysed for dissolved oxygen, total suspended solids (TSSs), and total dissolved solids (TDSs), while satellite indices (NDWI, NDTI) provided spatiotemporal insights into turbidity. The results show clear seasonal contrasts: total suspended solids and turbidity rise sharply during spring floods due to snowmelt and erosion; water quality declines during summer–autumn low-flow periods under intensified human influence; and partial recovery occurs in winter when ice cover stabilises flow. Dissolved oxygen consistently indicates moderate pollution, while total dissolved solids (TDSs) remains within the “clean” range. Integration of satellite data with field observations enabled the development of a turbidity model and highlighted the lower river reaches as most vulnerable, where total suspended solids exceeded permissible limits. The findings confirm the value of combining remote sensing and GIS with traditional monitoring to capture long-term river water dynamics. This approach offers practical tools for sustainable water management, informs regional environmental policies, and provides transferable insights for semi-arid transboundary basins in Central Asia.

1. Introduction

River water plays a vital role in maintaining ecological balance and the sustainable functioning of ecosystems. Water flows through rivers transport nutrients necessary for the growth of aquatic and riparian vegetation and contribute to the natural purification of water through the processes of decomposition and dilution of pollutants. Rivers are actively involved in the water cycle: according to various estimates, about 75% of all surface water flows through river systems before reaching the oceans [1]. However, in recent decades, there has been a steady deterioration in river water quality. Many watercourses around the world are subject to intense pollution [2,3,4,5,6,7,8] that exceeds their self-purification capacity. The main sources of pollution remain domestic, industrial and agricultural wastewater discharges, most of which are geographically concentrated along river channels. This leads to polluted water entering large reservoirs and seas, exacerbating environmental problems on a global scale.
In recent decades, the quality of river and lake water has become a subject of interest for domestic scientists, who have applied various assessment methods, including hydrochemical and biological indicators. Assessing the quality of surface water in Kazakhstan’s river basins is one of the key areas of hydroecological research, as the country’s water resources are subject to significant anthropogenic pressures and the high spatial heterogeneity of natural conditions. In this regard, a significant body of research has been accumulated in the scientific literature on the methodological aspects of water quality assessment, the identification of spatio-temporal patterns of pollution, and the determination of environmental risks. One of the key areas of research has been a comprehensive study of the hydrochemical composition of river water, with a focus on the content of biogenic elements, heavy metals and organic pollutants. The results showed that the highest concentrations of pollutants are found in river basins flowing near industrial centres and agricultural land [9,10]. These studies highlight regional differences, with the upper reaches of rivers having relatively high water quality, while the middle and lower reaches experience significant deterioration. Further research is linked to the use of integrated approaches to water quality assessment, including hydrochemical characteristics and the calculation of dissolved substance runoff. For example, studies on the hydroecological characteristics of rivers on the northern slope of the Ili Alatau showed that mountain tributaries have relatively favourable water quality with low total dissolved solids, while in the lower reaches, there is an increase in the concentration of ions and organic compounds due to anthropogenic impact [11]. For the Syrdarya basin, it has been established that significant concentrations of pollutants and suspended sediments are recorded in the waters, which indicates a sustained anthropogenic load and requires a comprehensive analysis of water quality [12]. These studies highlight the marked contrasts between mountainous and lowland river sections, with the former remaining in relatively good condition and the latter being subject to the greatest environmental risk. Water quality studies pay particular attention to the spatial distribution of pollutants along transboundary rivers and the analysis of the environmental safety of basins. In particular, in the Zhayik-Caspian basin, it has been established [13] that the concentrations of heavy metals and total suspended solids vary along the course of the river and that transboundary runoff affects pollution levels in the lower reaches. Similarly, a study of the elements and toxicity of rivers crossing the borders of Kazakhstan [14] showed variations in water composition along the runoff and identified areas with increased pollution. In addition, modelling of transboundary groundwater basins using GIS [15] demonstrates the potential of mapping and spatial analysis tools for water quality management.
In addition to hydrochemical and spatial–temporal analysis, researchers began to pay attention to climate trends and their possible impact on water systems. For example, in the Esil River basin, a significant trend towards higher temperatures in spring and fewer frost periods in winter has been documented, which may affect surface runoff and annual river runoff [16]. Another study shows that the average annual and spring temperatures in the northern regions of Kazakhstan are rising (e.g., in the Saumkol, Kokshetau and other areas), and that precipitation and the area of some lakes are also changing. These changes indicate a climatic shift that may indirectly affect the hydrochemical regime through changes in the balance of inflows and evaporation [17]. However, clear empirical data linking extreme hydrometeorological events with increased pollution through surface runoff (e.g., after heavy rains or floods) in the rivers of Kazakhstan remain scarce.
The quality of river water directly affects not only the health of the environment, but also the health of the population, especially in regions where river water is used for drinking or irrigation in agriculture. Preserving and restoring the ecological condition of water bodies is becoming an important task for water users. This requires the introduction of effective methods for assessing water quality and monitoring changes in its quality under the influence of both natural and anthropogenic factors. Natural factors include climatic characteristics, soil composition and vegetation, while anthropogenic factors include domestic, industrial and recreational activities within the water protection zone.
Modern approaches to monitoring surface water quality increasingly involve the integration of remote sensing (RS) and geographic information systems (GISs) [18,19,20]. These methods allow for regular, large-scale and highly accurate analysis of the hydrochemical and optical characteristics of water bodies. Among the parameters most frequently monitored using satellite data are total suspended solids (TSSs), total dissolved solids (TDSs), dissolved oxygen (DO) content, and water turbidity, determined using indices such as the NDWI (Normalised Difference Water Index) and NDTI (Normalised Difference Turbidity Index). A number of studies in recent years have confirmed the high effectiveness of Landsat and Sentinel satellite data for assessing spatial variability in water quality. For example, studies [21,22] demonstrate the successful application of multispectral images for mapping turbidity, content, chlorophyll, and water temperature in various types of water bodies. However, most of these studies focus on short time intervals or individual episodes, without covering seasonal and long-term dynamics of water quality.
The aim of this article is to assess seasonal variability in water quality over a ten-year period (2014–2025) using remote sensing and GIS methods.
The relevance is determined by the need to identify long-term patterns of change in river water quality under the influence of seasonal factors and anthropogenic load. The integration of satellite data and GIS analysis not only fills the gaps in traditional monitoring methods, but also offers new approaches to water resource management based on spatial-temporal information.

2. Materials and Methods

2.1. Study Area

The Yelek River is a right tributary of the first order, middle course of the Ural River (Zhayik) and further flows into the Caspian Sea, flowing through the territory of the Aktobe region (Figure 1). The sources of the Yelek are located on the northwestern slopes of the Bestobe Ridge (Mugodzhar System) and it flows mainly through flat terrain, which determines the characteristics of its water regime [23]. The river is 290 km long, and 699 km long including its tributaries. The catchment area is 41.3 thousand km2 [24].
The upper part of the catchment area is located on the mountain spurs of Mugalzhar. The soil conditions of the basin vary: loamy and clayey soils prevail in the upper reaches, and sandy loam soils in the middle reaches. The basin has extremely low forest cover. Groundwater in the valley lies at a depth of 4–10 m from the surface and is characterised by its fresh composition. These natural conditions shaped the chemical composition of surface waters during a period of relatively natural hydrological conditions. During the flood period in spring season, the total dissolved solids (TDS) of water in the upper reaches of the river is 100–150 mg/L.
The Yelek River valley is characterised by a wide, well-defined morphology with two floodplain terraces. In the upper reaches, the width of the riverbed varies between 20 and 30 m, while in the middle reaches (in the Aktobe area, Kazakhstan) it reaches 150–170 m. The width of the valley increases from 500 m in the upper reaches to 3–4 km in the lower reaches. The floodplain of the river is represented by numerous channels, sandy-gravelly areas, shoals, spits, and oxbow lakes [25].
The floodplain is bilateral, with a width of 0.4 to 1 km in the middle reaches. The average sinuosity coefficient of the channel along its entire length is 1.5, which indicates a relatively stable morphological structure. The banks are predominantly steep, composed of loamy and sandy loam rocks. Bottom sediments are represented by sands, sandy loams, and in some places, sandy-gravel and loamy sediments, sometimes slightly silted.
The hydrological regime of the Yelek River is determined by the climatic characteristics of the region, the nature of precipitation, the relief and the type of catchment area. The main source of water is snow, which accounts for 65–75% of the annual runoff, which is typical for rivers in the semi-desert and steppe zones of Kazakhstan [26,27]. Summer-autumn rainfall plays a secondary role, and underground runoff has little effect on the overall water balance.
Spring flooding occurs in March–early April and lasts an average of 20–40 days. It is formed by intense snowmelt and is characterised by sharp rises in water levels. During this period, up to 80% of the annual runoff is formed. The average annual runoff is 1569 m3 [28]. The summer low water period is accompanied by a sharp drop in water levels, with possible short-term increases due to heavy rainfall. In winter, there is stable ice cover, and the river flow is minimal or completely stops [29].
Average annual water discharge varies from 3 to 7 m3/s depending on the section and year. Hydrological observations conducted on the Yelek River indicate high interannual variability in flow, especially in the context of increasing climate aridisation and anthropogenic impact on river flow [30,31]. In some areas, the natural regime is disrupted due to water abstraction for economic needs, which also affects the ecological condition of the river and its water management sustainability.
The ice regime is characterised by stable ice cover from late November to March. The ice thickness can reach 70–90 cm. Spring ice break-up occurs rapidly, within 2–5 days, accompanied by the destruction of the ice cover.
The Yelek has 75 tributaries, the largest of which are the Khobda, Koktobe, Tabantal, Kargaly and Sazdy. The tributaries form a fairly dense hydrographic network. The Yelek River and its tributaries (in particular, Kargaly, Khobda and Sazdy) play an important role in the water supply system of Aktobe, and are also used for agricultural irrigation. Cities such as Aktobe and Kandyagash are located on the banks of the Yelek.
The Yelek River was selected as the object of study, as there is a sufficient database of observations for it. During the analysis, data from Kazhydromet on 7 water sampling points covering key sections of the river were used. The study assessed parameters such as turbidity, total suspended solids (TSS), total dissolved solids (TDS) and dissolved oxygen (DO), with a focus on the hydrological phases: flood, summer-autumn low water and winter low water.

2.2. Methods

2.2.1. Data Sources and Study Period

Two main data sets (types) were used to assess the quality of surface water in the Yelek River: archival monitoring data from the Kazhydromet State Agency for the period 2010–2025 and the results of our own field studies conducted in 2024–2025. The archival data included indicators of dissolved oxygen (DO), total suspended solids (TSSs), total dissolved solids (chlorides, sulphates, total salts) and transparency/turbidity at seven stationary points along the length of the river (the distribution of points is shown in Figure 1). Monitoring observations cover riparian and nearby anthropogenic objects: seven stationary points along the length of the Yelek River (intervals ≈ 50–70 km, characterised by the following parameters: latitude and longitude (WGS 84), the nature of the banks (coastal vegetation, anthropogenic load), depth and the flow velocity at the time of sampling.
For the analysis of dissolved oxygen, total suspended solids and total dissolved solids, sampling is carried out in accordance with the State Standard (SS) in accordance with the programme approved by the National Hydrometeorological Service of the Republic of Kazakhstan “Kazhydromet”.
The four fieldwork periods included the following dates: 22 April 2024–2 May 2024, 30 May 2024–2 July 2024, 27 September 2024–5 November 2024, 28 April 2025–30 May 2025. During the field studies, samples were taken and measurements were made at three points that are representative for determining the water quality in the Yelek River (Table 1).
During the field work, water transparency was measured using a Secchi disc, and turbidity was measured using a turbidimeter. These data were used to verify the results of satellite analysis of the Normalised Difference Turbidity Index (NDTI). Spatial assessment of the turbidity of water bodies was carried out based on the processing of Sentinel and Landsat satellite images. For this purpose, remote sensing methods were used with the appropriate spectral indices to identify the distribution and dynamics of total suspended solids in the water column. The images were processed taking into account the different states of the water regime of the Yelek River according to [32,33,34]: spring flood (April–May), summer-autumn low water (June-November), winter low water (December–March). For each image for the specified hydrological phases of 2010–2025, the NDTI (Nominal Difference Turbidity Index) was calculated, based on which the spatial dynamics of turbidity/cloudiness were classified into the following categories (low, medium, high).

2.2.2. Field Work and Sampling

Field work in 2024–2025 was carried out three times in 2024 and once in 2025 in order to obtain data in different seasons (flood season (April, May), summer low water period (June), transition to winter low water period (October)). Hydrological forecasts from the Kazhydromet State Agency and actual meteorological conditions (air temperature, water level, ice conditions) were taken into account when selecting the dates for field studies.
A standard Secchi disc kit (Eijkelkamp Soil & Water, Giesbeek, The Netherlands) and a portable turbidimeter (Hach 2100Q or equivalent) Hach Company, Loveland, CO, USA) calibrated to factory standards were used to measure transparency/turbidity. The transparency index was recorded as the depth at which the disc ceased to be visually visible (m), and turbidity was recorded in FN(G)E (formazin units). Both measurements were taken to establish the correspondence between the metric and optical characteristics of turbidity. Transparency (Secchi) was determined manually in clear weather: a disc gauge was lowered vertically until the disc disappeared from the observer’s view, then slowly raised until it reappeared. The result was recorded with an accuracy of ±0.05 m. Turbidity was measured using a portable turbidimeter. The device was calibrated using standard formazine solutions (20, 100, 500 FNE) before each series of measurements. Each measurement was repeated three times, and the average value was taken as the final result. The turbidimeter’s error did not exceed ±2 FNE, which corresponds to a 5% share at a turbidity level of up to 50 FNE.

2.2.3. Satellite Monitoring and Satellite Image Processing

For the purpose of spatial analysis of turbidity, multispectral images from the Sentinel-2 (A and B), Landsat-8 Operational Land Imager (OLI), Landsat-7 Enhanced Thematic Mapper (ETM+), and Landsat-5 Thematic Mapper (TM) satellites were used to cover an approximate study area of 41.3 thousand km2 (Figure 1). Differences between Sentinel-2 A/B sensors and Landsat sensors include spatial resolution, revisit time, and spectral bands (Table 1). For each year during the period 2014–2025, images corresponding to three hydrological phases were selected, which made it possible to take into account the seasonal variability of the Yelek River: spring flood (April–May): images taken during the spring ice break-up and maximum river opening, with a priority of cloud cover <10%; summer-autumn low water period (June–November): images taken during a period of consistently low water levels, cloud cover <10%; winter low water period (December-March): images taken during the period of stable ice and low water, cloud cover <10%.
Satellite images were processed using ArcGIS 10.8, ArcGIS Pro, and Google Earth Engine (GEE) software. Built-in tools and custom Python scripts using the rasterio and numpy libraries were used to perform individual steps.
To eliminate the influence of the atmosphere and improve the quality of the reflected signal, an automatic brightness correction technique based on the Dark Object Subtraction (DOS1) method was used. ArcGIS Pro used the built-in Radiometric Calibration and Atmospheric Correction tools, while Google Earth Engine used the corresponding functions to correct the surface reflectance (surface Reflectance).
To highlight the boundaries of the Yelek River basin, a vector shapefile was used, obtained on the basis of spatial analysis of a digital elevation model (DEM) using the Hydrology module of the ArcGIS Pro toolkit. In particular, the Watershed function was used to perform hydrological segmentation of the territory, which made it possible to obtain an accurate polygon of the Yelek River basin. This shapefile was then used for spatial clipping of satellite data with the addition of a 1 km buffer to capture the surrounding area. Clipping/extraction was performed using the Extract by Mask tool in ArcGIS Pro and similar operations in Google Earth Engine.
Each image was assigned a label reflecting the hydrological phase of the survey. For this purpose, a comparative table was used, compiled on the basis of survey dates and local hydrological reports from the Kazhydromet.
To identify water surfaces, the Normalised Difference Water Index (NDWI) was used according to the formula [35]:
NDWI = (Green − NIR)/(Green + NIR)
where Green is the reflectance in the green spectral range (Band 3), NIR is the reflectance in the near-infrared range (Band 5). The NDWI was calculated using Google Earth Engine, which allowed for the efficient processing of large amounts of data with minimal time expenditure. In ArcGIS Pro, the index was calculated using the Raster Calculator.
The following threshold values were used to highlight the water surface NDWI. (Table 2). To eliminate minor noise artefacts, morphological closing and opening operations were used with a 3 × 3 pixel structure element. In ArcGIS Pro, the Morphological Filters tool from the Spatial Analyst module was used for these operations, while in GEE, the focal_min and focal_max functions were used for sequential filtering.
The Nominal Difference Turbidity Index (NDTI) was used to quantitatively assess the spatial distribution of water surface turbidity:
NDTI = (Red − Green)/(Red + Green)
where Red is the reflectance in the red spectral range (Band 4), and Green is the reflectance in the green spectral range (Band 3). NDTI was calculated only for pixels classified as water by NDWI, which ensured that terrestrial and non-water objects were excluded from the analysis. The procedure was implemented using the built-in functions of ArcGIS Pro’s Raster Calculator and Google Earth Engine.
To interpret the results, an empirically based turbidity classification was used, based on comparing NDTI values with field measurements of turbidity (in FNE):
Low Turbidity: NDTI ≤ 0.10,
Medium Turbidity: 0.10 < NDTI ≤ 0.25,
High Turbidity: NDTI > 0.25.
Morphological filtering and turbidity classification were performed both in GEE and using ArcGIS Pro Spatial Analyst functions. Google Earth was used to visualise and verify intermediate results, where georeferenced rasters were overlaid on base maps. This comprehensive approach ensured the reproducibility and scalability of the analysis and allowed the results to be integrated with other spatial data for further hydrological and environmental studies.
For each selected hydrological phase and each year, the total surface water area (“water mirror”) and the distribution of this area across three turbidity categories (low, medium, high) were calculated. The area was calculated as the total number of pixels in each category multiplied by the Landsat 8 pixel area (30 × 30 m2 = 900 m2), taking into account the UTM conversion of the original boundary data.
For each field measurement date (e.g., 5 May 2024), the closest Landsat 8 scene images in time (±7 days) in the same hydrological phase were selected. Then, the turbidity values measured by the turbidimeter (FNE) were compared with the NDTI values within a radius of 100 m around the sampling point (taking into account the georeferencing accuracy of ≤30 m). The data obtained were used to validate the NDTI classification thresholds and test the spatial distribution of turbidity. Based on the NDTI classification results for each year and hydrological phase, the following were calculated: total water surface area (km2), area occupied by low turbidity (km2), area of medium turbidity (km2), area of high turbidity (km2). Based on these data, a time series of turbidity category areas for 2014–2025 was constructed for each phase. Trend analysis was performed using linear regression models and nonlinear approximations (second-order polynomials), as well as the Mann–Kendall test to identify statistically significant trends (α = 0.05).

2.2.4. Integral Assessment of Water Quality

In the context of increasing anthropogenic pressure on water resources and intensifying transboundary sources of pollution, especially in large river basins (e.g., the Yelek River), an objective assessment of surface water quality is of paramount importance. Traditional approaches based on individual indicators, such as the water pollution index (WPI), have certain limitations: they take into account a limited number of ingredients and do not reflect the complex interaction of pollutants, as well as the specifics of exceeding maximum permissible concentrations. In recent years, the Republic of Kazakhstan has developed and approved a comprehensive water pollution index (CWPI) methodology [36,37,38,39,40], which provides a more complete and representative picture of the state of aquatic ecosystems. Within the framework of this study, all calculations and analytical procedures were performed on the basis of the WPI, as it is established as a normative criterion for assessing the quality of surface waters in accordance with Order No. 111 [41] of the Minister of Ecology and Natural Resources of the Republic of Kazakhstan dated 20 March 2025. In addition, historical observation series and available data are formed specifically for this indicator, which ensures the correctness of comparisons both in terms of temporal dynamics and between different water bodies. The results obtained allow for comparison with data from the official state water quality monitoring system. The classification of water bodies according to WPI values is carried out in accordance with the approved scale (Table 3), where each WPI range corresponds to a specific water quality class—from ‘very clean’ (≤0.2) to ‘very dirty’ (6–10), which is convenient for making management decisions.
Based on the application of this method, it is possible to differentiate sources of pollution by river sections, which in turn allows the cleanest and most polluted areas along the length of the river to be identified.
The CWPI methodology is successfully applied in the practice of RSE Kazhydromet and is recommended for use in environmental monitoring, water management, environmental standardisation (including maximum permissible harmful emission (or discharge) into a water body (MRHE) calculations) and in assessing anthropogenic load (through coefficient in assessing anthropogenic impact). This makes it not only scientifically sound, but also a practical and sought-after methodology that contributes to the formation of a sustainable water protection policy system.
The combination of archival data (7 stations, 2010–2025), our own field measurements (3 stations, 2024–2025) and remote sensing provides a comprehensive approach to assessing river water quality. The representativeness of the three field points allows for the correction of satellite turbidity classification, and the availability of 7 archival points enables the analysis of long-term trends. This methodology can be recommended for regular monitoring and management decisions in the field of water quality assessment.

3. Results

The chemical characteristics of water samples obtained from the Kazhydromet RSE for the period 2010–2023 in terms of total suspended solids, total dissolved solids and dissolved oxygen in various hydrological phases (spring flood, winter and summer-autumn low water period of the Yelek River) are presented in Table 4, Table 5 and Table 6. Based on these data, water pollution indices (WPI) were calculated for each ingredient, averaged both for individual years and for the entire period under review.
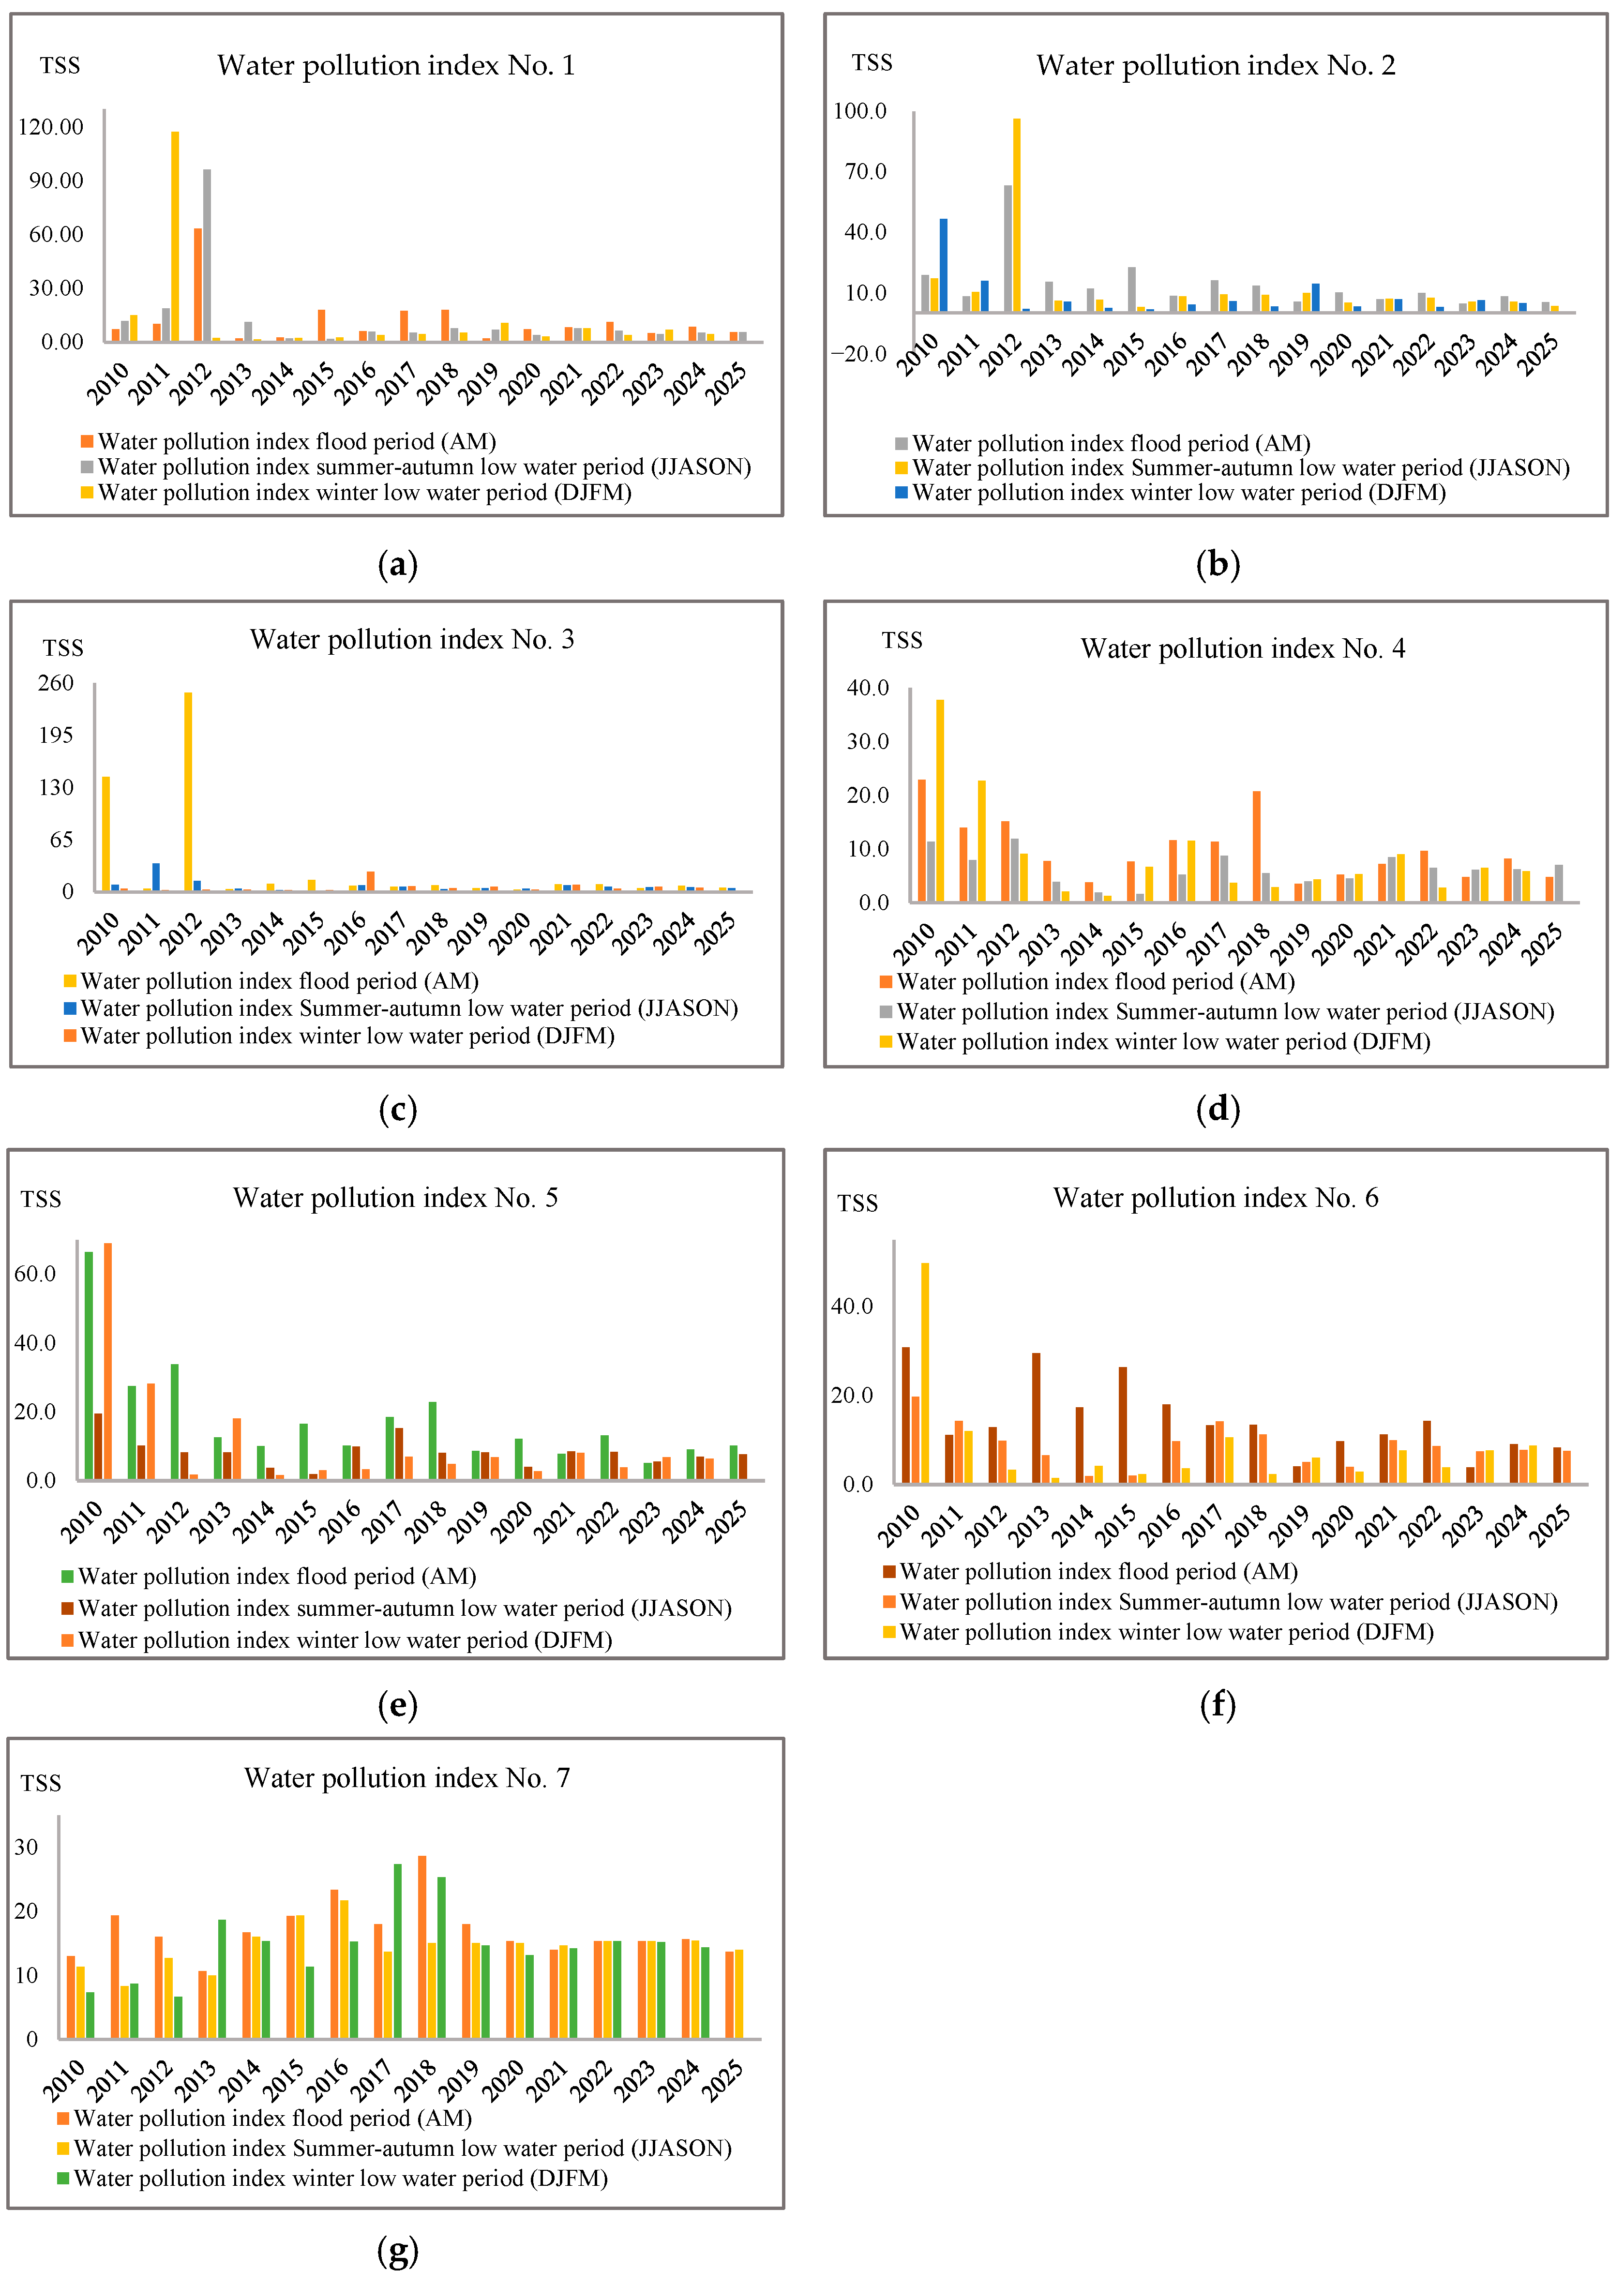
During the spring flood period (April–May), the WPI values for total suspended solids at seven hydrological stations ranged from 1.96 to 248. The maximum value (248) was recorded in 2012 at observation point No. 3 (Aktobe, 0.5 km above the city), which indicates a significant anthropogenic impact within the city limits. The minimum value (1.96) was recorded in 2013 at station No. 1 (Alga, 0.3 km above the city and 1 km above the sludge ponds of the Aktobe Chemical Plant) (see Figure 1), indicating relatively favourable water quality at this site during the period in question.
The identified fluctuations in WPI are explained by both natural and anthropogenic factors. Spring floods are accompanied by increased soil erosion and the transport of suspended particles into the riverbed, which leads to increased turbidity and total suspended solids content. Urban and industrial effluents contribute to this, especially in areas adjacent to Aktobe. In years with intense snowmelt and high flood levels, a significant influx of pollutants is observed, while in years with less pronounced floods, relatively low WPI values are recorded. Thus, the high variability of water quality indicators in the Yelek River basin reflects the combined influence of seasonal hydrological processes and local sources of anthropogenic pressure shown in Figure 2.
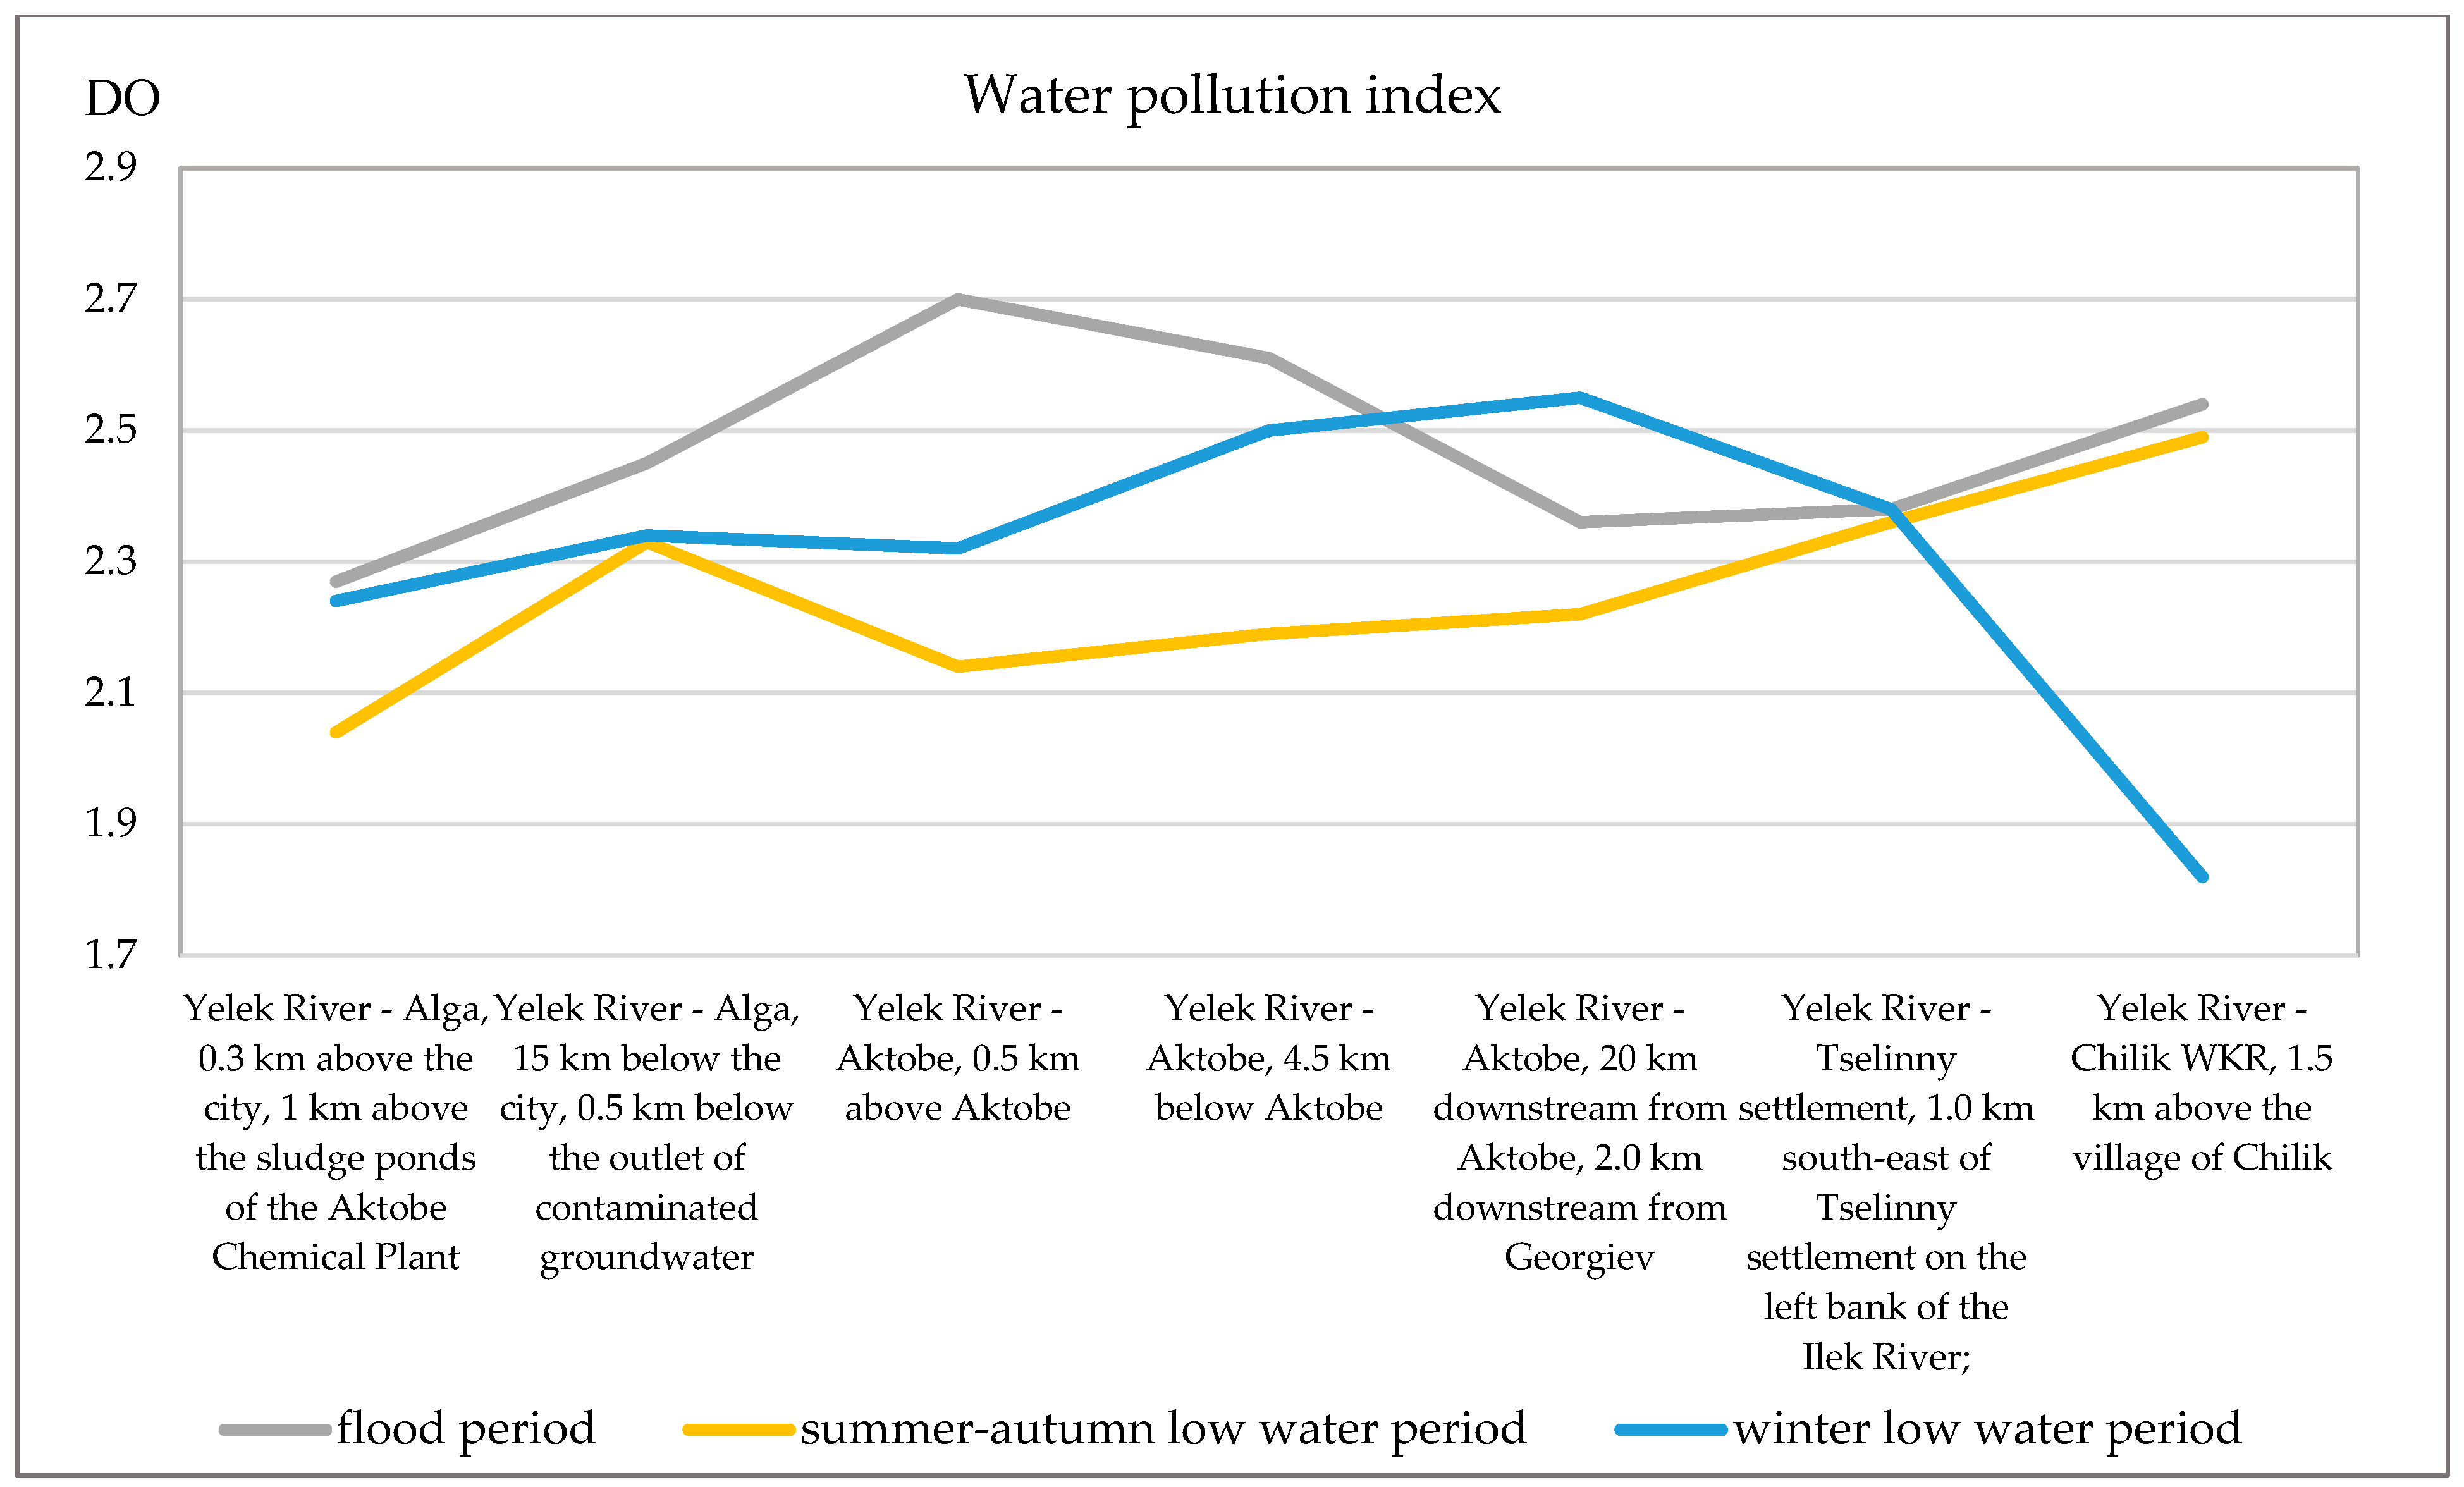
During the spring flood period, the average values of the dissolved oxygen index ranged from 2.61 to 2.27, in summer from 2.49 to 2.14, and in winter from 2.55 to 1.82. The minimum value (1.82) was recorded in the village of Chilik. The overall trend indicates that water quality is classified as ‘polluted’ according to this indicator. Seasonal fluctuations in dissolved oxygen are due to temperature, photosynthesis intensity, and water exchange rates. In spring, concentrations increased due to the inflow of fresh water, while in summer, with higher temperatures and low flow rates, oxygen saturation decreased, especially in the lower reaches (Figure 3).
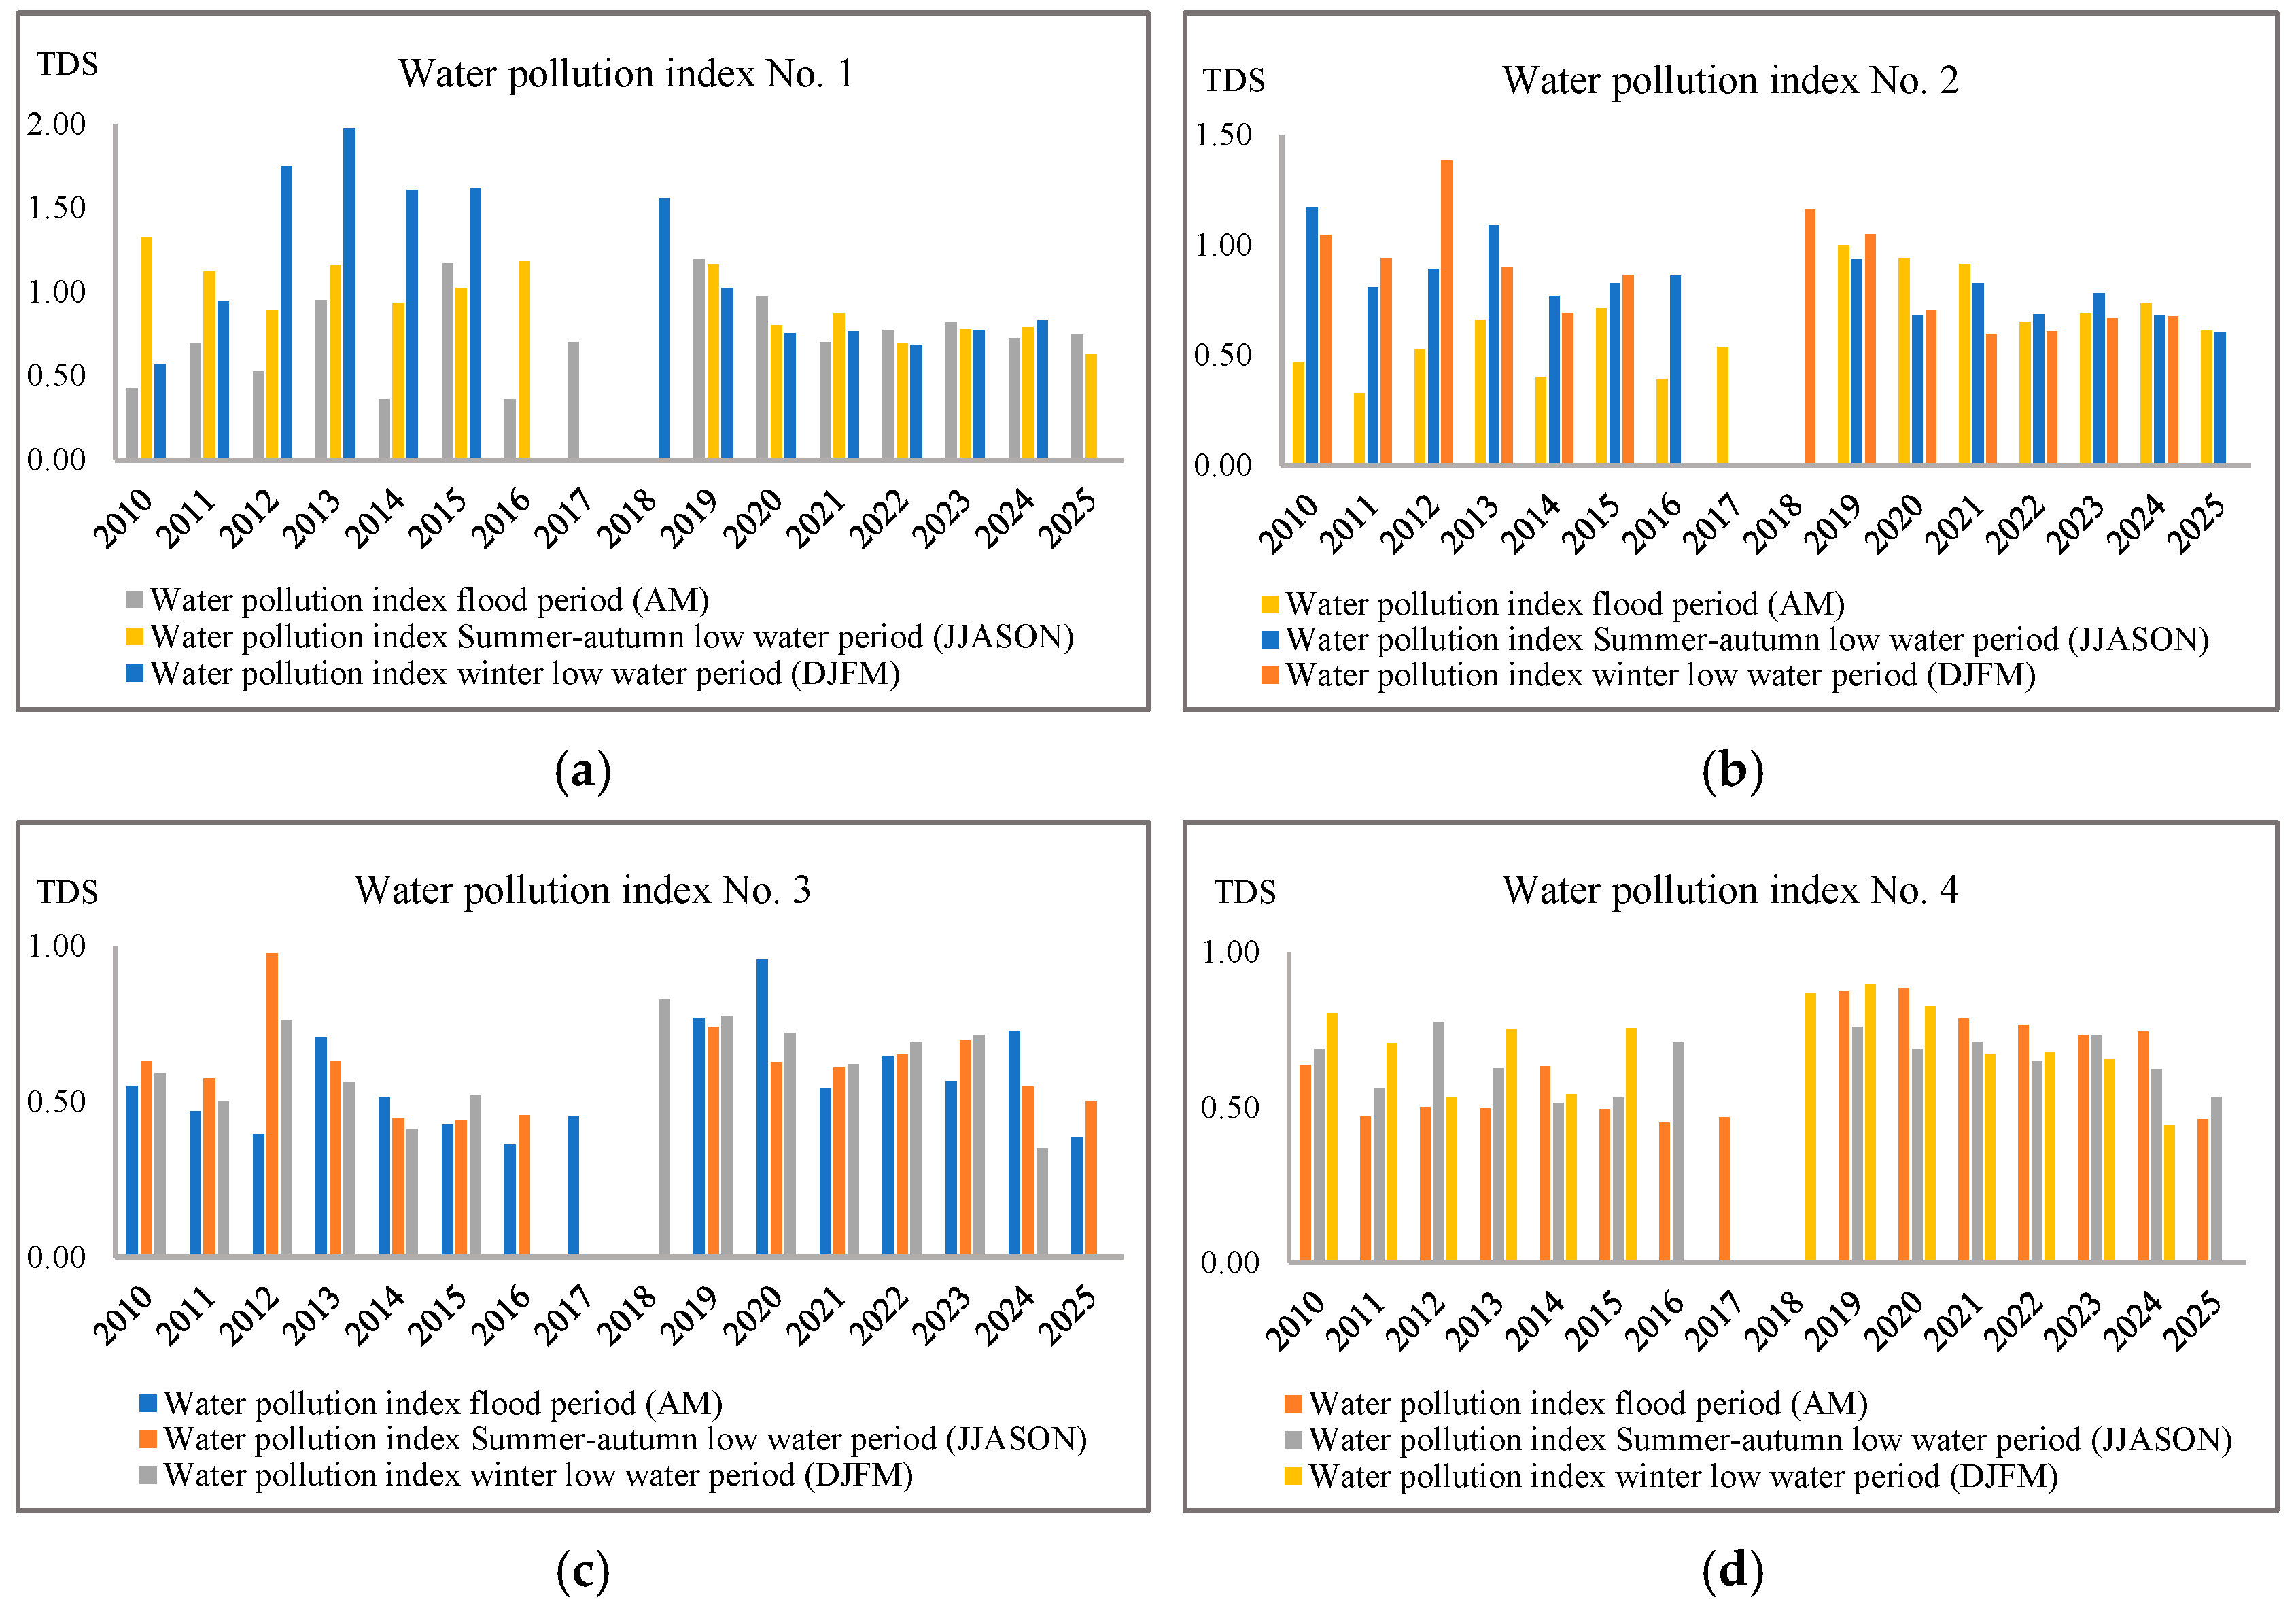
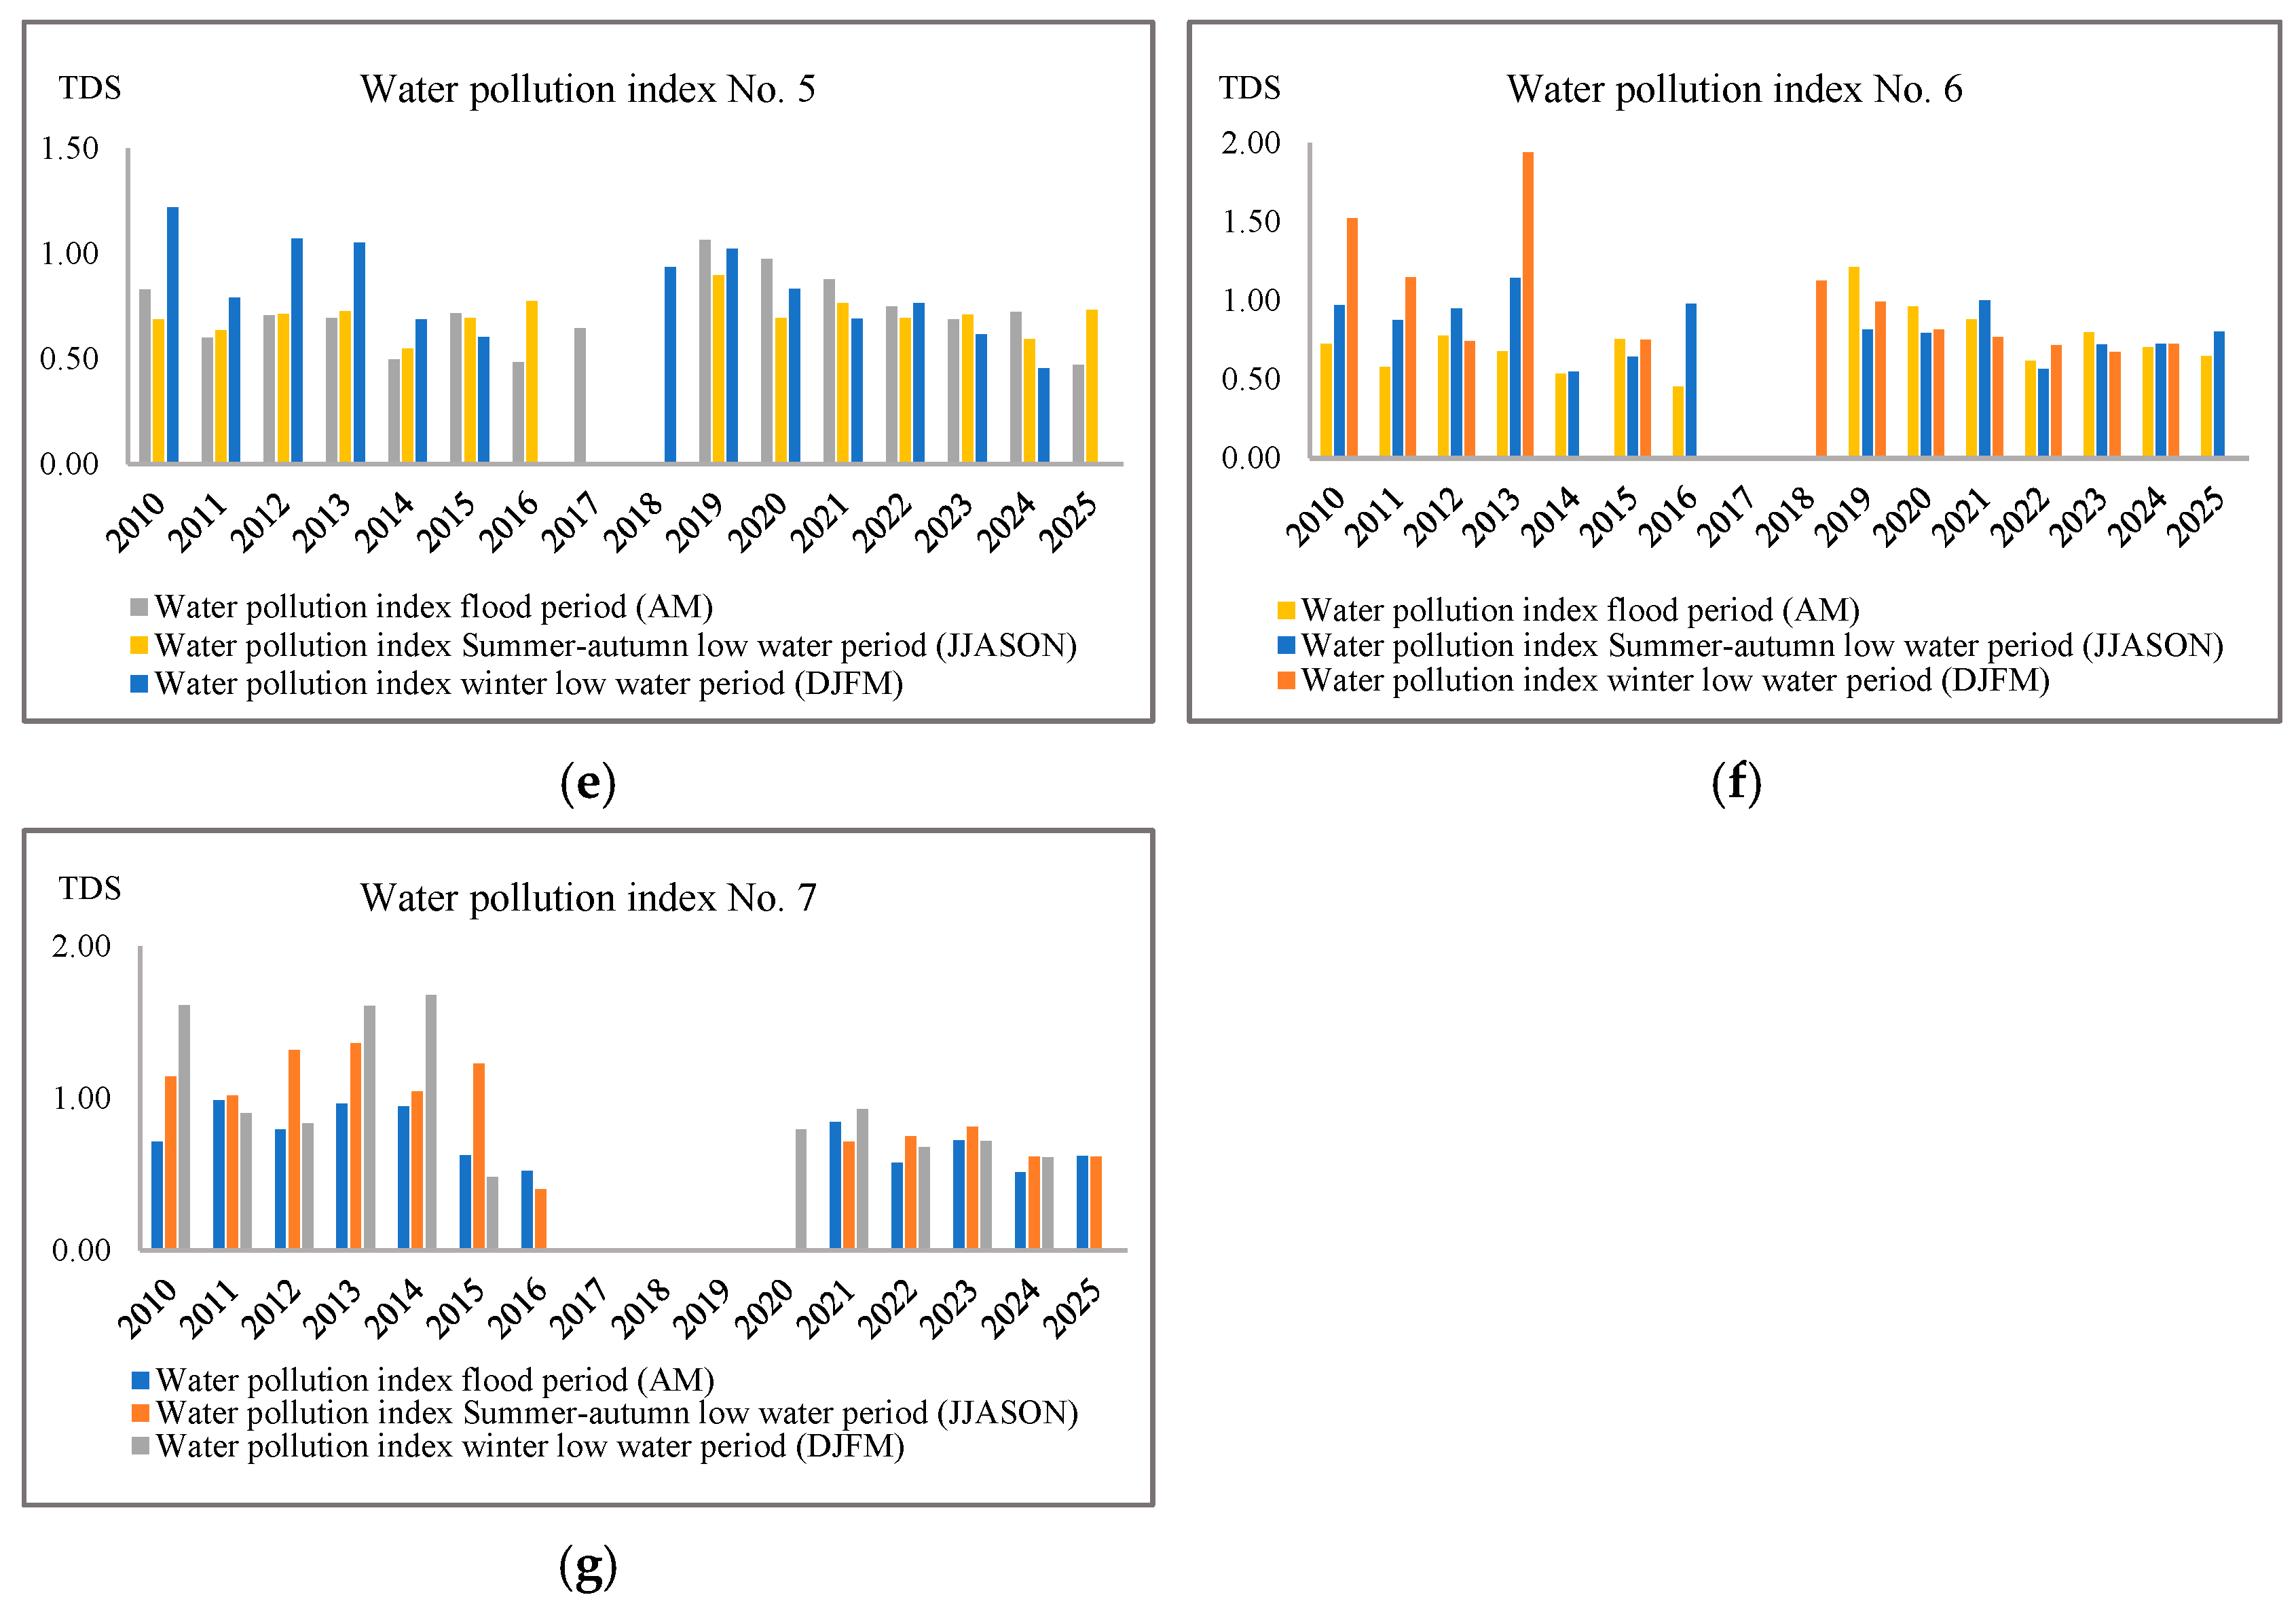
The water pollution Index (WPI) values for total dissolved solids during the period under review ranged from 0.33 to 1.21. The maximum value (1.21) was recorded in 2019 at hydrological station No. 6 (Tselinny), and the minimum (0.33) in 2011 at hydrological station No. 2 (Alga). The dynamics indicate moderate changes in total dissolved solids, which is associated with seasonal dilution and evaporation processes, as well as changes in the water balance. During periods of high water, a natural decrease in total dissolved solids was observed due to dilution by meltwater and rainwater, while in winter and during low water periods, an increase was recorded due to the concentration of salts at low water flow rates (Figure 4).
In accordance with the water quality classification by Construction Norms and Regulations (CnaR), the average values of the water pollution index (WPI) showed that the water of the Yelek River belongs to the category of “very polluted” in terms of total suspended solids content, in terms of dissolved oxygen content, it is classified as “polluted”, and in terms of total dissolved solids, it is classified as “moderately polluted” (3rd class of water quality).
As part of the analysis, the average WPI values for each indicator for all hydrological stations over a ten-year period were also calculated.
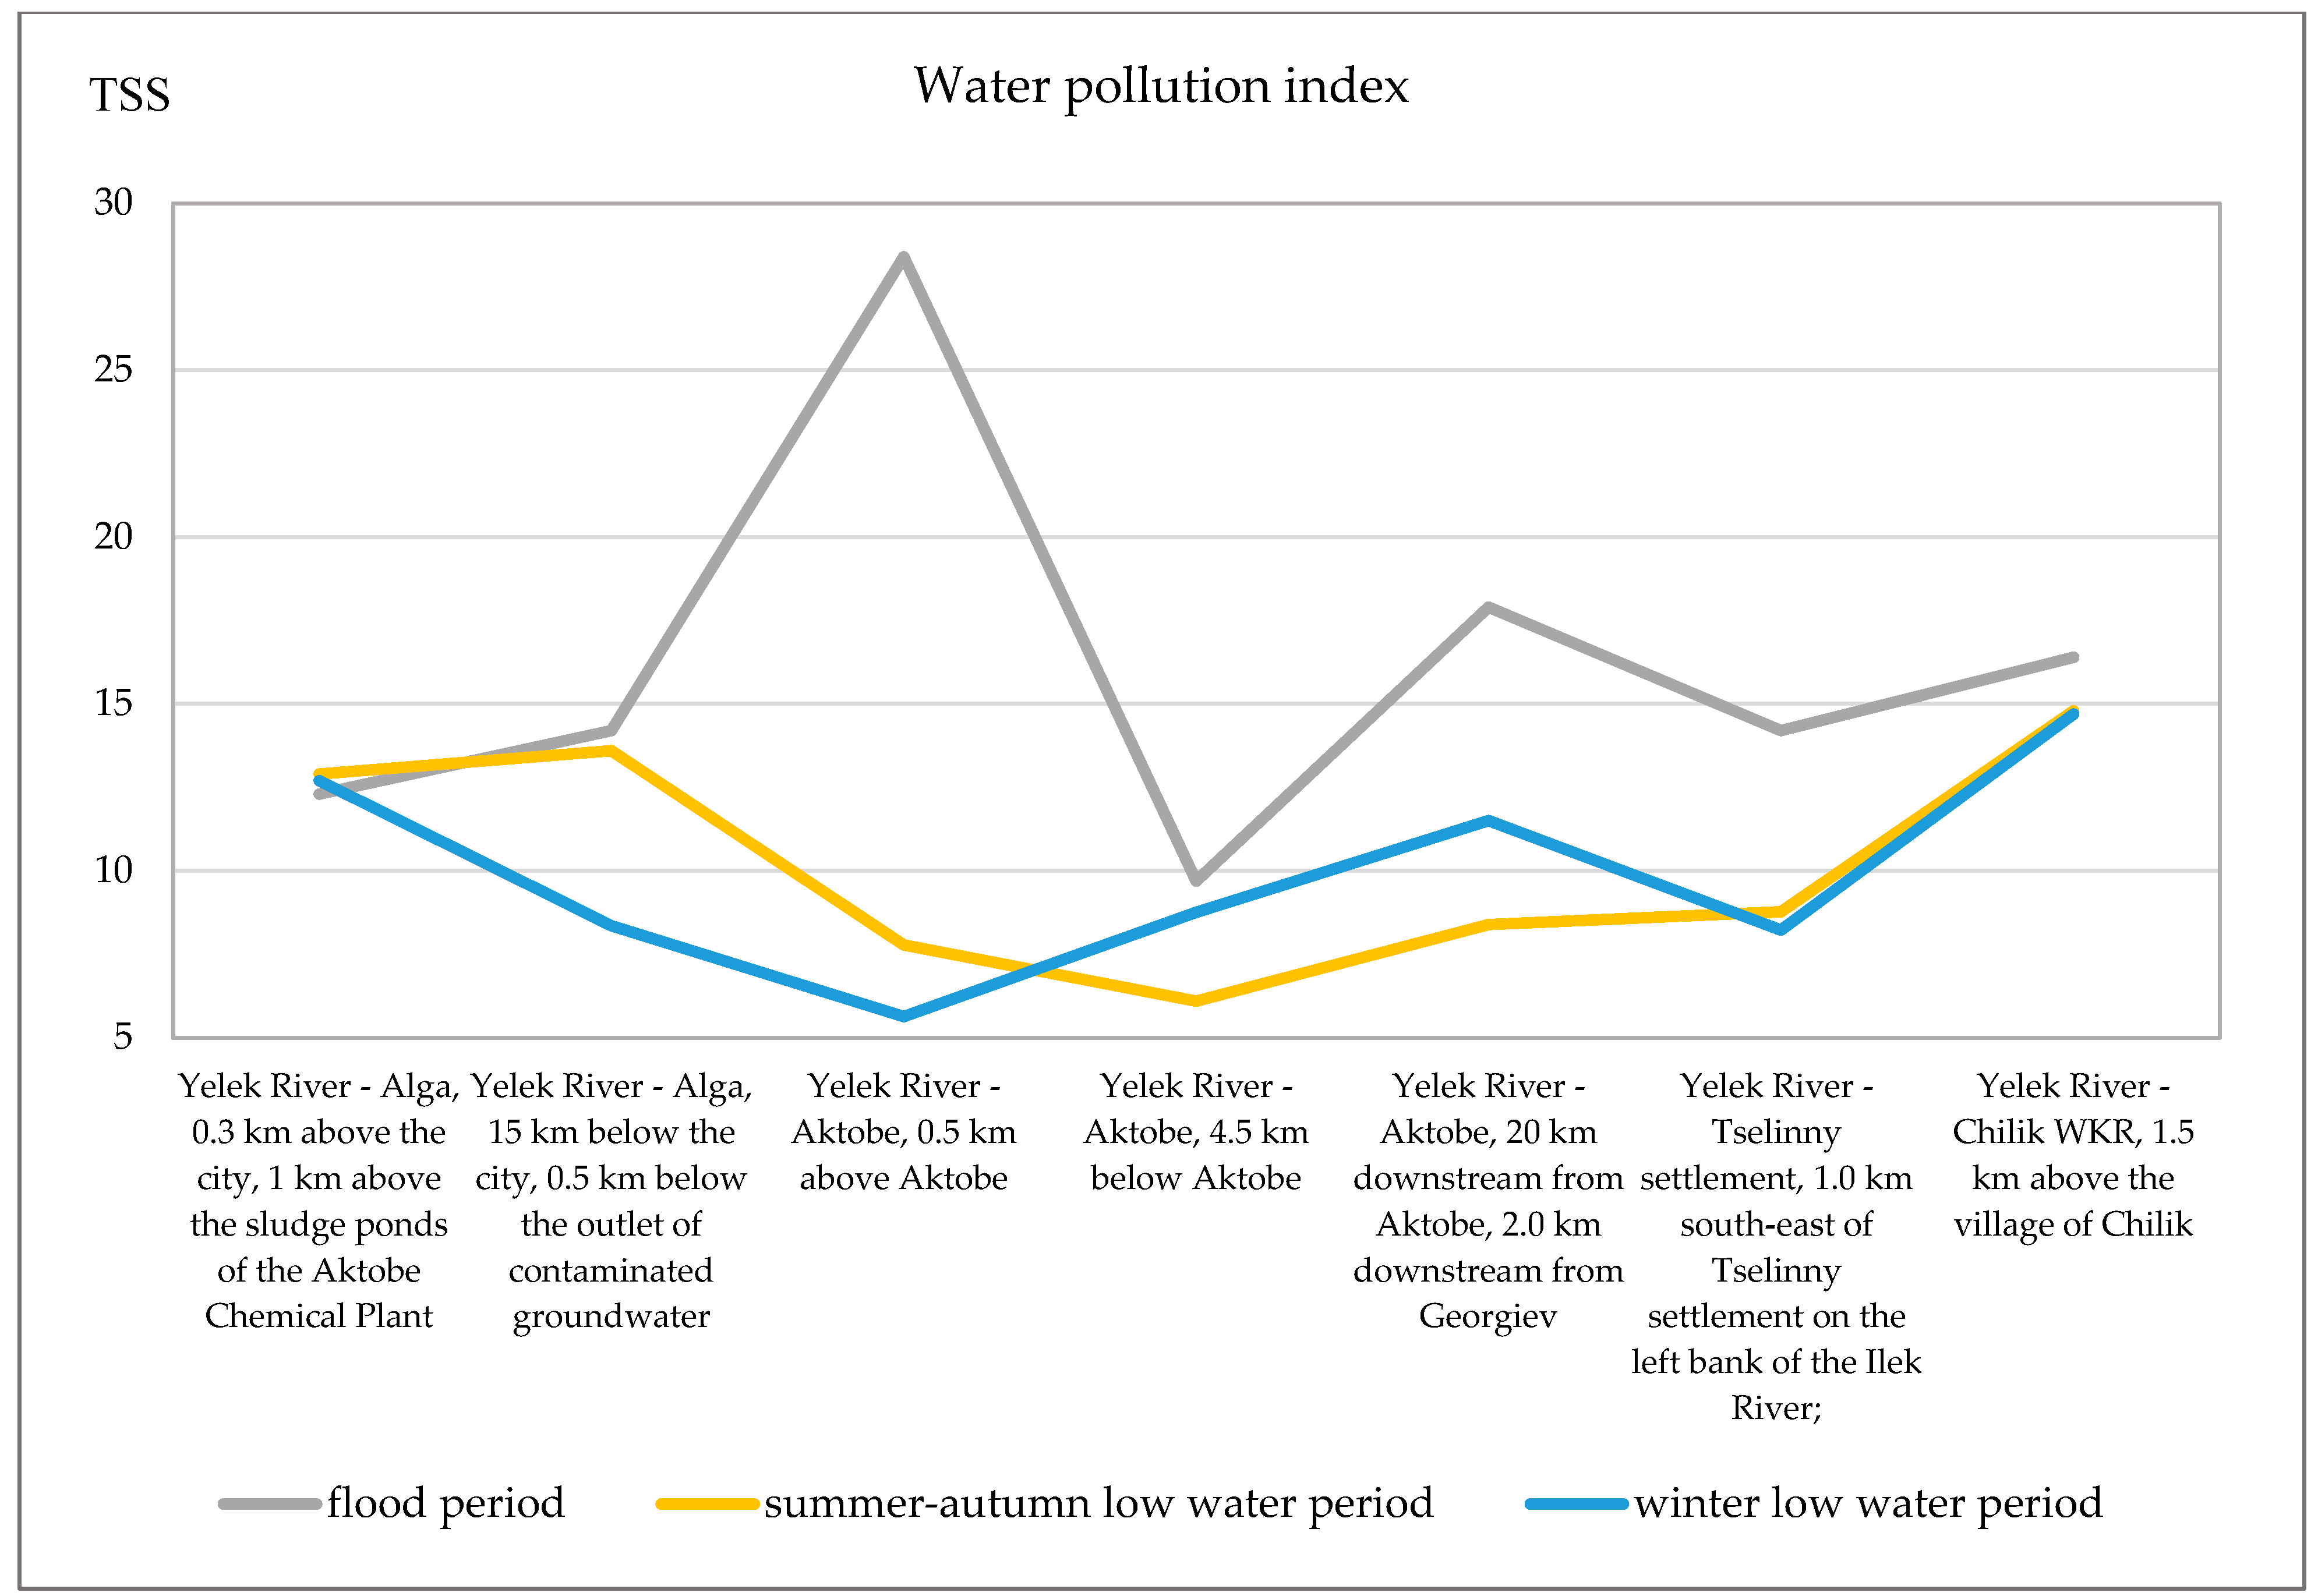
Total suspended solids. During the spring flood period, the maximum DSS value (28.4) was recorded at the hydrological station in Aktobe (0.5 km above the city), and the minimum (9.69) at the hydrological station in Aktobe (4.5 km below the city). During the summer-autumn low-water period, the values ranged from 14.8 to 6.1, and during the winter period, from 14.7 to 5.63. The greatest contrast was observed in spring, when both the maximum (28.4) and minimum (5.63) values were recorded at one hydrological station (Aktobe, 0.5 km upstream of the city). According to the overall assessment, the water of the Yelek River is classified as “extremely dirty” (7th quality class) (Figure 5).
During the spring flood period, the average WPI values ranged from 2.61 to 2.27, during the summer-autumn low-water period from 2.49 to 2.14, and during the winter period from 2.55 to 1.82. The maximum value (2.61) was recorded at the Aktobe hydrological station (4.5 km downstream from the city), and the minimum (1.82) at the Chilik hydrological station (West Kazakhstan Region, 1.5 km upstream from the village of Chilik). Overall, the water of the Yelek River is classified as “polluted” in terms of dissolved oxygen content (Figure 6).
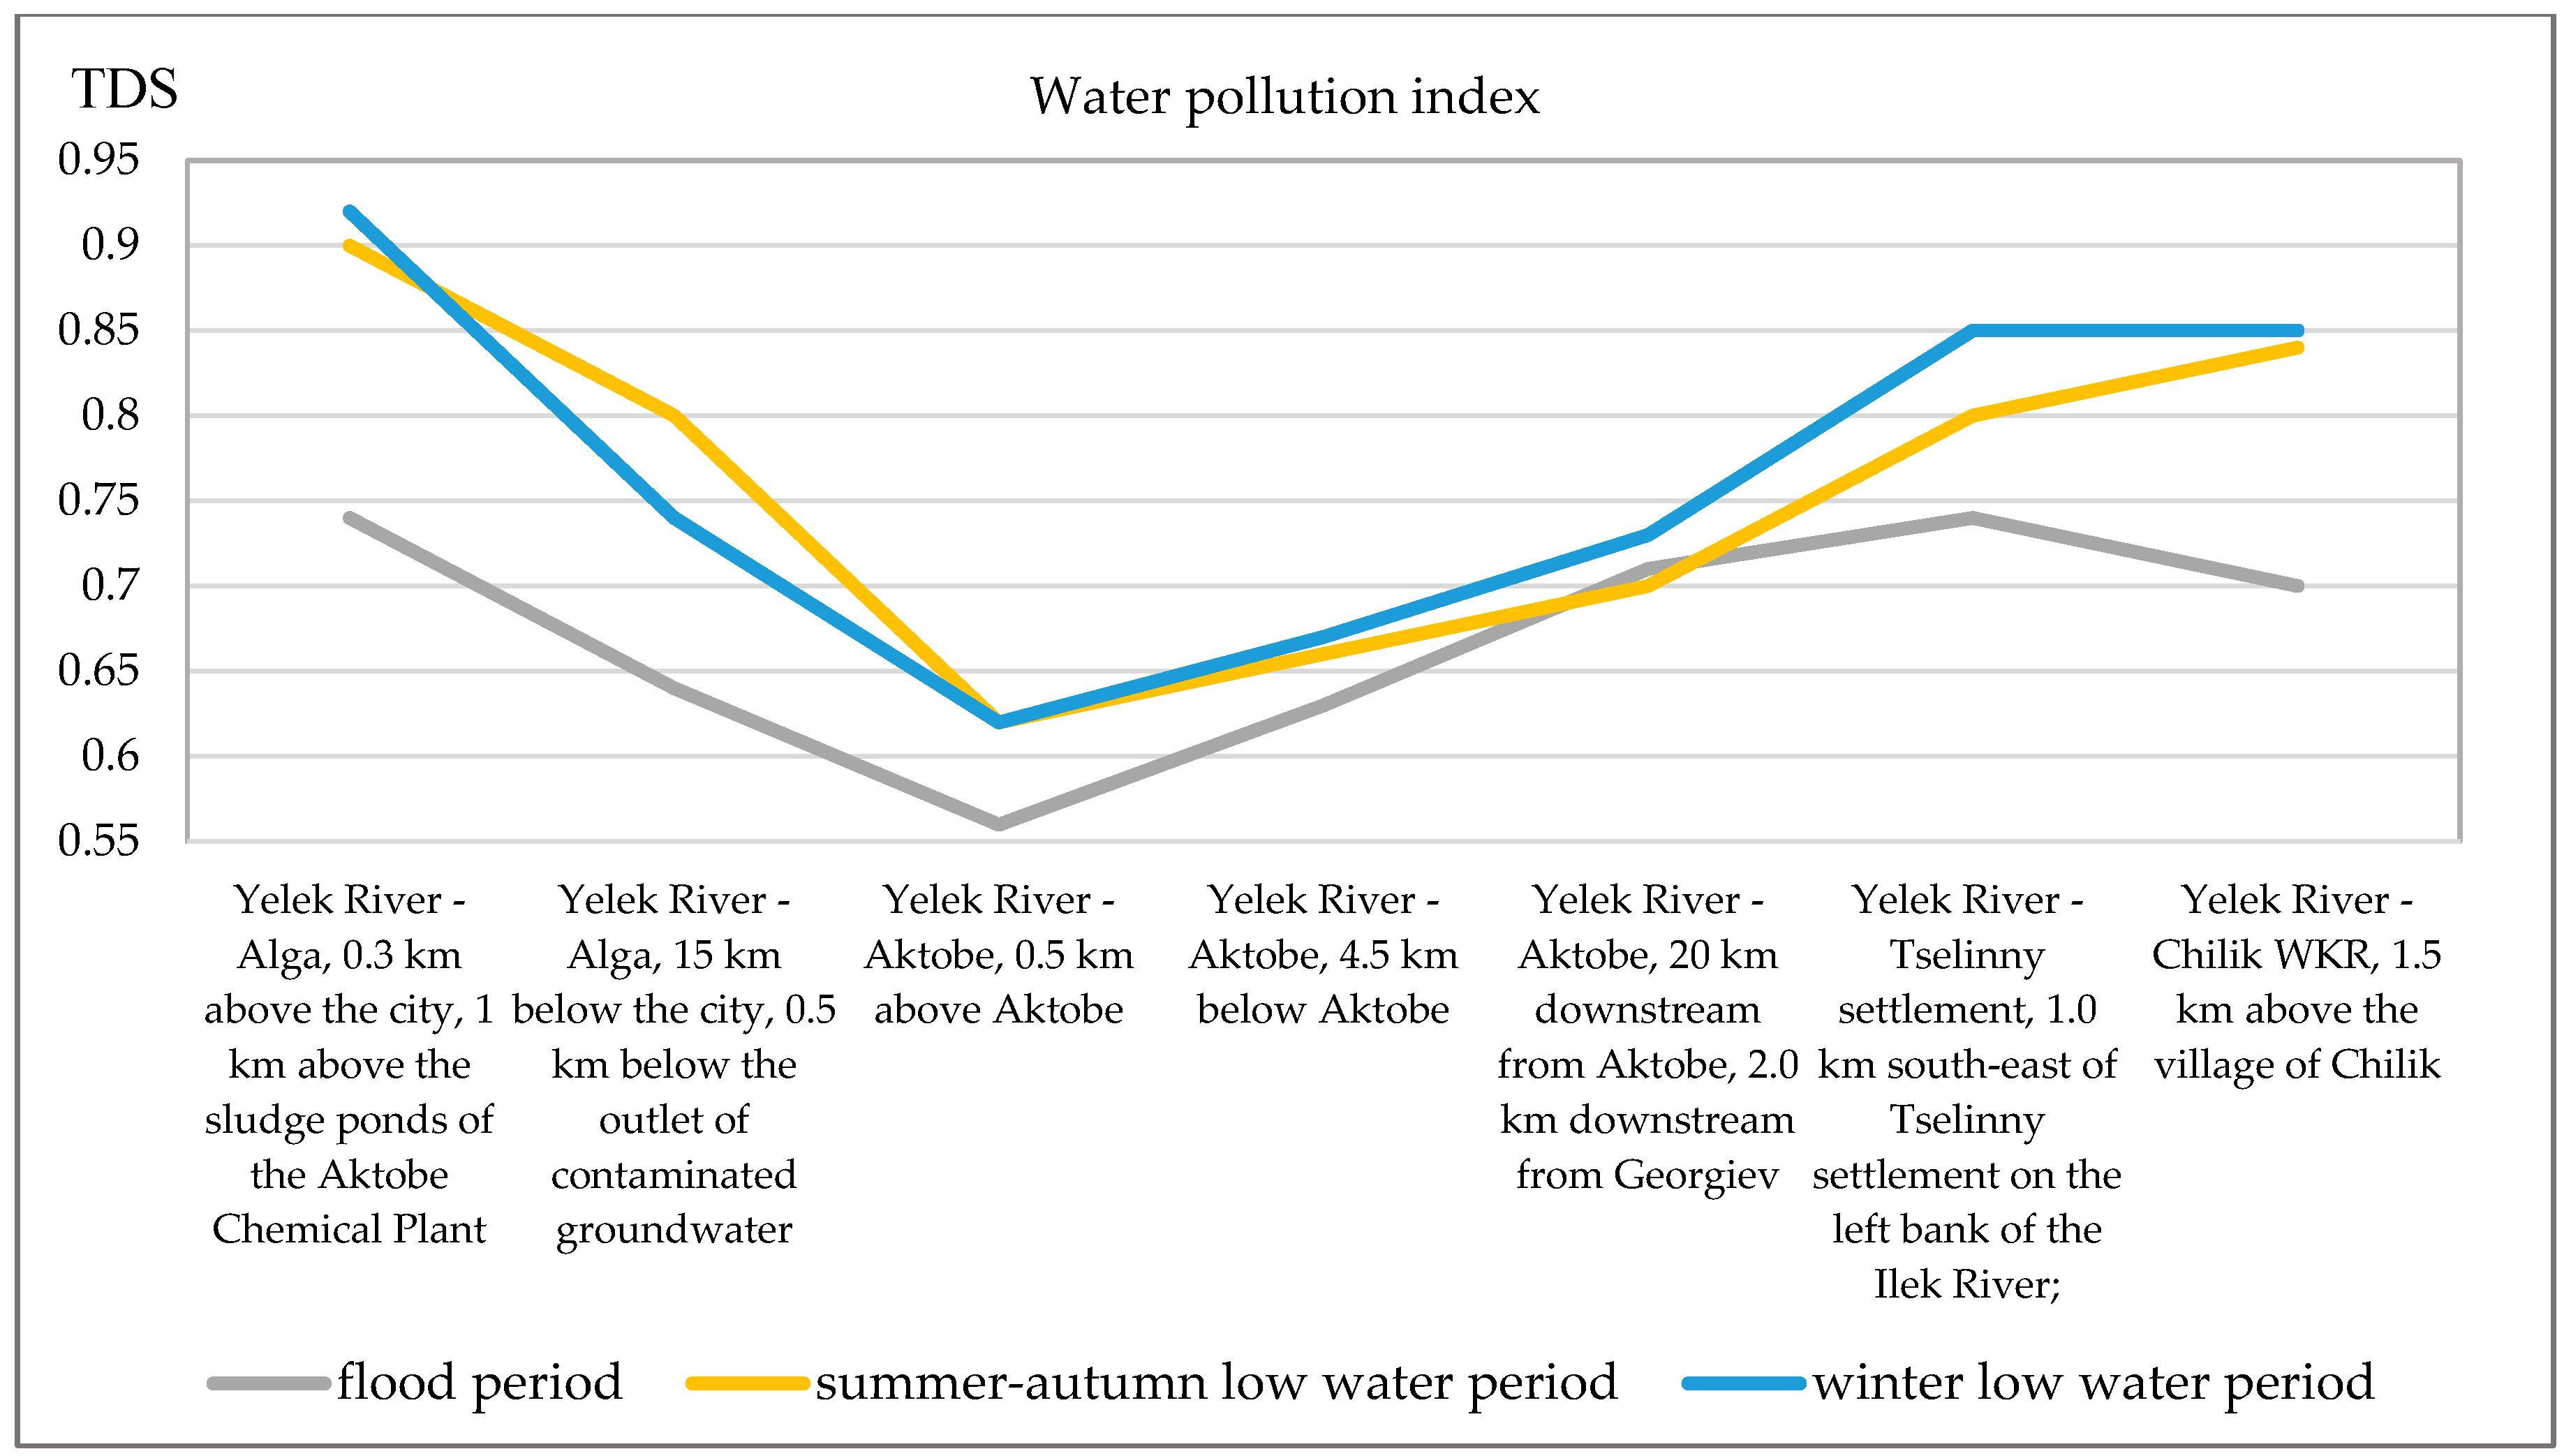
Total dissolved solids (TDS). During the spring flood period, the WPI values ranged from 0.74 to 0.56, in summer from 0.90 to 0.62, and in winter from 0.92 to 0.62. The highest values (0.92) were recorded in the Alga area, where total dissolved solids is significantly influenced by the proximity of sludge ponds and underground drains. Overall, water is classified as ‘clean’ according to this indicator. The dynamics indicate a slight variability in total dissolved solids, which is explained by the stable geochemical background of the basin (Figure 7).
Water turbidity was determined using Landsat 8 (2014–2023) and Sentinel-2 (2024) satellite data, using a regression relationship between the NDTI and turbidity (NTU). The best approximation was obtained for the quadratic model (R2 = 0.398). The maximum turbidity values (116.7 mg/L) were recorded in 2021, and the minimum values (17.6 mg/L) in 2014. The nature of the changes demonstrates a close connection with the hydrological regime: erosion processes prevail in spring, anthropogenic factors in summer, and particle precipitation at low temperatures in winter. The errors between satellite and field data were 27.8% (spring) and 38.8% (summer–autumn), which is acceptable for large-scale monitoring.
Regression analysis methods were used to establish a quantitative relationship between the spectral turbidity index, NDTI, and the water turbidity index (NTU). The following data were used as input data:
  • Water turbidity values in NTU units obtained from field measurements,
  • NDTI values calculated from satellite images (remote sensing data).
Various types of models were tested to approximate the relationship: linear, quadratic, logarithmic, power, and exponential. Regression models were constructed in R (version 4.2.1) using the lm function and the readxl package for data loading.
The criterion for selecting the best approximation was the coefficient of determination R2, which characterises the degree of explained variation in the observed values.
A comparative analysis showed that the best approximation of the relationship between NDTI and water turbidity (NTU) is a quadratic regression with a coefficient of determination R2 = 0.398. The resulting equation is as follows:
NTU = 19.58 – 42.01⋅NDTI + 226.99⋅NDTI
where
NTU—turbidity values obtained from field observations,
NDTI—spectral turbidity index calculated from remote sensing data.
The resulting relationship reflects the nonlinear nature of the connection: at low NDTI values, a decrease in turbidity is observed, but as the index increases, a pronounced increase in NTU occurs. This is consistent with the physical nature of the process: an increase in the concentration of total suspended solids enhances light scattering, which is recorded on the spectral channels of satellite data.
Thus, the quadratic model allows us to link field measurements of turbidity with satellite monitoring data and can be used for predictive assessment of NTU in conditions of insufficient field observations (Figure 8).
According to Figure 8, based on Landsat 8 and Sentinel-2 satellite data (2024), the dynamics of water turbidity in the river are characterised by significant seasonal and interannual fluctuations. The maximum turbidity values were recorded in 2021 during the summer-autumn low water period and reached 116.7 mg/L, which is probably due to low water levels, increased anthropogenic impact and erosion processes in the river basin. The minimum turbidity was recorded in 2014 and amounted to 17.6 mg/L. During the spring flood period, the values ranged from 17.6 to 64.9 mg/L, reflecting the natural processes of erosion and the influx of suspended sediments during snowmelt. During the summer-autumn low water period, the range of fluctuations was wider, from 18.6 to 116.7 mg/L, indicating the influence of not only natural factors but also economic activity. During the winter low water period, turbidity varied from 17.7 to 72.5 mg/L, which may be due to the peculiarities of the ice regime and a decrease in the river’s self-cleaning capacity. Thus, analysis of the identified trends allows us to conclude that water quality is highly dependent on seasonal conditions and external influences, which must be taken into account in water resource management.
Field studies were conducted on the Yelek River in the spring and summer-autumn periods, during which water samples were taken. The average concentration of total suspended solids during the spring flood period was 36.0 mg/L, while according to Sentinel-2 satellite observations, this value reached 46.0 mg/L. In the summer-autumn period, the concentration was 18.0 mg/L, while according to Sentinel-2 data, it was 25.0 mg/L. The error calculation showed that the error for the spring period was 27.8%, and for the summer-autumn period, it was 38.8%. It should be noted that discrepancies between field and satellite data might be due to a number of factors, including the time lag between sampling and satellite passage, local hydrological and meteorological conditions, and spatial averaging of satellite observations, which does not always reflect the exact characteristics of a specific sampling point. Nevertheless, the results of the analysis confirm that the use of Sentinel-2 data is a promising tool for comprehensive water quality monitoring, allowing to supplement and refine the results of traditional field observations, as well as to provide broader spatial and temporal coverage.
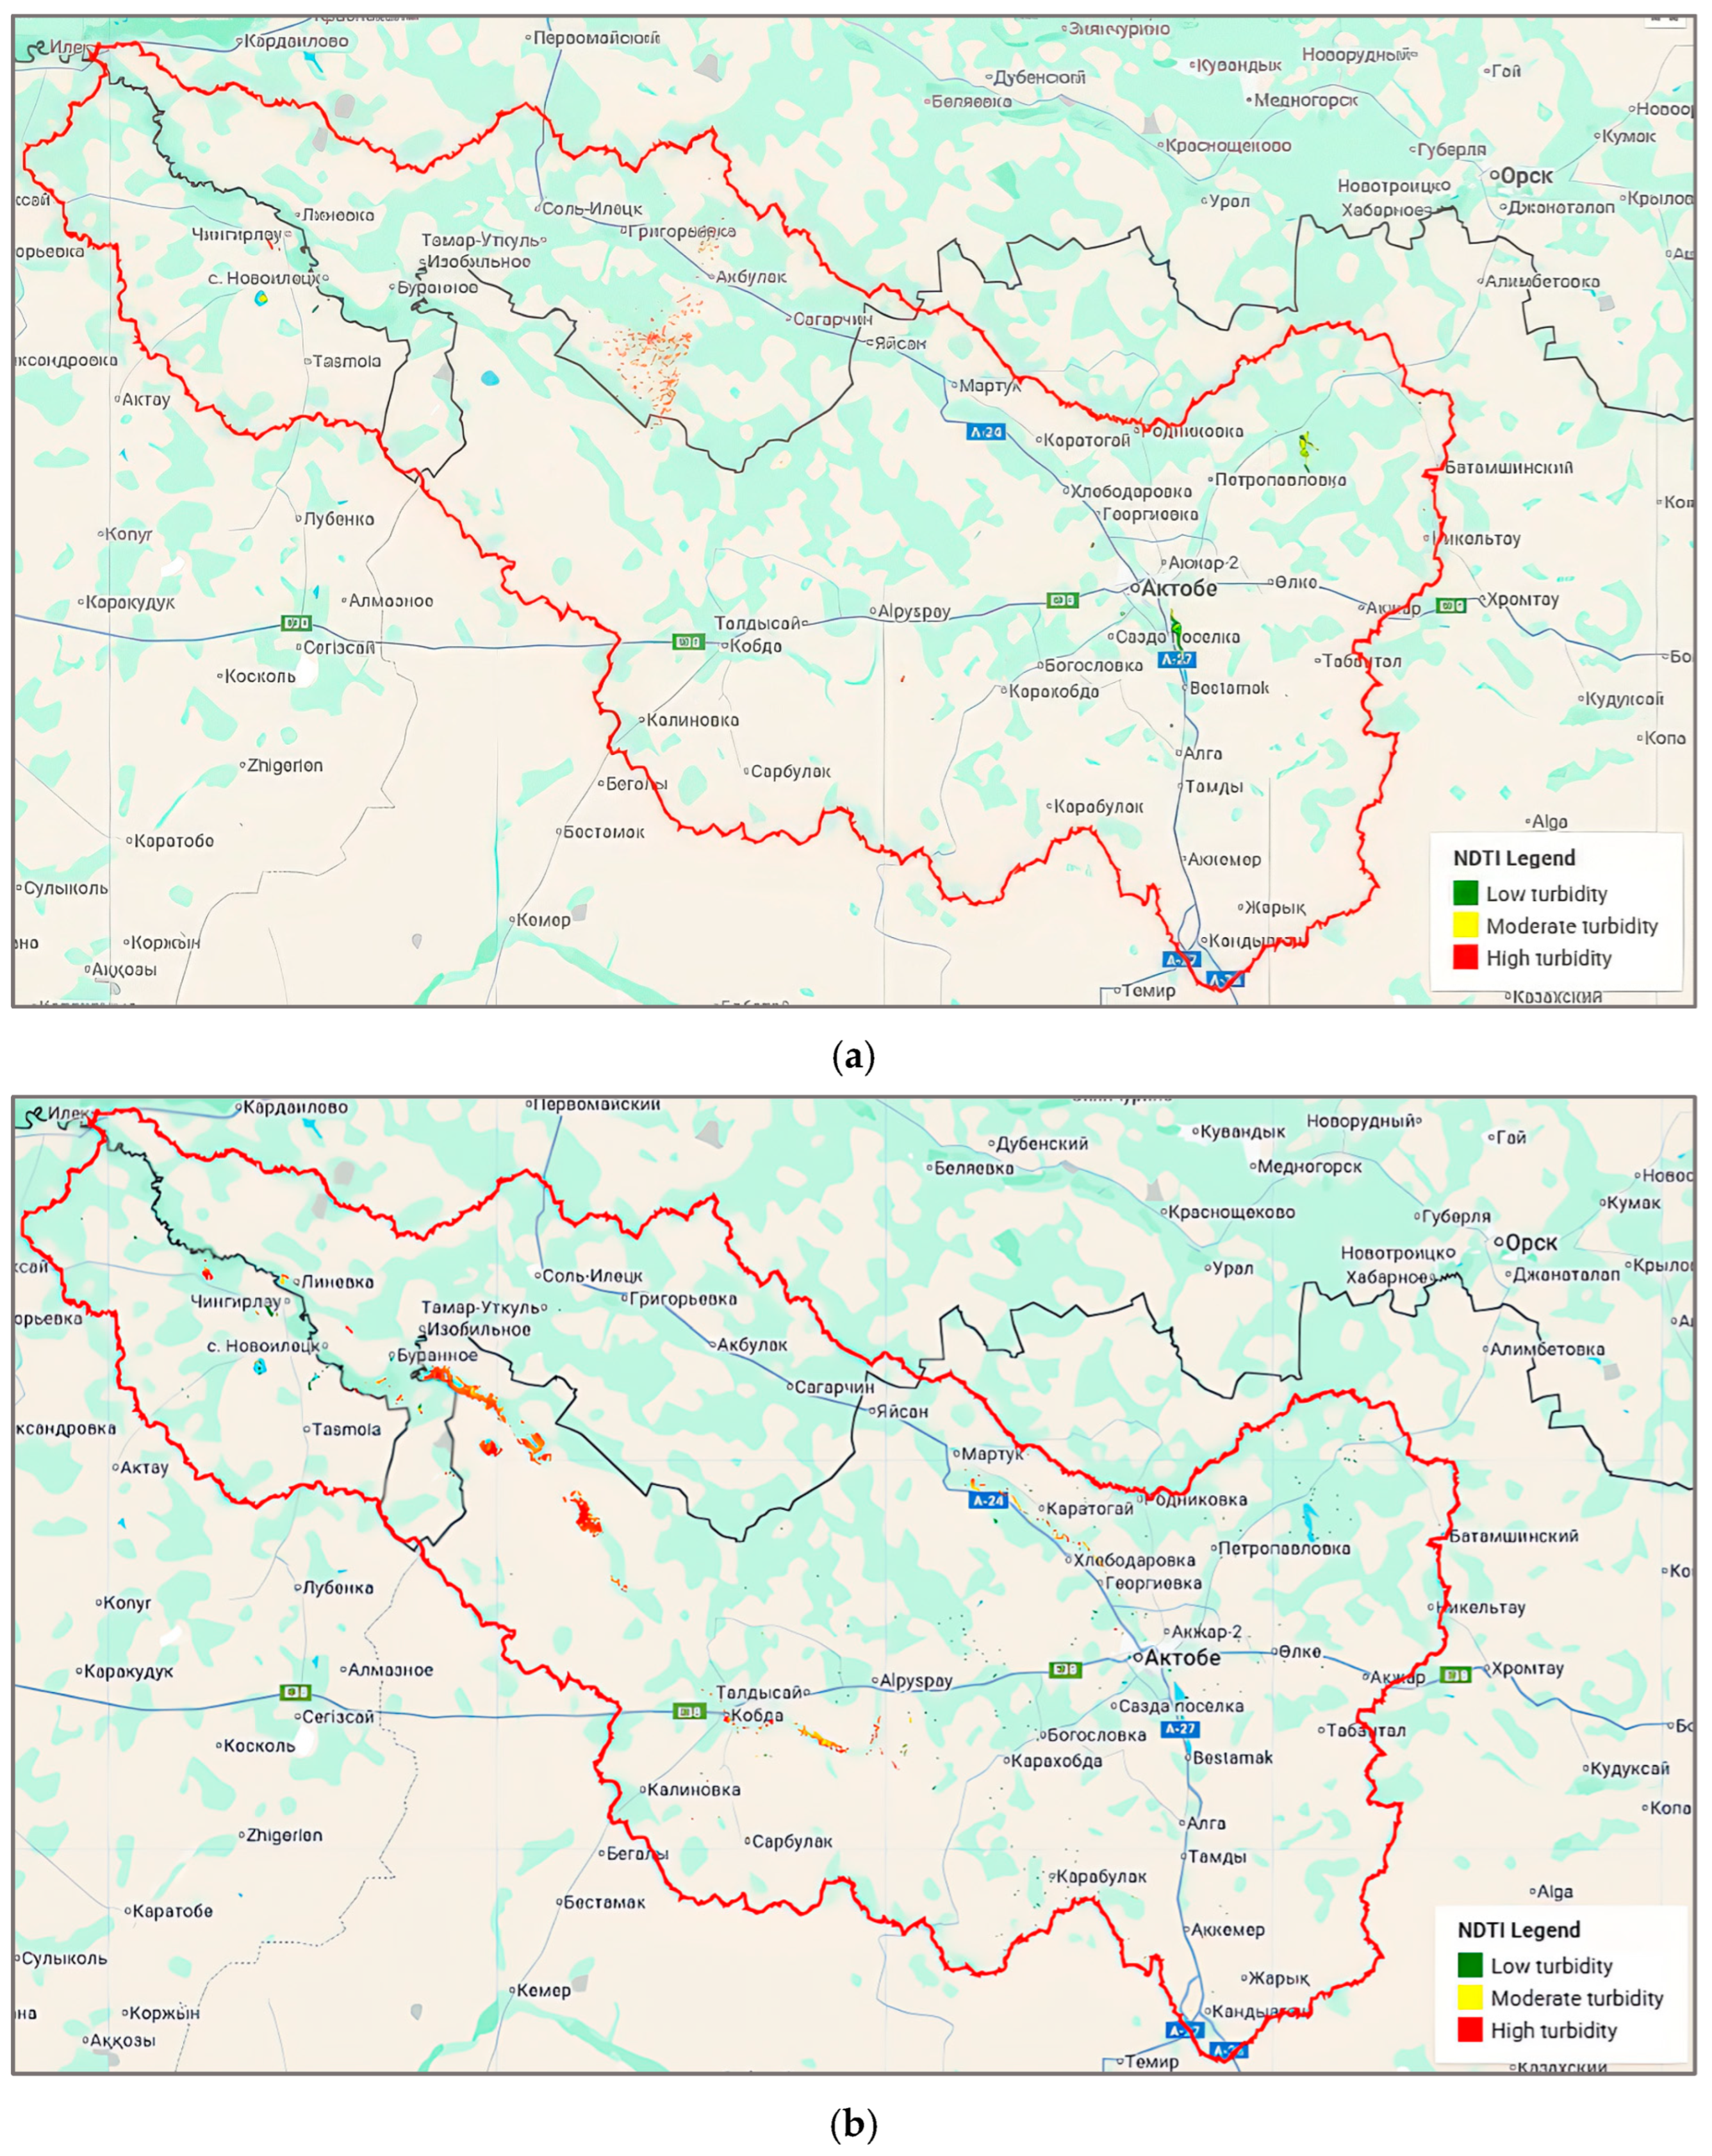
Figure 9 shows spatial changes in water turbidity in the Yelek River basin during different hydrological phases, classified based on Landsat-8 and Sentinel-2 satellite data. Such analysis allows for regular monitoring of water quality and assessment of the impact of hydrological processes on the state of water resources, which is important for effective basin management.
As is well known, river water quality directly depends on water discharges during different hydrological phases. At water discharges decreases (during low water), water becomes more concentrated, which degrades its quality due to reduced dilution and increased concentration of pollutants. Conversely, at high water discharges (flood season, floods), intensive dilution and leaching of pollutants occurs, which temporarily improves water quality, although it is accompanied by an increase in total suspended solids and a decrease in transparency.
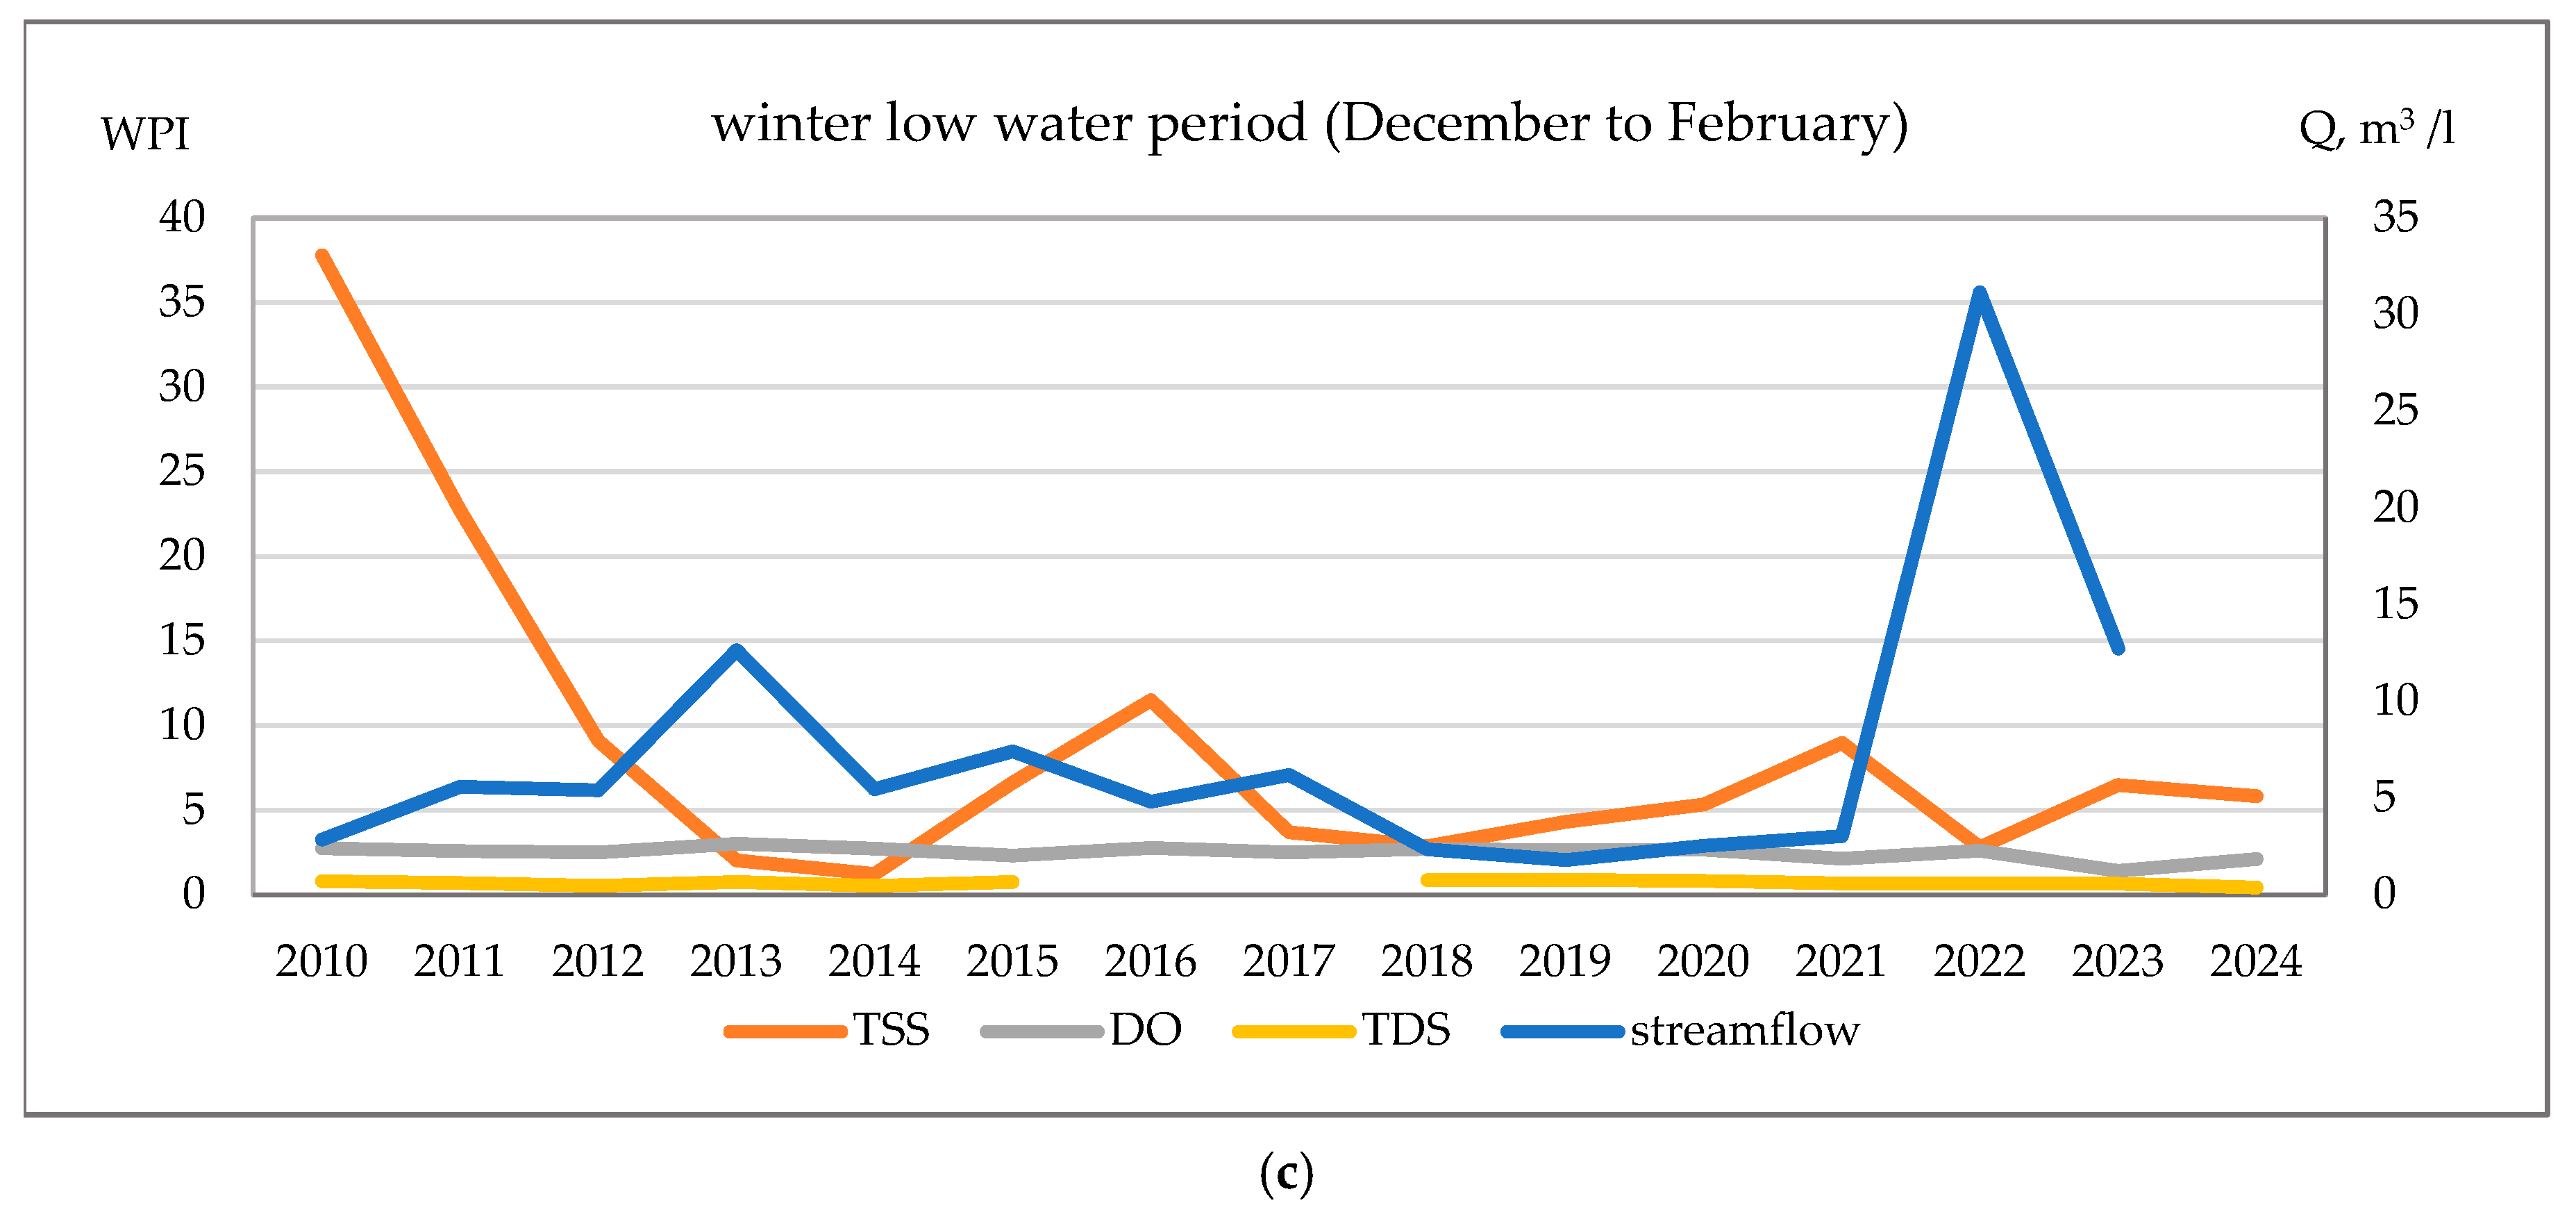
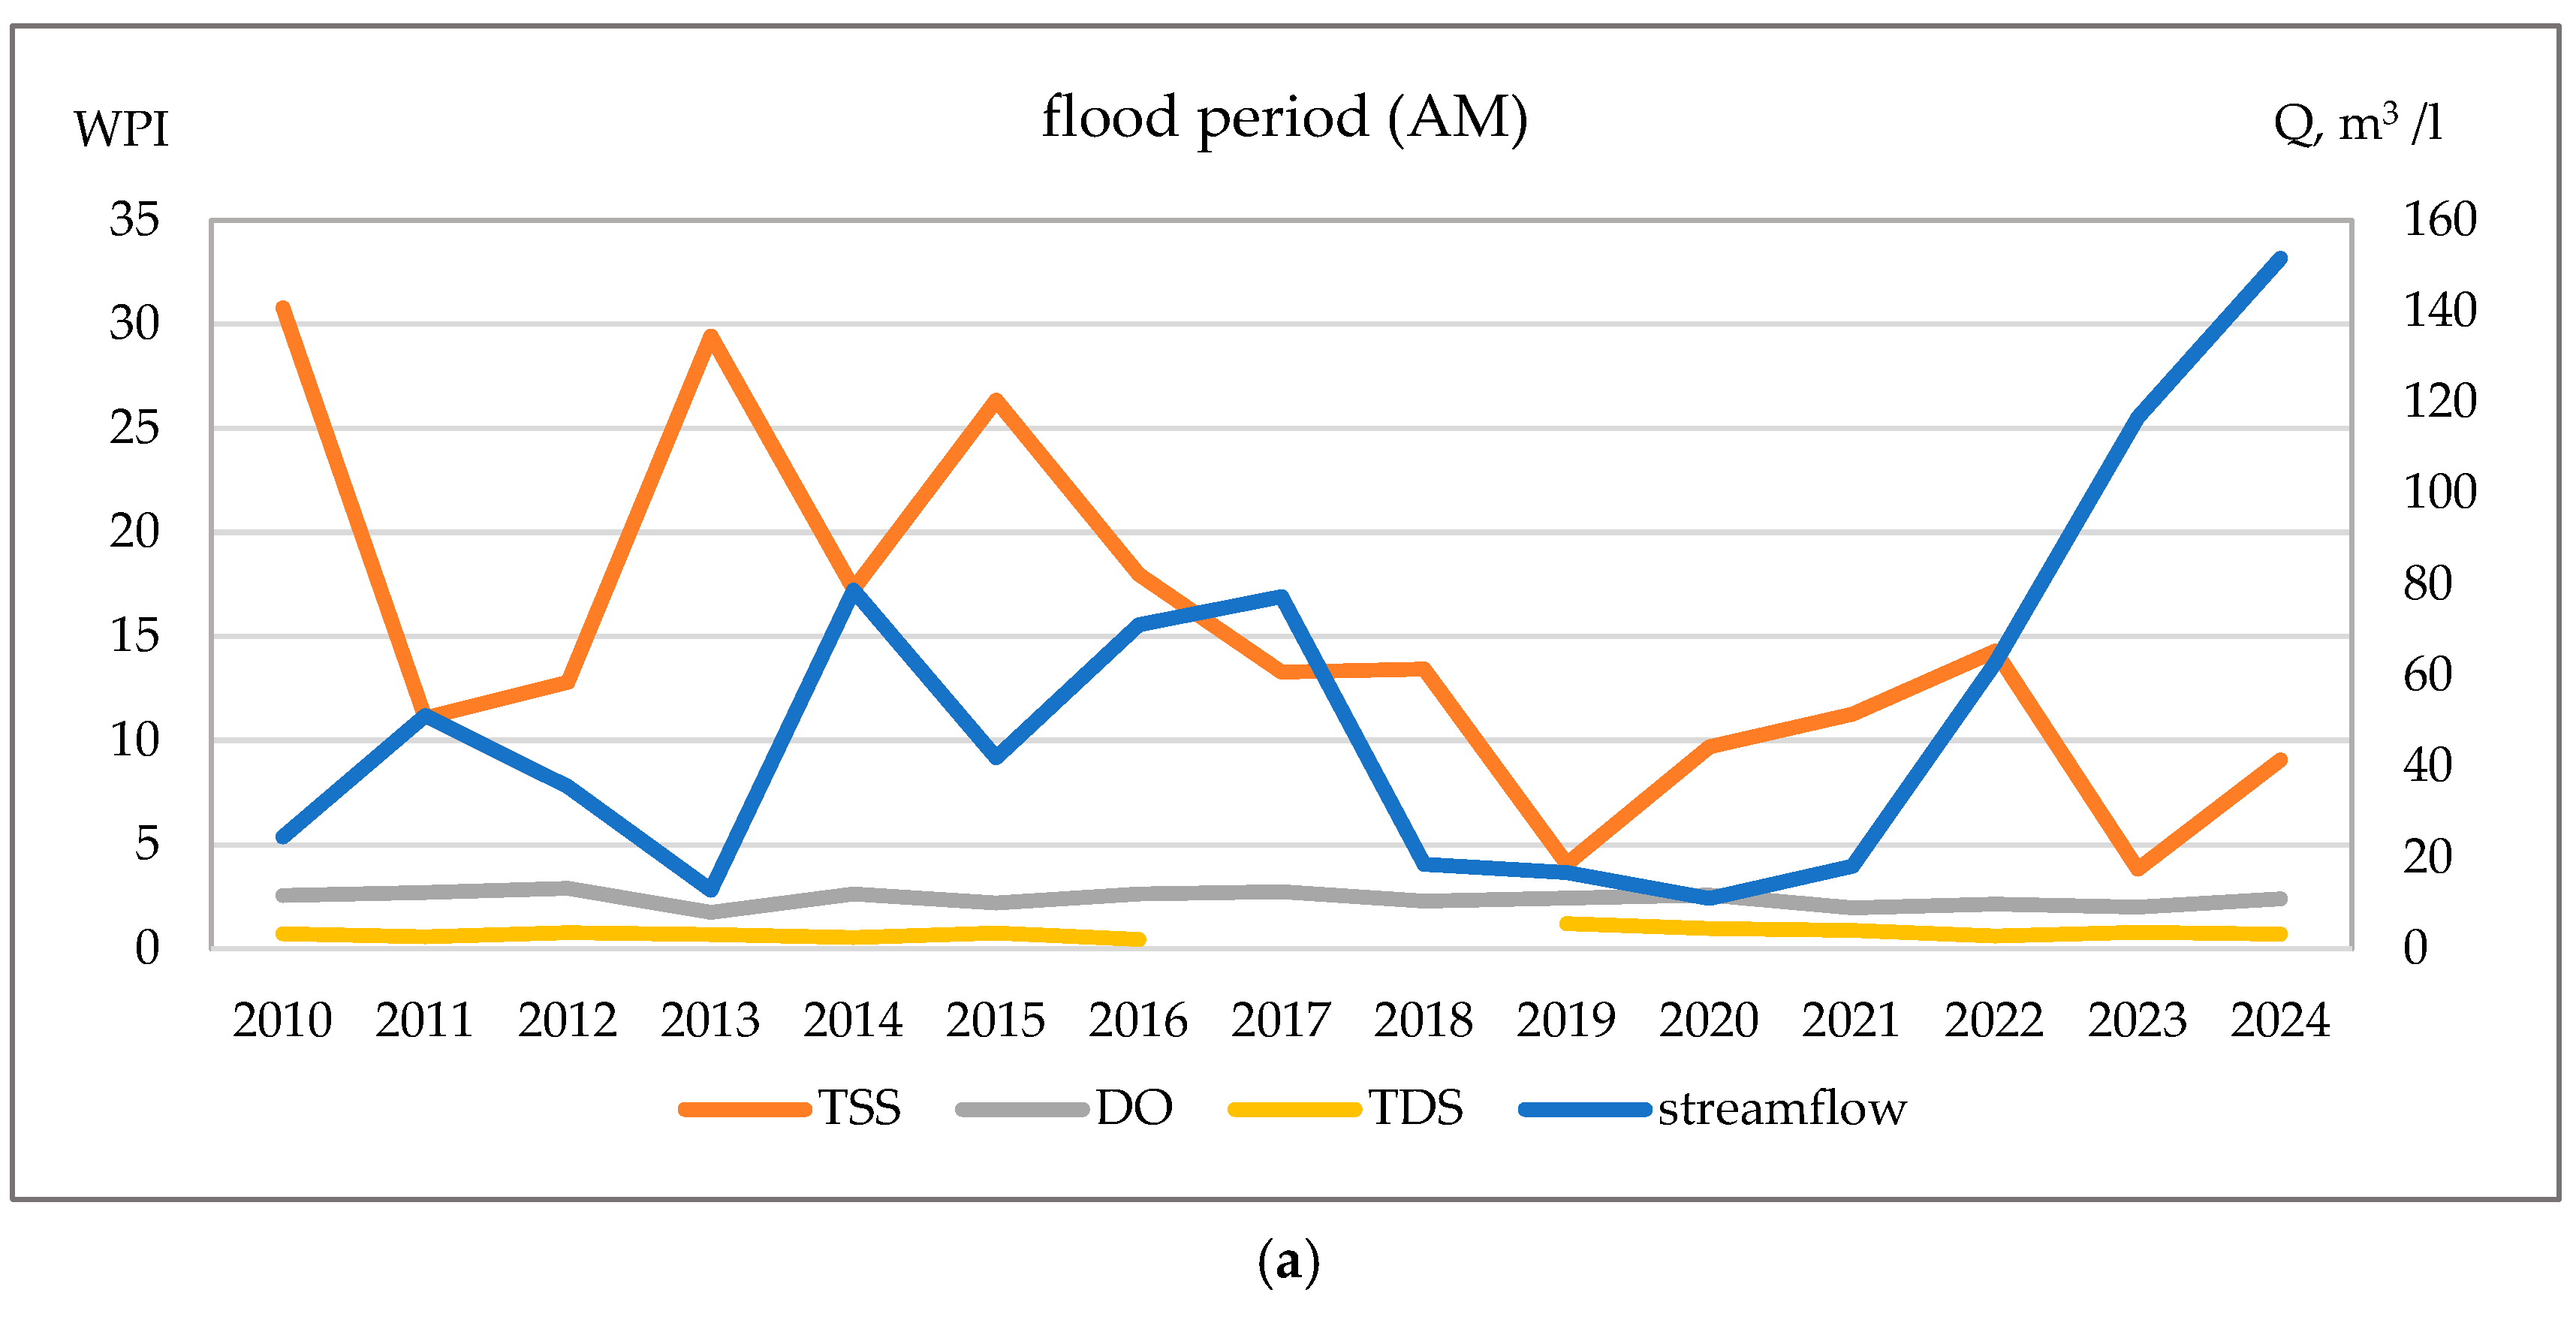
Graphs were constructed for the Yelek River showing the dependence of average monthly water pollution indices on average monthly water discharges during various hydrological phases (Figure 9). The analysis used data from three hydrological stations where measurements of water discharges and hydrochemical characteristics of water were carried out simultaneously (Aktobe, Tselinnoe and Chilik).
On the Yelek River in Aktobe, no clear pattern of water quality deterioration with increasing water discharges in the spring was identified. The exception was 2024, when the average monthly flow rate was 118 m3/s, which was the maximum value for the entire observation period. In that year, the values of hydrochemical indicators, including dissolved oxygen (3.01) and total dissolved solids (1.0), were the lowest. At the same time, in 2013–2018, despite an increase in water discharges to ~100 m3/s, no significant changes in dissolved oxygen and total dissolved solids were observed. The content of total suspended solids also did not follow any regular patterns, with the exception of 2024, at a sharp decrease in WPI was observed.
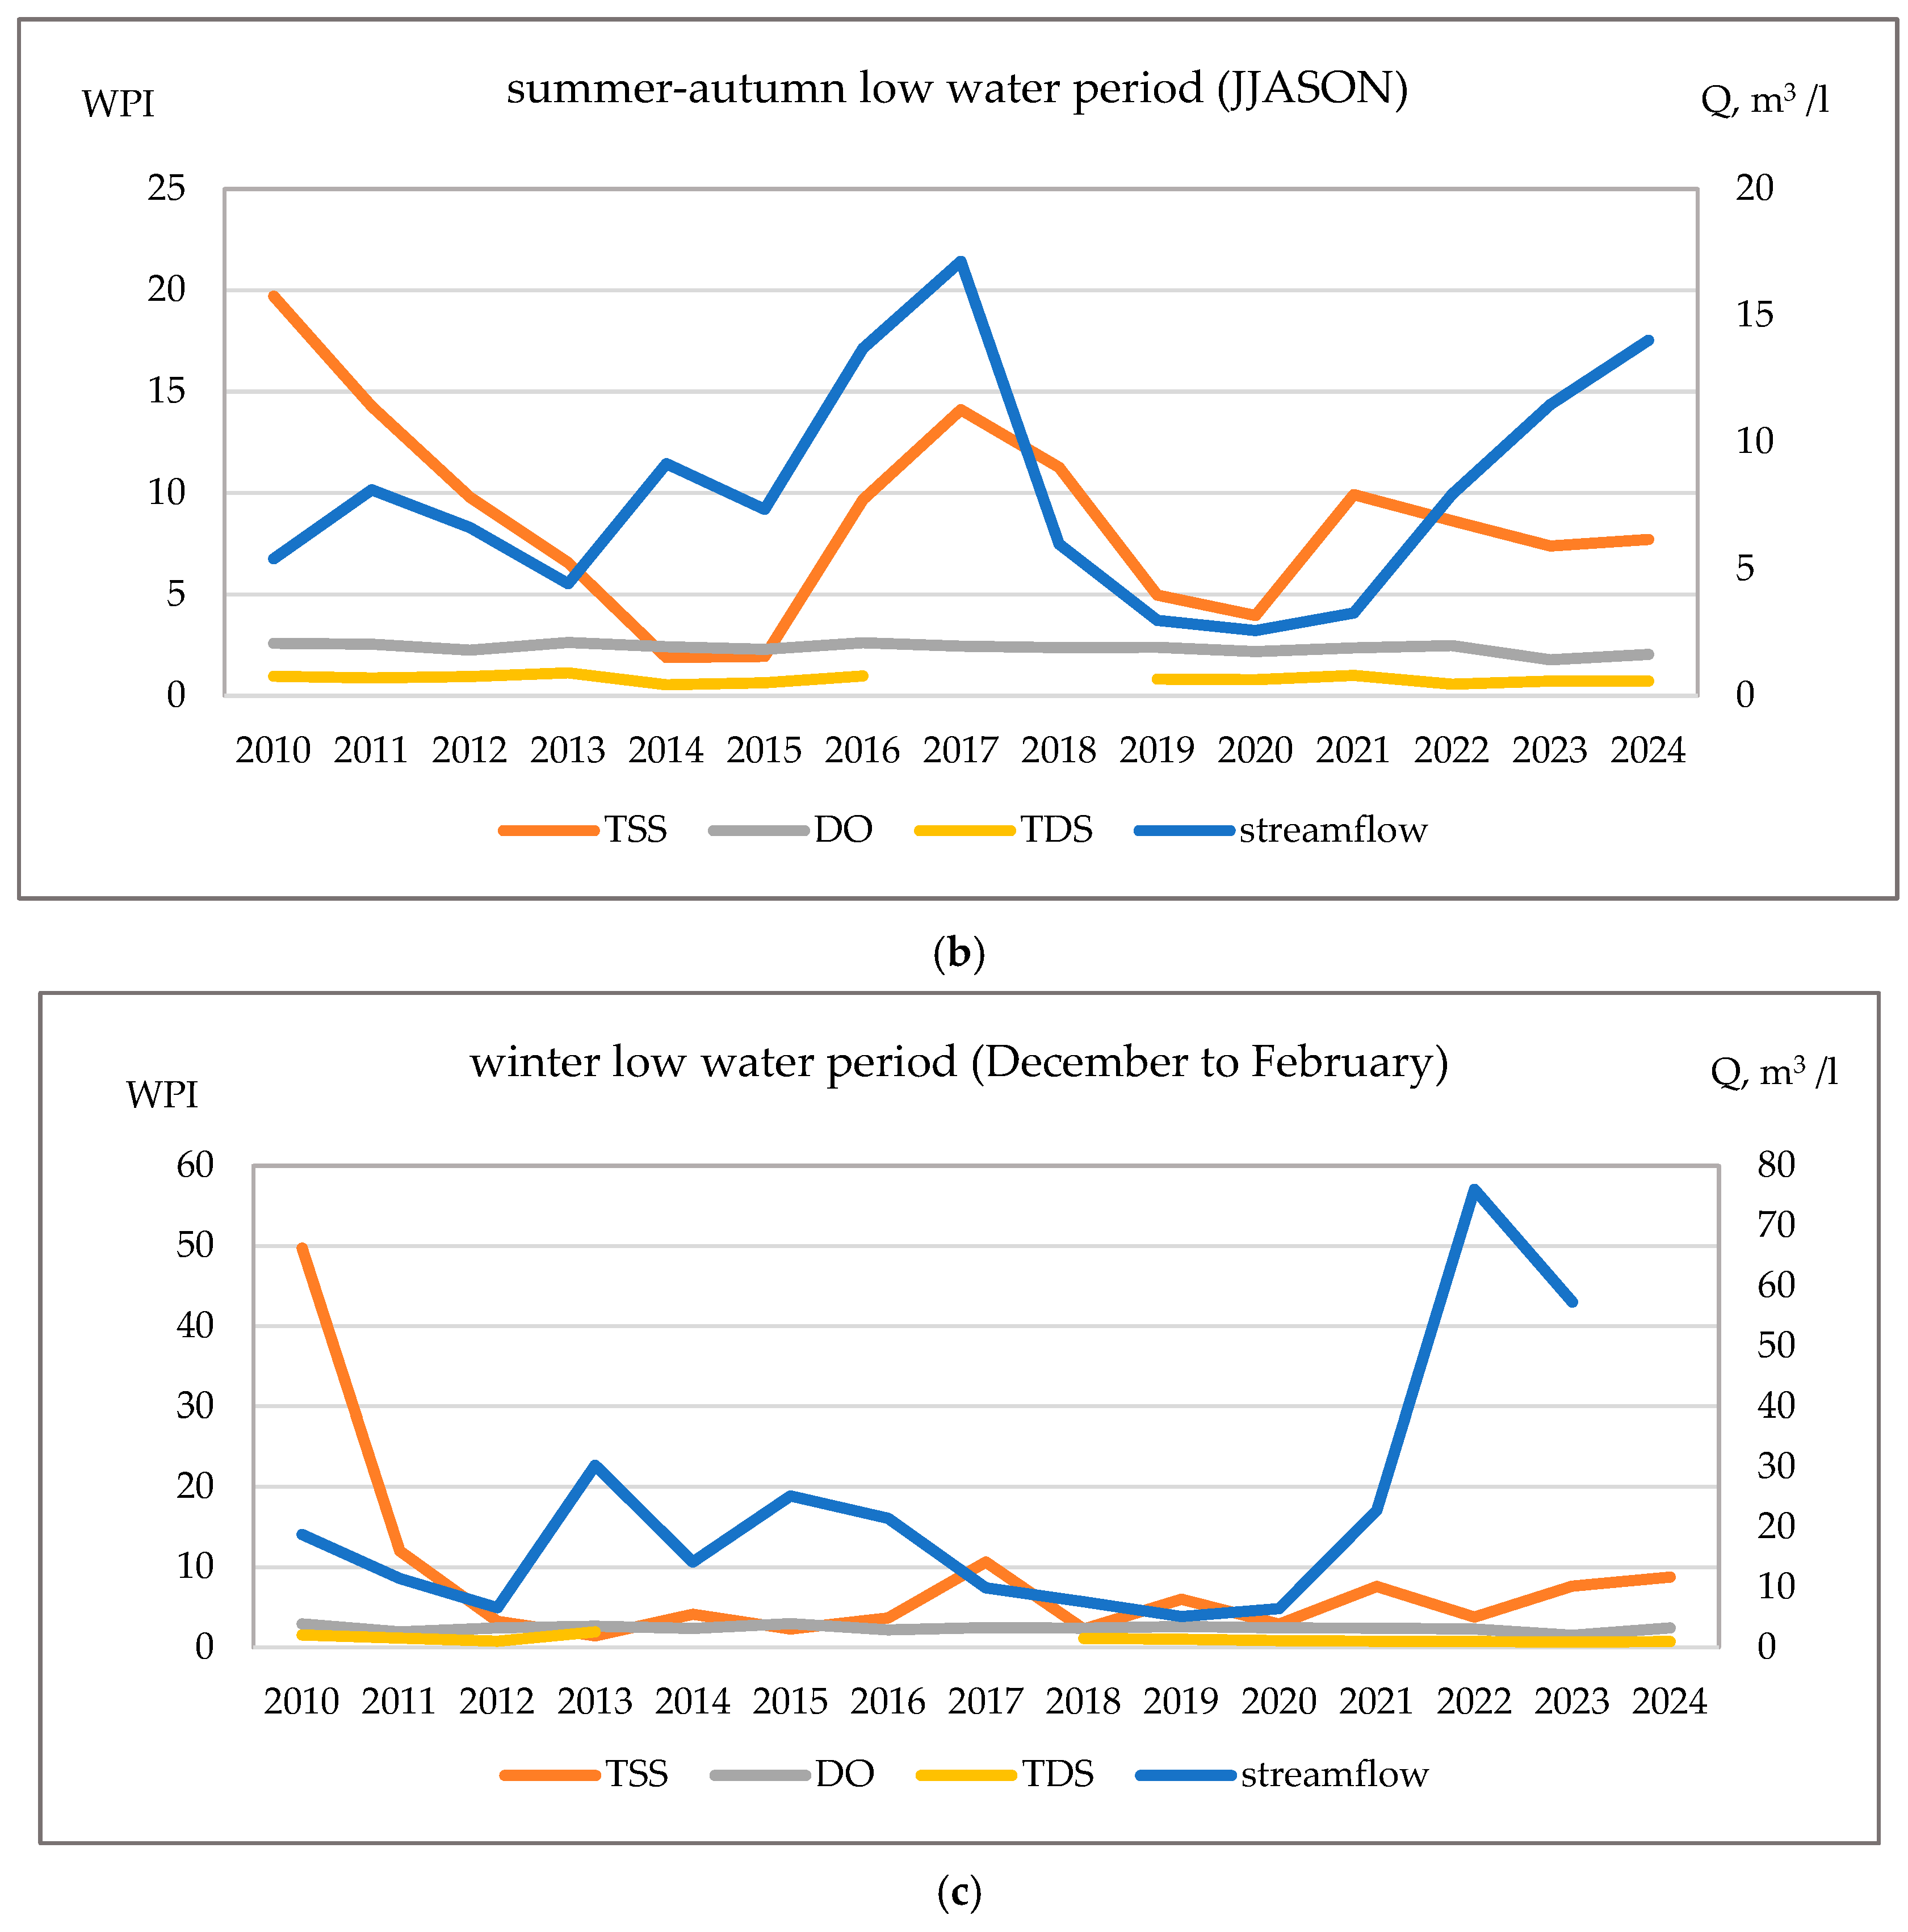
During the summer-autumn low-water period at the same hydrological station, the relationship between water discharges and water quality also was weakly expressed (Figure 10). Dissolved oxygen and total dissolved solids remained relatively stable, while total suspended solids varied chaotically. The exception was also 2024, at a water discharges rate of 17.0 m3/s, the water pollution index fell below 6.0. During the winter low water period, water quality indicators were low, with the maximum suspended solids content recorded in 2010 (37.0), and in 2022, water discharges reached 31.1 m3/s, which significantly exceeded the values of other years (up to 12.7 m3/s).
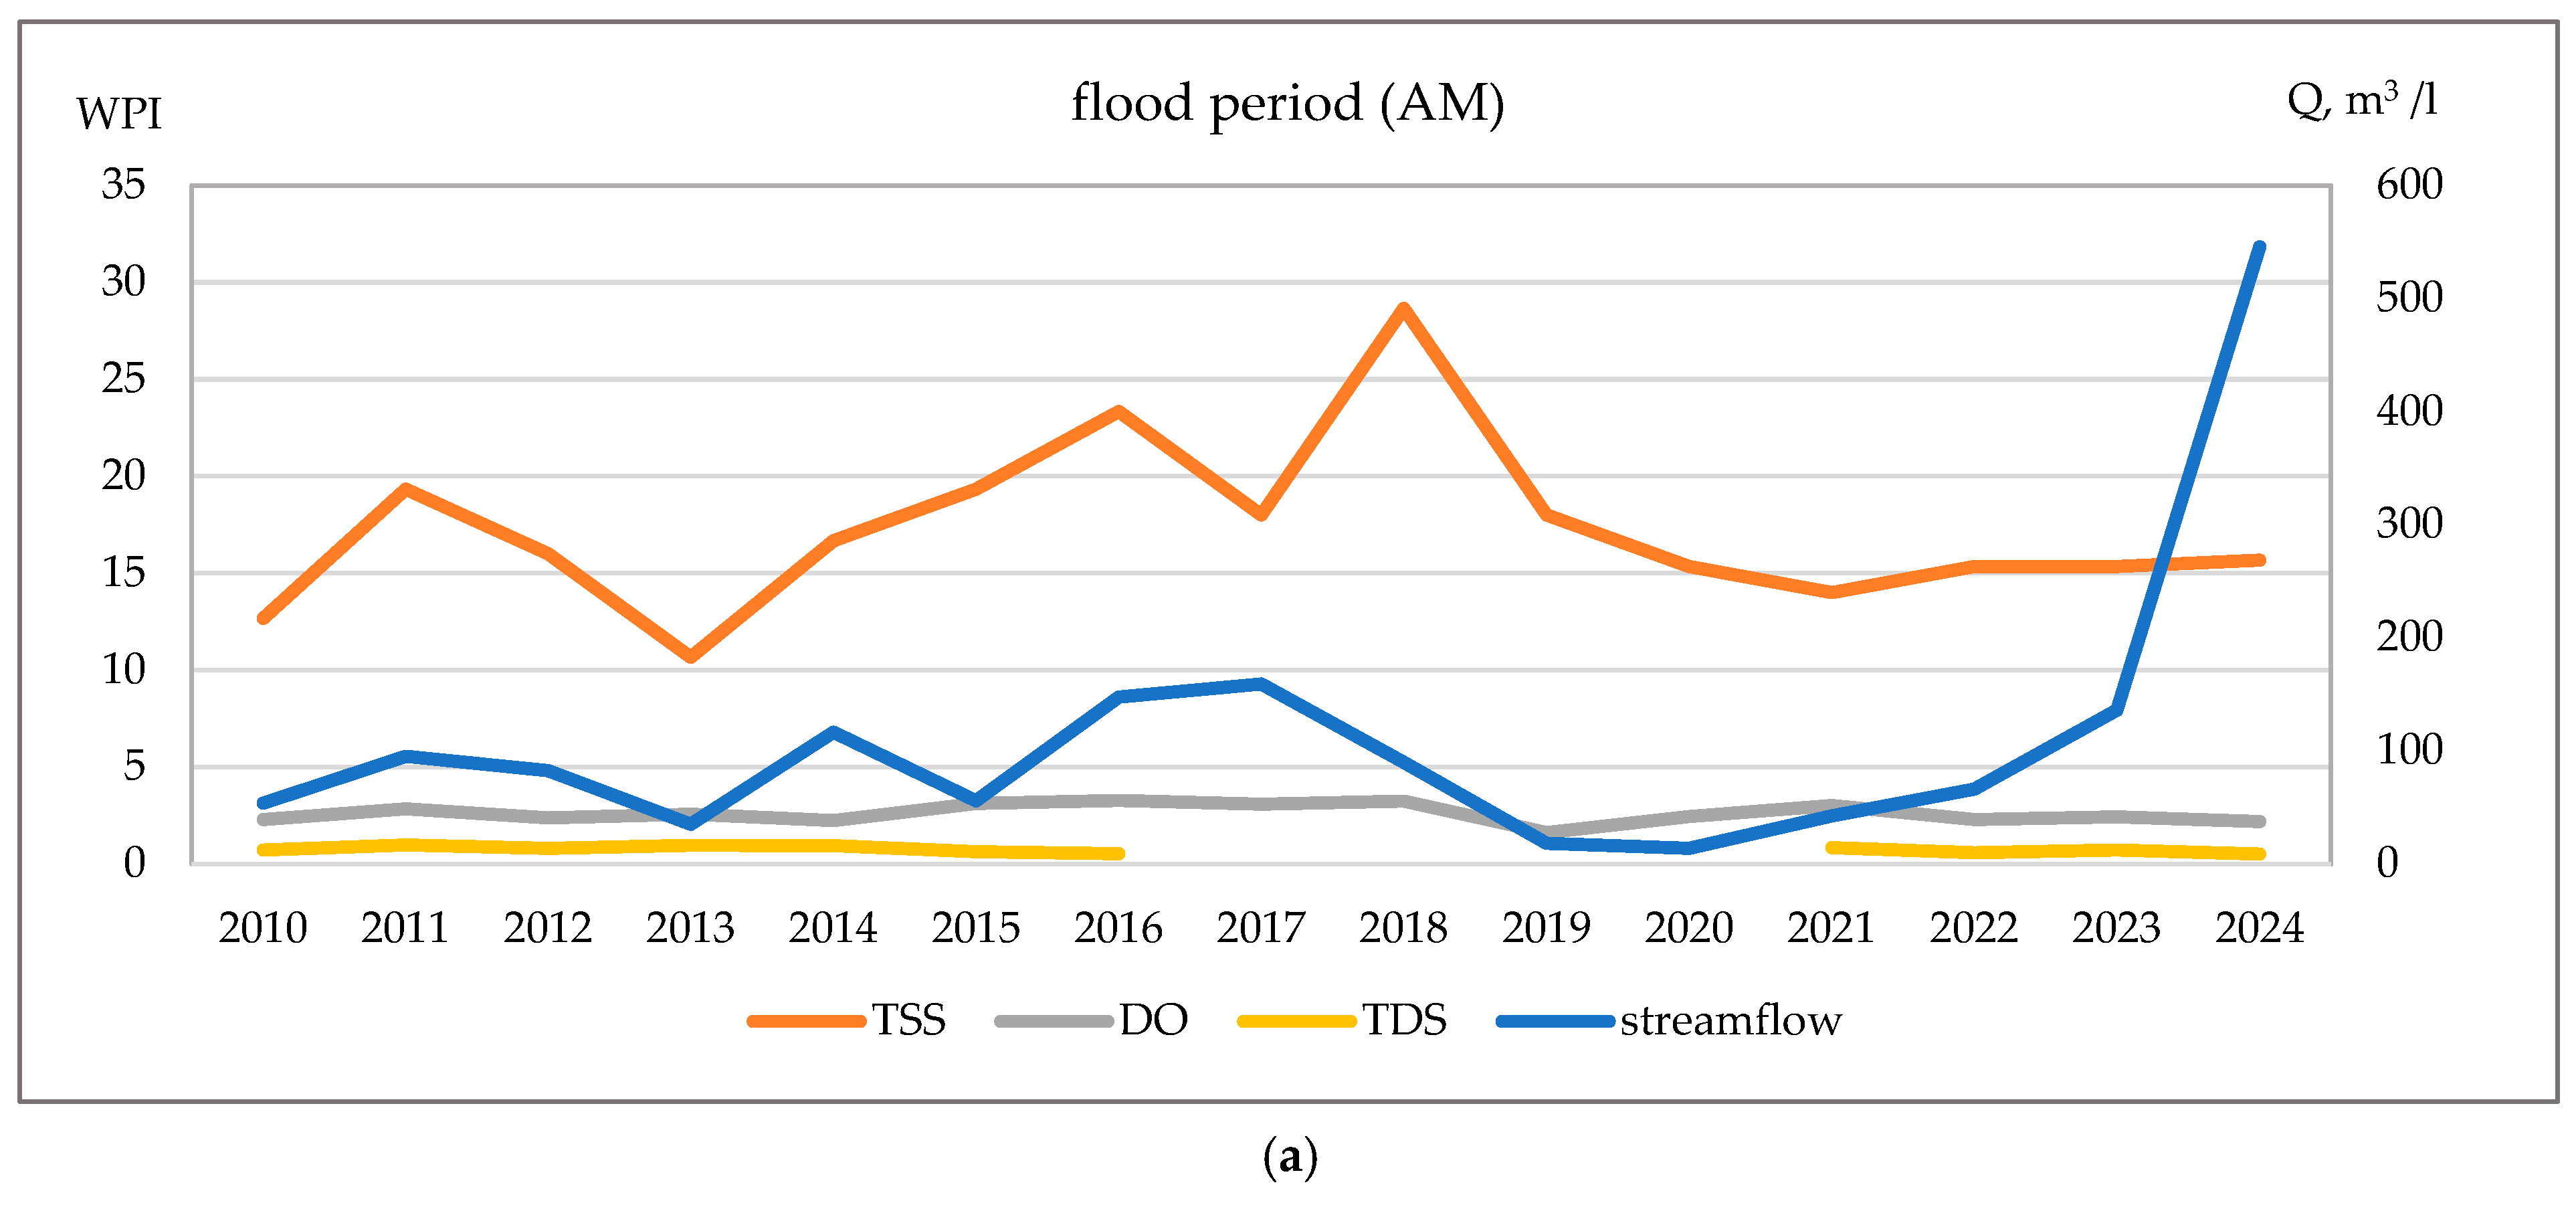
At the Chilik hydrological station, the relationship between water quality and water discharges is weakly expressed (Figure 11). A distinctive feature of this station is the significant fluctuation in total suspended solids content compared to other hydrochemical indicators. The average values fluctuated between 28.7 and 10.7, while water discharge increased sharply in certain years. Thus, in 2023–2024, extremely high water discharges was recorded: 546 m3/s during the flood season, 170 m3/s in the summer-autumn period, and 258 m3/s during the winter low water period. At the same time, the dynamics of water quality in terms of dissolved oxygen and total dissolved solids remained more stable.
As for the relationship between water discharges and water quality on the Yelek River in the village of Tselinnoe, during the spring flood and winter low water periods, the situation is similar to that at other stations (Figure 12). The exception is the summer-autumn low water period. In 2013–2018 and 2021–2024, there was a synchronous dynamic between the content of total suspended solids and water discharges: as the water discharges increased, the water quality decreased. This relationship reflects the natural pattern of interaction between hydrochemical and hydrological processes.
Thus, the results of the analysis showed that for most hydrological stations on the Yelek River, a clear and stable relationship between water discharges and water quality has not been established, which indicates the complex and multi-component nature of the interaction between hydrological and hydrochemical processes in the basin. The exception is certain periods (especially summer-autumn low water periods at the Tselinnoe station), where a natural pattern is observed: a decrease in water quality with an increase in water discharges. Particular attention should be paid to the anomalous years of 2023–2024, at extreme water consumption was recorded, accompanied by a decrease in pollution indices and a violation of the usual hydrochemical patterns.
The dissolved oxygen and total dissolved solids content along the length of the Yelek River at three hydrological stations (Aktobe, Tselinnoe and Chilik) remained at a minimum level during the spring flood period, despite significant fluctuations in water consumption in different years of observation. At the same time, the values of total suspended solids at all hydrological stations were characterised by elevated values. The most polluted section of the river in terms of this indicator was its lower part at the hydrological station in the village of Chilik, where concentrations ranged from 25.0 to 31.0 mg/L. A similar situation was observed during the summer-autumn and winter low-water periods, but during these seasons the level of total suspended solids was lower, not exceeding 21.0 mg/L. Thus, it can be concluded that the lower section of the Yelek River in the area of the Chilik hydrological station is most vulnerable to pollution by total suspended solids, especially during the spring flood period.
According to sanitary standards for surface water quality (https://adilet.zan.kz/rus/docs/V2200030713 (accessed on 10 July 2025)), the maximum permissible concentration of total suspended solids in water for domestic and drinking water supply should not exceed 15.0 mg/L. Thus, the concentrations recorded in the lower reaches of the Yelek River at the Chilik gauging station exceed the permissible values by 1.5–2 times, which indicates an unfavourable ecological situation in this section of the basin.

4. Discussion

The results of this study demonstrate marked seasonal variability in water quality in the Yelek River, which is consistent with patterns observed in other semi-arid river basins in Central Asia and around the world. The increased content of total suspended solids and turbidity during spring floods reflect the combined effects of snowmelt, erosion and runoff, which is consistent with the results of hydroecological studies of the Syrdarya and Ili rivers, where flood periods also intensified the transport of pollutants.
Conversely, the deterioration in water quality during the summer-autumn low-water period corresponds to a decrease in dilution capacity and an increase in anthropogenic impact, which is a widespread trend in transboundary basins subject to pressure from agriculture and industry. The persistence of moderate dissolved oxygen deficiency also indicates long-term pressure on aquatic ecosystems, confirming earlier observations in the Ural-Caspian basin. By integrating field data, historical monitoring data and satellite indices, this study provides new evidence that remote sensing and GIS can effectively complement traditional methods, especially where monitoring networks are sparse. The turbidity prediction model developed here identifies critical downstream areas as environmental “hot spots”, highlighting the need for targeted management measures. These findings contribute to a broader discussion of sustainable water management in semi-arid regions, where climate variability and transboundary water distribution further complicate ecosystem sustainability. However, the study has a number of limitations, primarily related to the availability and completeness of source data. Pollutant monitoring in the basin under consideration is carried out at seven points along the river, which does not allow for full coverage of the spatial diversity of hydrochemical characteristics. In addition, field observations were conducted a limited number of times (three trips as part of a grant project), which reduces the representativeness of the sample and makes it difficult to verify long-term trends. Despite these limitations, the use of remote sensing data made it possible to quantitatively assess water turbidity and identify its seasonal and annual dynamics in accordance with hydrological phases. Future research should focus on expanding the range of hydrochemical parameters extracted from satellite data, improving calibration through in situ observations, and incorporating climate change scenarios to predict long-term water quality dynamics. Combining remote sensing with social-economic data can also improve understanding of how land use and water demand influence pollution trends, supporting adaptive water management strategies in Central Asia and beyond.

5. Conclusions

The study, which aimed to assess seasonal variability in water quality over a ten-year period (2014–2025) in the Yelek River basin, confirmed the effectiveness of integrating re-mote sensing and geographic information systems to analyse spatial–temporal patterns in river system dynamics. Based on available monitoring data for the Yelek River, the WPI was calculated for key parameters. Further distribution of these indicators by hydrological phases made it possible to identify intra-annual variability in surface water quality and determine the most vulnerable seasons.
The use of satellite data makes it possible to fill in the gaps in traditional monitoring and identify the characteristic features of seasonal fluctuations in water quality under the influence of natural and anthropogenic factors. At the same time, the study has a number of limitations, primarily related to the availability and completeness of the source data. Pollutant monitoring in the basin under consideration is carried out at seven points along the river, which does not allow for full coverage of the spatial diversity of hydrochemical characteristics. In addition, field observations were conducted a limited number of times (three trips as part of the grant project), which reduced the representativeness of the sample and made it difficult to verify long-term trends. Despite these limitations, the use of remote sensing data made it possible to quantitatively assess water turbidity and identify its seasonal and annual dynamics in accordance with hydrological phases. The approach used demonstrated that even with a limited field database, it is possible to assess seasonal variability in water quality by combining GIS analysis and satellite observations. This makes the methodology valuable for regions where the traditional monitoring system is underdeveloped or does not provide sufficient regularity and spatial coverage. The results obtained can be used to forecast the state of water resources, identify areas of increased environmental risk, and develop measures to optimise water use and improve the environmental sustainability of river systems. The study confirms the potential of integrating remote sensing and GIS as a tool for compensating for the shortcomings of field observations and forming scientifically sound approaches to surface water quality management in conditions of limited data.

Author Contributions

Conceptualization, A.M. and A.A. (Aliya Aktymbayeva); methodology, A.M. and A.R.; validation, R.A. and A.A. (Almas Alimbay); formal analysis, A.M., S.M. and Z.Z.; investigation, A.M., R.A., A.A. (Aliya Aktymbayeva) and S.M.; resources, Z.Z., R.A. and A.A. (Almas Alimbay); data curation, Z.Z., R.A., A.R. and A.A. (Almas Alimbay); writing—original draft preparation, A.M., S.M. and Z.Z.; writing—review and editing, A.M. and M.G.M.; supervision, A.A. (Aliya Aktymbayeva) and M.G.M. All authors have read and agreed to the published version of the manuscript.

Funding

This research has been funded by the Committee of Science of the Ministry of Science and Higher Education of the Republic of Kazakhstan (Grant No. BR21882122), Sustainable development of natural-industrial and socio-economic systems of the West Kazakhstan region in the context of green growth: a comprehensive analysis, concept, forecast estimates and scenarios.

Institutional Review Board Statement

Not applicable.

Informed Consent Statement

Not applicable.

Data Availability Statement

The data presented in this study are available upon request from the corresponding author.

Conflicts of Interest

The authors declare no conflicts of interest. The funders had no role in the design of the study; in the collection, analyses, or interpretation of data; in the writing of the manuscript; or in the decision to publish the results.

Abbreviations

The following abbreviations are used in this manuscript:
RSRemote sensing
GISGeographic information systems
TSSTotal suspended solids
TDSTotal dissolved solids
DODissolved oxygen
NDWINormalised Difference Water Index
NDTINormalised Difference Turbidity Index
SSState Standard
OLIOperational Land Imager
ETMEnhanced Thematic Mapper
TMThematic Mapper
GEEGoogle Earth Engine
DOSDark Object Subtraction
DEMDigital elevation model
FNUFormazin Nephelometric Units
UTMUniversal Transverse Mercator
WPIWater pollution index
CWPIComprehensive water pollution index
MPCMaximum permissible concentration
WKRWest Kazakhstan Region
JJASONJune, July, August, September, October, November
DJFMDecember, January, February, March
AMApril–May
MRHEMaximum Permissible Harmful Emission

References

  1. Clark, E.A.; Sheffield, J.; van Vliet, M.T.H.; Nijssen, B.; Lettenmaier, D.P. Continental runoff into the oceans (1950–2008). J. Hydrometeorol. 2015, 16, 1502–1520. [Google Scholar] [CrossRef]
  2. Jadeja, N.B.; Banerji, T.; Kapley, A.; Kumar, R. Water pollution in India–Current scenario. Water Secur. 2022, 16, 100119. [Google Scholar] [CrossRef]
  3. Kirschner, A.K.T.; Schachner-Groehs, I.; Kavka, G.; Hoedl, E.; Kovacs, A.; Farnleitner, A.H. Long-term impact of basin-wide wastewater management on faecal pollution levels along the entire Danube River. Environ. Sci. Pollut. Res. 2024, 31, 45697–45710. [Google Scholar] [CrossRef]
  4. Addo-Bediako, A.; Matita, T.; Luus-Powell, W. Flow regime impacts on chemical pollution in the water and sediments of the Moopetsi River and human health risk in South Africa. Water 2025, 17, 2200. [Google Scholar] [CrossRef]
  5. Carneiro, D.D.; Mariotto, S.; Sousa, D.A.; Bragotto, A.P.A. Presence of pesticide residues in water resources and fish in Brazil: Narrative bibliographic review. ACS Food Sci. Technol. 2025, 5, 1785–1797. [Google Scholar] [CrossRef]
  6. Adyasari, D.; Pratama, M.A.; Teguh, N.A.; Sabdaningsih, A.; Kusumaningtyas, M.A.; Dimova, N. Anthropogenic impact on Indonesian coastal water and ecosystems: Current status and future opportunities. Mar. Pollut. Bull. 2021, 171, 112689. [Google Scholar] [CrossRef]
  7. Zlati, M.L.; Georgescu, L.P.; Iticescu, C.; Ionescu, R.V.; Antohi, V.M. New approach to modelling the impact of heavy metals on the European Union’s water resources. Int. J. Environ. Res. Public Health 2023, 20, 45. [Google Scholar] [CrossRef] [PubMed]
  8. Jarvie, H.P.; Worrall, F.; Burt, T.P.; Howden, N.J.K. A 150-year river water quality record shows reductions in phosphorus loads but not in algal growth potential. Commun. Earth Environ. 2025, 6, 62. [Google Scholar] [CrossRef]
  9. Burlibaev, M.Z. Assessment of surface water quality by hydrochemical indicators on the example of the Ile River. Hydrometeorol. Ecol. 2009, 1, 94–101. [Google Scholar]
  10. Amirgaliev, N.; Madibekov, A.; Ismukhanova, L.; Zhadi, A.; Sultanbekova, B. Polychlorinated biphenyls in the aquatic ecosystem of the protected Lake Markakol and its inflowing rivers. Hydrometeorol. Ecol. 2024, 2, 81–94. [Google Scholar] [CrossRef]
  11. Dostai, Z.; Romanova, S.; Kunshygar, D. Hydroecological characteristics of rivers of the northern slope of the Zailiysky Alatau. Hydrometeorol. Ecol. 2004, 1, 144–155. [Google Scholar]
  12. Popov, Y.; Pavlichenko, L.; Bogachev, V. Study of Syrdarya River pollution for the development of an integrated water quality assessment. Hydrometeorol. Ecol. 1996, 2, 207–223. [Google Scholar]
  13. Amirgaliev, N.A.; Askarova, M.; Opp, C.; Medeu, A.; Kulbekova, R.; Medeu, A.R. Water quality problems analysis and assessment of the ecological security level of the transboundary Ural-Caspian Basin of the Republic of Kazakhstan. Appl. Sci. 2022, 12, 2059. [Google Scholar] [CrossRef]
  14. Severinenko, M.; Solodukhin, V.; Lennik, S.; Kabirova, G.; Zheltov, D.; Bychenko, A. Water elemental composition and toxicity in Kazakhstan’s transboundary rivers. Central Asian J. Water Res. 2023, 9, 19–32. [Google Scholar] [CrossRef]
  15. Tazhiyev, S.; Murtazin, Y.; Rakhimova, V.; Rakhmetov, I.; Adenova, D.; Koshpanova, K.; Sotnikov, Y.; Abdizhalel, M.; Akylbayeva, A.; Yerezhep, D. Applied hydrogeological assessment and GIS-based modeling of transboundary aquifers in the Shu River Basin. Water 2025, 17, 2476. [Google Scholar] [CrossRef]
  16. Kakabayev, A.; Yessenzholov, B.; Khussainov, A.; Rodrigo-Ilarri, J.; Rodrigo-Clavero, M.-E.; Kyzdarbekova, G.; Dankina, G. The impact of climate change on the water systems of the Yesil River Basin in Northern Kazakhstan. Sustainability 2023, 15, 15745. [Google Scholar] [CrossRef]
  17. Yessenzholov, B.; Khussainov, A.; Kakabayev, A.; Plachinta, I.; Bayazitova, Z.; Kyzdarbekova, G.; Zhamkenov, U.; Ramazanova, M. Assessment of hydrometeorological impacts of climate change on water bodies in Northern Kazakhstan. Water 2024, 16, 2794. [Google Scholar] [CrossRef]
  18. KC, A.; Chalise, A.; Parajuli, D.; Dhital, N.; Shrestha, S.; Kandel, T. Surface water quality assessment using remote sensing, GIS and artificial intelligence. Technol. J. 2019, 1, 113–122. [Google Scholar] [CrossRef]
  19. Yang, H.; Kong, J.; Hu, H.; Du, Y.; Gao, M.; Chen, F. A review of remote sensing for water quality retrieval: Progress and challenges. Remote Sens. 2022, 14, 1770. [Google Scholar] [CrossRef]
  20. Ahmed, W.; Mohammed, S.; El-Shazly, A.; Morsy, S. Tigris River water surface quality monitoring using remote sensing data and GIS techniques. Egypt. J. Remote Sens. Space Sci. 2023, 26, 816–825. [Google Scholar] [CrossRef]
  21. Hafeez, S.; Wong, M.S.; Abbas, S.; Asim, M. Evaluating Landsat-8 and Sentinel-2 data consistency for high spatiotemporal inland and coastal water quality monitoring. Remote Sens. 2022, 14, 3155. [Google Scholar] [CrossRef]
  22. Ouma, Y.O.; Tateishi, R. Modelling reservoir chlorophyll-a, TSS, and turbidity using Sentinel-2A MSI and Landsat-8 OLI satellite sensors with empirical multivariate regression. Sensors 2020, 20, 885. [Google Scholar] [CrossRef]
  23. Dzhanaleyeva, G.M. Rivers of the Aktobe region and their hydrological characteristics. Bull. KazNPU Geogr. Ser. 2010, 3, 45–52. [Google Scholar]
  24. Berdenov, Z.G.; Zinabdin, N.B.; Yeginbayeva, A.E.; Mendybaeva, G.E.; Sadvakassova, S.R.; Kakimzhanov, E.K. Analysis and assessment of surface water quality in the Yelek River basin under technogenic impact. Hydrometeorol. Ecol. 2024, 4, 15–27. [Google Scholar] [CrossRef]
  25. Editor-in-chief Ayagan, B. Kazakhstan. National Encyclopedia; Kazakh Encyclopedia: Almaty, Kazakhstan, 2006. [Google Scholar]
  26. Akhmedsafin, M.S. Hydrology of Kazakhstan; Nauka: Alma-Ata, Kazakhstan, 1975. [Google Scholar]
  27. Slyusarev, S.G. Hydrological Regime of Steppe Rivers of Kazakhstan; KarGU Publishing: Karaganda, Kazakhstan, 2006. [Google Scholar]
  28. Yesirkepov, D.Z. Hydrological features of the Yelek River basin. In Proceedings of the International Conference “Water and Sustainable Development”, Almaty, Kazakhstan, 8 November 2022; pp. 101–106. [Google Scholar]
  29. Sapozhnikov, D.G. Ice phenomena on the rivers of Western Kazakhstan. Geogr. Nat. Resour. 2018, 4, 62–69. [Google Scholar]
  30. Nurtaeva, A.K.; Abylgazy, N.K. Assessment of changes in river flow in the Aktobe region under climate conditions. Kazakh, J. Ecol. 2019, 2, 18–24. [Google Scholar]
  31. Smagulov, E.Z.; Temirbekova, G.T. Anthropogenic impact on the water resources of the Yelek River. Geogr. Ecol. Kazakhst. 2021, 1, 74–81. [Google Scholar]
  32. Galperin, R.I. (Ed.) River Runoff Resources of Kazakhstan: Vol. 1. Renewable Surface Water Resources of Western, Northern, Central, and Eastern Kazakhstan; Geography Institute: Almaty, Kazakhstan, 2012; 684p. [Google Scholar]
  33. Dostai, Z.D.; Romanova, S.M.; Tursunov, E.A. River Runoff Resources of Kazakhstan: Vol. 3. Surface Water Quality of Kazakhstan and Issues of International Water Division; Geography Institute: Almaty, Kazakhstan, 2012; 215p. [Google Scholar]
  34. Zhanabayeva, Z.A.; Musina, A.K.; Aktymbayeva, A.A.; Rysmagambetova, A.A.; Narbayeva, K.T.; Sarybayev, E.S.; Akhmetova, R.E. The current state of water quality in the Zhaiyk-Caspian basin in Kazakhstan. Geogr. Water Resour. 2024, 4, 67–74. [Google Scholar] [CrossRef]
  35. McFeeters, S.K. The use of the normalized difference water index (NDWI) in the delineation of open water features. Int. J. Remote Sens. 1996, 17, 1425–1432. [Google Scholar] [CrossRef]
  36. Burlibaev, M.; Dzhumagulov, A.; Burlibaeva, D. On the transition to the European classification of river water quality and the methodology for determining their ecological state. Hydrometeorol. Ecol. 2008, 2–3, 143–151. [Google Scholar]
  37. Burlibaev, M.; Istomina, O.; Popov, Y. On the issue of determining the water pollution index. Hydrometeorol. Ecol. 1997, 4, 126–132. [Google Scholar]
  38. Burlibaev, M.Z.; Pavlichenko, L.M.; Shesterneva, O.G. Towards a concept of integrated assessment of surface water quality. Hydrometeorol. Ecol. 1998, 3–4, 86–112. [Google Scholar]
  39. Burlibaeva, D.M.; Burlibaev, M.Z.; Ryskeldieva, A.M.; Kaidarova, R.K.; Opp, C.; Amirgaliev, N.A. Dynamics of concentration changes of heavy metal group pollutants in surface water of the transboundary Ertis River on the territory of the Republic of Kazakhstan. Bull. Geogr. 2020, 2, 54–68. [Google Scholar]
  40. Burlibaev, M.Z.; Burlibaeva, D.M. Quality of surface waters and principles of ecological regulation. Hydrometeorol. Ecol. J. 2011, 1, 119–140. [Google Scholar]
  41. National Methodology for Assessing Surface Water Quality of the Republic of Kazakhstan (Order No. 111, 2025). Available online: https://adilet.zan.kz/rus/docs/G25MA000111 (accessed on 15 October 2025).
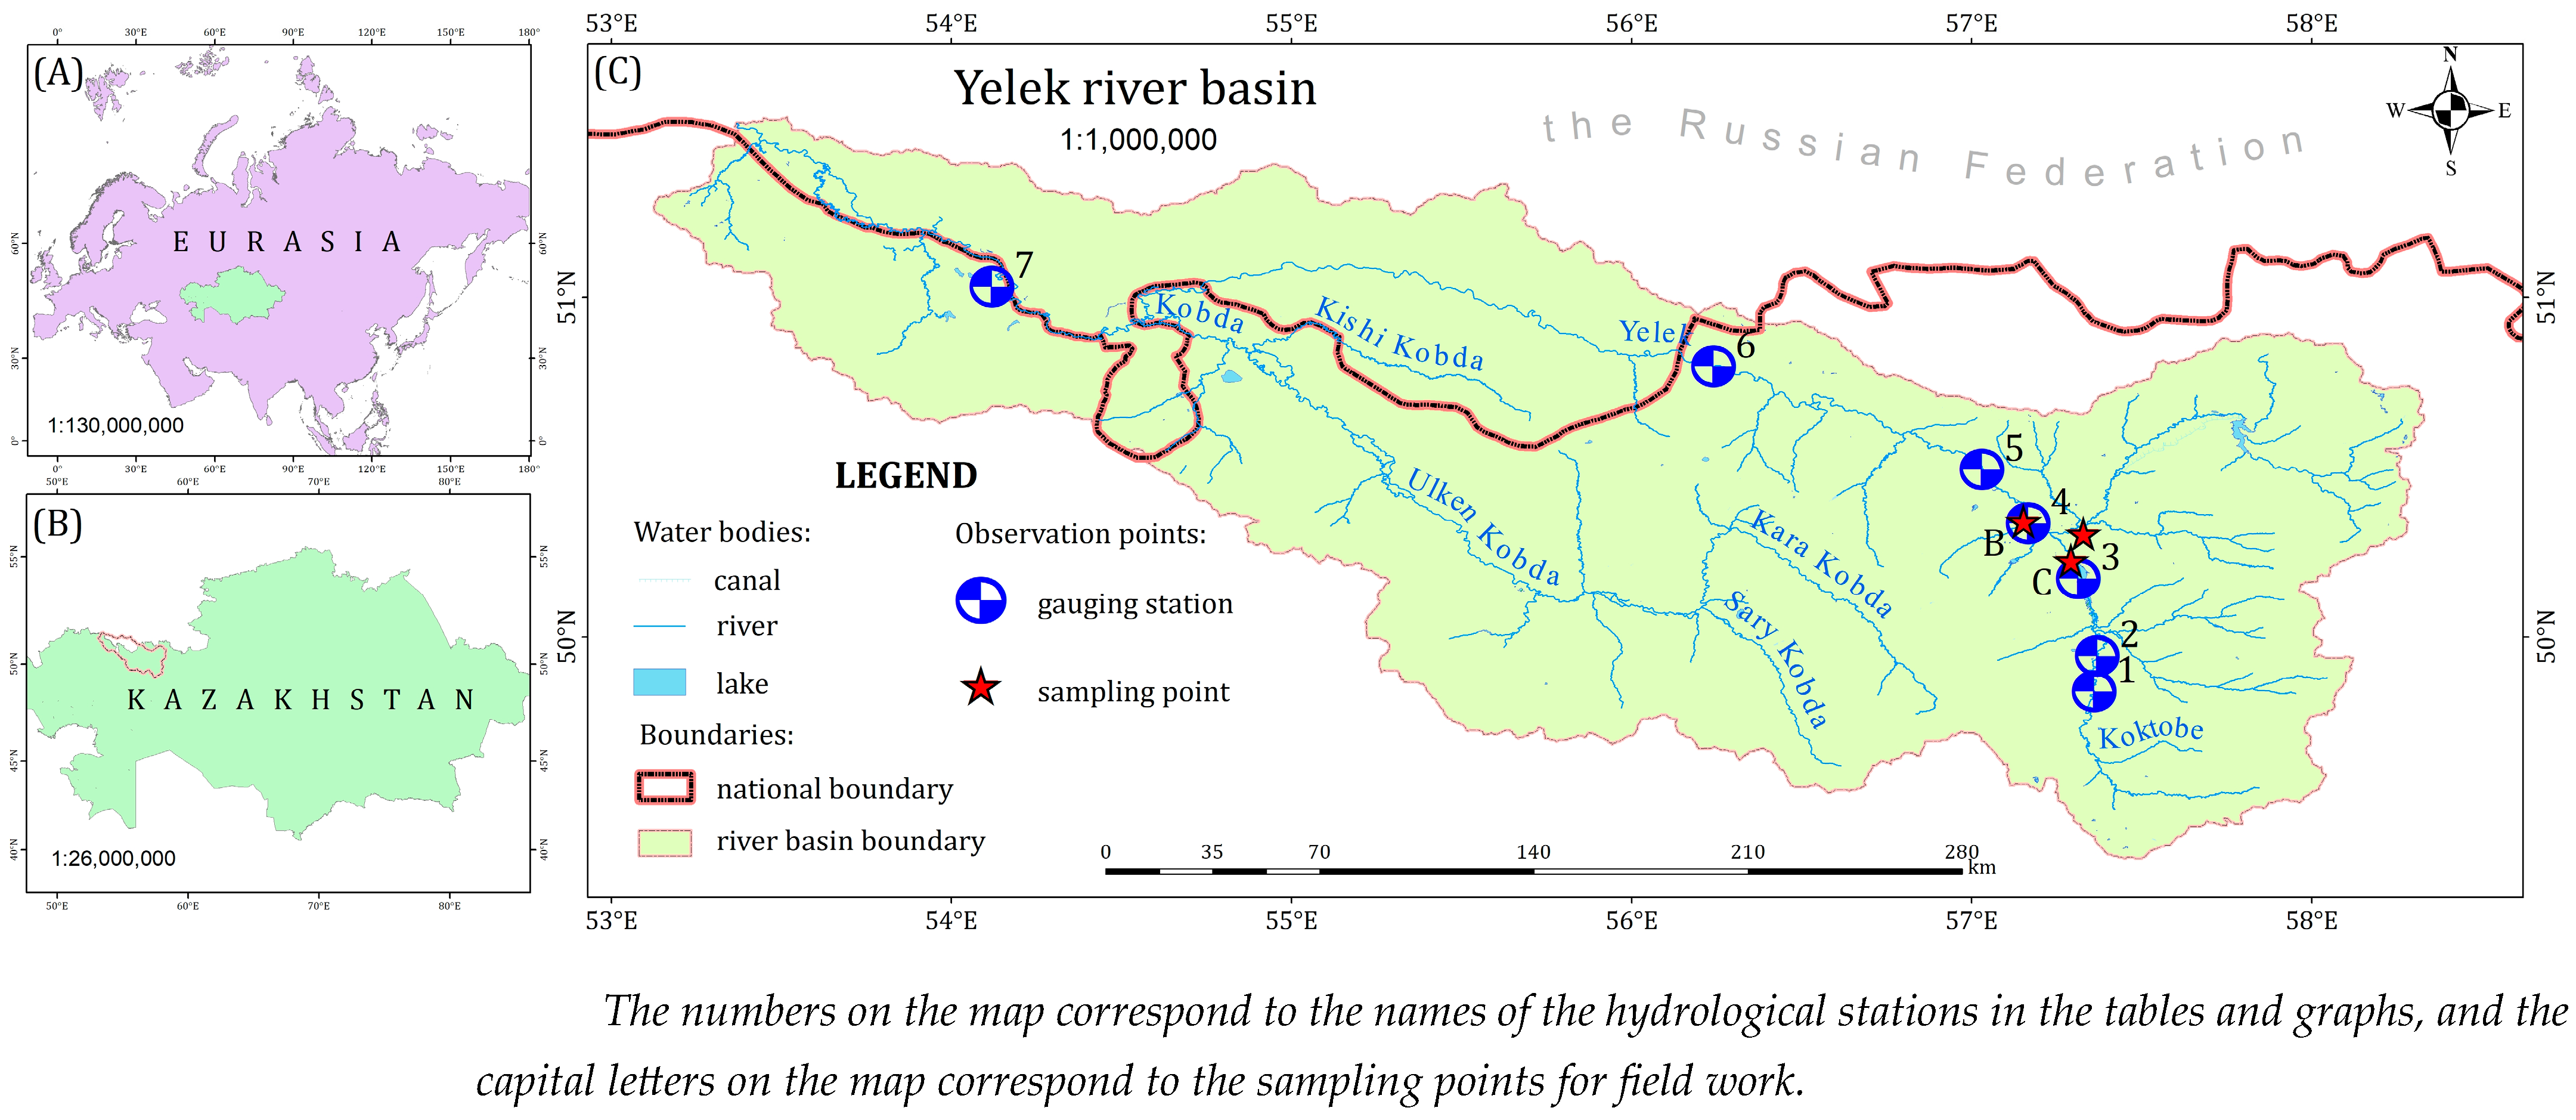
Figure 1. Location of gauging stations and sampling points in the Yelek River basin: (A) Eurasia; (B) Kazakhstan; (C) Elek River basin.
Sustainability 17 09809 g001
Figure 2. WPI values for total suspended solids: (a) Yelek River—Alga, 0.3 km above the city, 1 km above the sludge ponds of the Aktobe Chemical Plant; (b) Yelek River—Alga, 15 km below the city, 0.5 km below the outlet of contaminated groundwater; (c) Yelek River—Aktobe, 0.5 km above Aktobe; (d) Yelek River—Aktobe, 4.5 km below Aktobe; (e) Yelek River—Aktobe, 20 km downstream from Aktobe, 2.0 km downstream from Georgiev; (f) Yelek River—Tselinny settlement, 1.0 km south-east of Tselinny settlement on the left bank of the Ilek River; (g) Yelek River—Chilik WKR, 1.5 km above the village of Chilik.
Sustainability 17 09809 g002
Figure 3. WPI values for dissolved oxygen: (a) Yelek River—Alga, 0.3 km above the city, 1 km above the sludge ponds of the Aktobe Chemical Plant; (b) Yelek River—Alga, 15 km below the city, 0.5 km below the outlet of contaminated groundwater; (c) Yelek River—Aktobe, 0.5 km above Aktobe; (d) Yelek River—Aktobe, 4.5 km below Aktobe; (e) Yelek River—Aktobe, 20 km downstream from Aktobe, 2.0 km downstream from Georgiev; (f) Yelek River—Tselinny settlement, 1.0 km south-east of Tselinny settlement on the left bank of the Ilek River; (g) Yelek River—Chilik WKR, 1.5 km above the village of Chilik.
Sustainability 17 09809 g003
Figure 4. WPI values for total dissolved solids: (a) Yelek River—Alga, 0.3 km above the city, 1 km above the sludge ponds of the Aktobe Chemical Plant; (b) Yelek River—Alga, 15 km below the city, 0.5 km below the outlet of contaminated groundwater; (c) Yelek River—Aktobe, 0.5 km above Aktobe; (d) Yelek River—Aktobe, 4.5 km below Aktobe; (e) Yelek River—Aktobe, 20 km downstream from Aktobe, 2.0 km downstream from Georgiev; (f) Yelek River—Tselinny settlement, 1.0 km south-east of Tselinny settlement on the left bank of the Ilek River; (g) Yelek River—Chilik WKR, 1.5 km above the village of Chilik.
Sustainability 17 09809 g004aSustainability 17 09809 g004b
Figure 5. Average values of the water pollution index of the Yelek River for total suspended solids.
Sustainability 17 09809 g005
Figure 6. Average values of the water pollution index of the Yelek River based on total suspended solids.
Sustainability 17 09809 g006
Figure 7. Average values of the water pollution index of the Yelek River based on total dissolved solids.
Sustainability 17 09809 g007
Figure 8. Changes in water turbidity in the Yelek River for 2014–2024 by hydrological periods.
Sustainability 17 09809 g008
Figure 9. Spatial distribution of water turbidity (NDTI) in the Yelek River basin according to remote sensing data: (a) The Yelek River basin according to Landsat-8 data during the summer-autumn low water period of 2021; (b) The Yelek River basin according to Landsat-8 data during the winter low water period of 2022; (c) The Yelek River basin according to Sentinel-2 data during the winter low water period of 2024; (d) the Yelek River basin according to Sentinel-2 data during the spring flood period of 2024.
Sustainability 17 09809 g009aSustainability 17 09809 g009b
Figure 10. Average annual water discharges and water quality indicators at the Yelek River—Aktobe City hydrological station for 2010–2024: (a) flood period (AM) 2010–2024; (b) summer-autumn low water period (JJASON) 2010–2024; (c) winter low water period (DJFM) 2010–2024.
Sustainability 17 09809 g010aSustainability 17 09809 g010b
Figure 11. Average annual water discharges and WPI indicators for the Yelek River—Chilik village hydrological station for 2010–2024: (a) flood period (AM) 2010–2024; (b) summer-autumn low water period (JJASON) 2010–2024; (c) winter low water period (DJFM) 2010–2024.
Sustainability 17 09809 g011aSustainability 17 09809 g011b
Figure 12. Average annual water discharges and water quality indicators at the Yelek River—Tselinnoe village hydrological station for 2010–2024: (a) flood period (AM) 2010–2024; (b) summer-autumn low water period (JJASON) 2010–2024; (c) winter low water period (DJFM) 2010–2024.
Sustainability 17 09809 g012aSustainability 17 09809 g012b
Table 1. Sampling points of water quality in the Yelek River.
Sampling PointCoordinate ValuesDuration of Field WorkHydrological Periods
xy
A50°18′15″ N57°19′41″ E30 May 2024–2 July 2024flood period (AM)
27 September 2024–5 November 2024summer-autumn low water
period (JJASON)
28 April 2025–30 May 2025flood period (AM)
B50°20′25″ N57°09′11″ E30 May 2024–2 July 2024flood period (AM)
27 September 2024–5 November 2024summer-autumn low water
period (JJASON)
28 April 2025–30 May 2025flood period (AM)
C50°13′31″ N57°17′32″ E30 May 2024–2 July 2024flood period (AM)
27 September 2024–5 November 2024summer-autumn low water
period (JJASON)
28 April 2025–30 May 2025flood period (AM)
Table 2. NDWI threshold values for water surface extraction by year.
YearFlood Period (AM)Summer-Autumn Low Water Period (JJASON)Winter Low Water Period
(DJFM)
20140.090.050.25
20150.020.050.25
20160.020.050.25
20170.020.050.25
20180.090.100.20
20190.020.050.25
20200.020.100.40
20210.020.250.20
20220.020.050.40
20230.020.050.30
20240.050.080.40
Table 3. Classification of surface water quality based on the Water Pollution Index.
Water Quality ClassDescriptionWPI Range
IVery clean≤0.2
IIClean0.21–1.0
IIIModerately polluted1.01–2.0
IVPolluted2.01–4.0
VVery polluted4.01–6.0
VIExtremely polluted6.01–10.0
Table 4. Average WPI for total suspended solids for 2010–2025 along the length of the river.
NoGauging StationCoordinate ValuesWater Pollution Index (for Last Decade)
XYFlood Period
(AM)
Water Quality CategoriesSummer-Autumn Low Water Period
(JJASON)
Water Quality CategoriesWinter Low Water Period
(DJFM)
Water Quality Categories
1Yelek River—Aktobe, 0.5 km upstream from Aktobe50°10′ N57°11′ E28.4Extremely polluted7.78Very polluted5.6Polluted
2Yelek River—Aktobe, 4.5 km downstream from Aktobe50°20′ N57°10′ E9.69Very polluted6.1Polluted8.75Very polluted
3Yelek River—Aktobe, 20 km below Aktobe, 2.0 km below Georgievka50°20′ N57°00′ E17.9Extremely polluted8.39Very polluted11Extremely polluted
4Yelek River—Alga, 0.3 km above the city, 1 km above the sludge ponds of the Aktobe Chemical Plant49°50′ N57°20′ E12.Extremely polluted12.9Extremely polluted12.7Extremely polluted
5Yelek River—Alga, 15 km downstream from the city, 0.5 km downstream from the outlet of contaminated groundwater49°50′ N57°21′ E14.Extremely polluted13.Extremely polluted8.35Very polluted
6Yelek River—Tselinny, 1.0 km southeast of Tselinny on the left bank of the Ilek River50°47′ N56°14′ E14.2Extremely polluted8.77Very polluted8.2Very polluted
7Yelek River—Chilik settlement, West Kazakhstan Region, 1.5 km above the village of Chilik51°00′ N54°00′ E16.Extremely polluted14.Extremely polluted14.7Extremely polluted
Table 5. Average dissolved oxygen levels for 2010–2025 by river length.
NoGauging StationCoordinate ValuesWater Pollution Index (for Last Decade)
XYFlood Period
(AM)
Water Quality CategoriesSummer-Autumn Low Water Period
(JJASON)
Water Quality CategoriesWinter Low Water Period
(DJFM)
Water Quality Categories
1Yelek River—Aktobe, 0.5 km upstream from Aktobe50°10′ N57°11′ E2.7Polluted2.1Moderately polluted2.32Moderately polluted
2Yelek River—Aktobe, 4.5 km downstream from Aktobe50°20′ N57°10′ E2.61Polluted2.19Moderately polluted2.5Polluted
3Yelek River—Aktobe, 20 km downstream from Aktobe, 2.0 km downstream from Georgiev village50°20′ N57°00′ E2.36Moderately polluted2.22Moderately polluted2.55Polluted
4Yelek River—Alga, 0.3 km above the city, 1 km above the sludge ponds of the Aktobe Chemical Plant49°50′ N57°20′ E2.27Moderately polluted2.04Moderately polluted2.24Moderately polluted
5Yelek River—Alga, 15 km downstream from the city, 0.5 km downstream from the outlet of polluted groundwater49°50′ N57°21′ E2.45Moderately polluted2.3Moderately polluted2.34Moderately polluted
6Yelek River—Tselinny, 1.0 km southeast of Tselinny on the left bank of the Ilek River50°47′ N56°14′ E2.38Moderately polluted2.3Moderately polluted2.38Moderately polluted
7Yelek River—Chilik settlement, West Kazakhstan Region, 1.5 km above the village of Chilik51°00′ N54°00′ E2.54Polluted2.49Moderately polluted1.82Moderately polluted
Table 6. Average WPI values for total dissolved solids for 2010–2025 along the length of the river.
NoGauging StationCoordinate ValuesWater Pollution Index (for Last Decade)
XYFlood Period
(AM)
Water Quality CategoriesSummer-Autumn Low Water Period
(JJASON)
Water Quality CategoriesWinter Low Water Period
(DJFM)
Water Quality Categories
1Yelek River—Aktobe, 0.5 km above Aktobe50°10′ N57°11′ E0.56Clean0.6Clean0.62Clean
2Yelek River—Aktobe, 4.5 km downstream from Aktobe50°20′ N57°10′ E0.6Clean0.66Clean0.67Clean
3Yelek River—Aktobe, 20 km downstream from Aktobe, 2.0 km downstream from Georgiev50°20′ N57°00′ E0.71Clean0.7Clean0.73Clean
4Yelek River—Alga, 0.3 km above the city, 1 km above the sludge ponds of the Aktobe Chemical Plant49°50′ N57°20′ E0.74Clean0.9Clean0.92Clean
5Yelek River—Alga, 15 km downstream from the city, 0.5 km downstream from the outlet of contaminated groundwater49°50′ N57°21′ E0.64Clean0.8Clean0.74Clean
6Yelek River—Tselinny, 1.0 km southeast of Tselinny on the left bank of the Ilek River50°47′ N56°14′ E0.7Clean0.8Clean0.85Clean
7Yelek River—Chilik settlement, West Kazakhstan Region, 1.5 km above the village of Chilik51°00′ N54°00′ E0.7Clean0.84Clean0.85Clean
Disclaimer/Publisher’s Note: The statements, opinions and data contained in all publications are solely those of the individual author(s) and contributor(s) and not of MDPI and/or the editor(s). MDPI and/or the editor(s) disclaim responsibility for any injury to people or property resulting from any ideas, methods, instructions or products referred to in the content.