Abstract
Tourism, a key driver of regional economies and perceived “green industry,” faces challenges from irrational resource allocation and spatial overlaps, undermining sustainability. This study examines 825 tourism resources in China’s Hulunbuir Grassland, analyzing spatiotemporal patterns, influencing factors, and ecological impacts using GPP and NDVI data. Three development phases emerged: essential development, rapid growth, and upgrading. They present a spatial pattern with Hailar and Chen Barag as the center, and multiple other points, mainly affected by ethnic minority population proportions, tourist reception, tourist attraction density, and river networks. Ecological analysis reveals that tourism-induced disturbances cause less environmental stress than other human activities, with grassland NDVI in tourism areas improving during upgrading. However, the NDVI of grasslands under non-tourism disturbance is still superior to that of grasslands under tourism disturbance. The findings emphasize the need for optimized resource allocation and proactive monitoring of tourism’s ecological footprint to advance sustainable grassland tourism.
1. Introduction
Tourism, as a significant part of the tertiary sector, is a key pillar of economic development for many countries worldwide [1,2]. It is often regarded as a “smokestack-less” and “green” industry because of its difference from traditional industries in terms of pollutant emissions [3]. Grassland tourism, as an important form of sustainable tourism, exemplifies this green development model by balancing economic growth with ecological conservation [4,5]. Grasslands cover approximately 40% of global land area, which is very important for both biodiversity and cultural diversity [6,7]. Especially in China, grasslands are primarily found in areas inhabited by ethnic minorities, such as Inner Mongolia, Xinjiang, and Tibet, with magnificent natural landscapes and profound nomadic cultural heritages [8,9]. Hulunbuir in Inner Mongolia is the most famous grassland tourist destination in northern China and is one of the world’s four most significant grasslands, possessing high ecological services and scenic value [10,11,12]. In recent years, there have been considerable tourism activities with increasing frequency and intensity in Hulunbuir Grassland, along with large-scale tourism infrastructure construction, which has inevitably adjusted local social production, resident livelihoods, and ecological conditions. Considering its representativeness and typicality, clarifying tourist-related questions on Hulunbuir Grassland could help other similar grassland areas manage tourism more effectively.
Based on a field survey on tourism resources and high-resolution remote sensing data, this study summarizes the spatiotemporal distribution patterns of tourism resources and their influencing factors in Hulunbuir Grassland. Furthermore, it evaluates the ecological impacts of tourism activities on grasslands through a comparison analysis of the ecological status of areas adjacent to tourism resources and other areas, with the aim of providing references for achieving harmonious prosperity between economic growth and ecological conservation in the development of grassland tourism. Accordingly, the study has three research objectives: first, to clarify the spatiotemporal distribution, evolutionary patterns, and characteristics of tourism resources in Hulunbuir Grassland; second, to identify and quantify the key driving factors affecting the formation and evolution of these spatiotemporal patterns; third, to objectively and quantitatively assess the effects of grassland tourism development on the ecosystem, using vegetation as a core indicator.
2. Literature Review
As an important form of tourism, grassland tourism refers to travel activities in the unique natural landscapes and ethnic cultures developed in grasslands [13,14]. It emphasizes the harmonious coexistence of human tourism activities and the natural environment, thus promoting respect for nature and local culture through tourism activities. Grassland tourism is an active practice that makes full use of the cultural service functions of grassland ecosystems, with the ambitious goal of maintaining ecological balance and stability in the pursuit of long-term prosperity and sustainable development for human society. Currently, grassland tourism is burgeoning, serving as a new driver of regional economic growth, infrastructure improvement, employment opportunities, and resident livelihood diversification in tourist destinations [15]. However, a series of problems has arisen with the rapid development of grassland tourism, which might limit its benefits and impede its sustainable development. These problems have therefore been the focus of relevant studies.
During the rapid growth of grassland tourism resources, the rationality of their spatial configuration requires critical examination. Issues such as locational overlap, limited transportation accessibility, and service homogenisation have restricted regional tourism competitiveness [16,17,18,19,20,21,22,23]. However, existing research has not systematically analysed macro-scale spatial patterns of grassland tourism resources or their driving factors, and has not fully revealed the relationship between resource allocation characteristics and the sustainable development of grassland ecosystems. Clarifying the spatiotemporal differentiation patterns and underlying mechanisms of tourism resources in specific regions is important for optimising resource allocation and strengthening the sustainable development capacity of grassland tourism.
The risk of grassland degradation within tourism resources and adjacent areas has emerged as a major problem with the development of grassland tourism. Owing to various disturbances from human activities, approximately 49% of the global grasslands have experienced ecological degradation [24,25,26,27]. Specifically, such ecological disturbances caused by grassland tourism can be broadly attributed to the tourism infrastructure construction and tourist activities themselves [2,28,29,30], together with several indicators mainly about vegetation characteristics. These have been more and more used to reflect the ecological quality of grasslands and the dynamic impacts of tourism activities in existing studies [31,32,33,34]. The construction of tourism infrastructure directly occupies land areas initially covered by natural vegetation, leading to a decrease in vegetation coverage. Furthermore, tourist activities, including trampling and vehicle traffic, can impair the balance of grassland ecosystems and cause unhealthy vegetation growth through soil structure degradation, blocking root growth, and destroying water infiltration [31,35,36,37,38,39,40]. Despite increasing attention from existing studies on the ecological effects of grassland tourism, specific case points such as tourist attractions [25,41], national parks [42] and nature reserves [30] within a smaller range have always been preferred as the study area, whereas the general spatiotemporal patterns of tourism resources and their ecological impacts in a macro-region or geographic unit have not been addressed. For the extensive grassland areas with a large number and variety of tourism resources, analyzing the overall ecological consequences of tourism development can effectively answer whether tourism truly meets the characteristics of a “green industry,” which is crucial for maintaining the health and stability of the grassland ecosystem and protecting regional ecological security.
3. Materials and Methods
3.1. Study Area
Hulunbuir City is located in the northeastern part of the Inner Mongolia Autonomous Region, an important component of the “Three Norths” region that spans Inner Mongolia and which serves as a significant ecological security barrier in northern China. The study area is situated in the grassland region of Hulunbuir City, covering four pastoral counties (Chen Barag, Xin Barag Left, Xin Barag Right and Ewenki), three cities (Manzhouli, Yakeshi, Ergun), and one district (Hailar) (Figure 1). Hulunbuir Grassland was chosen as the study area because it provides diachronic and synchronic conditions for grassland tourism research. It is rich in resource types and has high vegetation coverage; the vegetation types transition from meadow steppes in the east to typical steppes in the west. Additionally, the tourism industry in Hulunbuir Grassland is well-developed, with 29.2225 million domestic tourists in 2023 [13]. Since the late 1990s, Hulunbuir City has been vigorously developing grassland tourism, transitioning from a nomadic to a tourism-based economy. During this process, the region has experienced infrastructure construction and a surge in tourist numbers, which has negatively impacted the grassland ecosystem. Furthermore, central ecological inspections revealed that some tourism facilities in Hulunbuir Grassland were constructed in violation of regulations and were subsequently demolished and rectified. Ecological changes before and after rectification are important indicators for evaluating the effectiveness of governmental efforts toward environmental protection and ecological governance. Therefore, Hulunbuir Grassland is a suitable region for studying the spatiotemporal patterns, influencing factors, and ecological benefits of grassland tourism.
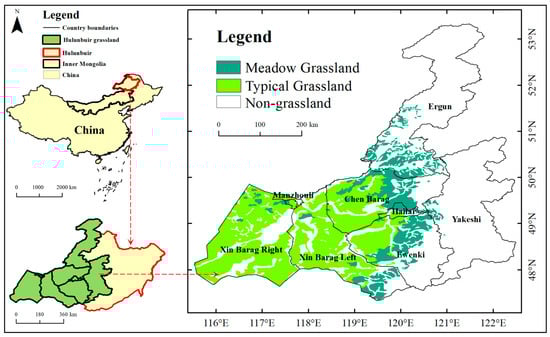
Figure 1.
The grassland in Hulunbuir. (Note: This map is based on the standard map (No. GS(2024)0650) from the National Geomatics Center of China, with no modifications to the base map boundaries.).
3.2. Data Collection
This study developed a comprehensive research framework (Figure 2) that integrated multi-source data and analytical methods. Using field surveys, remote sensing, and statistical data, we conducted spatial and temporal analyses of tourism resources with kernel density estimation, standard deviational ellipse, and location entropy methods. We then applied the Geodetector method to identify driving factors from natural, economic, social, and tourism market dimensions. Ecological effects were evaluated using NDVI and GPP calculations with buffer analysis. Temporal evolution was categorised into three stages—essential development, rapid growth, and quality-upgrading—based on resource development patterns. This integrated approach aims to provide references for ecosystem service management in grassland ecotourism regions.
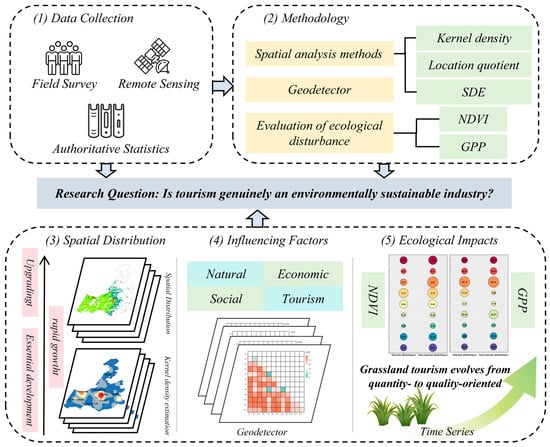
Figure 2.
Research framework. SDE, standard deviation ellipse; NDVI, normalized difference vegetation index; GPP, gross primary production.
3.2.1. Tourism Resource Data
Data on Hulunbuir Grassland tourism resources were sourced from the Inner Mongolia Autonomous Region’s Cultural and Tourism Resource Census. Data were verified through field visits to ensure accuracy and completeness. As of December 2023, 825 grassland tourism resources have been identified, including A-level tourist attractions, national forest parks, nature reserves, star-rated hotels, star-rated reception households, agritourism, Naadam camps, festival event venues, self-driving campsites, and tourist stations. The (X, Y) geographic coordinates of tourism resources were obtained through field visits and supplementary telephone interviews. Using ArcGIS,10.7 a database of Hulunbuir Grassland resources was established, and a visual analysis was conducted. Based on the “Classification, Investigation, and Evaluation of Tourism Resources (GB/T 18972-2017) [43],” the existing resources were categorized into landscapes, waterscapes, bioscapes, buildings and facilities, and historical remains and humanities. Owing to the difficulty in obtaining geographic coordinates for climate and weather phenomena and tourism merchandise, these categories were not included in this study.
3.2.2. Gross Primary Productivity (GPP)
The GPP describes the total amount of carbon dioxide fixed by plant photosynthesis and is an important indicator for monitoring vegetation growth. The observational GPP data used in this study were collected from the Chinese Terrestrial Ecosystem Flux Observation Network (ChinaFLUX). Temporal changes in GPP across different administrative regions of Hulunbuir Grassland were analyzed, as well as the differences in GPP changes between tourism-disturbed and non-tourism-disturbed areas of the grassland.
3.2.3. Normalized Difference Vegetation Index (NDVI)
The NDVI is the best indicator of vegetation coverage and can effectively reflect the health and stability of grassland ecosystems. In this study, Landsat satellite data with a spatial resolution of 30 m were selected to provide more detailed surface information and obtain more accurate results. Annual images of Hulunbuir Grassland from 2000 to 2023 were selected. The analysis focused on temporal changes in tourism-affected areas and ecological changes between tourism-disturbed and non-tourism-disturbed grasslands. Images from May to August of each year (with the best ecological conditions for the grassland) were composited, and the NDVI was calculated to represent the annual vegetation coverage level.
3.2.4. Authoritative Statistics
Hulunbuir City statistical yearbooks, county statistical yearbooks, and regional scenic work reports were also referred to in this study. The above data were used for the selection and analysis of influencing factors.
3.3. Methodology
3.3.1. Spatial Analysis
- (1)
- Kernel density estimation
The spatial distribution density of regional elements is typically expressed using kernel density estimation. The kernel density intensity reflects the characteristics and morphological changes in the dispersion or clustering of tourism elements in space [44,45].
Specifically, n is the number of observations; h is the bandwidth; k is the kernel function, and i is the distance between a tourism resource location and the ith observed location [46].
- (2)
- Location quotient
The location quotient represents the spatial structure of tourism resources within the study area and the degree of concentration of tourism resource development in different regions, measuring their locational differences [47].
Specifically, mi represents the number of tourism resources in the region i, Mi represents the number of banners, cities, or districts. n represents the total number of sub-regions divided from the study area. The larger the value, the greater the number of tourism resources in region i.
- (3)
- Standard deviation ellipse
The calculation parameters include the area of the ellipse, the rotation angle θ, and the standard deviations along the x-axis and y-axis [48,49]. The more significant the difference between the semi-major and semi-minor axes, the more pronounced the directional pattern of tourism resource distribution [48].
represent the coordinates of the i-th tourism resource. n represents the total number of tourism resources [50].
3.3.2. Geo-Detector
The Geodetector was chosen over regression models because it can effectively detect nonlinear relationships and interactive effects among driving factors. It identifies the extent to which individual factors explain the variable and clarifies the interactive effects between different influencing factors [51,52]. The closer q is to 1, the greater the explanatory power of the indicator on the spatial distribution pattern of tourism resources.
Considering regional specificity, an indicator system for the factors affecting the spatial distribution of tourism resources in Hulunbuir Grassland was developed based on previous research [52,53,54,55,56,57,58], encompassing four dimensions: natural environment, economic development, social environment, and tourism market (Table 1). The natural environment dimension includes topography and river systems, with indicators such as elevation, slope, aspect, and river network density. Economic development is measured by urbanisation level, per capita disposable income, and GDP. The social environment is characterised by road conditions and ethnic diversity; ethnic diversity is included because of its importance in understanding regional cultural characteristics and its potential for tourism industry development. The tourism market is represented by tourism revenue, tourist reception, and A-level tourist attractions. Methods including K-means clustering and geographical detection were used to determine the effect of each factor on the spatial distribution of grassland tourism resources.

Table 1.
Indicator system of factors influencing the spatial distribution of Hulunbuir Grassland tourism resources.
3.3.3. Evaluation of Ecological Disturbance from Tourism
- (1)
- NDVI extraction based on buffer zone
Based on tourism resource data from 2000 to 2023, a 1 km buffer zone was established around each tourism resource point annually and used as a mask to extract NDVI data in ArcGIS. The NDVI values inside and outside the buffer zones were compared annually to assess the disturbance caused by tourism activities on the grassland vegetation over time [59].
- (2)
- Calculation of GPPC and GPPH
To further assess the intensity of tourism disturbances relative to other human disturbances, the residual trend analysis method used by Yan et al. was referenced to distinguish the effects of climate change and human activities on vegetation GPP [60]. A negative trend in GPPH indicates primarily human-induced vegetation degradation, while a positive trend suggests human-driven vegetation restoration [60]. To differentiate ecological disturbances caused by tourism, mean values within tourism resource buffer zones were extracted from the GPPH data. This enabled a comparative analysis of ecological disturbances caused by tourism and those resulting from other livelihood activities.
GPPH = GPPA − GPPC
GPPC = a × CLIM + b
4. Results and Analysis
4.1. Spatiotemporal Patterns and Characteristics of Tourism Resources in Hulunbuir Grassland
The development of grassland tourism resources can be divided into three stages (Figure 3). The first is the essential development stage, from 2000 to 2005, with a relatively slow growth rate, during which there were 268 tourism resources, including 19 landscapes, 47 waterscapes, 12 bioscapes, 104 buildings and facilities, 70 historical remains, and 16 humanities. In this stage, the grassland resource construction sites were mainly located near Hailar, the city center, with more convenient transportation. The second stage is the rapid growth stage, from 2005 to 2018, during which there were 723 tourism resources, including 32 landscapes, 80 waterscapes, 29 bioscapes, 463 buildings and facilities, 75 historical remains, and 44 humanities. During this stage, infrastructure construction tended to improve, with buildings and facilities accounting for 64.03% of the total areas of grassland resources. Simultaneously, the construction sites were not only located near the city center but also presented a resource-oriented tendency, as more facilities appeared in areas with rich tourism resources, such as Chen Barag and Ergun. The third stage is the upgrading stage from 2018 to the present, during which there were 825 tourism resources, including 33 landscapes, 85 waterscapes, 30 bioscapes, 546 buildings and facilities, 76 historical remains, and 55 humanities. In this stage, there was a shift toward quality improvement rather than a quantity increase, and a higher requirement of ecological conservation of grassland resources, which aims to stimulate the tourism vitality of other surrounding areas near the scenic areas and relieve the ecological disturbance and pressure from frequent tourism reception.
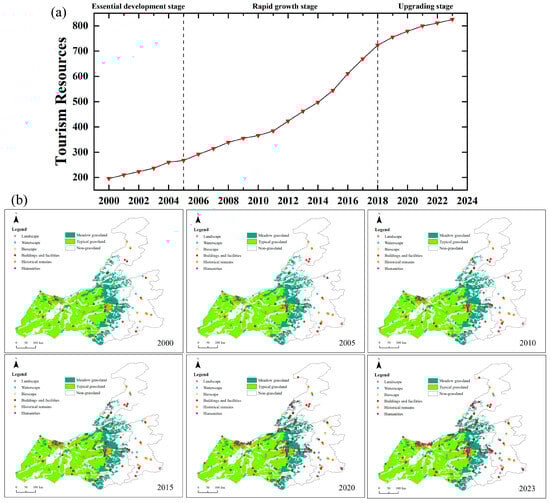
Figure 3.
Spatial–temporal evolution of tourism development on the Hulunbuir grasslands: (a) Hulunbuir grassland tourism development stages; (b) Spatial and temporal evolution of tourism resources in Hulunbuir Grassland. (Note: This map is based on the standard map (No. GS(2024)0650) from the National Geomatics Center of China, with no modifications to the base map boundaries.).
The kernel density value of tourism resources in Hulunbuir Grassland has increased yearly, from 147.24 in 2000 to 1061.42 in 2023 (Figure 4). Regarding distribution patterns, it exhibits a spatial clustering feature with Hailar as the tourism center, forming a “one pole, multiple points” pattern. Hailar has become the “one pole” for two main reasons: First, Hailar East Mountain Airport is the primary hub for tourists from various regions, and early supply-side construction tended to be located in the politically and economically central urban area with convenient transportation; second, tourist attractions such as the Morigele, Huohonuoer, and Jinzhanghan in Chen Barag, all within 40 km of Hailar, have become popular suburban tourist destinations. Owing to the bilateral richness of transportation and resources, their demonstration effect has gradually become more prominent, showing an expanding spatial clustering trend. However, over time, the location of tourism resources no longer tends to be close to the city center, and the pole effect of Hailar is gradually weakening, whereas the “multiple points” agglomeration pattern of other flag city districts is gradually increasing. Quantitative analysis shows that the kernel density value of Manzhouli increased from 45.03–88.93 in 2000 to 303.85–641.02, with regions such as Chen Barag and Ergun also experiencing substantial growth. This phenomenon is because of the following reasons: Hulunbuir’s tourism relies on its unique natural resources, and the local philosophy of “the most beautiful scenery is on the way” has made the entire region a tourist attraction, leading to a “multiple points” spatial clustering effect of tourism resources. Additionally, this effect is closely related to the distribution of government seats in the banners and districts, as events and infrastructure such as the Naadam Festival, star-rated hotels, and festival activities are typically located in these governmental centers.
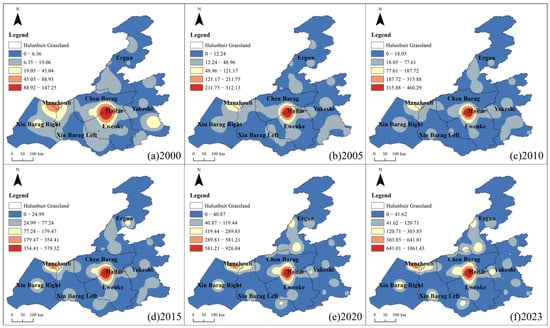
Figure 4.
Distribution of kernel density of tourism resources in the Hulunbuir grassland. (Note: This map is based on the standard map (No. GS(2024)0650) from the National Geomatics Center of China, with no modifications to the base map boundaries.).
The location quotient (LQ) values of the different types of tourism resources vary significantly across administrative regions, showing apparent spatial clustering (Figure 5). The highest LQ values in each administrative region are for buildings and facilities, indicating that the focus of tourism development in Hulunbuir Grassland is on the construction and improvement of infrastructure. Landscapes and bioscapes are concentrated in Yakeshi, which is known for its well-developed forestry systems and numerous forest parks. Waterscapes, humanities, and historical remains are mainly clustered in Xin Barag Right, where the Kerulen River, Hulun Lake, and Bel Lake provide high-quality water environments. Local herders, who respect nature deeply, regularly host events such as the Naadam and the Nomadic Culture Festival. This area also provides fertile ground for tangible and intangible cultural heritage growth.
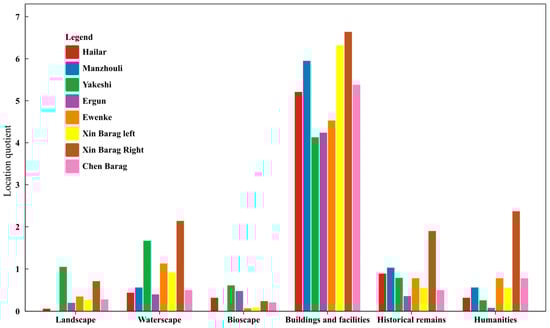
Figure 5.
Hulunbuir grassland tourism resource location quotient.
From 2000 to 2023, the difference between the X- and Y-axes was slight, indicating that the directional orientation of the Hulunbuir Grassland tourism resource pattern was not prominent (Figure 6a). The rotation angle ranges between 86° and 76° (Figure 6b), and the spatial center of Hulunbuir Grassland tourism resources has consistently been within the range of 119.26° E to 119.38° E and 49.23° N to 49.41° N, primarily located within Chen Barag (Figure 6c). Chen Barag exhibits significant advantages in tourism resource development owing to its rich grassland resources, dense concentration of high-level scenic areas, proximity to transportation hubs, such as Hailar, and deep Barag cultural heritage.
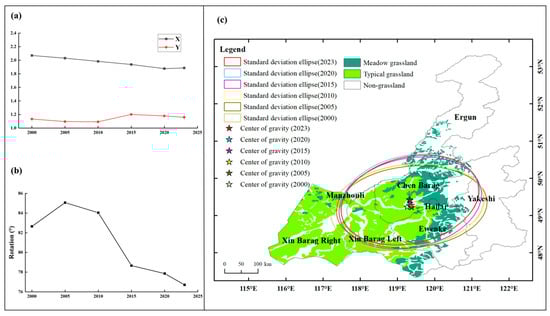
Figure 6.
Standard deviation ellipse of Hulunbuir grassland tourism areas: (a) the gap between X- and Y-axis; (b) the angle of rotation; (c) the spatial centres of gravity of tourism in the Hulunbuir grassland. (Note: This map is based on the standard map (No. GS(2024)0650) from the National Geomatics Center of China, with no modifications to the base map boundaries.).
4.2. Influencing Factors of Tourism Resources Spatio-Temporal Patterns in the Hulunbuir Grassland
From the single-factor detection results (Figure 7), the ranking of factor influence on overall tourism resources is: proportion of ethnic minority populations (0.7153), tourism receipts (0.6520), river network density (0.6361), A-level tourist attractions (0.6076), per capita disposable income (0.5892), GDP per inhabitant (0.5886), aspect (0.5603), tourism revenue (0.5603), slope (0.5243), slope (0.2790), urbanisation (0.0367), and road density (0.0356). The spatial distribution of tourism resources in Hulunbuir Grassland is influenced by multiple factors and exhibits typological differences. Geomorphic landscapes are dominated by elevation, river network density, and per capita income (q-value: 0.68–0.99). Landscapes are primarily affected by river network density (q-value: 0.92–0.93). Bioscapes are significantly correlated with the number of A-level scenic areas, tourist flow, and slope (q-value: 0.73–0.84). Buildings and facilities are influenced by tourism revenue, tourist flow, and the number of scenic areas (q-value: 0.55–0.70), which support the quality enhancement and upgrading of tourism. Historical remains are affected by slope and ethnic minority population (q-value: 0.76–0.83). Material heritage is preserved in flat areas, while intangible cultural heritage is inherited by ethnic minority settlements. Humanities are shaped by the proportion of ethnic minorities, per capita GDP, and slope (q-value: 0.76–0.83). Traditional Mongolian cultural practices, such as the Naadam Festival and Bokh wrestling leagues, are derived from these patterns. Each resource type is differentiated in terms of spatial distribution through unique influencing mechanisms, collectively forming the core competitiveness of grassland tourism.
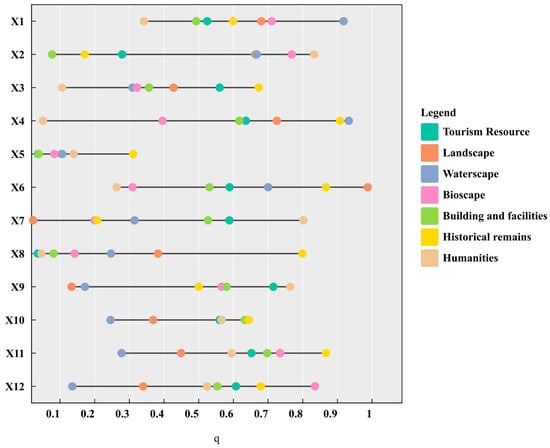
Figure 7.
Detection results of the influence of factors on the spatial distribution of tourism resources in the Hulunbuir grassland.
The interaction factor detection results revealed that the spatial distribution of tourism resources in Hulunbuir Grassland was dominated by the synergistic effects of multiple factors, with all combinations exhibiting nonlinear or bifactor-enhanced characteristics (Figure 8). The interaction between the proportion of ethnic minority populations and tourist reception frequency was identified as the most significant, with these two factors interacting with other factors to form the core driving mechanism. Specifically, the interaction q-value between the ethnic minority population proportion, total tourism revenue, and tourist reception frequency reached a peak of 0.9812, indicating that the diversity of ethnic culture not only stimulates the creation of distinctive tourism products but also collaborates with market vitality to shape infrastructure layouts and resource development patterns. For each tourism resource type, landscapes are dominated by the interaction of slope and total tourism revenue, together with the interaction of slope aspect and urbanization rate. Waterscapes are primarily affected by interactions among river network density, economic indicators, and attractiveness indicators, as economic foundations and tourism potential jointly ensure the protective development of water resources. Bioscapes exhibit the strongest interaction between slope aspect and river network density, because warm microclimates on sunny slopes, combined with water supply, create high-quality ecological niches. Building and facilities are influenced by the interaction of per capita income and tourism economic indicators, leading to the formation of an “economy-tourism-facility” symbiotic system in economically developed regions. Historical remains are shaped by elevation, ethnic population, slope aspect, and river network density, reflecting the geographic adaptability and cultural uniqueness embedded in nomadic settlement strategies. Humanities are affected by the interaction between elevation and ethnic populations, together with the interaction between tourist flow and ethnic culture. The spatial heterogeneity of grassland tourism resources is governed by a nonlinear coupling mechanism, in which natural geographic elements define the foundational distribution, while socioeconomic elements enable resource value transformation, and ethnic cultural elements, acting as a unique medium, convert natural endowments into experiential cultural tourism products. These findings collectively show that the spatial heterogeneity of grassland tourism resources is governed by a nonlinear coupling mechanism: natural geographic constraints determine foundational patterns, socioeconomic dynamics drive resource development, and ethnic cultural elements serve as unique mediators, transforming natural endowments into experiential cultural products.
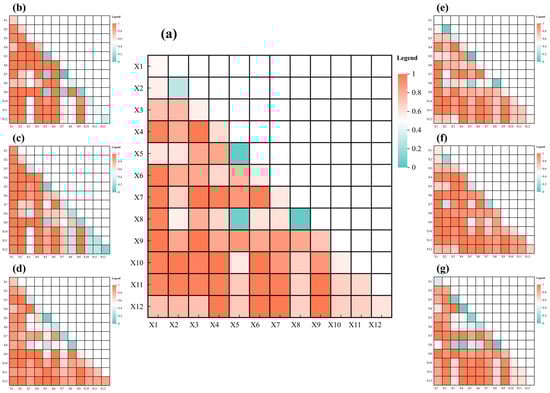
Figure 8.
Factor interaction detection results of different types of tourism resources in the Hulunbuir Grassland: (a) all types; (b) landscapes; (c) waterscapes; (d) bioscapes; (e) buildings and facilities; (f) historical remains; (g) humanities.
4.3. Ecological Impacts of Tourism Resources in Hulunbuir Grassland
By conducting a correlation analysis between the NDVI values within the buffer zone and the number of grassland tourism resources, an R2 value of 0.5226 (p < 0.01) was obtained, indicating a significant correlation and statistical significance (Figure 9a). During the essential development stage, environmental protection awareness and corresponding management measures were lacking, resulting in insufficient ecological protection during the development process. Consequently, the NDVI values around the tourism resources in this stage were 0.4798. During the rapid growth stage, the rapid pace of construction led to disorderly tourism development, which exerted considerable pressure on the grassland ecosystem. Furthermore, ecological inspections found that of the more than 50 A-level tourist attractions in Hulunbuir City, 8 had not obtained the necessary permits for grassland occupation. This situation not only violated relevant laws and regulations but also had adverse effects on the ecological environment of Hulunbuir Grassland. The average NDVI value during this stage was 0.5007. In 2018, the development of tourism resources in Hulunbuir Grassland entered the upgrading stage. Non-compliant scenic areas in Hulunbuir Grassland were rectified and demolished by the Central Environmental Protection Inspection Team. The average NDVI value for this stage was 0.6182, which was significantly higher than that of the previous two stages, indicating a gradual reduction in the intensity of tourism disturbances (Figure 9b). The ecological comparison between the tourism-disturbed areas and non-tourism-disturbed areas of Hulunbuir Grassland (Figure 9c) showed that the current NDVI within the 1 km buffer zone of the Hulunbuir Grassland tourism resources is 0.5560, which is lower than the overall level. The NDVI of the non-tourism areas in Hulunbuir Grassland is 0.6355, and the NDVI values of all tourism-disturbed areas are lower than those of the non-tourism-disturbed areas. An independent-samples t-test comparing NDVI values between these areas showed a significant difference (t(10) = 2.45, p = 0.032).
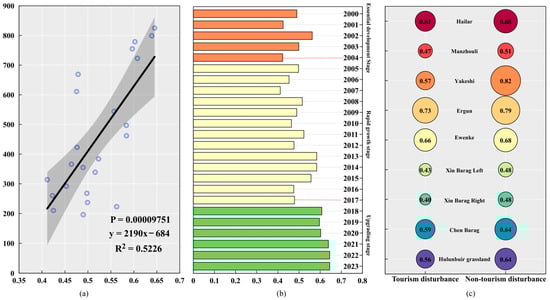
Figure 9.
NDVI of Hulunbuir grassland tourism areas: (a) correlation between grassland tourism resources and NDVI; (b) NDVI of grassland tourism areas from 2000 to 2023; (c) NDVI of tourism-disturbed areas and non-tourism-disturbed areas in Hulunbuir Grassland.
The trends of GPPA and GPPC in both tourism-disturbed and non-tourism-disturbed areas of Hulunbuir Grassland remained consistent between 2000 and 2022 (Figure 10a,b). The GPPA values in tourism-disturbed areas were higher than those in non-tourism-disturbed areas, with differences ranging from 16.179 to 76.067. Similarly, the GPPC values in tourism-disturbed areas were higher than those in non-tourism-disturbed areas, with differences between 21.087 and 57.337. Hulunbuir Grassland is generally regulated by climatic conditions, and both tourism and non-tourism areas are located within the same climatic zone. Additionally, positive impacts were generated by policies such as grazing prohibition, grassland restoration, and ecological rehabilitation, which collectively promoted an overall improvement in vegetation productivity. Distinct fluctuating trends in GPPH were observed in both tourism-disturbed and non-tourism-disturbed areas (Figure 10c); however, the GPPH in tourism-disturbed areas was more stable. Particularly, during the upgrading stage, the GPPH values in tourism-disturbed areas significantly increased and surpassed the overall level of non-tourism-disturbed areas, which can be attributed to effective management measures, public environmental awareness, and other context-specific conditions under which tourism activities are conducted. The results suggest that with proper management, there could be a harmonious coexistence between tourism development and ecological conservation. For the GPPH of each county (Figure 10d,e), the changing trends presented high consistency in tourism-disturbed and non-tourism-disturbed areas, which again demonstrated the overall improvement in ecological conditions.
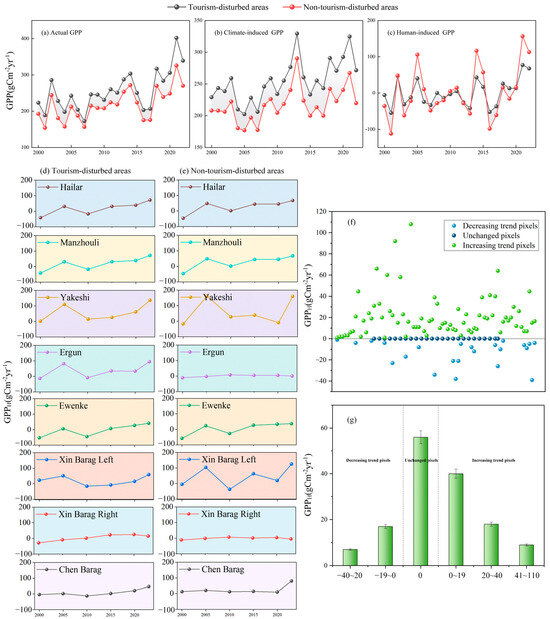
Figure 10.
Trends of GPP in tourism-disturbed and non-tourism-disturbed areas during 2000–2023. Interannual trends of (a) actual GPP, (b) climate-induced GPP, (c) human-induced GPP, (d) tourism-disturbed areas, (e) non-tourism-disturbed areas, (f,g) GPPH trends at the pixel scale.
A per-pixel trend analysis of GPPH under tourism disturbance was conducted for different years (Figure 10f,g). It revealed that 16.33% of the pixels were characterized by a negative growth trend, 45.58% exhibited a positive growth trend, and 38.10% remained unchanged (Figure 10f). The number of positively trending pixels was significantly greater than that of the negatively trending pixels (Figure 10g). These results suggest that tourism activities have transitioned toward a “sustainable” orientation under policies such as ecological civilization construction and grassland ecological protection subsidy incentives. Tourism development has entered a new stage with the joint pursuit of economic prosperity and ecological conservation in Hulunbuir Grassland.
5. Discussion
5.1. Ethnic Culture as the Key Influencing Factor of the Spatial Pattern of Grassland Tourism Resources
Most grasslands in China are situated in regions inhabited by ethnic minorities, giving grassland tourism both natural and cultural characteristics [6,7]. In recent years, tourist demand has shifted from simple sightseeing to immersive experiences, with a greater emphasis on cultural engagement. During this period, ethnic culture has become the central attraction of grassland tourism [13]. Unlike other scenic areas and rural tourism destinations examined in previous studies [52,61,62], Hulunbuir Grassland is distinguished by its significant ethnic diversity, which, as the results showed, has strong explanatory power in both single-factor and interaction-factor analyses.
The results show that the four pastoral counties, characterised by diverse ethnic and nomadic cultures, have significantly greater tourism appeal than others. Tourists can engage with various local groups through activities such as visiting grassland scenic areas, participating in Bokh competitions and the Naadam Festival, and staying in Mongolian yurts, which enable a deeper understanding and experience of grassland customs and traditions. Furthermore, the natural scenic areas in the four pastoral banners have effectively combined natural landscapes with the local herders’ way of life. For example, the Morigele River in Chen Barag is known for its winding course, extensive grasslands, and abundant wildlife. It also serves as an important site for herders’ daily activities, livestock production, and nomadic cultural traditions. Local herders participate directly in tourism by providing accommodation, catering, and guiding services. Tourism offers new income sources and reduces reliance on single livestock production, reflecting livelihood diversification among local residents. However, expanding tourism may risk cultural practices becoming staged and commodified. When traditional rituals are standardised for performance to meet tourists’ expectations, their original social functions and cultural authenticity may be compromised. Therefore, promoting tourism development requires a cultural authenticity assessment mechanism. Documenting ritual norms, controlling the frequency of commercial performances, and preserving spaces for non-performative traditional activities can protect the economic interests of local herders and maintain the core value and vitality of ethnic cultural heritage.
5.2. Multi-Stakeholder Collaboration Effectively Supporting the Ecological Conservation of Grassland Tourism Destinations
With the deepening construction of an ecological civilization in China, coordination between tourism advancement and ecological conservation has become crucial for achieving regional, high-quality, and sustainable development. In addition to the cultural dynamics discussed earlier, governance mechanisms and multi-stakeholder collaboration are also important in shaping sustainable tourism outcomes. The Chinese government attaches great importance to the ecological conservation of grassland ecosystems and has put forward a series of relevant laws, regulations, and policies that emphasize the reasonable utilization of grassland resources without intensive human activities. The Hulunbuir government has systematically dismantled illegal constructions and ordered the rectification of several tourism facilities in recent years, curbing disorderly tourism encroachment on grasslands [13]. Such efforts of the local government have been demonstrated through the results of NDVI and GPPH, which have shown a significant increasing trend over the past 20 years. Therefore, tourism gradually evolves into a real “smokeless” and “green” industry. In the future, scenic spots should follow a green development path to coordinate economic growth and ecological conservation; strengthened cooperation among local governments is also necessary [63].
For effective tourism management, local governments have played a crucial role, making full use of idle houses in pastoral areas to provide tourism reception services, thus relieving the extra ecological pressure from tourism on grasslands. Other measures, such as selecting model villages and star-rated reception households, have also been implemented to standardize reception facilities and extend the tourism industry chain. Furthermore, both scenic areas and herders have made significant efforts toward ecological conservation, as a symbiotic relationship has been formed between herders and scenic areas in Hulunbuir Grassland. Specifically, herders rely on the grasslands for their livelihood and are more focused on avoiding their overuse and destruction, while managers of scenic areas have increased their awareness of ecological conservation and used methods such as artificial seeding to restore the vegetation in damaged areas. This could significantly enhance the visual appeal of the scenic areas and provide visitors with more enjoyment. Efforts of multi-stakeholders have a significantly positive effect on both the ecological quality of grasslands and the attractiveness of tourism destinations.
5.3. Theoretical and Practical Contributions
This study integrates spatiotemporal analysis with ecological indicators, addressing the limitations of previous grassland tourism research, which often relied on individual case studies or qualitative descriptions. It offers a quantitative approach to analysing the spatial patterns of tourism activities and their ecological effects at a macro scale. Using the Geodetector, the research identifies key influencing factors and reveals the non-linear enhancement effects arising from their interactions. Ethnic culture is established as a critical explanatory variable, and its interaction with tourism economic factors shows the strongest explanatory power. This demonstrates that grassland tourism is not solely an economic phenomenon but a complex cultural-ecological system. The study also delineates the developmental stages of grassland tourism, dividing the evolution of tourism in Hulunbuir into three sequential phases: essential development, rapid growth, and upgrading. Additionally, it reveals the spatial pattern’s evolution from ‘monocentric concentration’ to ‘polycentric agglomeration’. These findings provide significant theoretical reference value for understanding the evolutionary patterns of similar tourism destinations.
The research identifies spatial agglomeration areas of tourism resources, the migration path of their centre of gravity, and key influencing factors. These findings provide a precise basis for optimising tourism resource allocation, infrastructure planning, and tourism product development in Hulunbuir City and similar grassland regions. Long-term sequential comparisons of NDVI and GPP data objectively assess the ecological disturbance caused by tourism activities, confirming that the ‘quality upgrading’ phase, through standardised management and ecological restoration, can significantly mitigate negative ecological effects from tourism. This offers robust data support for government implementation of ecological compensation mechanisms, establishment of ecological protection redlines, and related management policies. The study also highlights the importance of multi-stakeholder collaborative governance. The discussion section shows the collective role of the central government, local governments, scenic areas, and herders in ecosystem conservation, outlining a concrete pathway for building a ‘government–enterprise–community’ co-governance model for sustainable development and providing practical guidance for policy implementation.
5.4. Research Limitations and Future Directions
The tourism resource data primarily relied on census and statistical records, which may not have fully captured informal or small-scale tourism activities, introducing certain biases. The ecological assessment mainly depended on remote sensing indicators such as NDVI and GPP. Although these indicators effectively reflected vegetation coverage and productivity, they did not include ecological metrics such as soil compaction and biodiversity, resulting in an incomplete evaluation of ecosystem health. Because the study was based on a case analysis of the Hulunbuir grassland, further comparison and validation are required to assess the generalisability of its findings.
Future research could incorporate social media data, such as tourist GPS trajectories and online reviews, to address the limitations of traditional data sources. In ecology, integrating ground-based monitoring with indicators such as soil quality, water quality, and biodiversity could support the development of a more comprehensive framework for assessing the ecological effects of grassland tourism. Additionally, cross-regional comparative studies could refine a more universally applicable research framework for grassland tourism and identify unique characteristics across different regional contexts.
6. Conclusions
Clarifying the spatiotemporal distribution patterns and ecological effects of tourism resources is essential for policymakers to optimise resource allocation and develop appropriate strategies to balance ecological conservation with tourism-driven economic growth. Using spatial analysis and Geodetector, this study examined the spatiotemporal distribution of tourism resources in the Hulunbuir grassland, identified key influencing factors, and assessed temporal changes in vegetation in this ecologically fragile region under tourism development. The results showed that tourism resources in the Hulunbuir grassland experienced three distinct stages: essential development, rapid growth, and upgrading. The spatial centre of gravity remained within Chen Barag Banner, forming a ‘single-core–multiple-cluster’ pattern centred on Hailar District. This spatial structure was mainly affected by tourism receipts, A-level tourist attractions, river network density, and the proportion of ethnic minority populations, with these factors interacting synergistically. The interaction between the proportion of ethnic minority populations and both tourism revenue and tourism receipts had the strongest effect. Although ecological conditions improved during the upgrading stage, vegetation coverage in non-tourism disturbance areas generally remained higher than in tourism disturbance areas.
This study found that local tourism in Hulunbuir Grassland has gradually shifted from a focus on quantity to an emphasis on quality, effectively reducing the ecological pressure on grasslands caused by tourism. This result aligns with the ideal future direction of modern tourism. With adjustments in social structure, advances in information technology, and the strengthening of ethnic culture, tourism is expected to develop new characteristics and move towards ‘diversity’ rather than ‘homogenisation’. This evolution may present both opportunities and challenges for tourism development, necessitating effective tourist management and ecological conservation to support sustainable tourism without grassland degradation. These conclusions offer insights for developing tourism policies that integrate cultural and ecological conservation. It is recommended to establish a cultural–ecological dual-core monitoring system, incorporating both the preservation status of ethnic cultural heritage and ecological indicators such as grassland vegetation coverage and biodiversity into the regional tourism development assessment framework. Policy support should prioritise areas with distinctive cultural features and healthy ecological conditions. Ultimately, this approach will support the harmonious coexistence of economic growth, grassland conservation, and cultural inheritance.
Author Contributions
Investigation, L.H., B.D., B.Z. and Y.X.; writing—original draft preparation, L.H.; writing—review and editing, L.H. and B.W.; supervision, B.W. and A.C.; project administration, A.C.; funding acquisition, A.C. All authors have read and agreed to the published version of the manuscript.
Funding
This paper was supported by the National Natural Science Foundation of China (42061031), Natural Science Foundation of Inner Mongolia Autonomous Region (2025QN04010) and Inner Mongolia Normal University High-Level Talent Research Startup Fund Project (2025YJRCO85).
Institutional Review Board Statement
Not applicable.
Informed Consent Statement
Not applicable.
Data Availability Statement
The raw data supporting the conclusions of this article will be made available by the authors on request.
Acknowledgments
We would like to thank all the experts for their contribution to improving the quality of the paper. Thanks to the Hulunbuir City Tourism Bureau, who gave their time and energy to our fieldwork. We would like to thank the 28 teachers and students of the Hulunbuir City Cultural and Tourism Resources Census Project Team, who contributed accurate and valid basic data to the article.
Conflicts of Interest
The authors declare no conflicts of interest.
References
- Pueyo, R.J. The role of tourism in the ecosystem services framework. Land 2018, 7, 111. [Google Scholar] [CrossRef]
- Lin, Y.; Jin, Y.D.; Lin, M.S. Exploring the spatial and temporal evolution of landscape ecological risks under tourism disturbance: A case study of the Min River Basin, China. Ecol. Indic. 2024, 166, 112412. [Google Scholar] [CrossRef]
- Liu, D.D.; Yin, Z.Y. Spatial-temporal pattern evolution and mechanism model of tourism ecological security in China. Ecol. Indic. 2022, 139, 08933. [Google Scholar] [CrossRef]
- Chen, X.; Wang, X.; Song, Y.; Chi, Y. A review of studies on the effects of Anthropogenic disturbances on Plant–Soil–Microorganism interactions in Grassland ecosystems: Based on grazing and tourism perspectives. Agronomy 2024, 14, 2890. [Google Scholar] [CrossRef]
- Zhang, S.; Zhang, Z.; Yu, H.; Zhang, T. Assessment and empirical research on the suitability of Eco-tourism development in nature reserves of China: A multi-type comparative perspective. Land 2024, 13, 438. [Google Scholar] [CrossRef]
- Wang, B.Y.; Yan, H.M.; Xue, Z.C. Nature-based solutions benefit the economic–ecological coordination of pastoral areas: An outstanding herdsman’s experience in Xilin Gol, China. Land 2022, 11, 107. [Google Scholar] [CrossRef]
- Wilsey, B.J. The Biology of Grasslands; Oxford University Press: New York, NY, USA, 2018. [Google Scholar]
- Buckley, R.; Ollenburg, C.; Zhong, L. Cultural landscape in Mongolian tourism. Ann. Tour. Res. 2008, 35, 47–61. [Google Scholar] [CrossRef][Green Version]
- Talinbayi, S.; Xu, H.; Li, W. Impact of yurt tourism on labor division in nomadic Kazakh families. Tour. Cult. Change 2019, 17, 339–355. [Google Scholar] [CrossRef]
- Zhou, F.F.; Guo, M.; Zhong, C. Spatial-temporal patterns and characteristics of grassland fire in the Hulunbuir Grassland. Sci. Geogr. Sin. 2022, 42, 1838–1847. [Google Scholar]
- Wang, P.W.; Ya, J. Tourists’ willingness to pay conservation fees: The case of Hulunbuir grassland, China. Resour. Ecol. 2023, 14, 656–666. [Google Scholar]
- Li, M.H.; Wang, X.Y.; Chen, J.C. Assessment of grassland ecosystem services and analysis on its driving factors: A case study in Hulunbuir grassland. Front. Ecol. Evol. 2022, 10, 841943. [Google Scholar] [CrossRef]
- Han, Q.C.; Wu, T.H.; Yi, R.H. Behaviors follow the environment: Environment perceptions and pro-environmental behaviors of tourists in grassland tourism. Hum. Geogr. 2024, 39, 158–166. [Google Scholar]
- Liu, M.; Chen, T.; Zhong, L.S. Progress of grassland tourism in China. Hum. Geogr. 2007, 22, 1–6. [Google Scholar]
- Chen, H.J. Complementing conventional environmental impact assessments of tourism with ecosystem service valuation—A case study of the Wulingyuan scenic area, China. Ecosyst. Serv. 2020, 43, 101100. [Google Scholar] [CrossRef]
- Wang, H.Q.; Yuan, J.D.; Meng, X.J. Spatial distribution and its influencing factors of level—A scenic spots in Northeast China. Sci. Geogr. Sin. 2017, 37, 895–903. [Google Scholar]
- Liu, M.; Hao, W. Spatial distribution and its influencing factors of national A-level tourist attractions in Shanxi Province. Acta Geogr. Sin. 2020, 75, 878–888. [Google Scholar]
- Li, P.; Yu, H.; Wang, Y.J. Spatial agglomeration characteristics of from 3A-class to 5A-class scenic spots in China. Sci. Geogr. Sin. 2018, 38, 1883–1891. [Google Scholar]
- Jia, Y.Y.; Hu, J.; Liu, D.J. Spatial evolution and influence mechanism of A-level scenic spots in urban agglomeration in the middle reaches of the Yangtze River. Econ. Geogr. 2019, 39, 198–206. [Google Scholar]
- Li, X.Z.; Zhao, Z.B.; Liu, Y. Spatial measurement of commercial homogeneity of ancient town destination based on street view images: A case study of Dali ancient city. Prog. Geogr. 2023, 42, 104–115. [Google Scholar] [CrossRef]
- Bernhard, B.; Duccio, C. Copysites: Tourist attractions in the age of their architectural reproducibility. Tour. Cult. Change 2019, 17, 13–26. [Google Scholar] [CrossRef]
- Yin, C.; Qian, X. The spatial production of simulacrascape in urban China: Economic function, local identity and cultural authenticity. Cities 2020, 104, 102806. [Google Scholar] [CrossRef]
- Wang, X.R.; Zeng, Y.; Lai, Q. Why do start-up tourism small and medium-sized enterprises imitate? A mixed-methods research design. Hosp. Tour. Manag. 2024, 61, 11–22. [Google Scholar] [CrossRef]
- Khizar, H.M.U.; Younas, A.; Kumar, S. The progression of sustainable development goals in tourism: A systematic literature review of past achievements and future promises. Innov. Knowl. 2023, 8, 100442. [Google Scholar] [CrossRef]
- Xiang, Y.Y.; Meng, J.J.; You, N.S. Spatio-temporal analysis of anthropogenic disturbances on landscape pattern of tourist destinations: A case study in the Li River basin, China. Sci. Rep. 2019, 9, 19285. [Google Scholar] [CrossRef]
- Bardgett, R.D.; Bullock, J.M.; Lavorel, S. Combatting global grassland degradation. Nat. Rev. Earth Env. 2021, 2, 720–735. [Google Scholar] [CrossRef]
- Gibbs, H.K.; Salmon, J.M. Mapping the world’s degraded lands. Appl. Geogr. 2015, 57, 12–21. [Google Scholar] [CrossRef]
- Zhang, X.J.; Zhong, L.S. Progress in tourism ecology research. Acta Ecol. Sin. 2019, 39, 9396–9407. [Google Scholar]
- Liu, J.; Wang, J.; Wang, S.H. Analysis and simulation of the spatiotemporal evolution pattern of tourism lands at the Natural World Heritage Site Jiuzhaigou, China. Habitat Int. 2005, 79, 74–88. [Google Scholar] [CrossRef]
- Canteiro, M.C.; Cordova-Tapia, F.; Brazeiro, A. Tourism impact assessment: A tool to evaluate the environmental impacts of touristic activities in Natural Protected Areas. Tour. Manag. Perspect. 2018, 28, 220–227. [Google Scholar] [CrossRef]
- Queiroz, R.E.; Ventura, M.A.; Silval, L. Plant diversity in hiking trails crossing Natura 2000 areas in the Azores: Implications for tourism and nature conservation. Biodivers. Conserv. 2014, 23, 1347–1365. [Google Scholar] [CrossRef]
- Pickering, C.M.; Wendy, H. Impacts of recreation and tourism on plant biodiversity and vegetation in protected areas in Australia. Environ. Manag. 2007, 85, 791–800. [Google Scholar] [CrossRef]
- Niu, L.Q.; Cheng, Z.H. Impact of tourism disturbance on forest vegetation in Wutai Mountain, China. Environ. Monit. Assess. 2019, 191, 81. [Google Scholar] [CrossRef]
- Zhang, J.T.; Xiang, C.; Li, M. Effects of tourism and topography on vegetation diversity in the subalpine meadows of the Dongling Mountains of Beijing, China. Environ. Manag. 2012, 49, 403–411. [Google Scholar] [CrossRef] [PubMed]
- Bar, P. Visitor trampling impacts on soil and vegetation: The case study of Ramat Hanadiv Park, Israel. Isr. J. Plant Sci. 2017, 64, 145–161. [Google Scholar] [CrossRef]
- Ballantyne, M.; Pickering, C.M. Tourism and recreation: A common threat to IUCN red-listed vascular plants in Europe. Biodivers. Conserv. 2013, 22, 3027–3044. [Google Scholar] [CrossRef]
- Cole, D.N. Impacts of hiking and camping on soils and vegetation: A Review. Environ. Impacts Ecotour. 2004, 4, 41–60. [Google Scholar] [CrossRef]
- Torn, A.; Tolvanen, A.; Norokorpi, Y. Comparing the impacts of hiking, skiing and horse riding on trail and vegetation in different types of forest. Environ. Manag. 2009, 90, 1427–1434. [Google Scholar] [CrossRef]
- Wu, J.; Hou, Y.L.; Wen, Y.L. Tourist behavior and conservation awareness on eating wild edible plants in mountainous protected areas: A case study in Northwest China. Sustain. For. 2018, 37, 489–503. [Google Scholar] [CrossRef]
- Pickering, C.M.; Wendy, H.; David, N. Comparing hiking, mountain biking and horse riding impacts on vegetation and soils in Australia and the United States of America. Environ. Manag. 2010, 91, 551–562. [Google Scholar] [CrossRef]
- Xi, J.C.; Zhao, M.F.; Ge, Q.S. Changes in land use of a village driven by over 25 years of tourism: The case of Gougezhuang village, China. Land Use Policy 2014, 40, 119–130. [Google Scholar] [CrossRef]
- Jedd, T.M.; Hayes, M.J.; Carrillo, C.M. Measuring park visitation vulnerability to climate extremes in U.S Rockies National. Tour. Geogr. 2018, 20, 224–249. [Google Scholar] [CrossRef]
- GB/T 18972-2017; Classification, Investigation and Evaluation of Tourism Resources. China Tourism Publishing House: Beijing, China, 2017.
- Wu, Q.; Li, X.G.; Wu, L. Distribution pattern and spatial correlation of A-grade tourist attractions in Hunan province. Econ. Geogr. 2017, 37, 193–200. [Google Scholar]
- Liu, Z.; Shi, R.; Shen, L.Q. Unsupervised salient object segmentation based on kernel density estimation and two-phase graph cut. IEEE Trans. Multimed. 2012, 14, 1275–1289. [Google Scholar] [CrossRef]
- Rosenblatt, M. Remarks on some nonparametric estimates of a density function. Ann. Math. Stat. 1956, 27, 832–837. [Google Scholar] [CrossRef]
- Dong, B.H.; Chang, A. Analysis of spatial distribution and influencing factors of high-grade tourist attractions in Inner Mongolia. Inn. Mong. Agric. Univ. Nat. Sci. Ed. 2018, 39, 61–68. [Google Scholar]
- Zhou, C.; Zhou, L.; Lv, J.Y. Spatial differences of red revolution sites in Shanxi province and its relationship with influencing factors: A case of immovable revolutionary relics. Arid Land Resour. 2022, 36, 163–171. [Google Scholar]
- Cheng, Y.; Yin, J. Distribution and formative factors of tourism safety incidents in China. Econ. Geogr. 2020, 40, 215–224. [Google Scholar]
- Wang, M.D.; Liu, J.M.; Zhang, S.Y. Spatial pattern and micro-location rules of tourism businesses in historic towns: A case study of Pingyao, China. Destin. Mark. Manag. 2022, 25, 100721. [Google Scholar] [CrossRef]
- Wang, J.F.; Xu, C.D. Geodetector: Principle and prospective. Acta Geogr. Sinca 2017, 72, 116–134. [Google Scholar]
- Tian, C.Y.; Guan, X.T.; Tian, H.W. Spatial distribution characteristics and its influencing factors of key rural tourism villages in the Yellow River Basin. Tour. Trib. 2023, 38, 32–44. [Google Scholar]
- Yan, N.; Zhang, J.; Xia, B. How can the natural background and ecological & environment promote the green and sustainable development of Chinese tourist attractions? Ecol. Indic. 2024, 169, 112813. [Google Scholar] [CrossRef]
- Hoşgör, Z.; Yigiter, R. Greenway planning context in Istanbul-Haliç: A compulsory intervention into the historical green cor. Landsc. Res. 2011, 36, 341–361. [Google Scholar] [CrossRef]
- Draper, J.; Oh, C.; Harril, R. Understanding public preferences for development of a heritage tourism corridor: A choice experiment approach. In Proceedings of the Travel and Tourism Research Association International Conference, Vail, CO, USA, 19–21 June 2016. [Google Scholar]
- Gravari-Barbas, M. Tourism as a heritage producing machine. Tour. Manag. Perspect. 2018, 26, 5–8. [Google Scholar]
- Ni, J.F.; Zhang, C.; Zhao, X. Spatial differentiation and influencing mechanism of county territory tourist attractions in Shaanxi. Arid Land Resour. 2022, 36, 202–208. [Google Scholar]
- Zhang, S.Y.; Yu, W.T.; Cui, J.S. Comparative analysis of the spatial-temporal distribution and influencing factors of the tourism industry in three cities along Beijing-Hangzhou grand canal in China. Resour. Ecol. 2024, 15, 1039–1053. [Google Scholar]
- Liu, H.; Huang, Y.F.; Zhu, Y.H. Impacts of tourist activity on vegetation change in Lushan scenic spot—Based on spatial information technology. Cent. China Norm. Univ. 2019, 53, 425–432. [Google Scholar]
- Yan, H.; Xue, Z.C.; Niu, Z.E. Ecological restoration policy should pay more attention to the high productivity grasslands. Ecol. Indic. 2021, 129, 107938. [Google Scholar] [CrossRef]
- Zhuang, J.; Shen, M.Z.; Xie, S.Y. Spatial variation of A-level tourist attractions in Hubei province and its influencing factors. Arid Land Resour. 2023, 37, 191–198. [Google Scholar]
- Long, S.F.; Cao, K.J.; Shang, N. Spatial effect of tourism promoting rural development: An empirical analysis of 83 counties in Xinjiang Uygur Autonomous Region. Geogr. Sci. 2024, 44, 1387–1395. [Google Scholar]
- Li, H.Q.; Li, D.; Dong, X.Q. Spatial patterns of 5A-level tourist attractions and their network attention degrees in China. Arid Land Resour. 2019, 33, 178–184. [Google Scholar]


Disclaimer/Publisher’s Note: The statements, opinions and data contained in all publications are solely those of the individual author(s) and contributor(s) and not of MDPI and/or the editor(s). MDPI and/or the editor(s) disclaim responsibility for any injury to people or property resulting from any ideas, methods, instructions or products referred to in the content. |
© 2025 by the authors. Licensee MDPI, Basel, Switzerland. This article is an open access article distributed under the terms and conditions of the Creative Commons Attribution (CC BY) license (https://creativecommons.org/licenses/by/4.0/).