Abstract
Under the dual pressures of rapid urbanization and intense human socioeconomic activities, habitat fragmentation and poor landscape connectivity have become critical issues in cities. Constructing ecological networks is essential for maintaining urban ecosystem health and promoting sustainable environmental development. It represents an effective approach to balancing regional economic growth with ecological conservation. This study focused on the Shenzhen Special Economic Zone. Ecological sources were identified using Morphological Spatial Pattern Analysis (MSPA) and landscape connectivity assessment. Circuit theory was applied to extract ecological corridors, ecological pinch points, and ecological barriers. The importance levels of ecological corridors were classified to form an ecological network. The network was optimized by adding ecological sources, stepping stones, and restoring breakpoints. Its structure and functionality were evaluated before and after optimization. The results indicate the following: (1) The core area in Shenzhen City Area covers 426.67 km2, the largest proportion among landscape types. It exhibits high fragmentation, low connectivity, and a spatial pattern characterized as “dense in the east and west, sparse in the center.” (2) Seventeen ecological sources were identified, consisting of 8 key sources, 5 important sources, and 4 general sources, accounting for 17.62% of the total area. Key sources are mainly distributed in forested regions such as Wutong Mountain, Maluan Mountain, Paiya Mountain, and Qiniang Mountain in the southeast. (3) Twenty-six ecological corridors form a woven network, with a total length of 127.44 km. Among these, 13 key corridors are concentrated in the eastern region, while 7 important corridors and 6 general corridors are distributed in the western and central parts. Few corridors exist in the southwest and southeast, leading to ecological flow interruption. (4) The optimized ecological network includes 12 newly added ecological source areas, 20 optimized ecological corridors, 120 ecological pinch points, and 26 ecological barriers. The maximum current value increased from 10.60 to 20.51, indicating significantly enhanced connectivity. The results provide important guidance for green space planning, biodiversity conservation, and ecosystem functionality enhancement in Shenzhen City Area.
1. Introduction
In modern urban development, ensuring ecological security and achieving harmony between humans and nature are critical challenges for urban planning. Maintaining healthy, orderly, and balanced regional ecosystems is essential for sustainable urban construction [1]. In Shenzhen City Area, rapid socioeconomic growth and urbanization have eroded ecological patches and intensified landscape fragmentation. Natural habitats are being divided by roads and built-up areas, reducing high-quality habitat space. This severely impedes species dispersal, gene flow, and ecological processes. These changes not only threaten local biodiversity but also weaken the city’s capacity to address environmental risks such as floods and heat island effects. The service capacity of natural landscapes has been significantly diminished [2,3]. Intensive land-use changes and construction activities have further degraded the ecological environment. Large areas of forest, grassland, and farmland have been converted to built-up land. Transport infrastructure fragments patches, accelerating habitat isolation [4]. Declining connectivity among landscape patches hinders species migration and contributes to environmental issues including heat islands, floods, smog, and water pollution [5]. Systematically developing ecological networks has become essential for restoring ecological functions and promoting regional coordination in Shenzhen. China’s ecological civilization philosophy emphasizes synergistic management of natural elements, proposing the “life community of mountains, waters, forests, farmlands, lakes, and grasslands” concept [6]. This approach integrates ecological conservation into urban and territorial spatial planning. Constructing ecological networks has been widely advocated to reconnect fragmented habitats [7]. Ecological networks help maintain urban ecosystem stability and sustainability. They facilitate energy flow and species migration between patches [8,9], enhance functional connectivity among habitats, and counter the long-term impacts of fragmentation. Ultimately, they serve as a vital pathway toward building a territorial spatial pattern that harmonizes human activities with nature.
Ecological networks serve as a structural skeleton within ecosystems. They are critical for maintaining ecosystem function and structural stability, providing essential conditions for ecological conservation, species dispersal, and reproduction [10]. As global biodiversity loss and ecosystem degradation intensify, ecological networks have become key scientific tools and management approaches. They address urban habitat fragmentation and obstructed species migration [11]. Theoretically, research on ecological networks has deepened the integration of landscape ecology and conservation biology. It has also spurred innovations in research methodologies [12]. Practically, the construction of ecological networks offers a scientific basis for ecological corridor planning and natural resource management. This significantly enhances the safeguarding of ecological security [13]. Globally, studies on ecological networks focus on energy flow, connectivity, soil conservation, cultural services, and sustainable development. These efforts improve habitat quality, promote functional interaction within regional spatial structures, and facilitate ecosystem recovery and health [14,15,16]. Recent advances emphasize structural optimization, security patterns, spatial planning, and ecological restoration. Such focus is refining ecological network research and providing clear guidance for territorial spatial planning [17,18,19]. Empirical studies often concentrate on various urban contexts: mountainous, arid, tourism-oriented, coastal, and central cities. These offer multi-level and multi-system practical insights for cities with diverse topographies and functions. Ecological network construction is undertaken at regional, urban, and sub-district scales. Research covers biodiversity, forests, nature reserves, water bodies, green spaces, and wetlands [20]. At macro-regional and urban-agglomeration scales, ecological networks guide ecological restoration and protection [21]. At medium-city scales, they support ecosystem planning strategies [22]. At micro-district scales, they promote sustainable development [23]. In terms of research methodology, the process of “ecological source identification—resistance surface construction—ecological corridor extraction” is regarded as a new paradigm for ecological network construction [24]. Ecological source identification primarily involves direct identification methods and comprehensive evaluation identification methods, which can identify potential ecological patches but struggle to precisely study the internal structure and spatial morphology of the study area [24]. Barrier surface construction heavily relies on land use type assignment and landscape pattern indices, both of which suffer from limitations such as subjectivity, data dependency, and insufficient spatial heterogeneity [25]. Ecological corridor extraction commonly employs minimum resistance models and graph theory methods [26]. Existing approaches generate only single optimal pathways, neglecting species’ multi-path diffusion behavior and failing to reflect the randomness and diversity of migration [27].
Based on the multi-dimensional perspectives and empirical evidence analyzed above, current research on ecological network construction still exhibits several significant limitations: First, there is a lack of comprehensiveness. Although existing studies cover various city types, they rarely include super-large cities with rapid economic growth like Shenzhen. This gap hinders the development of a systematic understanding at the national level. As a core part of Guangdong’s “One Core, One Belt, One Area” regional development strategy, Shenzhen faces intense resource and environmental constraints due to extreme urbanization. The city exhibits pronounced habitat fragmentation, insufficient ecological corridors, and an underdeveloped ecological network, leading to declining biodiversity, constrained sustainable development, and disruption of regional ecosystem equilibrium. It stands as a typical example of the ecological challenges confronting super-large cities in China. Second, identification is emphasized over optimization. Most studies focus on static analyses of ecological network structure, paying insufficient attention to active optimization strategies. Systematic design and effectiveness evaluation of measures such as repairing broken corridors, adding stepping-stone patches, and expanding ecological sources are often neglected. As a result, research outcomes are seldom integrated into practical territorial spatial planning. Third, evaluation methods are oversimplified. Assessments predominantly rely on structural indicators such as landscape pattern indices, while functional aspects of ecological networks—such as changes in landscape connectivity and current density—are rarely quantified or compared. This narrow approach limits comprehensive understanding of optimization outcomes. Fourth, approaches are poorly adapted to high-density cities. For super-large cities like Shenzhen, where built-up land predominates and ecological space is highly limited, there is still a lack of refined and operable methodologies for efficiently restoring ecological networks within tightly constrained spaces. Fifth, there are limitations to the methodology. Traditional approaches struggle to account for both the spatial structure of landscapes and the random diffusion processes of ecological flows, failing to adequately simulate the multi-path nature of species migration. This leads to biases in assessing ecological network connectivity. Morphological Spatial Pattern Analysis (MSPA) is a technique capable of decomposing landscapes across multiple scales. It effectively identifies seven key landscape elements—including core areas, bridging zones, and isolated patches—enabling precise extraction of source patches with high ecological value. Building upon the landscape pattern delineation by MSPA, circuit theory is integrated to simulate species’ random diffusion processes within the landscape. By analyzing current density, multiple potential migration corridors and critical pinch points are identified, overcoming the limitations of single-path analysis to more accurately reflect ecological functional connectivity.
Based on the various research methodologies and empirical cases discussed earlier, the approach integrating MSPA (Morphological Spatial Pattern Analysis) with circuit theory addresses shortcomings in existing methods for constructing ecological networks and identifying critical ecological corridors. It overcomes limitations of traditional methods in highly fragmented ecosystems, precisely revealing the key patterns and vulnerable links within Shenzhen’s ecological network. This enables multi-scale, comprehensive, and precise assessment of ecological connectivity, facilitating ecological network construction in intensively developed areas. Based on this framework, our study takes Shenzhen City as a research case. We applied Morphological Spatial Pattern Analysis (MSPA) to identify ecological sources and generated an ecological resistance surface. Using circuit theory, we extracted ecological corridors, pinch points, and barriers to construct an ecological network. The network was then optimized by adding ecological sources, corridors, stepping stones, and repairing breakpoints. Finally, the ecological network was evaluated both structurally and functionally before and after optimization. This research aims to offer new insights for spatial planning, ecological network construction, and enhanced ecological conservation functions in other cities.
2. Materials and Methods
2.1. Study Area
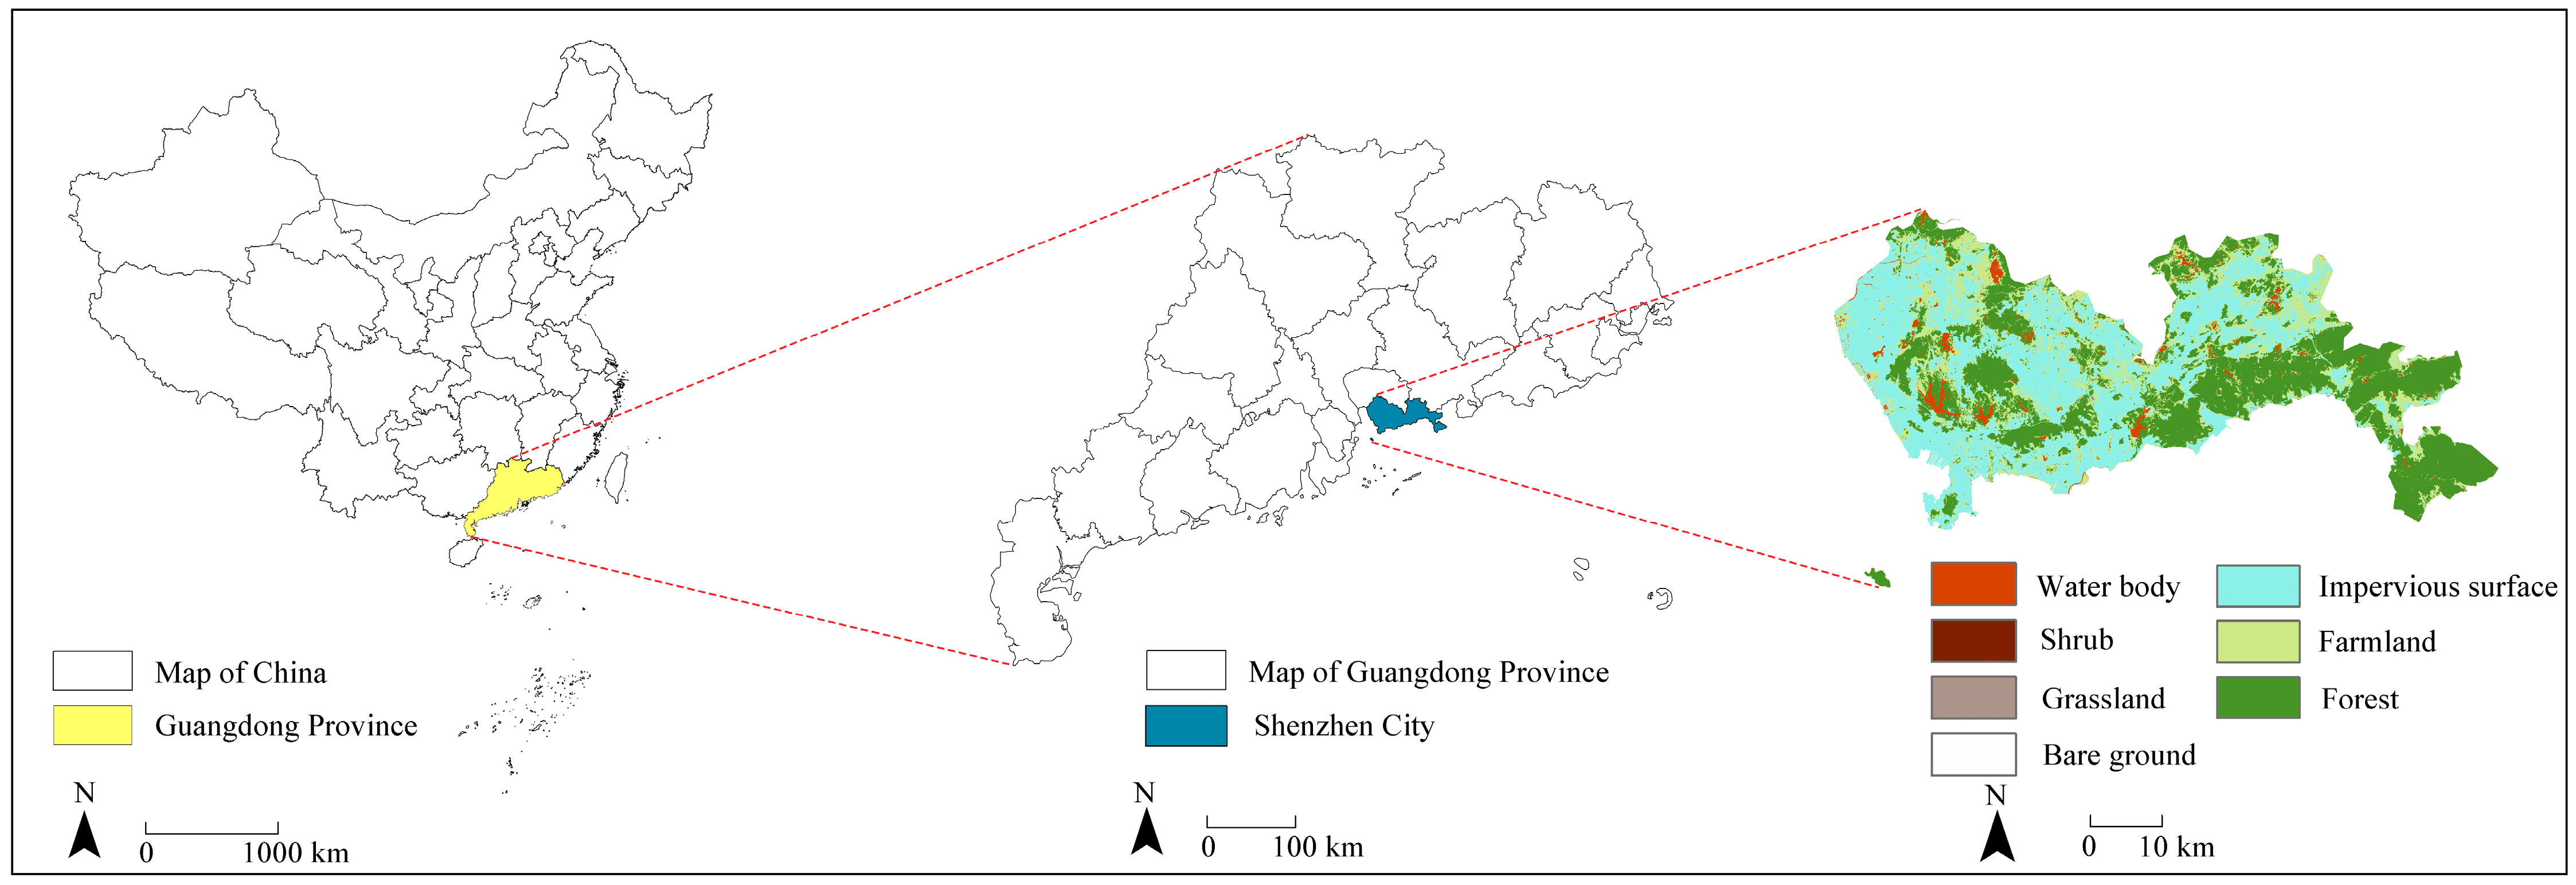
Shenzhen is a highly urbanized, super-large special economic zone in southern China’s coastal region (22°27′–22°52′ N, 113°46′–114°37′ E) (Figure 1). As one of China’s first special economic zones, it is recognized as a national innovative city and a modern marine city. Located on the eastern shore of the Pearl River Estuary, Shenzhen is closely connected to cities such as Hong Kong, Dongguan, and Huizhou, serving as a core area within the Guangdong–Hong Kong–Macao Greater Bay Area. The construction of an ecological network in Shenzhen is not only vital for the city’s own sustainable development but also critically important for the health and security of the regional macro-ecosystem. The integrity and connectivity of its ecological system directly influence the ecological security pattern of the entire Pearl River Delta region.
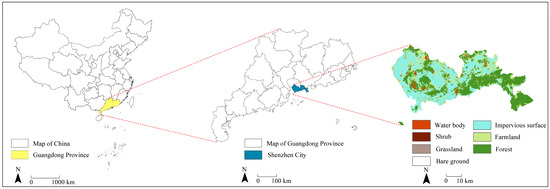
Figure 1.
Location and land use types in Shenzhen city.
Shenzhen is endowed with a unique and ecologically significant natural landscape, featuring diverse topography including hills, plains, and coastal wetlands. Within the city, there are 362 rivers with watershed areas exceeding 1 km2. It is also home to four nature reserves, nine forest parks, and ten wetland parks. The area is rich in biodiversity, hosting dozens of plant and animal species under national key protection. Moreover, Shenzhen serves as a critical node along the East Asian–Australasian Flyway for migratory birds. However, under rapid urbanization, ecological spaces in Shenzhen have been continuously encroached upon, leading to prominent habitat fragmentation. Natural habitats are dissected by roads and built-up areas, severely hindering species dispersal, genetic exchange, and ecological processes. This not only threatens local biodiversity but also weakens the city’s capacity to mitigate environmental risks such as floods and heat island effects. In this context, systematically advancing the construction of an ecological network has become an essential strategy for Shenzhen to restore ecological functions and promote regional coordinated development. By identifying and integrating key ecological patches, and establishing ecological corridors and stepping-stone systems, the ecological network effectively restores landscape connectivity, safeguards animal and plant migration and reproduction, and enhances ecosystem services. On a broader scale, the construction of ecological corridors in Shenzhen will help connect the eastern and western sides of the Pearl River Estuary and link the ecological barriers between Shenzhen, Dongguan, and Huizhou. It plays an irreplaceable strategic role in building a structurally complete and functionally sound ecological security network for the Greater Bay Area. This initiative not only meets urban residents’ demand for a high-quality ecological environment but also fulfills vital regional functions such as water conservation, climate regulation, and biodiversity maintenance. Therefore, promoting the development of Shenzhen’s ecological network is both a crucial pathway to alleviating conflicts between urban development and ecological conservation, and a core measure supporting high-quality development in the Guangdong–Hong Kong–Macao Greater Bay Area and achieving harmonious coexistence between humans and nature.
2.2. Data Sources
The types and sources of fundamental data used in this study are listed in Table 1. All spatial data were projected to the WGS_1984_UTM_Zone_50N coordinate system. Using ArcGIS 10.2 software, the data underwent preprocessing and geometric correction through radiometric calibration, clipping, and atmospheric correction. All raster data for Shenzhen were standardized to a uniform resolution of 30 m × 30 m, ensuring data quality and compatibility.

Table 1.
Data sources.
2.3. Methods
Currently, a new research paradigm has been established for the construction and optimization of ecological networks: “identification of ecological sources–construction of resistance surfaces–extraction of ecological corridors–identification of key areas” [28]. Ecological sources function as starting points for the outward diffusion of ecological flows. They are specific habitats crucial for promoting species movement, maintaining biodiversity, and enhancing regional ecological health and resilience [29]. The selection of ecological sources directly affects the overall stability of the ecological network. Most current studies use methods such as direct identification, ecosystem service assessment, and ecological sensitivity evaluation to identify ecological sources [30]. These approaches often directly extract nature reserves or areas of good ecological quality as ecological sources. However, they tend to overlook interactions between different ecosystem services or ecological elements, lacking a certain degree of objectivity [31]. In contrast, the Morphological Spatial Pattern Analysis (MSPA) model is based on graph theory principles. It operates on raster data to classify land cover types. This enables precise differentiation of land and landscape spatial structures. Morphological Spatial Pattern Analysis (MSPA) can identify key ecological habitats that significantly contribute to landscape connectivity within the study area [32,33]. The method offers greater compatibility, effectiveness, and scientific rigor in identifying ecological sources. It also improves the rationality of using the Minimum Cumulative Resistance (MCR) model in constructing ecological networks [34,35]. The ecological resistance surface is the most fundamental component of ecological network construction and serves as the prerequisite for extracting ecological corridors. Previous studies have often assigned resistance values directly based on land use types, followed by modifications using impervious surface indices and nighttime light data [36]. However, such approaches fail to account for spatial heterogeneity within the same land use category, as well as the influences of topography and human activities [37,38]. This study improves the objectivity, rationality, and accuracy of resistance surface setup by integrating multiple factors, including land use type, elevation, hydrographic features, soil conditions, and landscape pattern metrics. Ecological corridors act as bridges for the flow and exchange of organisms and energy between ecological sources. The interconnection of these corridors forms an ecological network, making them core elements of its structure. Currently, the Minimum Cumulative Resistance (MCR) model is the primary method for identifying ecological corridors [39,40]. However, the MCR model only predicts the general direction of movement corridors without delineating specific widths or identifying key nodes, resulting in limited functional attributes [41]. It also struggles to simulate the randomness of species movement and does not support further analysis of corridor width or ecological node identification [42,43]. Circuit theory integrates physical concepts such as current density and resistance values into ecological network construction. It conceptualizes the landscape as an electrical circuit, with the entire study area acting as a conductive surface [44]. Each grid cell is assigned a specific “resistance” to organism movement, and the migration or dispersal processes of species or ecological factors are simulated using randomly walking electrons [45]. Through iterative calculations of current input between corridors and sources, areas where current (representing biological flow) must pass through are identified as ecological “pinch points”. These nodes indicate locations with a very high probability of ecological flow and limited alternative pathways [46,47], making them critical for maintaining landscape connectivity. Areas that obstruct current movement between corridors are identified as ecological “barriers” [48]. These zones, which often exhibit high resistance values or contain blocking features, negatively affect corridor formation or maintenance. Their removal or improvement can enhance corridor connectivity and quality. A key advantage of circuit theory is its capacity to evaluate all possible pathways across the landscape. It not only identifies potential corridors but also locates key ecological nodes critical for certain ecological processes [49]. This provides detailed spatial information that addresses limitations of existing models in representing ecological exchange, thus offering a scientific basis for pinpointing ecological pinch points and barriers [50]. Circuit theory has been widely applied in studies of landscape connectivity, animal migration route identification, and ecological security pattern construction [51,52]. It provides clear guidance for ecosystem restoration and the optimization of ecological networks.
2.3.1. Ecological Source Identification Based on MSPA and Landscape Connectivity Assessment
Ecological sources form the foundation of ecological network construction. They are complexes composed of various natural ecosystems, including forest patches, wetland systems, water bodies, and large green spaces [53]. Dominated by woodlands, water areas, and wetlands, these zones provide habitats, breeding grounds, and migration corridors for species, serving as core carriers for biodiversity conservation [53]. Ecological sources such as forests and wetlands play a key role in carbon sequestration by fixing carbon dioxide through photosynthesis, while also mitigating the urban heat island effect [53]. Furthermore, they regulate the regional water cycle by intercepting precipitation and conserving water resources, functioning as critical starting and regulating points in aquatic ecological processes. As such, ecological sources represent comprehensive and central ecological spaces that integrate multiple ecosystem functions [54]. Morphological Spatial Pattern Analysis (MSPA) is a spatial pattern identification method based on image morphology theory. It uses mathematical morphological operations to segment the spatial structure of raster data, thereby classifying land use and generating landscape ecological patches at the pixel level [21]. This method accounts for the effects of landscape fragmentation, emphasizes structural connectivity, and enhances the objectivity of source area evaluation [29]. Using GuidosToolbox 3.0 software, forest and water bodies with the highest habitat quality were selected as the foreground. The landscape of Shenzhen was classified into seven types: Core, Islet, Loop, Bridge, Edge, Perforation, and Branch. Core areas contribute to enhancing habitat quality stability. Larger core areas exhibit higher connectivity, which facilitates energy transfer and species dispersal [55]. Landscape connectivity regulates the efficiency of material cycling and energy flow, playing a key role in biodiversity conservation [23]. Landscape connectivity indices enable a shift from qualitative research to quantitative management of conservation objectives, transitioning the focus from individual ecological patches to the optimization of entire networks. The quantitative results directly support the goals of ecological control line optimization, ecological corridor construction, and territorial planning, significantly improving the precision and effectiveness of urban ecological governance [36]. Based on this approach, this study identified ecological sources by quantifying ecological patch size and landscape connectivity, thereby supporting the construction and optimization of the ecological network.
In this study, the Morphological Spatial Pattern Analysis (MSPA) model was first applied to extract core area patches larger than 10 km2 as candidate ecological sources. Subsequently, Conefor Sensinode 2.6 software was used to develop landscape connectivity index (PC) and patch importance index (dPC) models for analyzing connectivity characteristics. These models facilitated the identification of ecological sources and the classification of their importance. The calculation formulas are as follows:
In the equation: n represents the total number of ecological patches; ai and aj are the areas of patches i and j, respectively; pij* is the maximum probability of migration between patches i and j; AL is the total area of all landscape types in Shenzhen; PC is the connectivity index of ecological patches, with higher PC values (0 ≤ PC ≤ 1) indicating higher landscape connectivity; dPC is the patch importance index, indicating the importance of existing ecological patches in maintaining landscape connectivity; PCremove is the landscape connectivity index after removing a specific ecological patch.
2.3.2. Ecological Resistance Surface Construction
During migration and dispersal, species must overcome certain resistance. By assigning resistance values for dispersal from ecological sources to other landscape units, the accessibility and connectivity of these sources can be evaluated [56]. Different landscape types and topographic features result in varying degrees of landscape resistance, which hinders species exchange and energy flow between sources. Frequent human activities also pose significant resistance to the expansion of ecological sources, as increased human presence further impedes species migration [57]. This study integrated factors such as land cover, topographic conditions, and ecological stressors, focusing on 10 types of resistance factors that effectively reflect terrestrial landscape characteristics and human activity intensity (Table 2). An ecological resistance surface was constructed by classifying each resistance factor into five levels, with higher values indicating greater resistance. These factors effectively characterize terrestrial habitat suitability and obstacles to species movement, providing critical support for identifying terrestrial ecosystem-based sources, corridors, pinch points, and barrier areas [58]. The entropy weight method and analytic hierarchy process (AHP) were employed to assign weights to the 10 resistance factors. Building on existing research, 25 domain experts were invited to score each factor based on its importance. Using AHP, a hierarchical indicator structure was constructed, and consistency checks were performed through pairwise comparisons to determine the subjective weights Wi. The original expert evaluation data were then normalized, and an entropy matrix was established for each resistance factor based on entropy calculation formulas to derive objective weights Wj. The entropy weight method offers an objective weighting approach that effectively minimizes errors caused by information overlap and redundancy among resistance factors. In contrast, AHP is straightforward to compute but relatively subjective. Therefore, this study integrated both methods by modifying the AHP results using the entropy weight method, resulting in comprehensive weights Wij (Table 2) that incorporate both expert knowledge and inherent data patterns. Finally, the raster calculation module in ArcGIS 10.2 was used to perform weighted overlay of all resistance factors, generating a comprehensive resistance surface for the study area. The calculation formula is as follows:

Table 2.
Classification and weight values of ecological resistance factors in Shenzhen.
In the equation: i and j represent the serial numbers of each resistance factor in Shenzhen City Area; m is the number of experts; Wi represents the subjective weight of the i-th resistance factor calculated through the Analytic Hierarchy Process (AHP); Wj represents the objective weight of the j-th resistance factor calculated through the entropy weight method; Wij represents the final comprehensive weight of the i-th (or j-th) resistance factor.
2.3.3. Extraction of Corridors, Pinch Points, and Barrier Points Based on Circuit Theory
The introduction of circuit theory into the calculation of biological migration corridors is primarily based on the following three theoretical foundations [44,45]:Firstly, the path randomness in biological migration processes resembles the random walk of electric charges in circuits. Secondly, different landscape types exert varying degrees of resistance to biological movement, analogous to electrical resistors in circuits, enabling the conceptualization of landscape types as resistance units. Thirdly, compared to traditional minimum resistance models, circuit theory more accurately reflects real ecological processes. It allows for the identification of optimal migration corridors and key pinch point areas by calculating paths of energy consumption. Based on these principles, this study applied circuit theory to extract core components in the construction of the ecological network.
- (1)
- Identification of Ecological Corridors
Ecological corridors facilitate cross-regional species exchange and dispersal from core habitats to peripheral areas by reducing migration resistance. They effectively mitigate predation risks and human-induced disturbances during species movement, serving as vital ecological passageways for biological migration [59]. In the process of gene flow, ecological corridors act as transmission media—a function reflecting their deeper value—directly influencing the genetic structure of populations and biodiversity. Simultaneously, they form a restorative network that enhances ecological resilience, strengthening an ecosystem’s capacity to resist, recover from, and adapt to disturbances [8]. As key pathways for material cycling, energy flow, and information transfer between ecological sources [41], ecological corridors can be equated to current pathways in circuit theory. Circuit theory, in turn, reflects the relative importance of corridors based on current intensity between sources, thereby predicting species dispersal and migration patterns and identifying movement routes [60]. To better simulate the randomness of biological migration and identify least-cost paths between ecological sources, this study applied the principles of circuit theory. Using the Linkage Mapper tool coupled with ecological sources and a comprehensive resistance surface, ecological corridors were extracted. Their importance was classified through quantification of flow centrality [61].
- (2)
- Identification of Ecological Pinch Points
Ecological pinch points refer to areas where ecological current is concentrated and of high intensity. Species experience lower resistance when moving through these regions, facilitating ecological flows between habitats [62]. In this study, the Pinch Point Mapper 3.0 tool in Linkage Mapper was used to quantify current between sources to identify key pathways and locations for species movement. Areas with high cumulative current values were identified as ecological pinch points [63]. These zones experience frequent ecological processes and have high irreplaceability for species passage, making them critical nodes in constructing ecological security patterns. They play a fundamental role in maintaining landscape connectivity [64].
- (3)
- Identification of Ecological Barriers
Ecological barriers refer to areas that significantly impede species migration between sources, hindering effective connectivity between habitats. Identifying and improving these barriers is crucial for enhancing the connectivity of ecological corridors [65]. Barriers with higher improvement scores indicate that their removal can more effectively reduce resistance to species movement. This study used the moving window method in the Barrier Mapper tool to identify regions with high resistance. Ecological barriers were derived based on current distribution patterns under a relative Least-Cost Path (LCD) improvement score mode, analyzed through resistance thresholds. The improvement in connectivity after barrier removal was characterized by the unit reduction in least-cost distance. Areas with larger improvement values were identified as ecological barriers within the corridors [4].
- (4)
- Current Density Model
In electrical circuits, the movement of charges exhibits random behavior. This randomness resembles the movement of organisms in nature [47]. Therefore, current density can effectively reflect the random walk characteristics of ecological flows and evaluate the state of ecological movement in a study area. Based on circuit theory, ecological sources are treated as current sources and the ecological resistance surface as a resistive surface. Regions with higher resistance hinder the movement of current [66]. In an ecological network, current density refers to the rate at which organisms migrate between ecological patches. Its value depends on the distribution of ecological resistance, the potential difference between ecological sources, and the connectivity of ecological corridors. The calculation formula is as follows:
In the formula: i and j represent ecological sources; Iij denotes the flow of ecological flow between adjacent ecological sources i and j, measured in amperes (A). A larger value indicates a higher current density passing through this connection point; Di represents the current density at ecological source i, measured in A/km2; Vi and Vj represent the electrical potentials of ecological sources i and j, respectively, measured in volts (V); Rij represents the movement resistance between ecological sources i and j, measured in ohms (Ω). A higher resistance value indicates greater movement costs for species.
3. Results
3.1. Identification of Ecological Sources in Shenzhen City Area
3.1.1. Landscape Pattern Analysis of Shenzhen City Area Based on MSPA
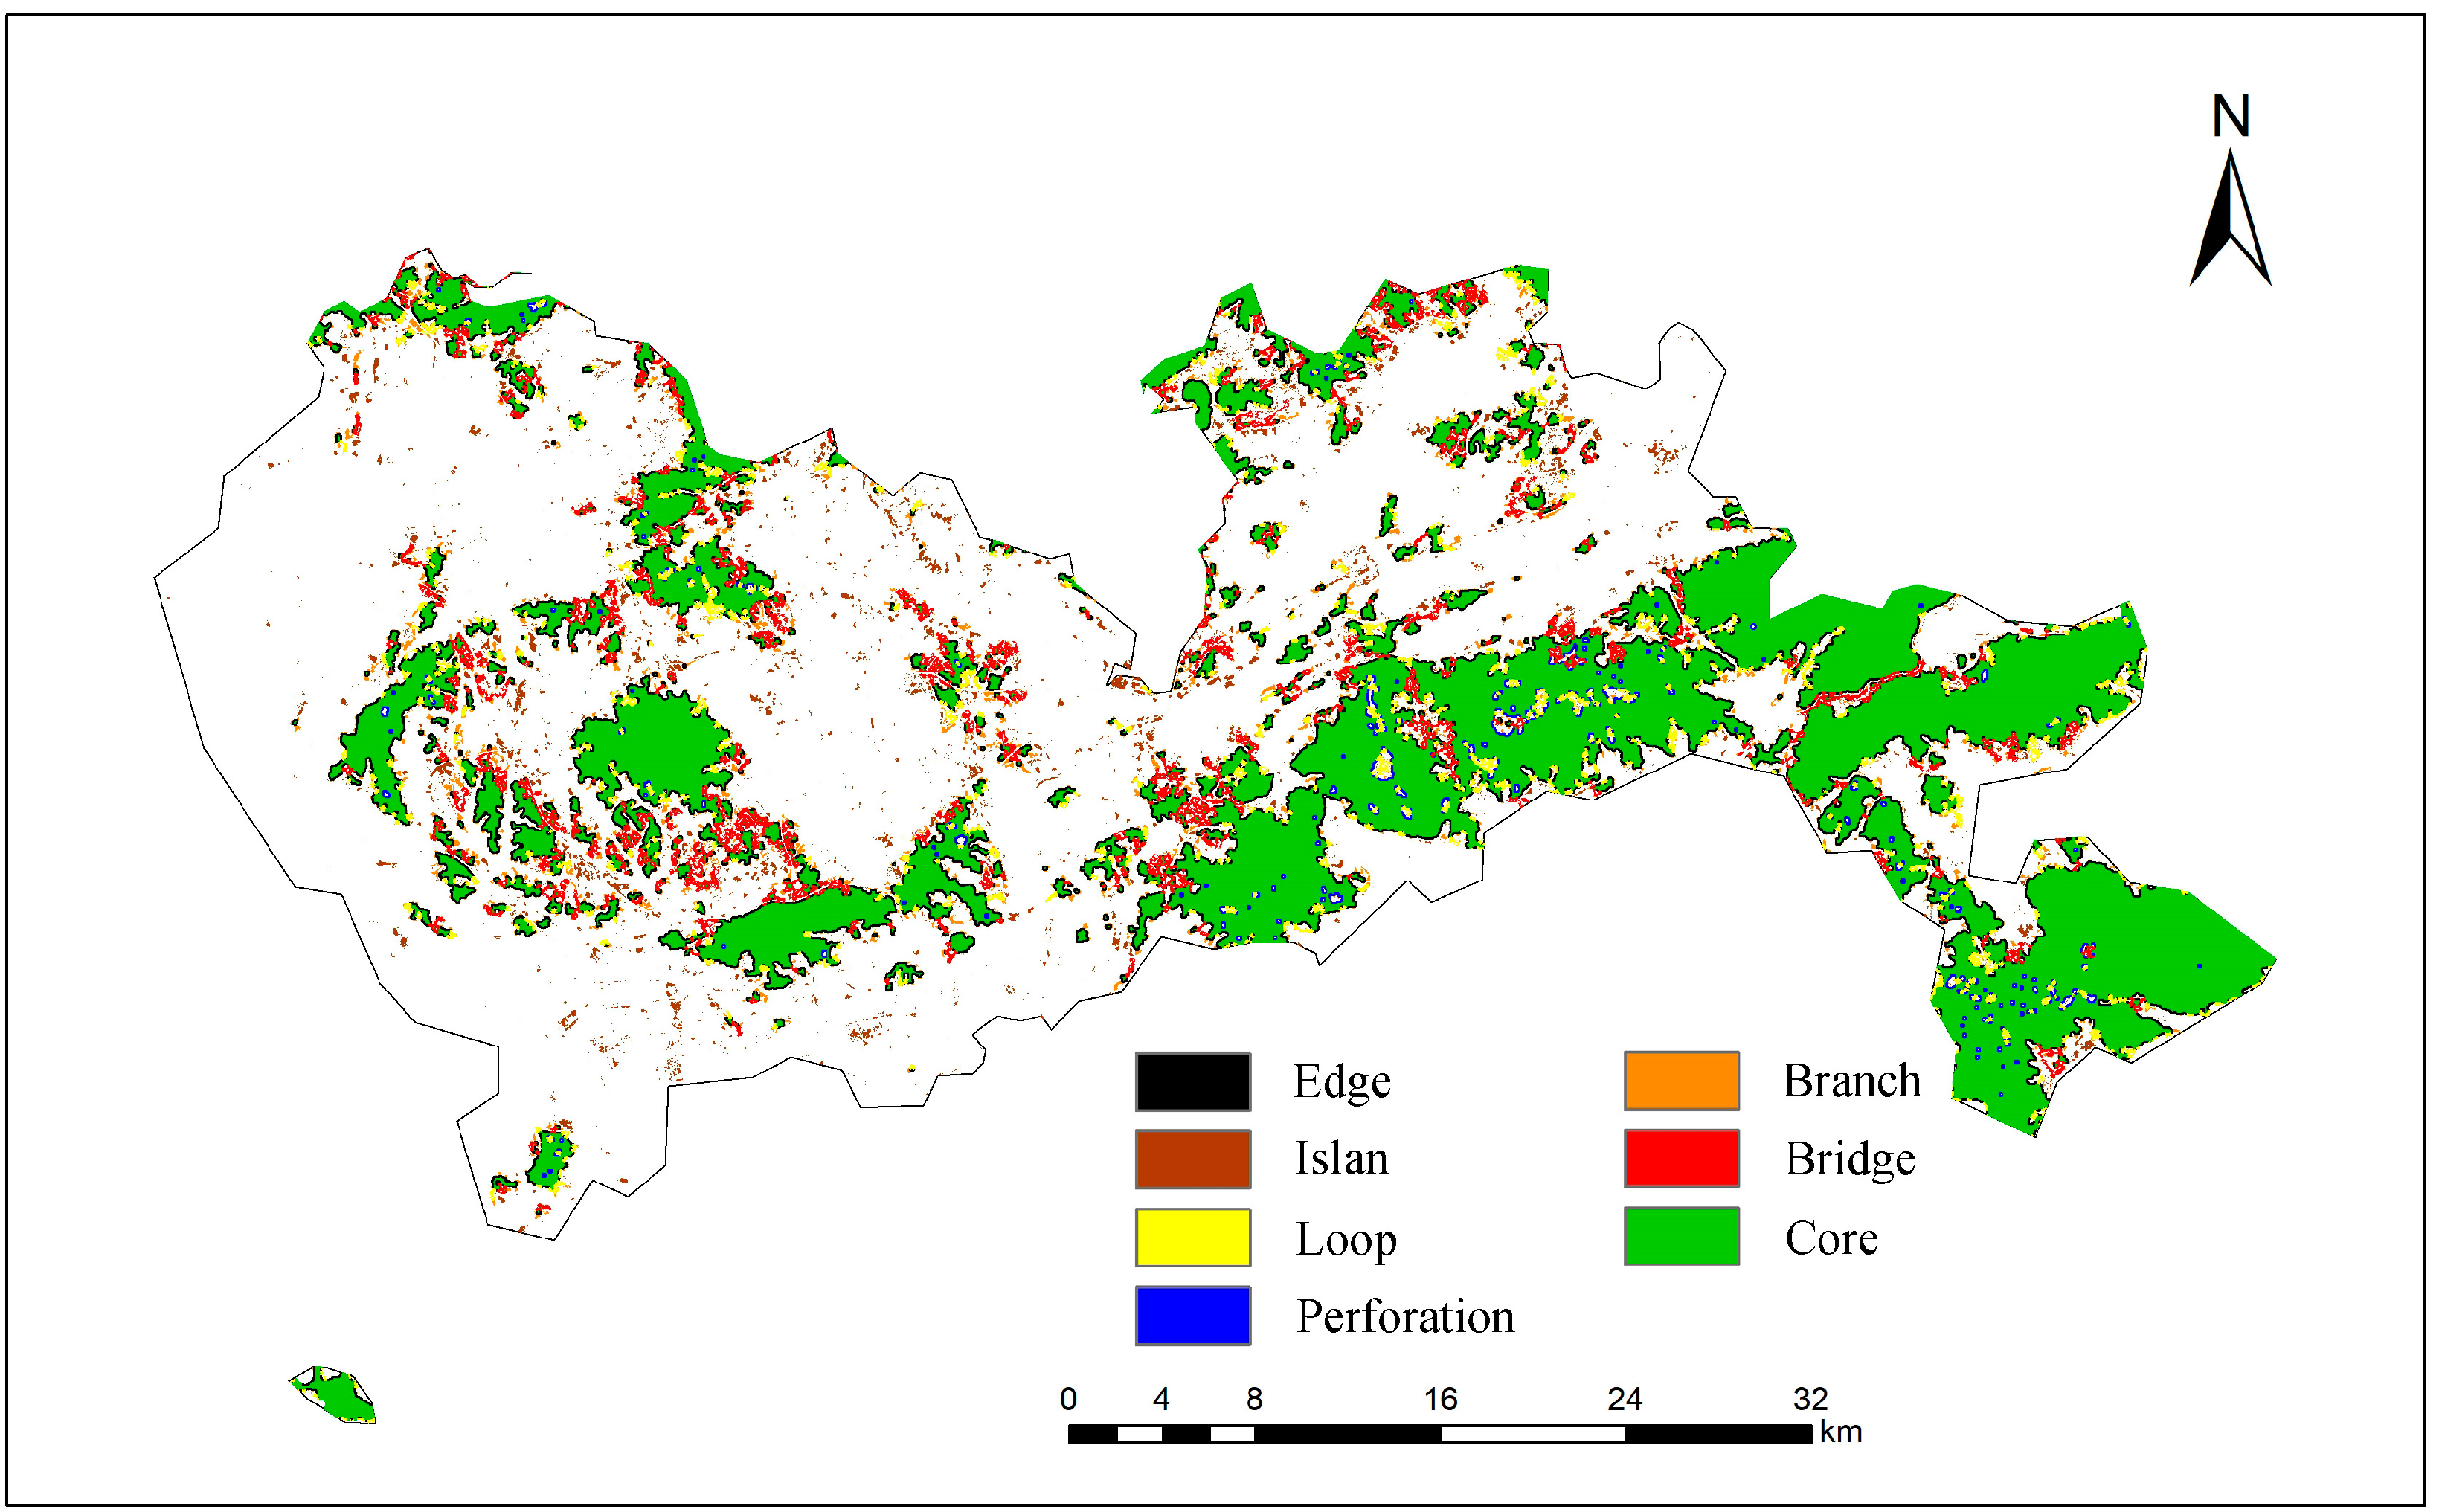
Woodland and water bodies in Shenzhen were selected as the foreground. Morphological Spatial Pattern Analysis (MSPA) was applied to analyze their land use types. The resulting landscape pattern classification is shown in Figure 2 and Table 3. The core areas account for 21.99% of the total study area, representing the largest proportion among all landscape types. These areas exhibit high stability and constitute 60.70% of the foreground area. They are primarily concentrated in the scenic zones, forest parks, and geoparks of mountainous regions such as Wutong Mountain, Maluan Mountain, Paiya Mountain, and Qiniang Mountain in the southeastern part of the city, forming large contiguous patches. In contrast, the northwestern and central regions show sparse distribution of core areas, with high fragmentation and poor connectivity. Islets account for 1.43% of the total area. These small, scattered patches can serve as potential stepping stones in future planning to facilitate the movement of ecological elements. Loop areas, which significantly contribute to ecological flows within the core areas, make up 2.10% of the total area. Bridge areas, representing structural corridors in the landscape ecological security pattern, promote connectivity between ecological patches. However, they cover only 3.37% of the total area, providing limited pathways for energy exchange and material flow. Edge areas act as buffers between woodland and other landscape types and are mainly distributed along the periphery of core areas. These zones exhibit certain marginal characteristics and cover 4.94% of the total area, making them the second most extensive category after core areas. Perforations account for 0.57% of the total area, indicating relatively weak edge effects within the woodland patches of the study area, which lack stability and are susceptible to external disturbances. Branches cover 1.49% of the total area, reflecting moderate overall connectivity within Shenzhen.
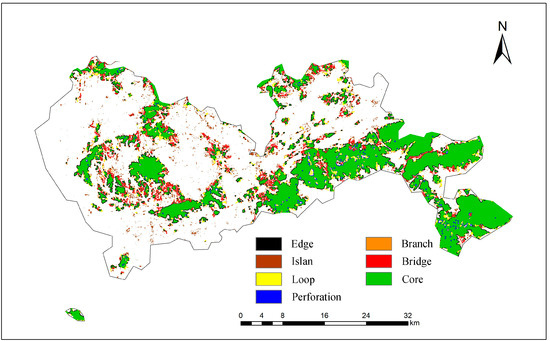
Figure 2.
Landscape pattern analysis of Shenzhen based on MSPA.

Table 3.
Landscape Types and Proportions in Shenzhen.
3.1.2. Identification of Ecological Sources in Shenzhen City Area
In the process of identifying ecological sources, the selection of ecological patch size and aggregation threshold directly influences the rationality of the ecological network structure and its capacity to represent ecological functions [35]. Ecological patch size determines the intensity of ecological functions, species carrying capacity, and regional stability. It supports planning objectives such as maintaining species diversity, ensuring long-term population survival, enhancing ecosystem service supply, and strengthening ecosystem resilience [21]. This study selected ecological patches with core areas larger than 10 km2 and used an aggregation threshold of 1000 m as criteria for defining ecological sources. A core area of 10 km2 is considered a critical size that can support continuous species reproduction and life-cycle processes. Research shows that the minimum habitat area required to sustain populations of most medium-to-large mammals and birds ranges between 5–20 km2. If the patch size threshold is too small, it may include small ecological patches such as community parks, leading to excessive fragmentation of ecological sources, increased management costs, and reduced functional stability. Conversely, an excessively large threshold may overlook key ecological nodes such as small wetland clusters, thereby weakening the integrity of the ecological network. In Shenzhen’s delineation of the basic ecological control line, woodlands account for more than 50% of the area. A patch size of 10 km2 aligns with the typical area of municipal-level nature reserves and forest parks, facilitating the implementation of ecological conservation policies. Thus, setting the threshold at 10 km2 ensures that ecological sources possess sufficient ecological carrying capacity and internal habitat stability. An aggregation threshold of 1000 m can meet the corridor requirements of most mammals and ensure effective ecological connectivity between aggregated patches. If the aggregation threshold is too small, the number of aggregated patches may increase, but connectivity may decrease. If the threshold is too large, it may lead to over-consolidation of patches, obscuring local ecological heterogeneity. A 1000 m aggregation threshold can integrate dispersed small ecological patches such as woodlands and water bodies in Shenzhen into larger ecological sources, reducing “islandization” effects. This approach maintains the independence of ecological patches while avoiding the loss of ecological functional heterogeneity due to excessive merging [67].
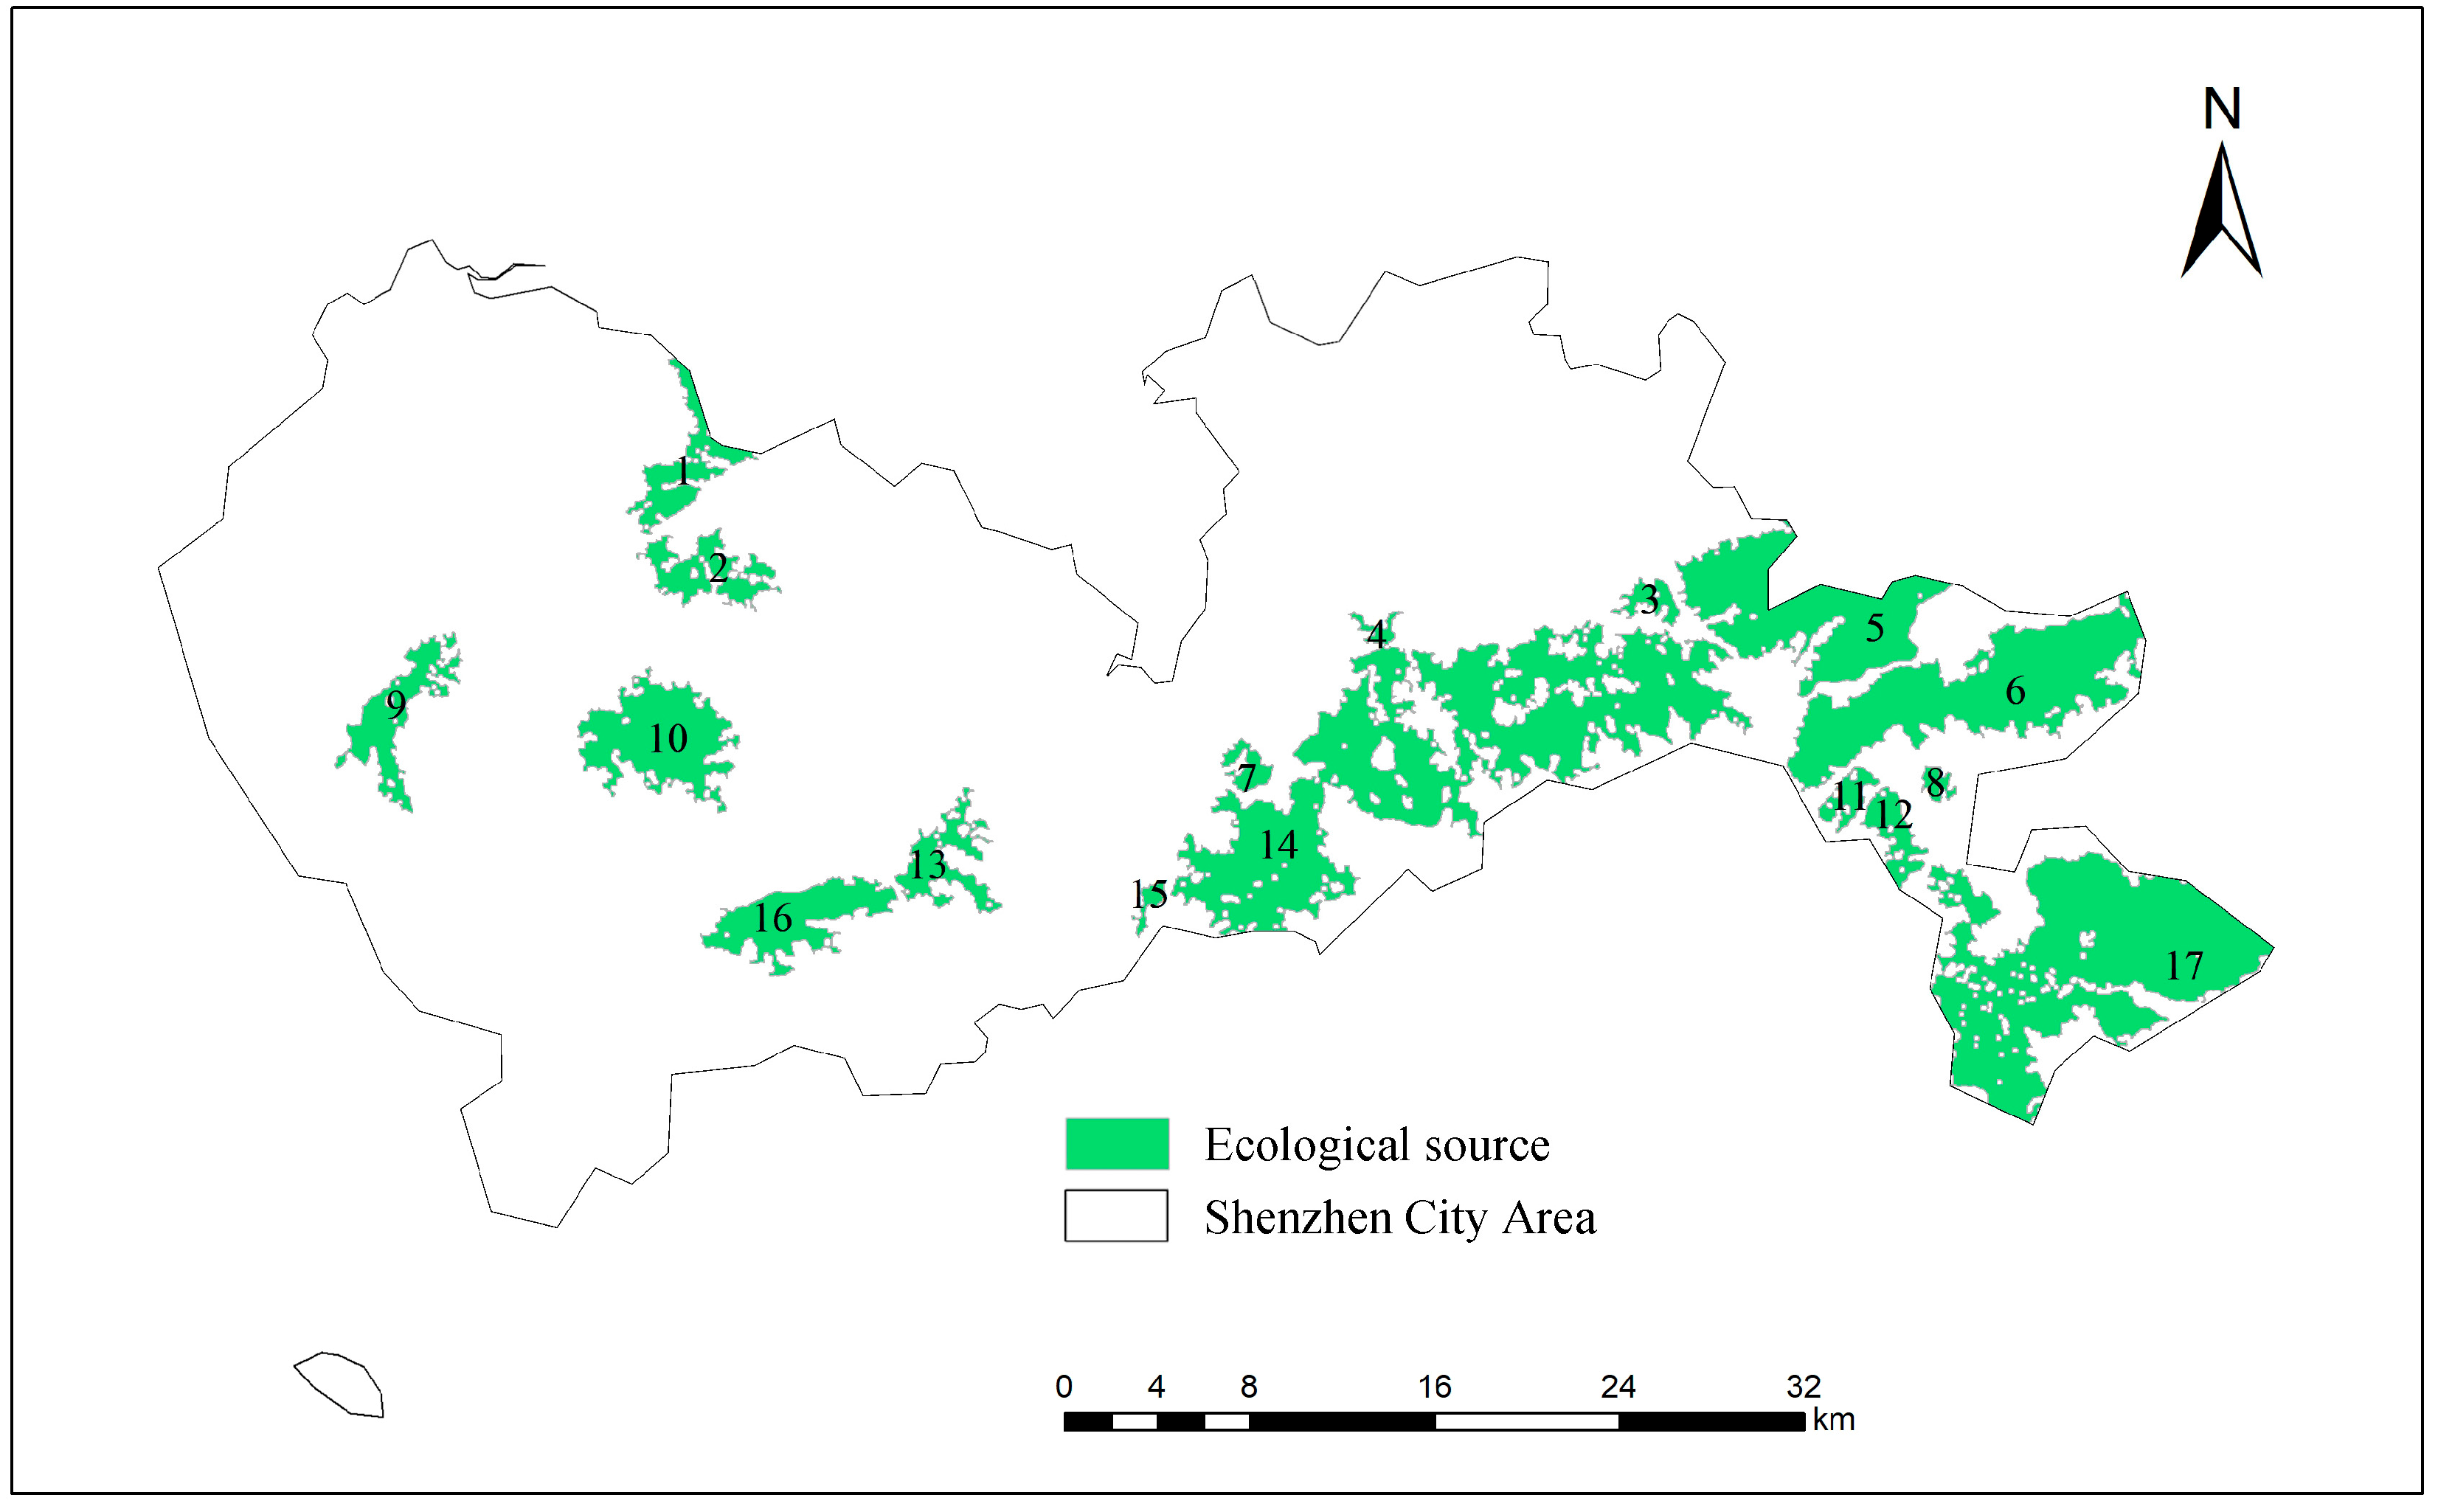
Therefore, to avoid excessive fragmentation in the distribution of extracted ecological sources, this study selected ecological patches with a core area greater than 10 km2 and a dPC value > 0.1. These patches were aggregated using a 1000 m threshold, resulting in the identification of 17 ecological sources (Figure 3). Spatially, the ecological sources in Shenzhen show a clustered distribution in the eastern region and a scattered pattern in the west. Eastern sources are predominantly located within national geoparks, coastal tourism zones, Guanyin Mountain Park, country parks, reservoirs, and wetland parks. The distribution of ecological sources indicates that the continuous ecological barrier formed by Wutong Mountain, Maluan Mountain, Paiya Mountain, and Qiniang Mountain in Shenzhen serves important functions such as soil and water conservation, water retention, and biodiversity maintenance. Meanwhile, independent mountainous areas including Longyan Mountain, Meilin Mountain, Fenghuang Mountain, Guangming Forest Park, and Ejing Reservoir, along with various nature reserves, play significant roles as essential ecological patches.
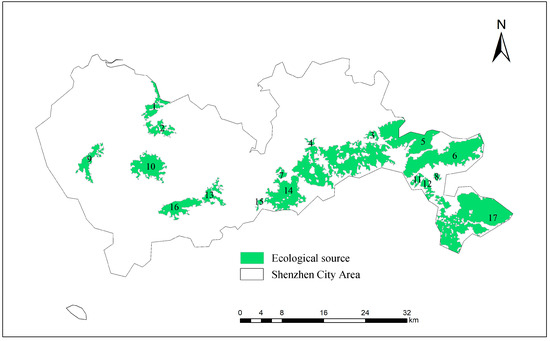
Figure 3.
Distribution of ecological sources in Shenzhen.
3.1.3. Classification of the Importance of Ecological Sources in Shenzhen City Area
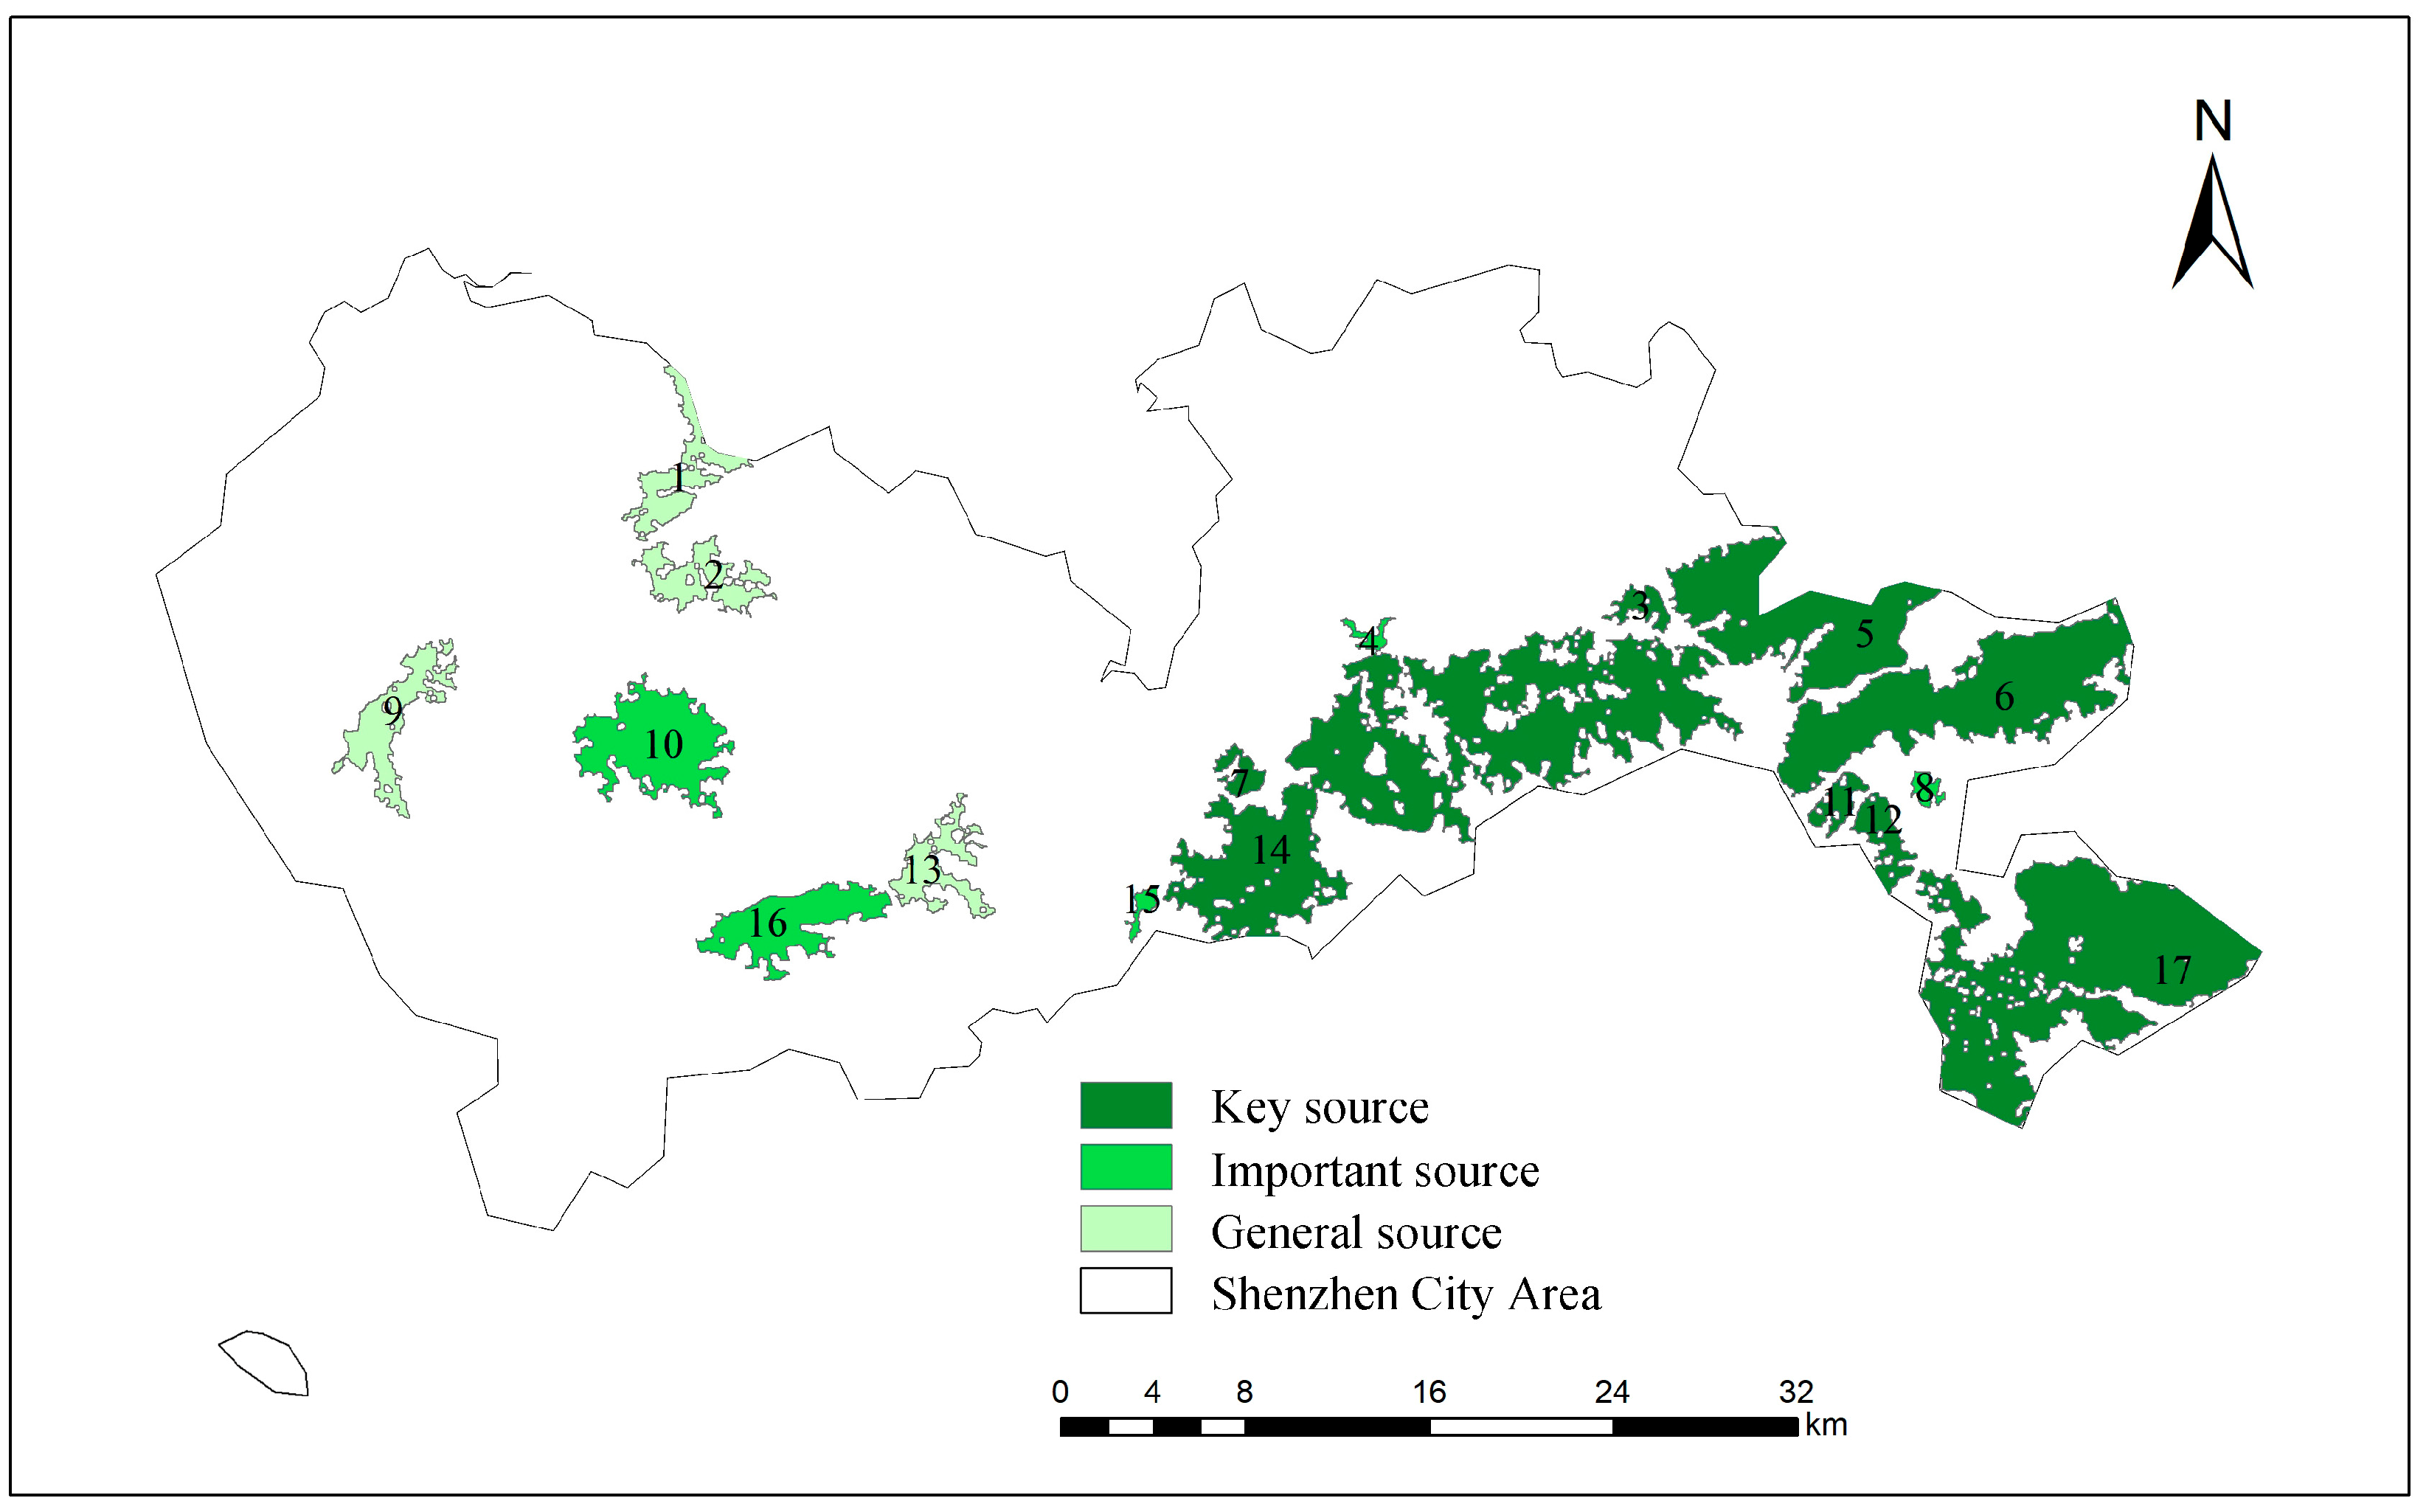
Shenzhen City contains a total of 17 ecological sources, covering a combined area of 352.50 km2. Based on the landscape connectivity index (dPC), these ecological sources were classified into three categories: key sources (dPC > 1), important sources (1 > dPC > 0.5), and general sources (0.1 < dPC < 0.5). As shown in Figure 4 and Table 4, key ecological sources are the most numerous, with a total area of 277.48 km2, accounting for 78.72% of the total ecological source area—significantly larger than the other two types. These are mainly concentrated in the southeastern part of Shenzhen, where ecosystem services are prominent, and human disturbance is relatively low. This region is dominated by large forested areas and includes ecologically significant zones such as wetland parks, country parks, reservoirs, and geoparks. Patch 17 has the highest dPC value of 59.41 and an area of 78.81 km2. Located south of Hutou Mountain, it contains numerous suitable habitats such as Dapeng Peninsula National Geopark, Fenglang Mountain Park, New Century Seaview Country Park, and Xiangche Reservoir. Patch 14 has the second highest dPC value of 56.24 and the largest area among all patches—102.90 km2. Situated in the south-central part of Shenzhen, it includes protected areas such as Maluan Country Park, Chi’ao Reservoir, Sanzhoutian Forest Park, and Wutong Mountain Forest Park. Patch 6 has a dPC value of 41.98 and is primarily located around Ling’ao Reservoir and surrounding mountains. Patch 5, with a dPC value of 36.15, is located in Longgang District and encompasses resource-rich areas including Luowuwei Reservoir and Jingxin Reservoir. Patch 7 is situated in Pingshan District and contains protected areas such as Songzikeng Forest Park. Patches 11 and 12 are located in Longgang District and include Guanyin Mountain Park, Ecological Garden, Maque Mountain, and adjacent mountain ranges. Patch 3, located in Pingshan District, contains protected areas such as Chi’ao Reservoir. There are 5 important ecological sources, with dPC values between 0.5 and 1. These are mainly distributed in the western and southwestern parts of Shenzhen and are relatively small in area. The 4 general ecological sources all have dPC values between 0.1 and 0.5. Most are located in the western and northwestern fringes of the city, with large intervals between them, contributing minimally to the overall connectivity of Shenzhen.
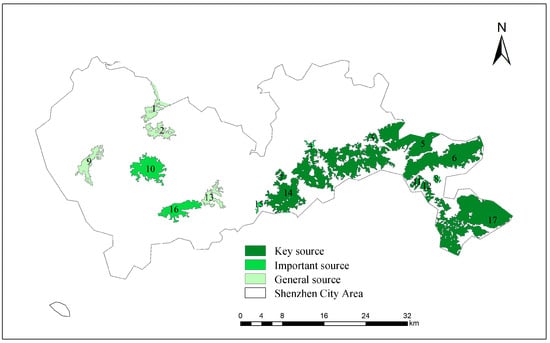
Figure 4.
Distribution of the importance of ecological sources in Shenzhen.

Table 4.
Classification of the importance of ecological sources in Shenzhen.
3.2. Extraction of Ecological Corridors in Shenzhen City Area
3.2.1. Construction of Ecological Resistance Surface in Shenzhen City Area
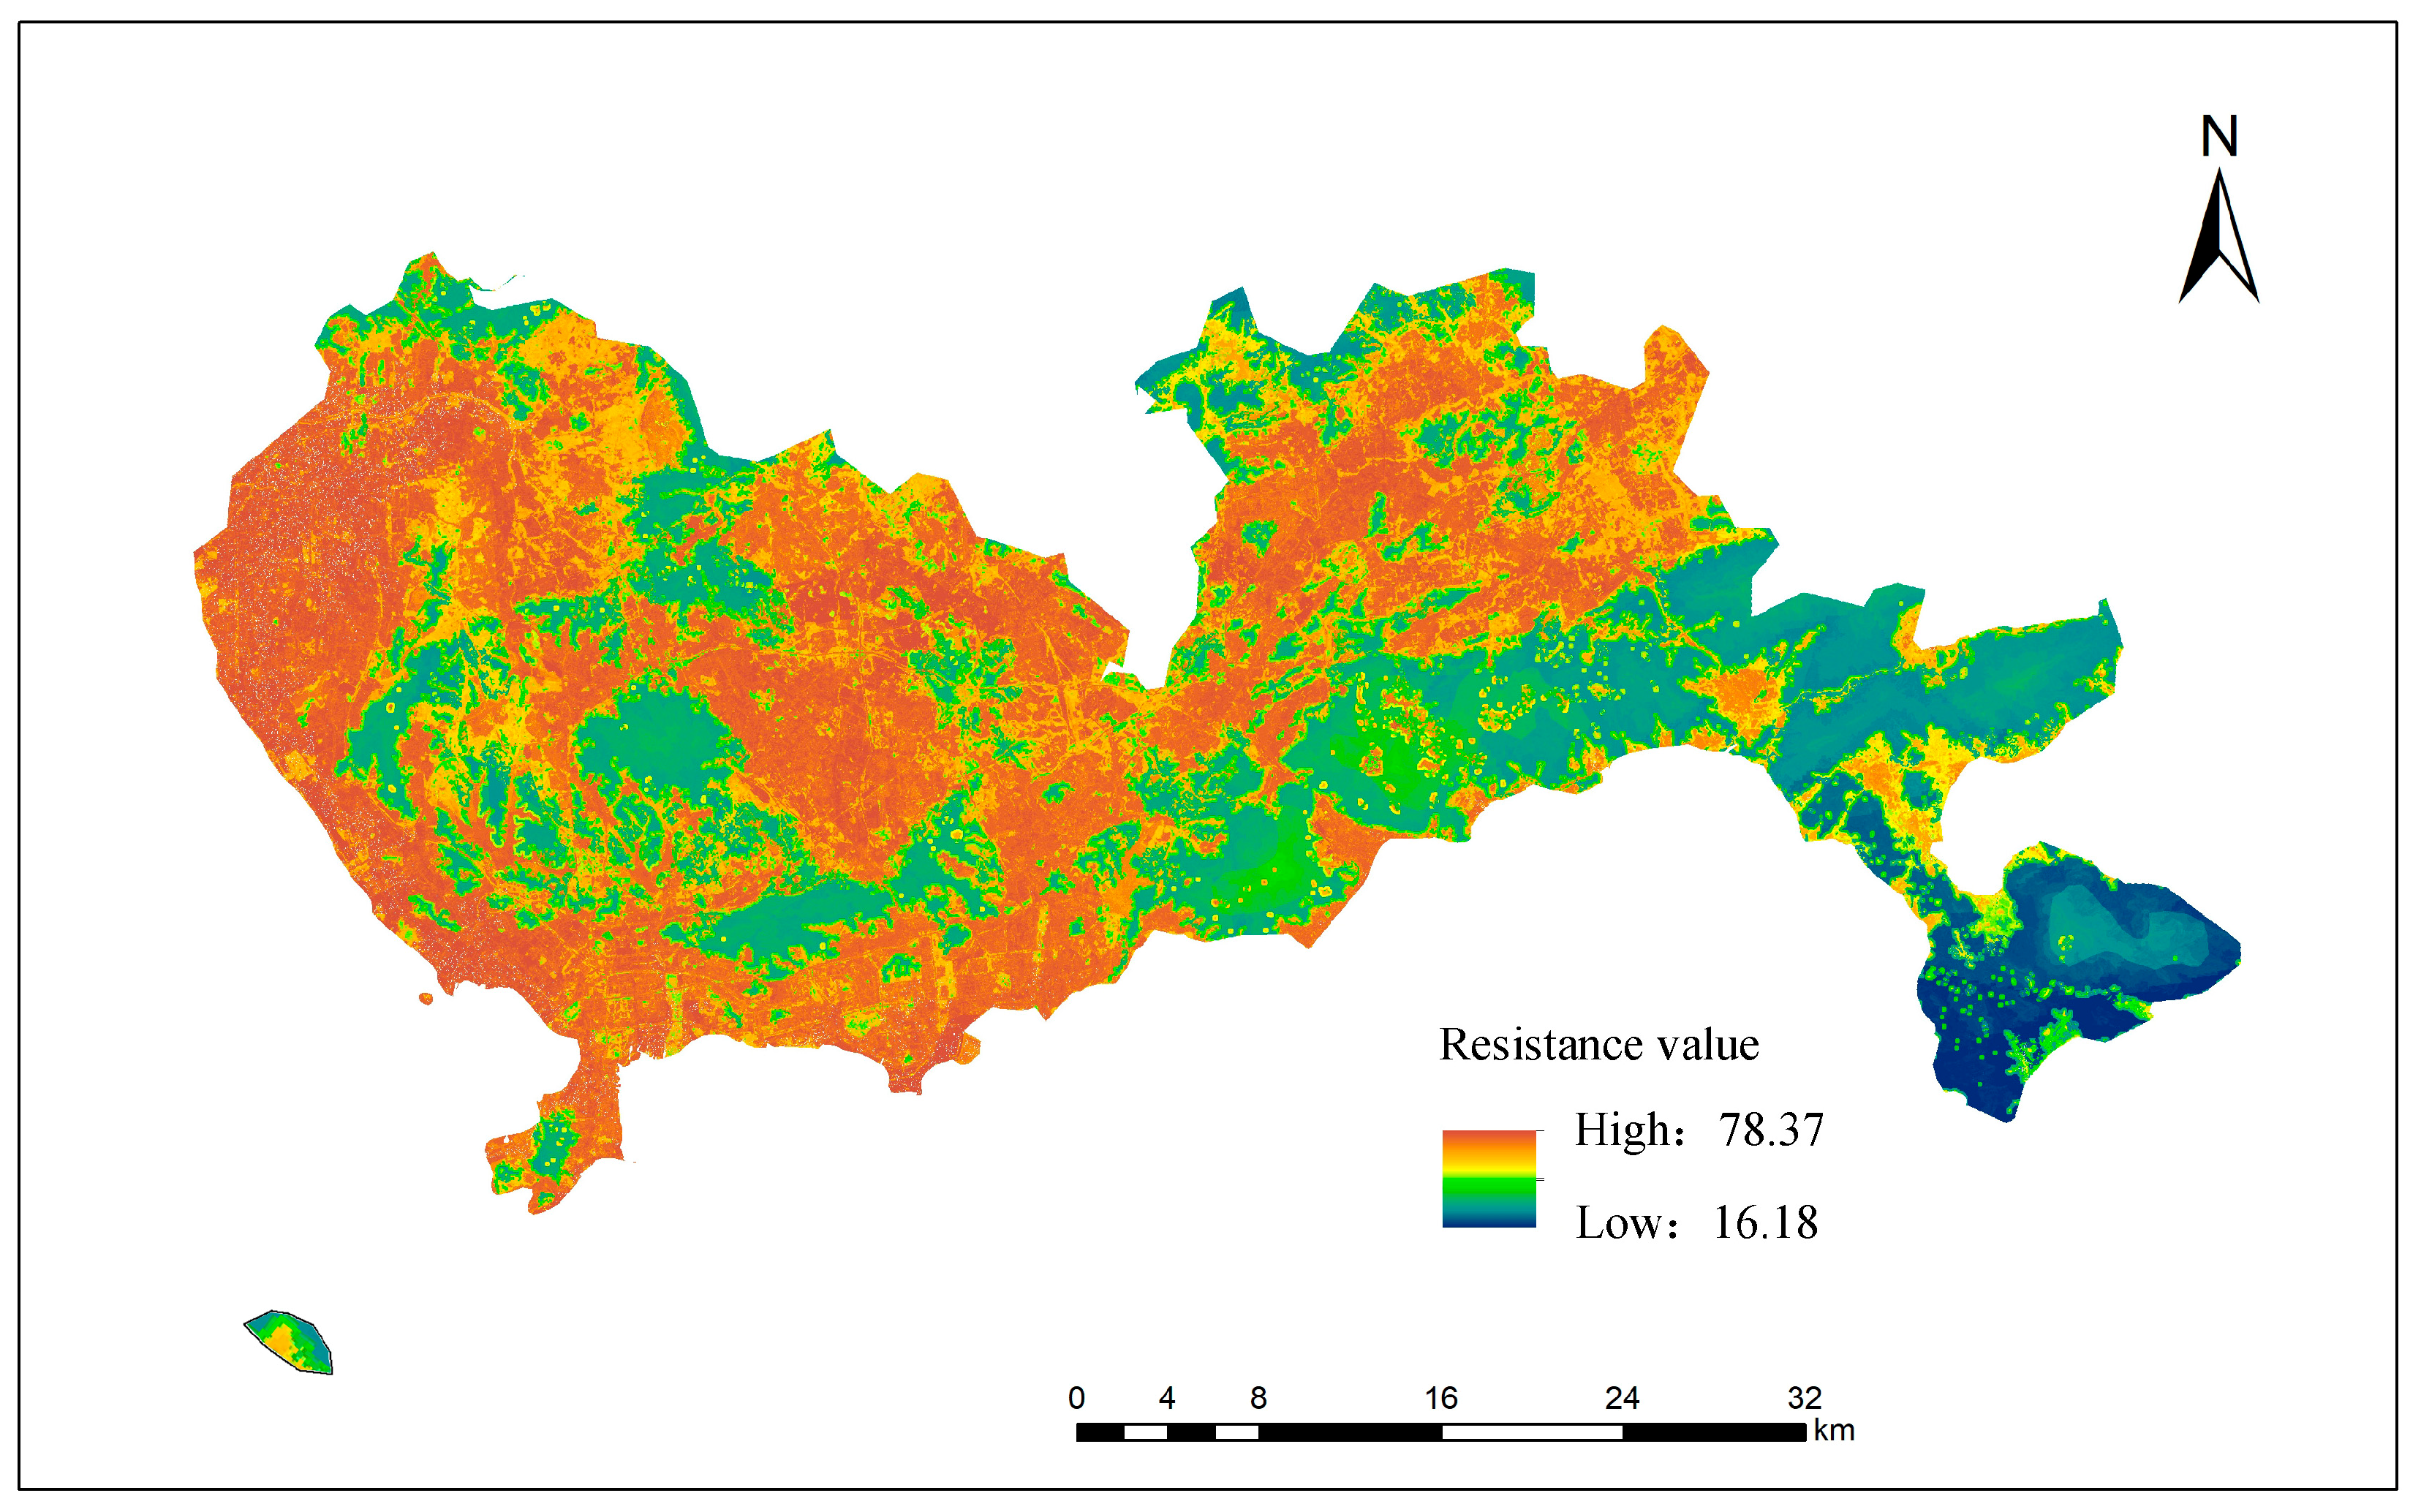
The ecological resistance surface serves as the basis for calculating species dispersal paths under resistance constraints. Different natural ecological backgrounds and human activities exert varying degrees of influence on the flow of materials, energy, and information. In this study, based on various resistance evaluation factors and their weights, ten resistance factor layers were established in ArcGIS 10.2, including elevation, slope, vegetation, distance to rivers, soil type, land use, distance to railways, distance to highways, distance to major urban roads, and landscape type. Using the Raster Calculator, weighted summation was performed on these resistance factors to generate an ecological resistance surface (Figure 5) that aligns with the unique ecological characteristics of the study area. In Shenzhen, the ecological resistance values range from 16.18 to 78.37, showing significant regional variation. High resistance values are observed in the northwest, southwest, northeast, and central regions. These areas are predominantly urban built-up land, located near city centers and transportation routes, with frequent human activities and high disturbance levels. They exhibit fragmented and scattered patterns, resulting in severe ecological fragmentation, which hinders species migration and material flow, leading to poor regional connectivity. In contrast, low resistance values are found in the eastern and southeastern parts of Shenzhen. These regions feature higher elevations, steeper slopes, and are primarily covered by woodlands. With minimal human impact and favorable habitat conditions, they demonstrate high connectivity and low resistance to species movement.
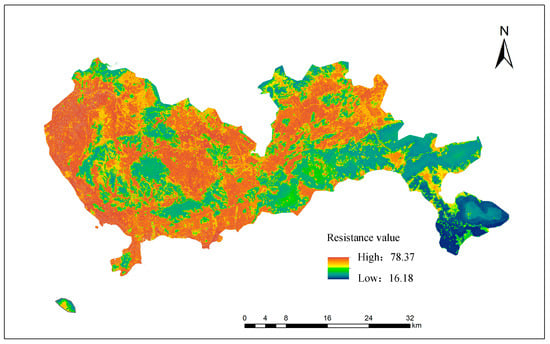
Figure 5.
Ecological resistance surface in Shenzhen.
3.2.2. Extraction of Ecological Corridors in Shenzhen City Area
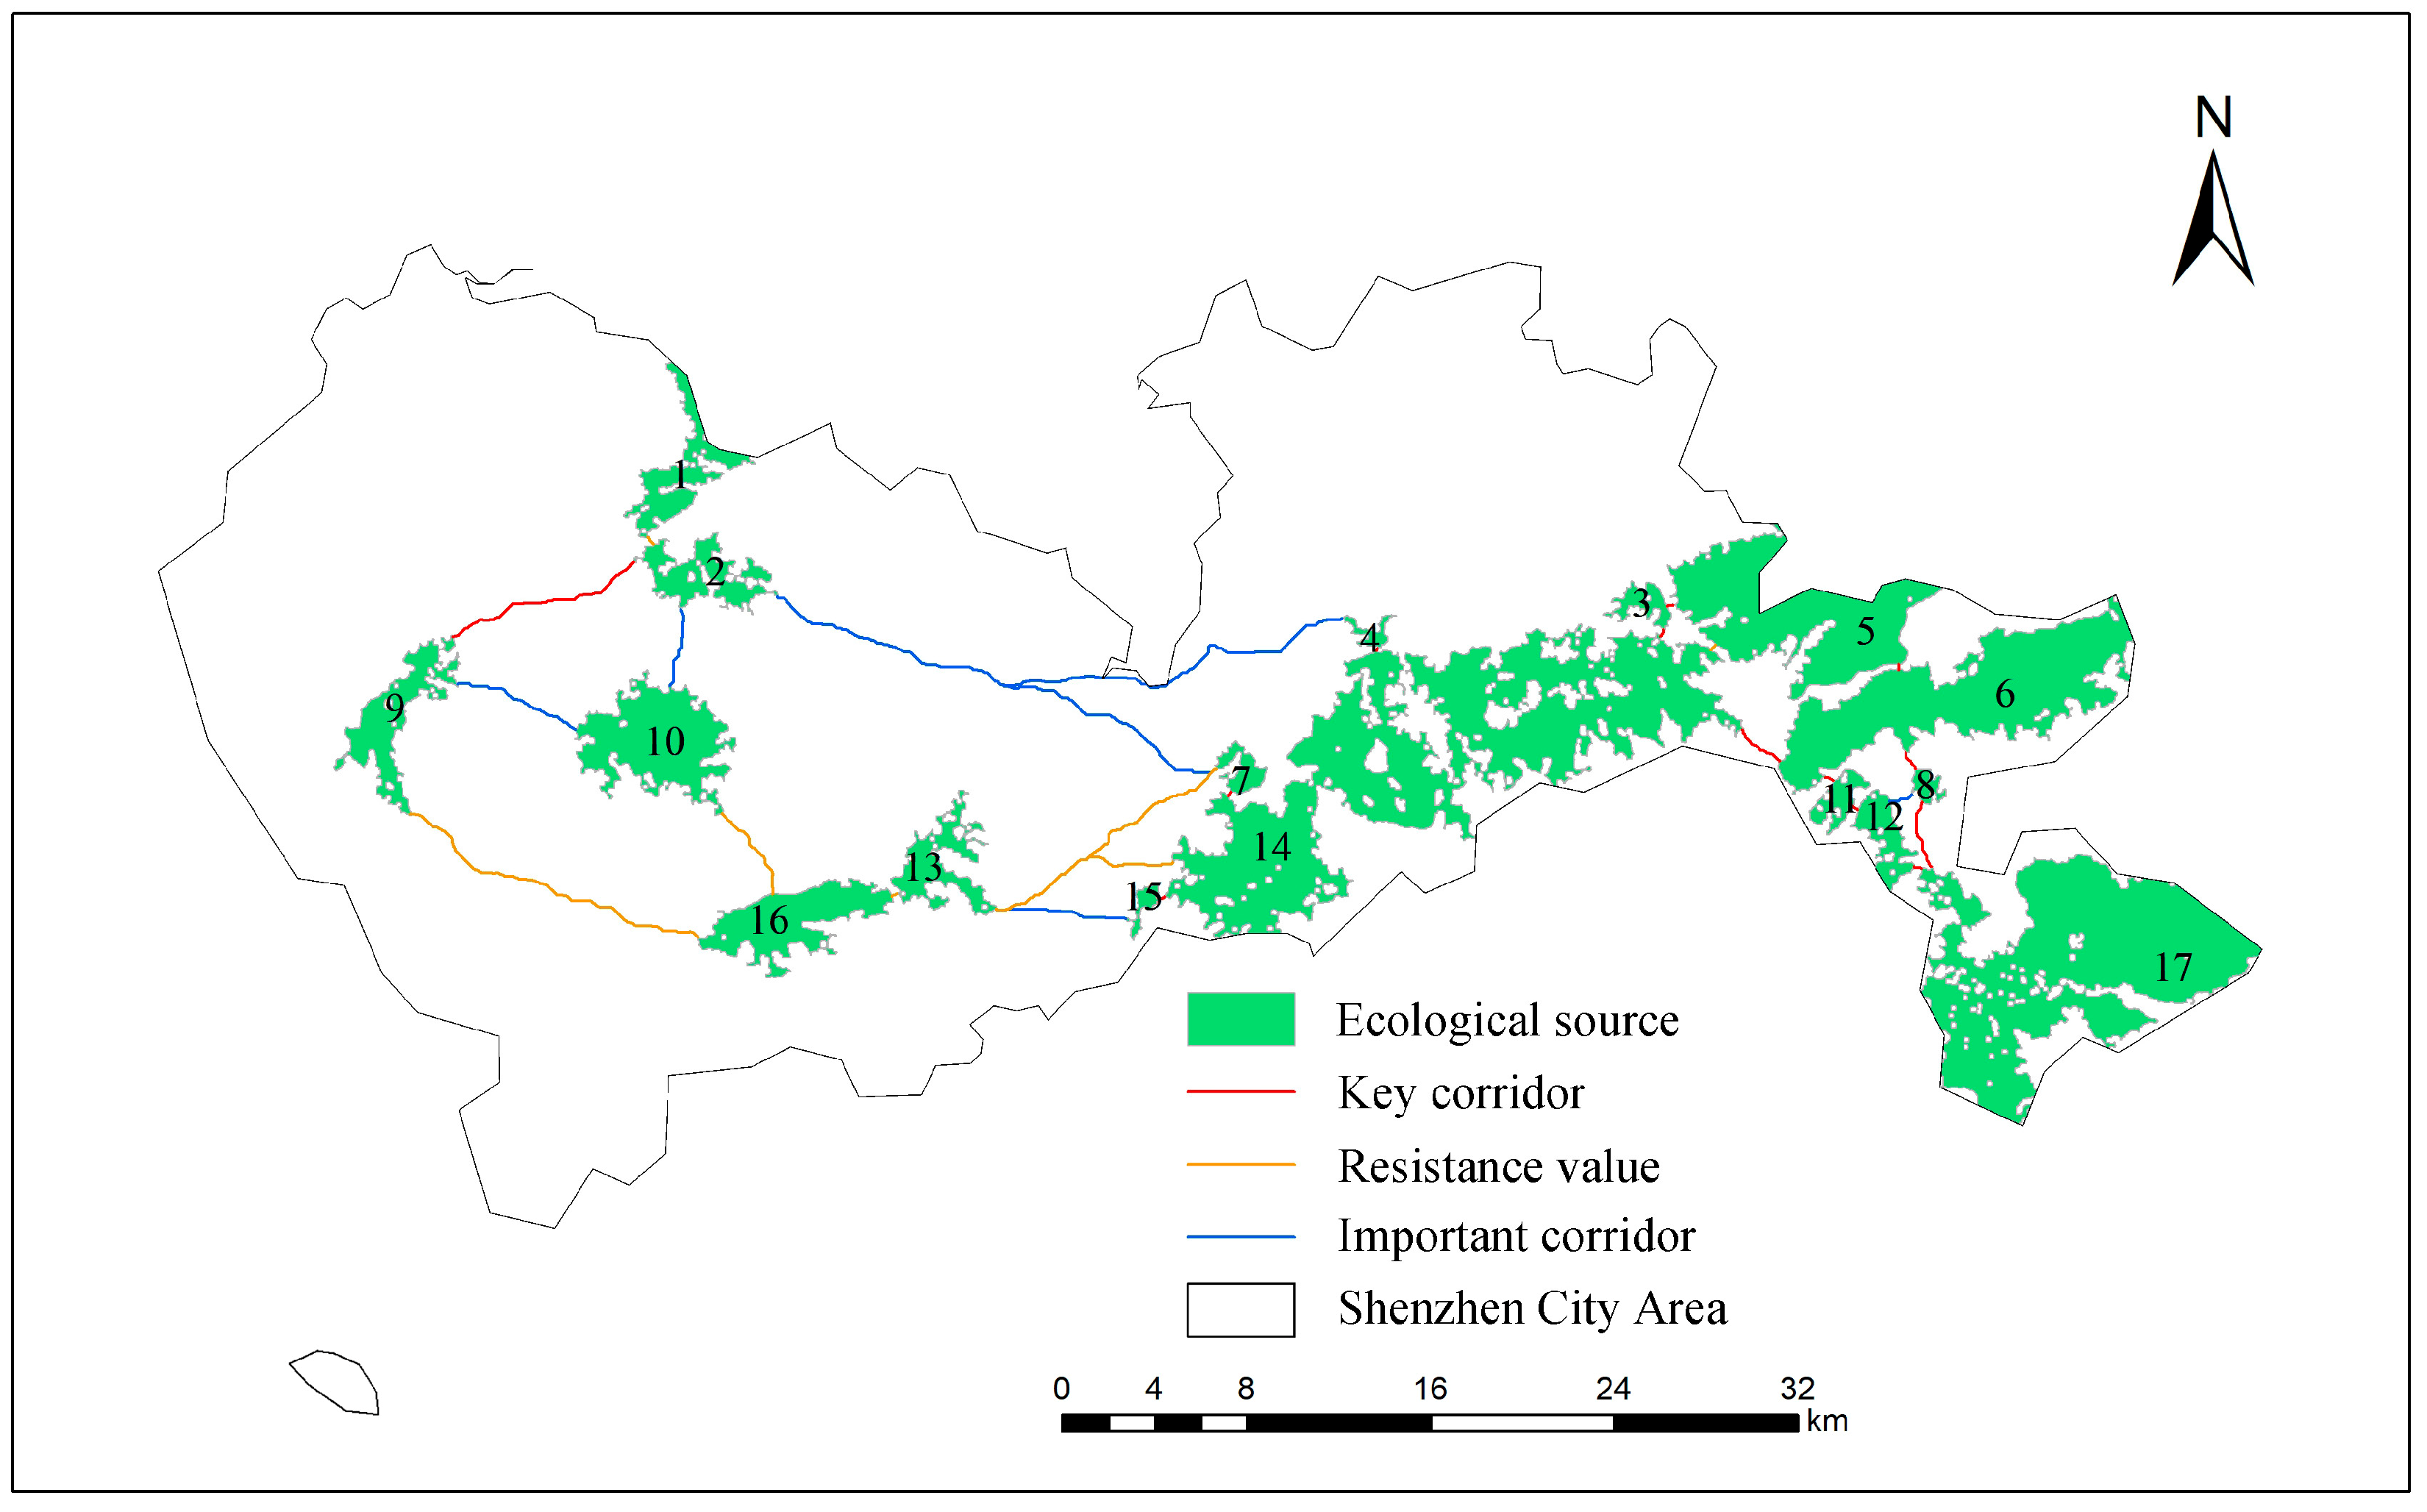
Based on circuit theory, ecological sources and the ecological resistance surface were input into the Linkage Mapper tool, identifying a total of 26 ecological corridors forming an interconnected network with a total length of 127.44 km. Corridors shorter than 5 km account for 69.23% of the total, indicating relatively poor overall connectivity and high landscape fragmentation (Figure 6). In general, short-distance corridors are mainly located in the southeastern part of the study area, connecting large and densely distributed ecological sources. Long-distance corridors link ecological sources in the western and eastern regions of Shenzhen, while also connecting scattered and isolated sources in the west, thereby enhancing landscape connectivity in these areas. The current intensity values of the corridors range from 2.35 to 8.29. Using the quantile method, the corridors were classified into key corridors, important corridors, and general corridors, numbering 13, 7, and 6, respectively, with total lengths of 18.24 km, 41.94 km, and 67.26 km. The longest corridor, measuring 28.26 km, is classified as a general corridor. It bypasses areas with extremely high resistance but still carries a risk of biological flow interruption. Spatially, the southeastern part of Shenzhen exhibits a high density of corridors, predominantly key corridors, with fewer and shorter important and general corridors distributed sporadically. In contrast, the northwestern region has sparse but longer corridors, mostly general ones, which effectively connect western and central ecological sources. These provide favorable conditions for biological movement and migration, partially compensating for the lack of ecological sources in Shenzhen. This pattern suggests that constructing stepping stones in areas with poor ecological connectivity can effectively shorten inter-patch distances and facilitate ecological flows. Additionally, some long-span corridors integrate diverse landscape types, traverse urban built-up areas, and are primarily established along roadsides. Therefore, urban planning should emphasize the development of roadside landscapes to avoid corridor disruption due to inadequate reservation and restoration, thereby enhancing the continuity and stability of ecological corridors.
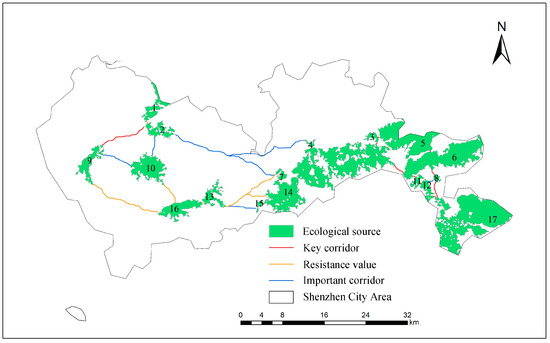
Figure 6.
Classification and distribution of ecological corridors in Shenzhen.
3.3. Identification of Ecological Pinch Points in Shenzhen City Area
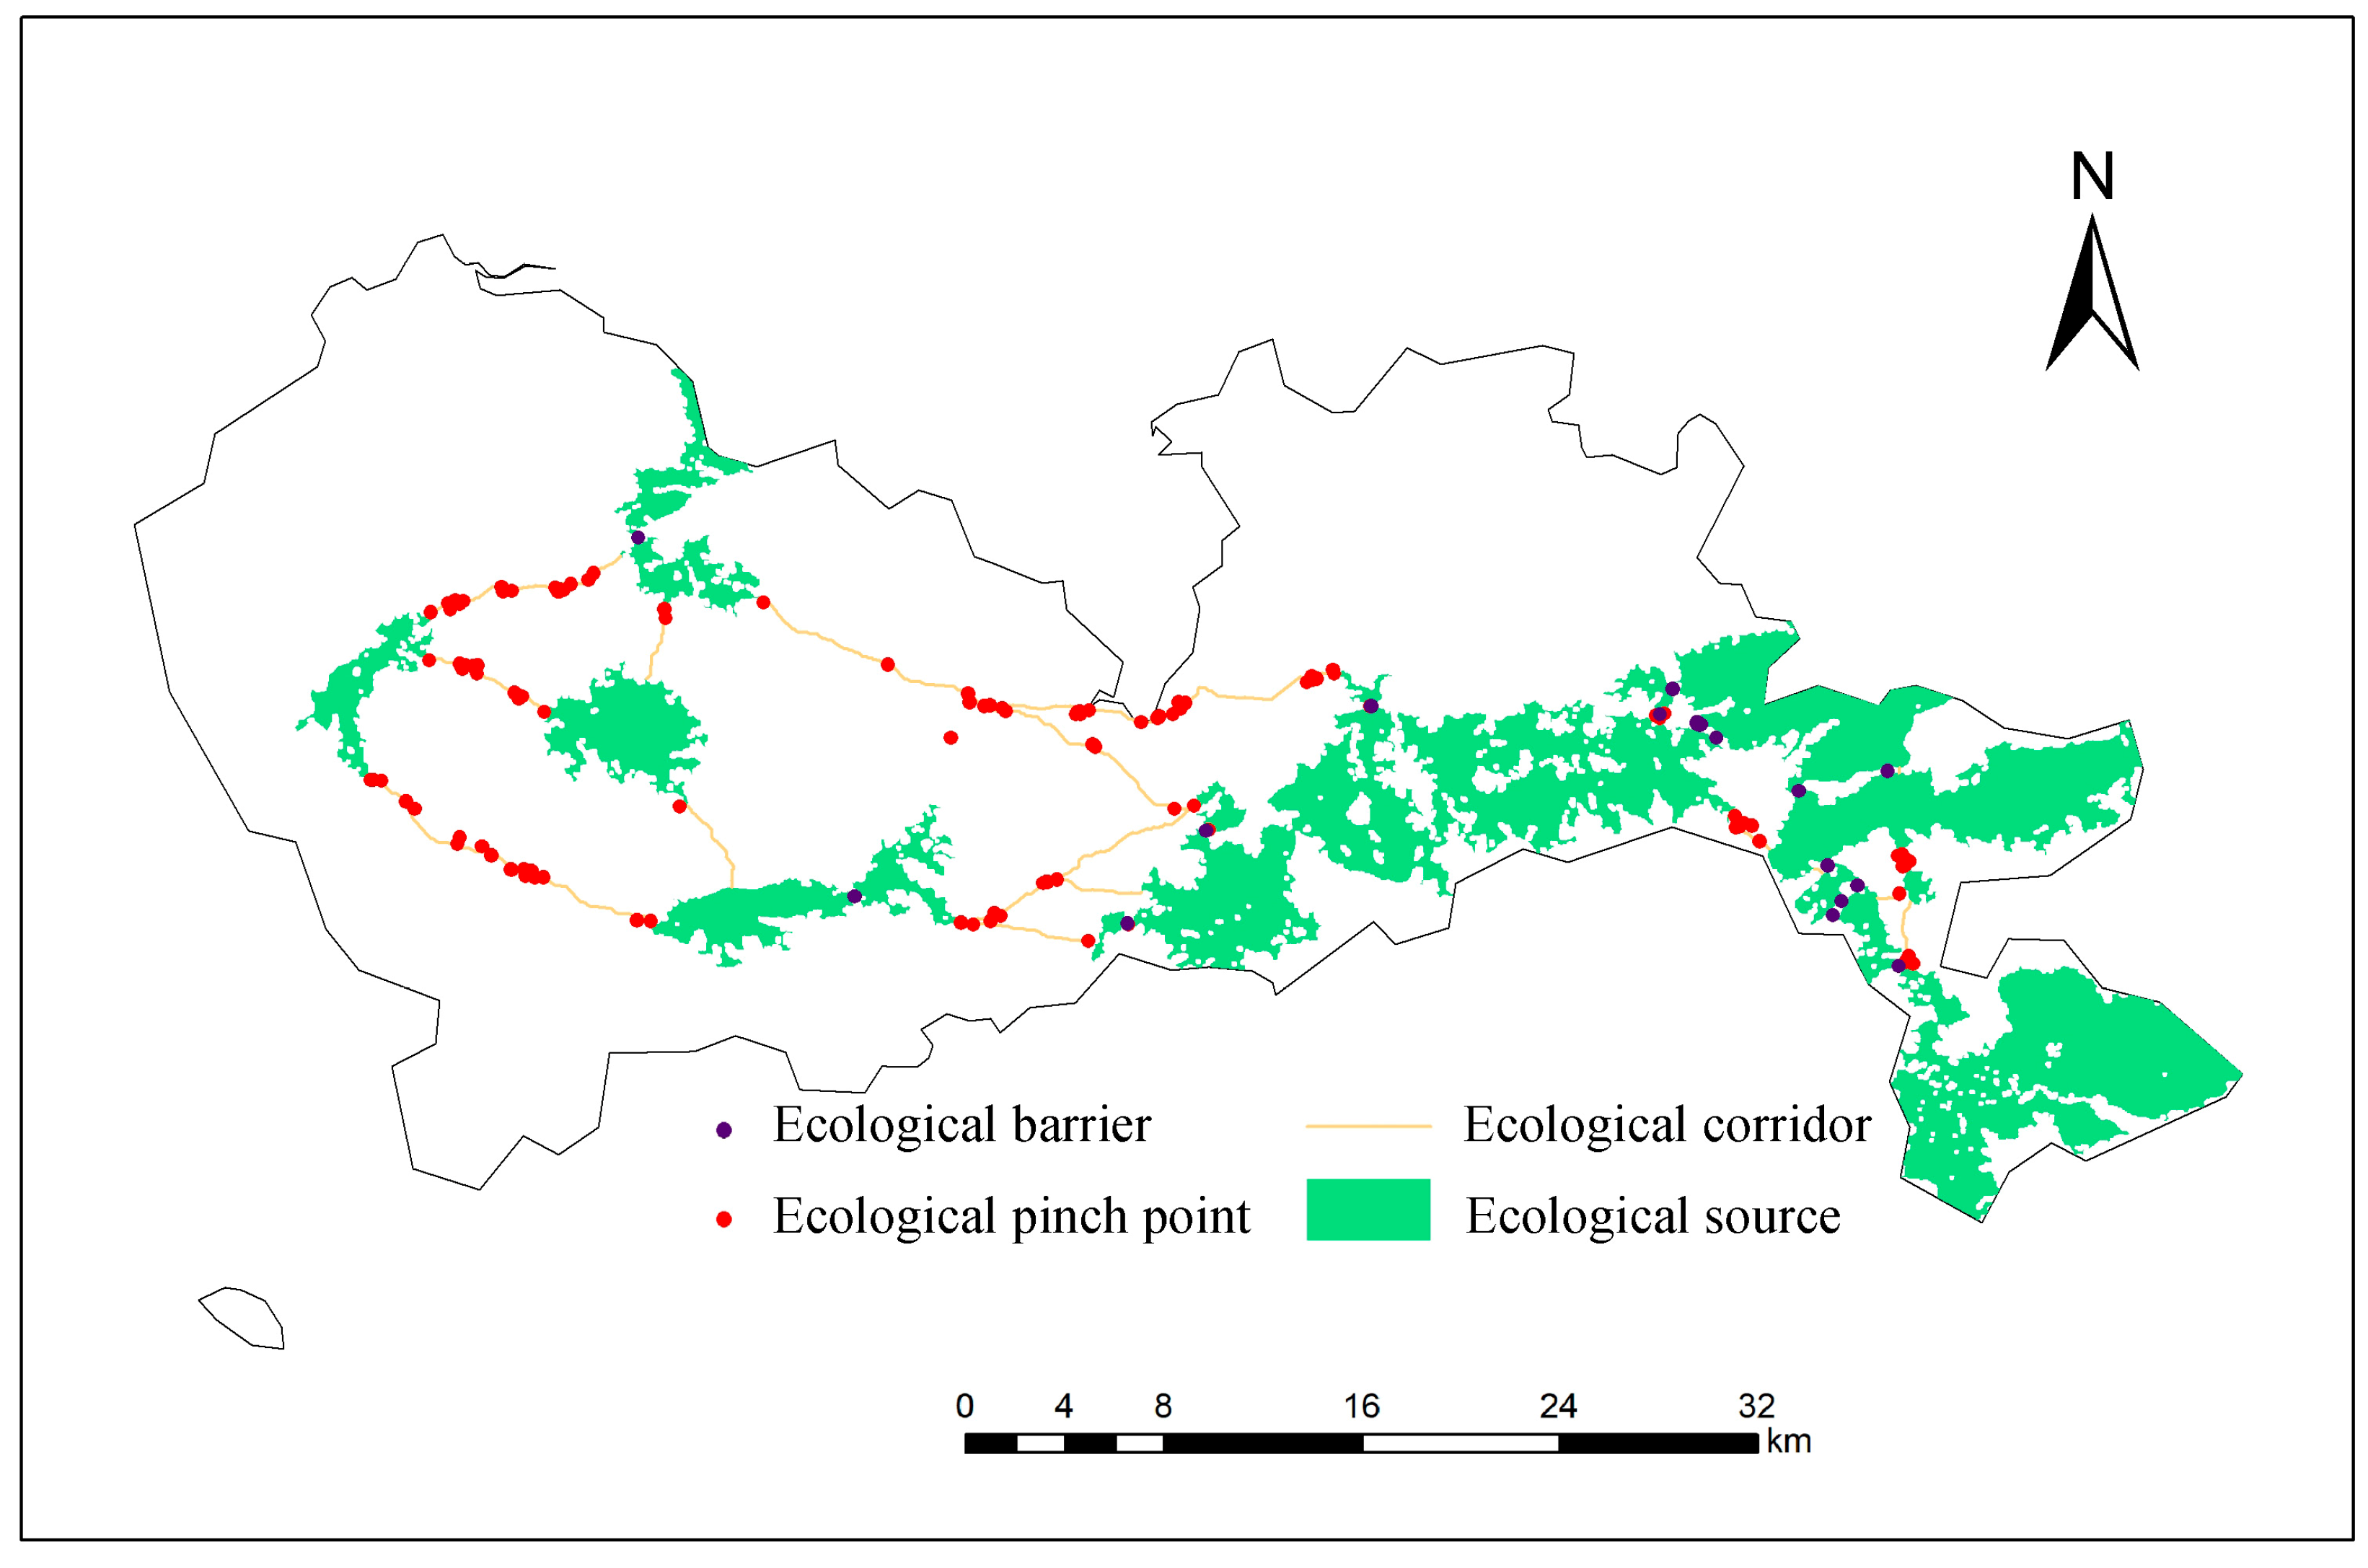
Based on circuit theory, ecological pinch points were identified as areas within ecological corridors with high current density. A higher current density value indicates a greater number of electrons (representing species) passing through per unit area, implying a stronger flow and greater importance in maintaining connectivity between patches. Regions with high current density are critical for biological movement. Given that the width of ecological corridors has limited influence on pinch points, and considering the actual conditions in Shenzhen, a weighted cost distance of 1000 m was set as the corridor width to extract areas with the highest current values as ecological pinch points. Using the Linkage Mapper tool, a total of 120 ecological pinch points with the highest cumulative current values were identified (Figure 7), covering a total area of 41.64 km2. The largest pinch point spans 7.4 km2, while the smallest is 0.06 km2. These pinch points are all located within ecological corridors, mostly exhibiting linear distributions. In terms of land cover, the pinch points are predominantly composed of forest land, grassland, and water bodies. At the same time, construction land is often found surrounding these pinch points, indicating that while they serve to maintain landscape connectivity, they are also under threat from human activities. Ecological pinch points tend to occur where ecological corridors connect to ecological sources or in intermediate segments of the corridors. If these areas become fragmented, the functionality of the entire ecosystem may be disrupted or impaired.
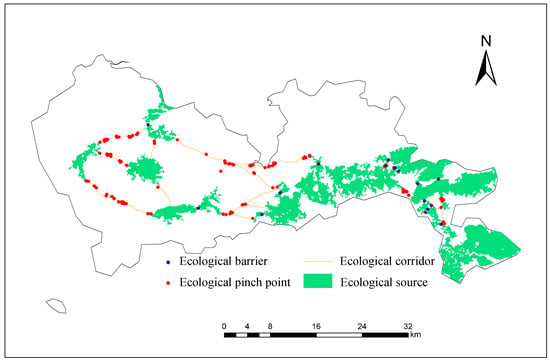
Figure 7.
Distribution of ecological pinch points and ecological barriers in Shenzhen.
3.4. Identification of Ecological Barriers in Shenzhen City Area
Areas with high cumulative current recovery values are identified as ecological barriers. Using the Barrier Mapper tool, 26 ecological barriers were identified (Figure 7), covering a total area of 27.87 km2. The largest barrier, located in the eastern part of Shenzhen, has an area of 4.6 km2. In terms of land cover composition, the ecological barriers are predominantly farmland and urban built-up land. Approximately 50% of the barriers have an area of less than 1 km2, yet they account for only 0.96% of the total barrier area. These smaller barriers are mainly scattered in a dotted pattern across western Shenzhen and can be relatively easily restored. Their remediation would significantly enhance regional landscape connectivity. Barriers larger than 1 km2 mostly exhibit patchy or linear distributions and are concentrated in the central and eastern regions—dispersed in the central area and densely clustered in the east. Most ecological barriers are located at the edges of or in gaps between ecological sources. Some barriers overlap with ecological pinch points, threatening the integrity and stability of the ecological base and limiting the expansion of ecological corridors. These areas require priority restoration.
3.5. Optimization and Evaluation of the Ecological Network in Shenzhen City Area
3.5.1. Network Structure Optimization by Adding Ecological Sources and Stepping Stones
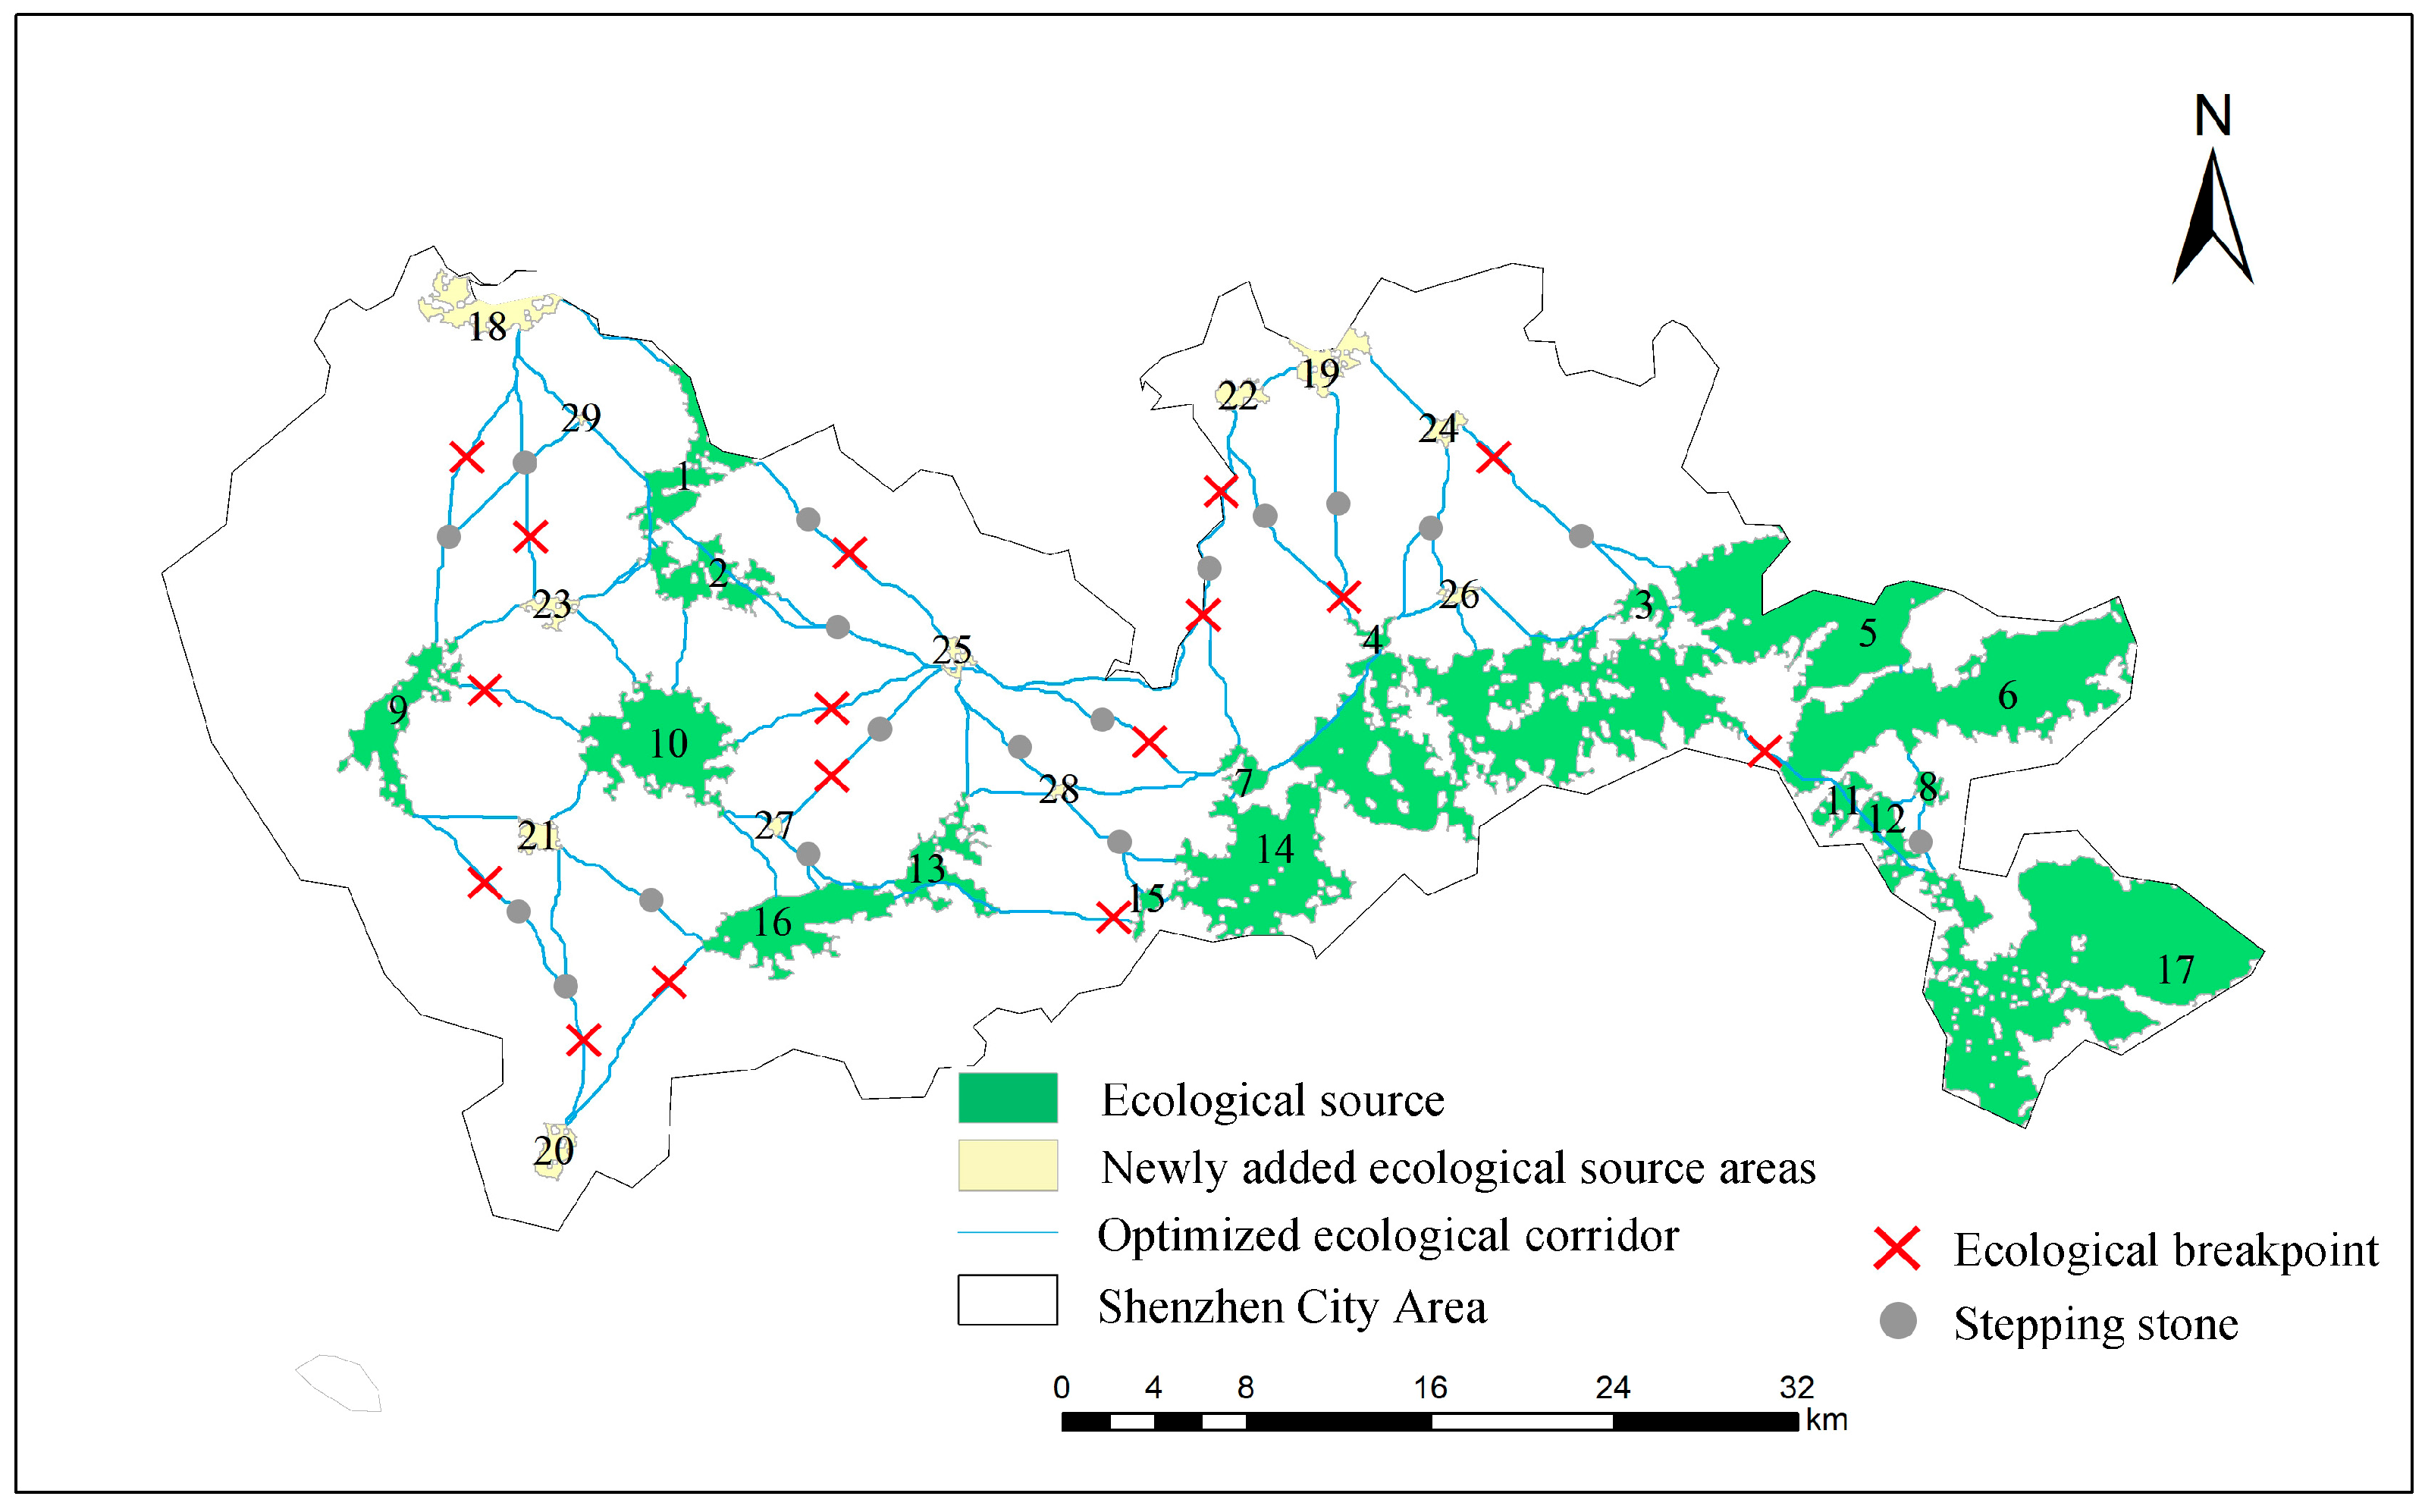
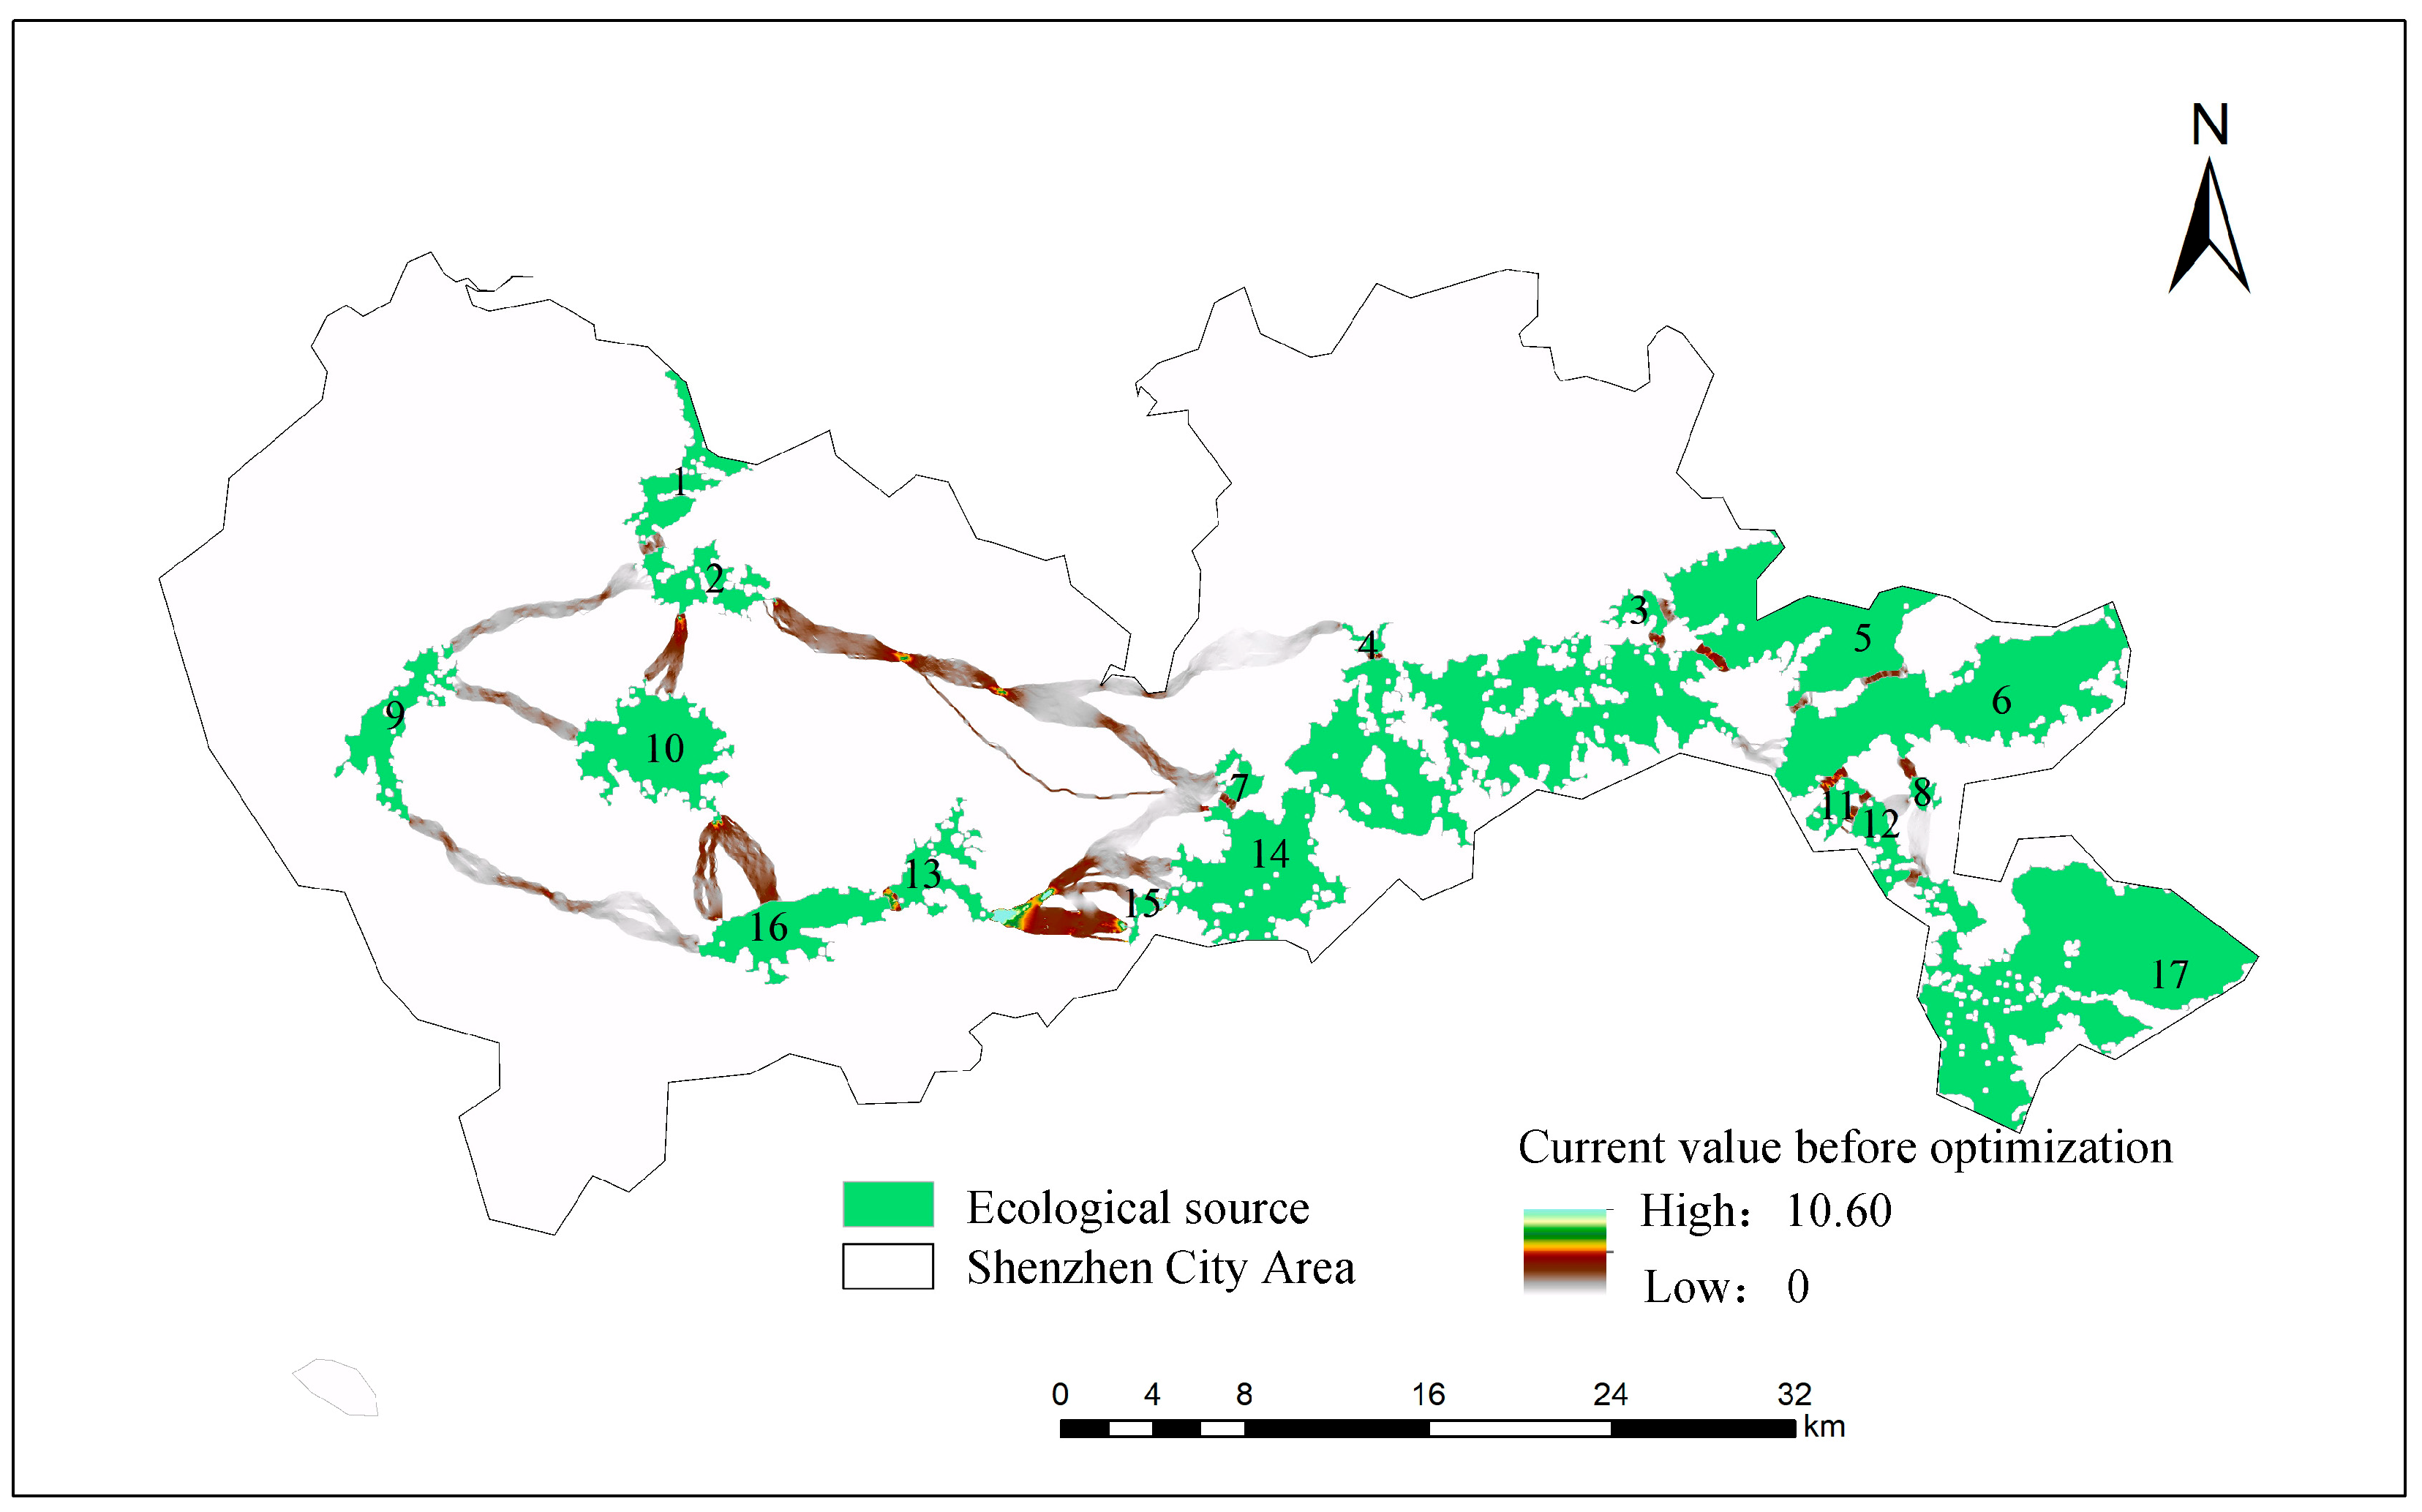
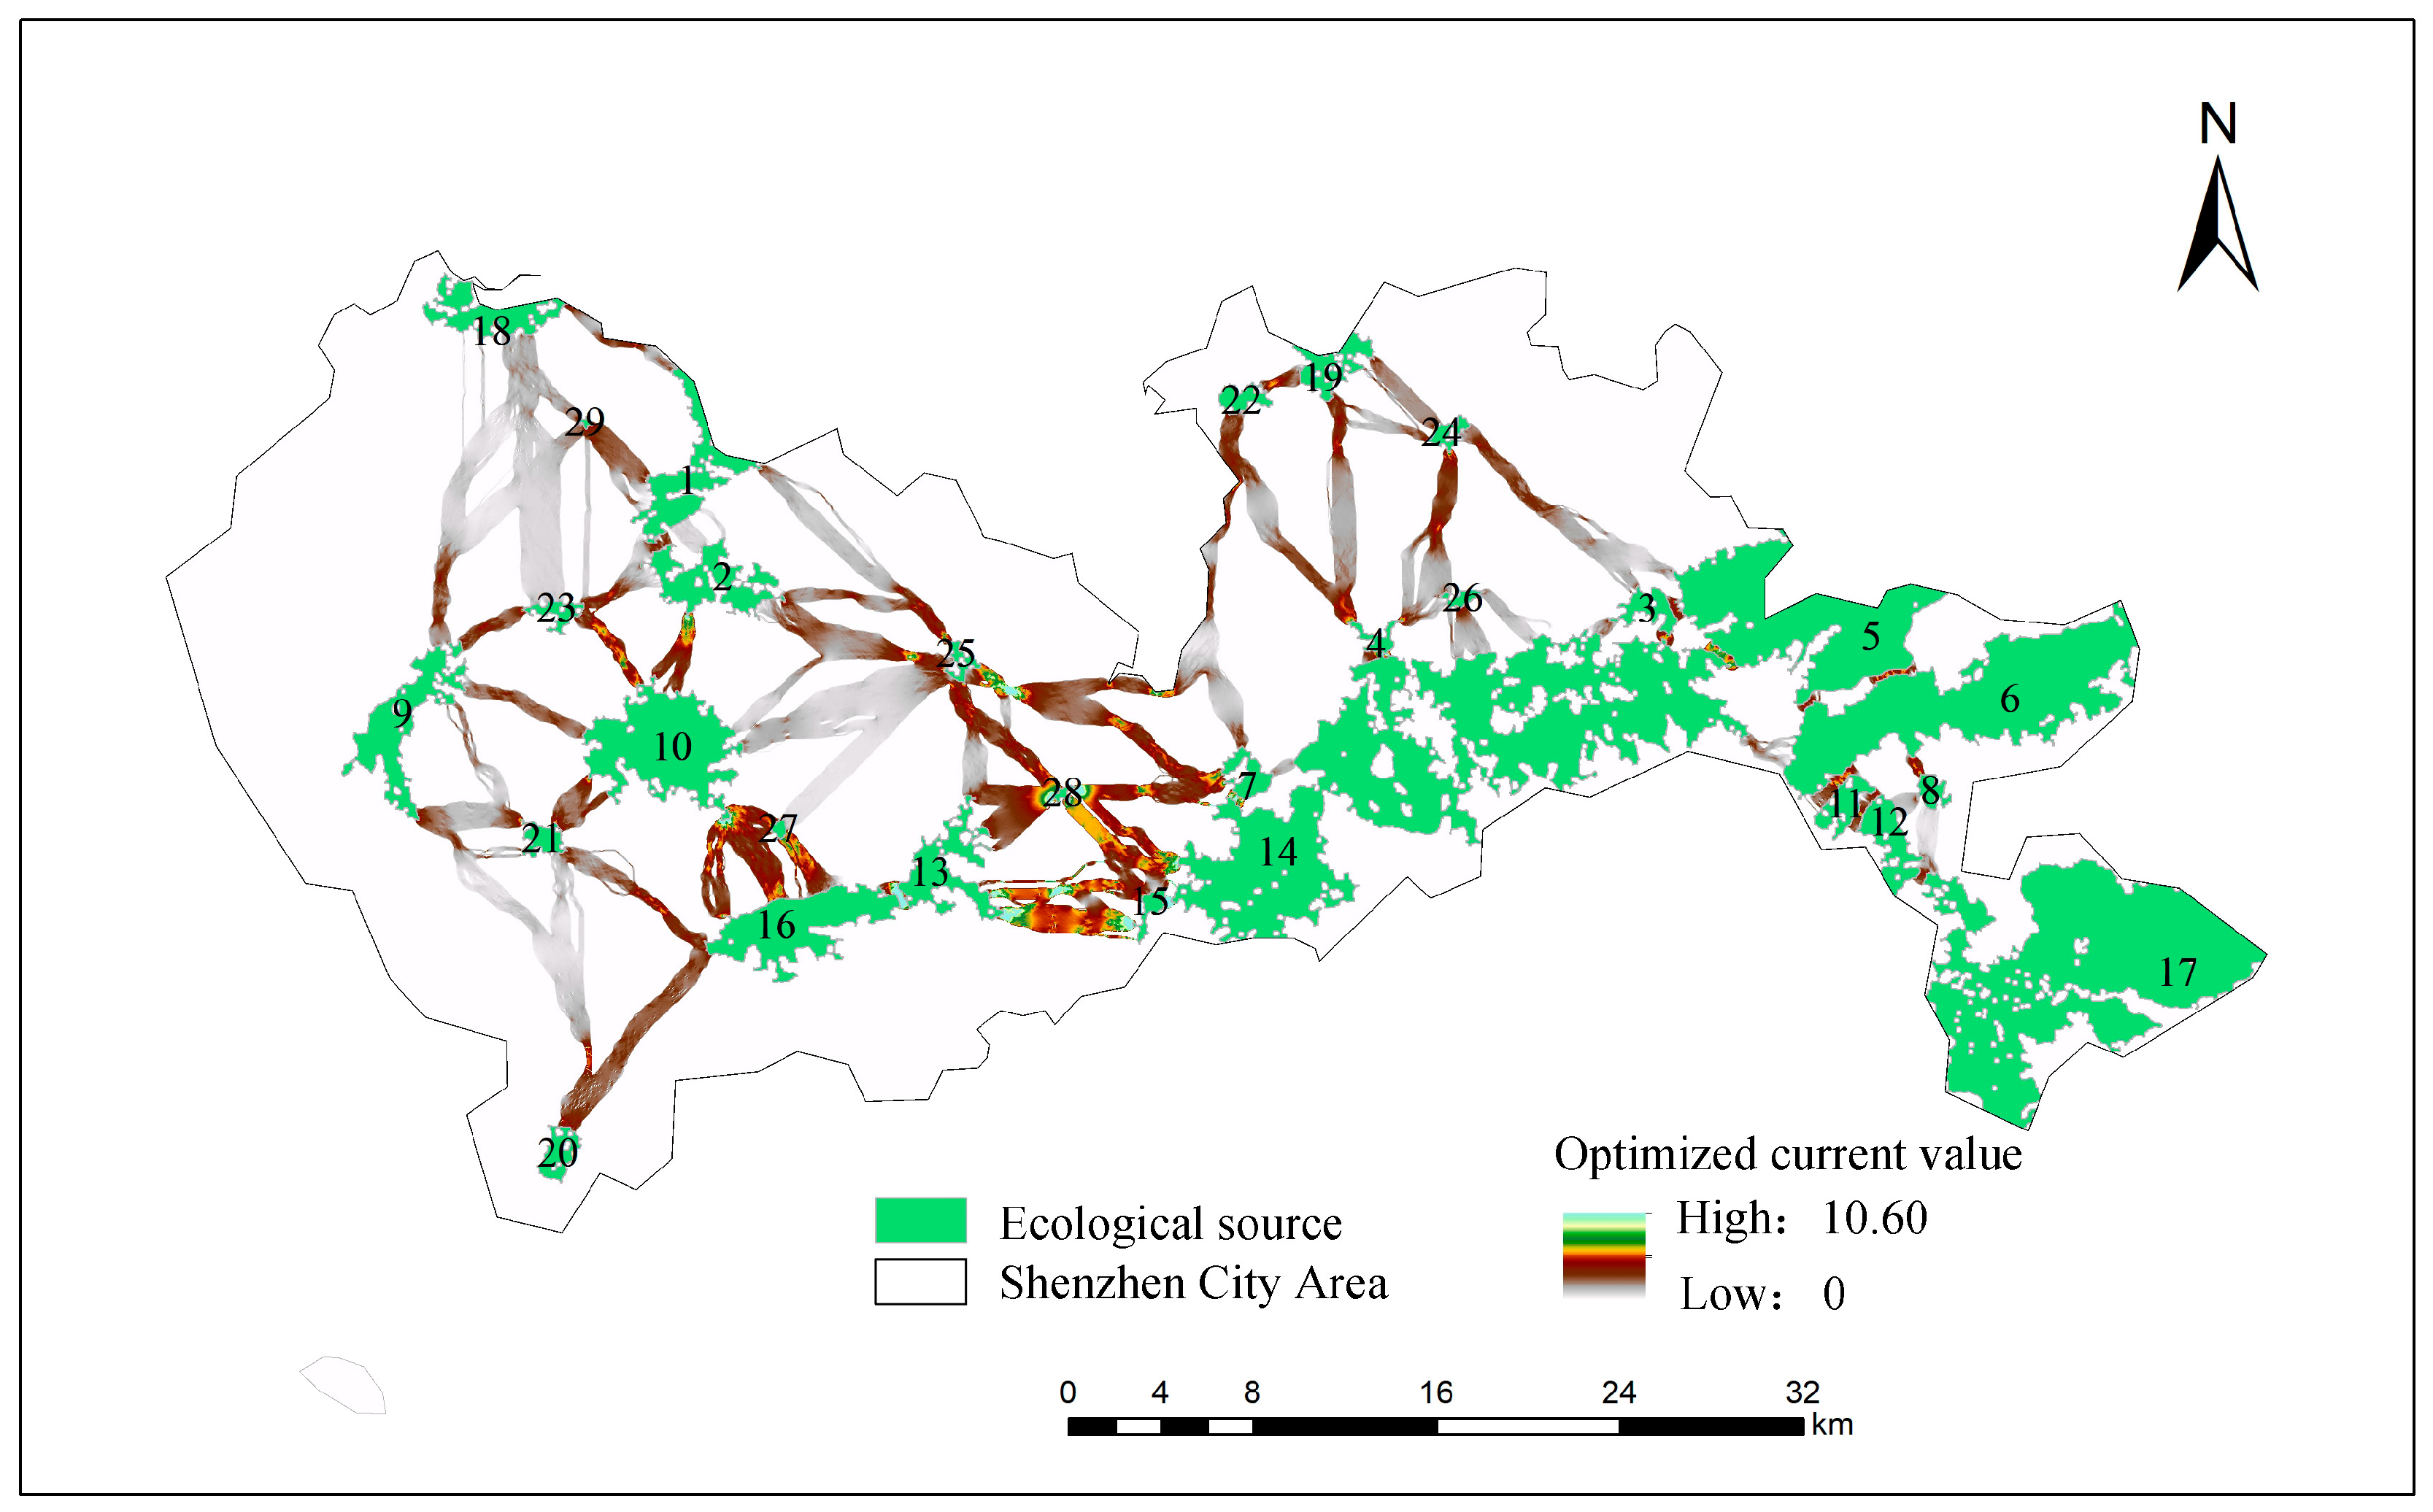
The ecological network in Shenzhen is primarily distributed in the southeastern and western regions, while the northwest, northeast, central, and southwestern areas lack sufficient ecological connectivity (Figure 6). Overall, the network exhibits an uneven spatial distribution. To improve the structure of the ecological network, it is necessary to add ecological sources and corridors in these underrepresented regions to enhance connectivity. Based on the existing ecological network of Shenzhen and in reference to the Shenzhen Territorial Spatial Master Plan (2021–2035), 12 new ecological sources were added according to the spatial distribution of core area patches (Figure 2). These include Luotian Forest Park, Dapingzhang Forest Park, Xili Lake Greenway, Shiyan Wetland Park, Nanshan Park, Changlingpi Reservoir, Pinghu Ecological Park, Sanlian Country Park, Qinglinjing Forest Park, Pingshan Huangzhu Reservoir, Songzikeng Forest Park, and Yanziling Park. Using circuit theory, 20 new ecological corridors were planned (Figure 8) to connect the newly added ecological sources with the existing ones. In subsequent urban planning, emphasis should be placed on the development of these new ecological sources and corridors to improve landscape connectivity. This will facilitate the flow of ecological processes from well-connected regions into areas lacking ecological networks, promote cyclical ecological flows across Shenzhen, and enhance the stability of ecosystems and biodiversity throughout the city.
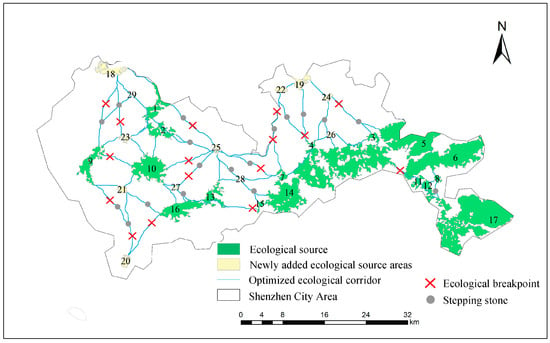
Figure 8.
Shenzhen Ecological Network Optimization.
The stability of ecological corridors is affected by external activities and internal conditions. Longer corridors are more vulnerable to external disturbances, reducing their stability. Connectivity between western and central parts, as well as central and northern parts of the Shenzhen City Area, is relatively low. Ecological resistance is high, and ecological sources are distant. Breaks have occurred in some ecological corridors, making the construction of stepping stones urgent. To address issues such as excessively long corridors, dead-end routes, and high migration volumes at corridor intersections, 18 stepping stones were added at ecological corridor connections (Figure 8 and Table 5). This helps enhance the success of species dispersal and migration. Furthermore, animal movement is affected by urban roads during migration. Ecological breakpoints occur where ecological corridors and road networks intersect. These areas impact local biological flow, hinder migration processes, and reduce migration survival rates. This study integrated transportation networks and identified 16 ecological breakpoints (Figure 8). Urban road planning should consider establishing passages for species migration or avoiding migration routes. Examples include building elevated bridges to preserve original green pathways and creating green underground passages for wildlife. These measures can restore ecological breakpoints and minimize the impact of urban roads on the ecological network.

Table 5.
Comparison of Shenzhen’s Ecological Network Before and After Optimization.
3.5.2. Functional Evaluation of the Ecological Network Based on Circuit Theory
As shown in Figure 8, before optimization, the ecological flow from surrounding ecological sources to high-density urban areas was limited. It was mainly concentrated in Luohu District and Dapeng New District. The ecological flow between source 6 and source 11 was strong. These two ecological sources are close to each other, facilitating easier dispersal. Ecological sources between source 2 and source 4 were relatively scattered. Sources 10, 16, 13, and 15 acted as important stepping stones, exhibiting strong ecological flow. Overall, the distribution of ecological flow was uneven before optimization. The limited flow reaching high-density urban areas restricted the service scope and capacity of ecological sources. After optimization, the maximum current value increased from 10.60 to 20.50 (Figure 9 and Figure 10 and Table 5), showing a significant improvement in current density. Ecological flows from surrounding sources spread along the optimized network. More flow now passes through central urban areas like Guangming, Nanshan, Longhua, and Longgang Districts. This demonstrates that the optimized ecological network successfully channels ecological flow into central urban areas of Shenzhen. It promotes biological movement and is highly significant for improving urban habitat quality.
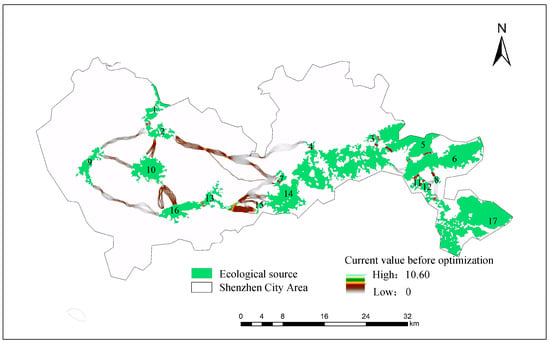
Figure 9.
Current distribution diagram of Shenzhen’s ecological network prior to optimization.
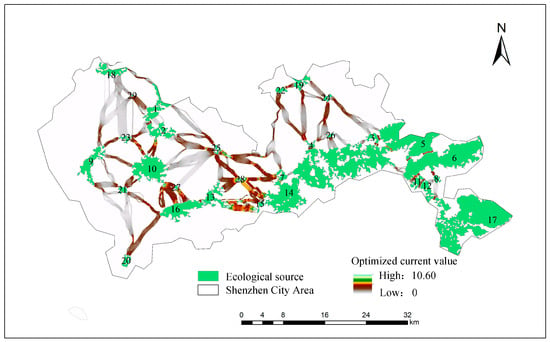
Figure 10.
Current distribution map of Shenzhen’s ecological network after optimization.
4. Discussion
The construction of ecological networks not only maintains regional natural ecological processes and protects the integrity and connectivity of landscape structure, but also secures the supply of ecosystem services required for regional socio-economic development. This study utilized Morphological Spatial Pattern Analysis (MSPA) to identify ecological sources and constructed a resistance surface by integrating natural and social factors. Ecological corridors, ecological pinch points, and ecological barriers were extracted using circuit theory to establish the ecological network. Overall, the landscape integrity and connectivity in the Shenzhen City Area are relatively low. Functions such as water conservation and soil retention are not prominent. Issues include uneven spatial distribution of ecological sources and localized fragmentation. In particular, densely distributed roads and urban built-up areas within ecological sources fragment natural landscapes. This disrupts gene exchange between populations, hinders the normal flow of materials and energy within the ecosystem, and affects its stability and ecological service functions. It is recommended to continue implementing natural forest protection projects and farmland-to-forest conversion programs in the transition zones between urban built-up areas and forestlands in northeastern, central, northwestern, and southwestern parts of the Shenzhen City Area. Efforts should focus on integrating dispersed ecological sources in western and central regions. Ecological restoration projects should be prioritized in areas with numerous barriers to enhance the integrity of natural ecological units.
Compared to previous studies [54,55], this research incorporates Morphological Spatial Pattern Analysis (MSPA) into source identification. Unlike conventional methods that extract ecological sources based on habitat quality or ecosystem service functions using the InVEST model [55], Morphological Spatial Pattern Analysis (MSPA) places greater emphasis on structural connectivity. It comprehensively considers landscape structural integrity and connectivity by identifying seven landscape types with connective importance [56], and is less affected by spatial scale. The analytical mechanism and identification process of Morphological Spatial Pattern Analysis (MSPA) complement those of the InVEST model, significantly improving the accuracy of source identification [57]. Furthermore, considering that ecological sources primarily serve as terrestrial animal habitats, this study placed particular emphasis on patch size and land use type during source identification. Compared to other ecological source extraction methods [58], this approach demonstrates better generalizability for constructing ecological networks across different regions. Additionally, during the construction of the resistance surface and extraction of corridors, multiple factors were comprehensively considered in line with the characteristics of Shenzhen City Area, including land use type, human activity intensity, and natural environmental features. Ecological corridors were extracted using random walk theory, which effectively simulates the complexity and randomness of species migration paths. This method fully accounts for corridor redundancy, more accurately reflects corridor width and importance levels, thereby enhancing the scientific rigor and precision of the study. Moreover, connectivity analysis based on circuit theory forms a critical component of ecological network construction. It enables the identification of spatially explicit elements such as ecological corridors, pinch points, and barriers through current values, independent of corridor width constraints. This approach breaks the homogenization limitations inherent in least-cost path methods for ecological corridors, providing more specific basis for ecological restoration and planning while effectively reducing subjectivity in functional zoning of ecological security patterns.
Although this study has achieved certain innovations and breakthroughs, some shortcomings remain that require further refinement in future research. The optimization strategy proposed in this study is primarily based on the necessity and feasibility of ecological principles, emphasizing the enhancement of ecological functions, and has not yet incorporated an explicit cost–benefit assessment system. While the current strategy implicitly accounts for migration costs between land types through resistance surfaces, it fails to quantify economic inputs such as land acquisition, vegetation restoration, and engineering implementation associated with establishing new source areas or corridors. It also neglects the complexity of management coordination. To address this, future research should build upon the existing optimized framework by integrating socioeconomic data—including land prices, development intensity, and ecological conservation redlines—to construct a dual-dimensional “ecological benefits–implementation costs” evaluation model. This will assess the feasibility of ecological network optimization and facilitate the substantive implementation of optimization strategies. Specific measures include: At the ecological objective level, quantifying the ecological functional value of the ecological network based on species migration requirements, landscape connectivity indices, and ecosystem service values; At the economic objective level, generate high-resolution land price grids using real estate transaction data. Combine spatial land price interpolation models, construction land simulation, and building density to construct a composite resistance surface of land prices and development pressure. Assign differentiated resistance weights to areas of high economic value and high development intensity, while introducing development pressure threshold constraints. Employing a multi-objective particle swarm optimization algorithm under spatial constraints, we derive a Pareto optimal solution set to balance the linear relationship between ecological network planning and development costs. Finally, through scenario simulation analysis examining the impact of varying policy intensities on optimization outcomes, this study identifies the sensitivity ranges of key variables. It provides planners with dynamic decision support that balances ecological security patterns, land use efficiency, and socioeconomic benefits. This approach advances ecological network planning toward the coordinated development of a multidimensional, integrated “ecological–economic–social” system, ensuring both the scientific rigor of planning proposals and the feasibility of their implementation. By incorporating economic feasibility analysis, this study’s optimization scheme evolves from a purely ecological feasibility framework into a decision-support tool that integrates scientific rigor, economic viability, and operational feasibility. This transformation not only enhances the implementation prospects of planning schemes but, more importantly, establishes a scientific framework capable of seeking a dynamic equilibrium between ecological conservation and urban development.
Moreover, this study focused solely on the static identification and optimization potential of the current ecological network in Shenzhen City Area, without investigating its spatiotemporal evolution. This limits the ability to identify degradation trends, such as the shrinkage of ecological sources, fragmentation of corridors, or disappearance of pinch points. Static analysis also fails to reveal the cumulative impacts of rapid urban expansion on the ecological network, weakening the capacity to anticipate future pressures. Future studies should incorporate multi-temporal remote sensing data to analyze the evolutionary trajectory and driving mechanisms of the ecological network. This would support a shift from “current-state optimization” to “dynamic adaptive planning,” enhancing the resilience and long-term sustainability of the ecological network. This study constructs an ecological network using Morphological Spatial Pattern Analysis (MSPA) and circuit theory. It simulates terrestrial species migration influenced by landscape patterns and land use. The optimization targets species that depend on connected woodland habitats. While water bodies and woodlands were included as ecological sources, the study does not create separate networks for aquatic species or migratory birds. Future research could integrate river connectivity models and bird migration routes. This would support the development of a multi-species ecological network. Furthermore, this study focuses on the construction and optimization of ecological networks. Future research should build upon this foundation to explore implementation-oriented phased development pathways for ecological networks and establish an adaptive management framework centered on “monitoring–evaluation–adjustment.” It is essential to assess the optimized ecological networks from both economic and feasibility perspectives, thoroughly examining the practicality of their implementation. This represents a critical task for advancing the implementation of ecological networks and achieving sustainable urban development.
5. Conclusions
This study takes Shenzhen City Area, a special economic zone, as its research area. It applies Morphological Spatial Pattern Analysis (MSPA) and circuit theory to analyze landscape patterns and identify ecological sources. The importance levels of these sources were classified using landscape connectivity indices. Based on the constructed ecological resistance surface, ecological corridors were extracted, and their importance levels were defined. Ecological pinch points and barriers were also identified to construct the ecological network. The network was optimized by adding ecological sources, ecological corridors, stepping stones, and rehabilitating ecological breakpoints. Finally, the pre- and post-optimization ecological networks were evaluated from both structural and functional perspectives. The effectiveness of the optimization was verified by comparing current density values. This study aims to provide new perspectives and insights for urban planning, regional development, and ecological balance in Shenzhen City Area. The results indicate the following: (1) The land use types in Shenzhen City Area comprise seven landscape patterns: core, islet, perforation, edge, loop, bridge, and branch. The core area, with a total area of 426.69 km2, is the largest among all types. It exhibits high fragmentation and poor connectivity, primarily distributed in the southeastern forested regions, showing a pattern of “dense in the east and west, sparse in the center.” The edge area ranks second in size, serving as a buffer zone with high susceptibility to external disturbances. The bridge area covers 65.44 km2, accounting for 9.31% of the foreground landscape. It functions as a potential structural corridor in the ecological network, facilitating connectivity. (2) A total of 17 ecological sources were identified based on ecological patch area screening, predominantly forested. These sources form an ecological barrier in the southeastern region, with a spatial distribution characterized by concentrated contiguous patches in the east and scattered patches in the west, resulting in an incomplete ecological network system. The northeastern, southwestern, northwestern, and parts of the central areas lack green spaces for wildlife habitats and activities. Future efforts should focus on adding stepping stones to improve ecological conditions. Based on landscape connectivity index analysis, the ecological sources were classified into 8 key sources, 5 important sources, and 4 general sources. Key sources occupy the largest area, provide significant ecosystem services, and experience minimal human disturbance. They include various large urban parks and protected natural areas. (3) The ecological resistance values in Shenzhen City Area range from 16.18 to 78.37, showing significant regional variation. Areas with high resistance are primarily characterized by urban built-up land, located in city centers and along transportation routes, where species migration and material flow are hindered. Using circuit theory, 26 ecological corridors were identified, forming an interconnected network. The western and eastern regions exhibit a transition from long and sparse to short and dense corridors. The eastern distribution is relatively stable, while connectivity is poor in the northeastern and northwestern regions, urgently requiring the construction of ecological corridors. Based on quantile classification, the corridors were categorized into 13 key corridors, 7 important corridors, and 6 general corridors. (4) A total of 120 ecological pinch points and 26 ecological barriers were identified in Shenzhen City Area. The pinch points cover a total area of 46 km2, all located within ecological corridors, mostly exhibiting linear distributions. Their land cover is predominantly forest, grassland, and water bodies. The ecological barriers cover a total area of 27.87 km2, mainly consisting of farmland and urban built-up land, typically appearing as patches or linear strips. They are mostly situated at the edges or gaps between ecological sources. The optimization plan added 12 new ecological sources and planned 20 new ecological corridors. Eighteen stepping stones were incorporated at corridor junctions, and 16 ecological breakpoints were identified. Using circuit theory, a functional comparison between the pre- and post-optimization ecological networks showed the maximum current value increased from 10.60 to 20.50, indicating a significant improvement in current density. This demonstrates that the optimized network effectively channels ecological flows from sources into central urban areas, promoting biological movement. The ecological significance of this research is mainly reflected in four aspects: First, it contributes to biodiversity conservation and ecological corridor restoration. The newly added ecological source areas and ecological corridors provide stepping stones for species, repair ecological flow pathways, enhance the continuity of ecological patches, reduce migration risks, and provide a structural foundation for regional species exchange. Second, it helps improve ecosystem services and enhance nature’s provisioning capacity. By optimizing the spatial configuration of ecological sources and corridors, the supply capacity of the urban natural environment is strengthened, indirectly improving ecosystem services such as water retention, soil conservation, and air purification, thereby increasing the resilience of the urban ecosystem. Third, it supports the construction of an ecological security pattern to mitigate ecological risks. The construction of the resistance surface helps identify hotspots where ecological flows are obstructed, providing a basis for defining “ecological redlines” in urban planning. The multi-level ecological structure of core–buffer–edge provides an ecological safety net for Shenzhen City Area to cope with uncertain climate challenges. Fourth, it guides sustainable urban development by balancing ecological protection and economic growth. The optimization of the ecological network not only restores the natural–social system but also upgrades the social system, providing green infrastructure for the city and delivering ecological benefits to residents.
Author Contributions
H.L. and C.Z.: conceptualization, methodology, formal analysis, writing—original draft, writing—review and editing, visualization, software. X.T.: writing—review and editing, guidelines, Supervisions, funding acquisition. H.G.: formal analysis, writing—original draft, investigation. C.Z.: methodological analysis, writing—original draft. H.L.: editing, formatting adjustments. All authors have read and agreed to the published version of the manuscript.
Funding
National Natural Science Foundation of China (51978272).
Institutional Review Board Statement
Not applicable.
Informed Consent Statement
Not applicable.
Data Availability Statement
The data presented in this study are available on request from the corresponding author due to privacy restrictions.
Conflicts of Interest
The authors declare no conflict of interest.
References
- Shi, X.H.; Liang, K.Y. Construction of Ecological Security Pattern Based on Ecological Supply-Demand and Land Change: A Case Study of Jiangyin City, Jiangsu Province. Res. Soil Water Conserv. 2025, 32, 423–434. [Google Scholar]
- Zhou, X.Y.; Di Lire, T.; Hou, M.L.; He, Y.; Ding, X. Assessing Land Carbon Metabolism in Hubei Section of Three Gorges Reservoir Area Based on Ecological Network. Chin. J. Appl. Ecol. 2025, 36, 2150–2158. [Google Scholar]
- Ma, Z.Y.; Zhu, M.J.; Luan, B. Construction of Ecological Network in Guangdong-Hong Kong-Macao Greater Bay Area Based on ESV and Circuit Theory. Ecol. Sci. 2025, 44, 8–18. [Google Scholar] [CrossRef]
- Liu, X.Q.; Huang, B. Construction of Urban Ecological Security Pattern Based on Multi-Source Data: A Case Study of Shenzhen. Ecol. Sci. 2025, 44, 241–253. (In Chinese) [Google Scholar]
- Sallustio, L.; De Toni, A.; Strollo, A.; Di Febbraro, M.; Gissi, E.; Casella, L.; Geneletti, D.; Munafò, M.; Vizzarri, M.; Marchetti, M. Assessing habitat quality in relation to the spatial distribution of protected areas in Italy. J. Environ. Manag. 2017, 201, 129–137. [Google Scholar] [CrossRef]
- Fu, W.X.; Gao, C.; Ren, G.Y.; Liu, D.-F. Construction of Composite Blue-Green Ecological Network in Wuhan Based on Complex Network Theory. Chin. J. Appl. Ecol. 2025, 36, 2139–2149. [Google Scholar]
- Skokanová, H.; Netopil, P.; Havlíček, M.; Šarapatka, B. The role of traditional agricultural landscape structures in changes to green infrastructure connectivity. Agric. Ecosyst. Environ. 2020, 302, 107071. [Google Scholar] [CrossRef]
- Feng, Y.L.; He, M.; Li, B.; Lei, J.; Ai, L. Construction and Optimization of Urban Ecological Network in Chongqing Main Urban Area. Ecol. Environ. Sci. 2025, 34, 699–709. [Google Scholar]
- Liu, C.; Zhang, S.Q.; Huang, Y.Z.; Li, Y. Ecological Network Construction in Yunnan Province from the Perspective of Major Function-Oriented Zones. J. Soil Water Conserv. 2025, 39, 172–181+190. (In Chinese) [Google Scholar]
- Kamusoko, C.; Gamba, J. Simulating urban growth using a random forest-cellular automata (RF-CA) model. ISPRS Int. J. Geo-Inf. 2015, 4, 447–470. [Google Scholar] [CrossRef]
- Wang, X.Y.; Feng, Q.Y.; Wang, C.X.; Yan, Y. Construction of Ecological Security Pattern in Guangdong-Hong Kong-Macao Greater Bay Area Based on Ecological Adaptation Theory. Acta Ecol. Sin. 2025, 45, 5769–5782. (In Chinese) [Google Scholar]
- Kowe, P.; Mutanga, O.; Dube, T. Advancements in the remote sensing of landscape pattern of urban green spaces and vegetation fragmentation. Int. J. Remote Sens. 2021, 42, 3797–3832. [Google Scholar] [CrossRef]
- Ren, Y.J.; Lu, Y.H.; Jiang, W.; Li, T. Ecological Protection and Restoration Strategies of Territorial Space in Xianyang City Based on Ecological Network. Sci. Surv. Mapp. 2025, 50, 48–63. [Google Scholar]
- Li, J.J.; Gu, Y.Y.; Xing, Z. Construction of “Biological Migration-Regional Cooling” Composite Functional Ecological Network in Wuhan Metropolitan Area. Landsc. Archit. 2025, 32, 96–104. [Google Scholar] [CrossRef]
- Simpkins, C.E.; Dennis, T.E.; Etherington, T.R. Assessing the performance of common landscape connectivity metrics using a virtual ecologist approach. Ecol. Model. 2018, 367, 13–23. [Google Scholar] [CrossRef]
- Wang, Z.L.; Qiao, J.J.; Liu, H.L.; Wang, G.; Feng, Y. Spatiotemporal Evolution and Optimization Strategies of Ecological Security Patterns in the Middle Reaches of the Yellow River of China. Trans. Chin. Soc. Agric. Eng. 2024, 40, 231–239. [Google Scholar]
- De Montis, A.; Ganciu, A.; Cabras, M.; Bardi, A.; Mulas, M. Comparative Ecological Network Analysis: An Application to Italy. Land Use Policy 2019, 81, 714–724. [Google Scholar] [CrossRef]
- Men, D.; Pan, J. Ecological Network Identification and Connectivity Robustness Evaluation in the Yellow River Basin under a Multi-Scenario Simulation. Ecol. Modell. 2023, 482, 110384. [Google Scholar] [CrossRef]
- Rinaldo, A.; Gatto, M. River networks as ecological corridors: A coherent ecohydrological perspective. Adv. Water Resour. 2018, 112, 27–58. [Google Scholar] [CrossRef]
- Zeng, W.; He, Z.; Bai, W.; He, L.; Chen, X.; Chen, J. Identification of Ecological Security Patterns of Alpine Wetland Grasslands Based on Landscape Ecological Risks: A Study in Zoigê County. Sci. Total Environ. 2024, 928, 172302. [Google Scholar] [CrossRef]
- Peng, J.; Yang, Y.; Liu, Y.; Hu, Y.; Du, Y.; Meersmans, J.; Qiu, S. Linking Ecosystem Services and Circuit Theory to Identify Ecological Security Patterns. Sci. Total Environ. 2018, 644, 781–790. [Google Scholar] [CrossRef]
- Chen, X.; Kang, B.; Li, M.; Du, Z.; Zhang, L.; Li, H. Identification of Priority Areas for Territorial Ecological Conservation and Restoration Based on Ecological Networks: A Case Study of Tianjin City, China. Ecol. Indic. 2023, 146, 109809. [Google Scholar] [CrossRef]
- Bombrun, M.; Dash, J.P.; Pont, D.; Watt, M.S.; Pearse, G.D.; Dungey, H.S. Forest-Scale Phenotyping: Productivity Characterisation Through Machine Learning. Front. Plant Sci. 2020, 11, 99. [Google Scholar] [CrossRef]
- Li, C.; Su, K.; Liang, X.; Jiang, X.; Wang, J.; You, Y.; Wang, L.; Chang, S.; Wei, C.; Zhang, Y.; et al. Identification of Priority Areas to Provide Insights for Ecological Protection Planning: A Case Study in Hechi, China. Ecol. Indic. 2023, 154, 110738. [Google Scholar] [CrossRef]
- Song, S.; Gong, Y.; Yu, Y. Integrating Pattern, Process, and Function in Urban Landscape Ecological Network Planning: A Case Study of Harbin Central City. Ecol. Indic. 2024, 159, 111671. [Google Scholar] [CrossRef]
- Rosales, F.O.; Fath, B.; Llerena, G. Quantifying a Virtual Water Metabolic Network of the Metropolitan District of Quito, Ecuador Using Ecological Network Methods. J. Ind. Ecol. 2023, 27, 1304–1318. [Google Scholar] [CrossRef]
- Liu, W.; Xu, H.; Zhang, X.; Jiang, W. Green Infrastructure Network Identification at a Regional Scale: The Case of Nanjing Metropolitan Area, China. Forests 2022, 13, 735. [Google Scholar] [CrossRef]
- Huo, J.; Shi, Z.; Zhu, W.; Li, T.; Xue, H.; Chen, X.; Yan, Y.; Ma, R. Construction and Optimization of an Ecological Network in Zhengzhou Metropolitan Area, China. Int. J. Environ. Res. Public Health 2022, 19, 8066. [Google Scholar] [CrossRef]
- Zhao, Y.; Xia, J.; Xu, Z.; Zou, L.; Qiao, Y.; Li, P. Impact of Urban Expansion on Rain Island Effect in Jinan City, North China. Remote Sens. 2021, 13, 2989. [Google Scholar] [CrossRef]
- Vlková, K.; Zýka, V.; Papp, C.-R.; Romportl, D. An Ecological Network for Large Carnivores as a Key Tool for Protecting Landscape Connectivity in the Carpathians. J. Maps 2023, 20, 2290858. [Google Scholar] [CrossRef]
- Wang, F.; Gao, H.; Liu, J.; Fu, T.; Qi, F.; Gao, Y.; Zhao, L. Study on the Characteristics of Ecological Network and Critical Areas of Ecological Restoration in Hebei-Tianjin Coastal Wetlands. Wetlands 2024, 44, 24. [Google Scholar] [CrossRef]
- Johnston, S.; Good, R. The Benefits of Restored Linear Vegetation Corridors for Biodiversity Conservation: A Case Study. Australas. Plant Conserv. J. Aust. Netw. Plant Conserv. 2016, 24, 22–24. [Google Scholar] [CrossRef]
- Yang, H.Y.; Xiu, C.; Li, L.L.; Ye, Y.H.; Chen, Y.L. Construction of Ecological-Urban Network Pattern for Ecological Synergy in Bay-Area Urban Agglomeration: A Case Study of Guangdong-Hong Kong-Macao Greater Bay Area. Acta Ecol. Sin. 2024, 44, 11049–11064. (In Chinese) [Google Scholar]
- Modica, G.; Praticò, S.; Laudari, L.; Ledda, A.; Di, F.S. Implementation of multispecies ecological networks at the regional scale: Analysis and multi-temporal assessment. J. Environ. Manag. 2021, 289, 112494. [Google Scholar] [CrossRef]
- Liu, M.; Wang, Q.; Liang, G.; Liu, M.; Hu, X.; Lin, S.; Wu, Z. Construction of an Ecological Security Pattern Based on the PLUS and MSPA Models: A Case Study of the Fuzhou Metropolitan Area. Sustainability 2025, 17, 5830. [Google Scholar] [CrossRef]
- Song, Y.; Li, M.; Duo, L.; Chen, N.; Lu, J.; Yang, W. Multi-Scenario Simulation and Assessment of Ecological Security Patterns: A Case Study of Poyang Lake Eco-Economic Zone. Sustainability 2025, 17, 4017. [Google Scholar] [CrossRef]
- Guo, S.; Zhang, Q.T.; Cui, Y. Spatiotemporal Evolution and Optimization of Ecological Network in Rapidly Urbanizing Area of Nanning. Chin. Landsc. Archit. 2025, 41, 125–131. (In Chinese) [Google Scholar]
- Cao, W.J.; Yang, Q.K.; Jia, G.X.; Bai, H.; Guo, Z.; Wang, Z.; Wang, L.; Wen, L. Construction and optimization of ecological network based on ecological vulnerability in Ulanqab, Inner Mongolia, China. Chin. J. Appl. Ecol. 2025, 36, 376–382. [Google Scholar]
- Pan, Y.; Yang, T.; Gong, J. Identification of Ecological Restoration Areas Based on “Ecological Quality-Ecological Network” Framework: A Case Study of Wuhan. China Land Sci. 2024, 38, 129–142. (In Chinese) [Google Scholar]
- Zou, C.; Tang, X.; Tan, Q.; Feng, H.; Guo, H.; Mei, J. Constructing Ecological Networks for Mountainous Urban Areas Based on Morphological Spatial Pattern Analysis and Minimum Cumulative Resistance Models: A Case Study of Yongtai County. Sustainability 2024, 16, 5559. [Google Scholar] [CrossRef]
- Fábos, J.G. Green way plann in gin the United States: Its origins and recent case studies. Landsc. Urban Plan. 2004, 68, 321–334. [Google Scholar] [CrossRef]
- Ford, A.T.; Sunter, E.J.; Fauvelle, C.; Bradshaw, J.L.; Ford, B.; Hutchen, J.; Phillipow, N.; Teichman, K.J. Effective corridor width: Linking the spatial ecology of wildlife with land use policy. Eur. J. Wildl. Res. 2020, 66, 69. [Google Scholar] [CrossRef]
- Díaz, S.; Settele, J.; Brondízio, E.S.; Ngo, H.T.; Agard, J.; Arneth, A.; Balvanera, P.; Brauman, K.A.; Butchart, S.H.; Chan, K.M.; et al. Pervasive human-driven decline of life on Earth points to the need for transformative change. Science 2019, 366, eaax3100. [Google Scholar] [CrossRef]
- Klar, N.; Herrmann, M.; Henning-Hahn, M.; Pott-Dörfer, B.; Hofer, H.; Kramer-Schadt, S. Between ecological theory and planning practice: (Re-) Connecting forest patches for the wildcat in Lower Saxony, Germany. Landsc. Urban Plan. 2012, 105, 376–384. [Google Scholar] [CrossRef]
- Zhang, L.; Lin, X.H.; Ge, S.; Zhao, P.; Zhang, M.; Li, Y. Formation Mechanism and Evolution Characteristics of Cultivated Land Carbon Flow Ecological Network in Hubei Province Under “Dual Carbon” Goals. Acta Ecol. Sin. 2025, 45, 1599–1612. (In Chinese) [Google Scholar]
- Zhang, L.X.; Chai, B.; Zhang, Y.; He, W.; Tan, X. Comparative Study of Ecological Networks Based on Gravity Model and Circuit Theory: A Case Study of Jining City. Acta Ecol. Sin. 2025, 45, 1684–1696. (In Chinese) [Google Scholar]
- Huang, J.; Huang, Y.Z. Regional Ecological Network Construction in Wenshan Prefecture Based on InVEST-MSPA. Environ. Monit. Manag. Technol. 2024, 36, 41–46. (In Chinese) [Google Scholar]
- Lian, H.G.; Liu, C.F.; Ni, B.W.; Qu, Z. Ecological Network Construction and Optimization of Protected Area System in Arid Northwest China: A Case Study of Hexi Corridor. Chin. J. Appl. Ecol. 2025, 36, 259–270. [Google Scholar]
- Fortin, M.-J.; Dale, M.R.T.; Brimacombe, C. Network ecology in dynamic landscapes. Proc. R. Soc. B 2021, 288, 20201889. [Google Scholar] [CrossRef]
- Opdam, P.; Steingröver, E.; van Rooij, S. Ecological networks: A spatial concept for multi-actor planning of sustainable landscapes. Landsc. Urban Plan. 2006, 75, 322–332. [Google Scholar] [CrossRef]
- Zhou, Y.; Liu, M.Y.; Wang, L.N.; Yu, J.; Luo, Q. Ecological Restoration Strategy of Territorial Space Based on Comparative Optimization of Ecological Network. Chin. Landsc. Archit. 2024, 40, 43–49. (In Chinese) [Google Scholar]
- Liu, C.F.; Ni, B.W.; Lian, H.G.; He, Y. Resilience Evolution and Enhancement Strategy of Ecological Network in Arid Inland River Basin: A Case Study of Shiyang River Basin. J. Nat. Resour. 2024, 39, 2087–2101. (In Chinese) [Google Scholar]
- She, Y.C.; Chen, C.L.; Mao, S.Z.; Tan, J. Construction and Optimization of Ecological Network in Core Area of Changsha-Zhuzhou-Xiangtan Based on MSPA-Linkage Mapper. For. Grassl. Resour. Res. 2024, 4, 60–69. (In Chinese) [Google Scholar]
- Keeley, A.T.H.; Beier, P.; Gagnon, J.W. Estimating landscape resistance from habitat suitability: Effects of data source and non- linearities. Landsc. Ecol. 2016, 31, 2151–2162. [Google Scholar] [CrossRef]
- Terrado, M.; Sabater, S.; Chaplin-Kramer, B.; Mandle, L.; Ziv, G.; Acuña, V. Model development for the assessment of terrestrial and aquatic habitat quality in conservation planning. Sci. Total Environ. 2016, 540, 63–70. [Google Scholar] [CrossRef]
- Yan, Y.; Chen, X.M.; Xie, Y.W.; Zeng, Z.; Wang, Z.; Xue, X.; Tan, D.; Li, X. Construction of Composite Green Space Ecological Network Under Multi-Objective Orientation: A Case Study of Central Urban Area of Quanzhou. J. Ecol. Rural Environ. 2025, 41, 308–322. (In Chinese) [Google Scholar]
- Pan, Z.H.; Zhou, Y.; Yao, J.; Ning, S.; Luo, Y.; Wang, M. Optimization of Urban Thermal Environment Ecological Network Based on Morphological Spatial Pattern Analysis and Minimum Cumulative Resistance Model. J. Zhejiang AF Univ. 2024, 41, 1085–1093. (In Chinese) [Google Scholar]
- Yang, G.R.; Jiang, G.G.; Zhou, J. Construction and Optimization of Landscape Ecological Pattern in Jialing River Basin Based on ESV-ERI-MCR Evaluation. Bull. Soil Water Conserv. 2024, 44, 124–135. (In Chinese) [Google Scholar]
- Zhang, F.Q.; Wei, X.J.; Xie, M.R.; Zhong, S.; Chen, W.; Xia, Y. Nested Analysis of Ecological Network in Nanchang City Based on Comprehensive Identification of Multi-Scale Ecological Sources. Res. Soil Water Conserv. 2024, 31, 408–418. (In Chinese) [Google Scholar]
- Pili, S.; Serra, P.; Salvati, L. Landscape and the city: Agro-forest systems, land fragmentation and the ecological network in Rome, Italy. Urban For. Urban Green. 2019, 41, 230–237. [Google Scholar] [CrossRef]
- Cunha, N.S.; Magalhaes, M.R. Methodology for mapping the national ecological network to mainland Portugal: Aplanning tool towards a green infrastructure. Ecol. Indic. 2019, 104, 802–818. [Google Scholar] [CrossRef]
- Harvey, E.; Gounand, I.; Ward, C.L.; Altermatt, F. Bridging ecology and conservation: From ecological networks to ecosystem function. J. Appl. Ecol. 2017, 54, 371–379. [Google Scholar] [CrossRef]
- Hernandez, A.; Miranda, M.; Arellano, E.C. Landscape dynamics and their effect on the functional connectivity of a Mediterranean landscape in Chile. Ecol. Indic. 2015, 48, 198–206. [Google Scholar] [CrossRef]
- Yang, W.Y.; Xu, Z.H.; Ye, H.Y.; Li, T. Impact of Road Infrastructure on Ecological Network in Guangdong-Hong Kong-Macao Greater Bay Area. Chin. J. Appl. Ecol. 2024, 35, 1653–1660. [Google Scholar]
- Shen, Z.; Yin, H.W.; Kong, F.H.; Su, J.; Sun, H.; Li, J. Construction and Optimization of Egret Habitat Network in Nanjing Based on Habitat Clustering Analysis and Landscape Corridor Simulation. Acta Ecol. Sin. 2024, 44, 3303–3316. (In Chinese) [Google Scholar]
- Xu, J.; Wang, D.R. Construction and Optimization of Ecological Network in Lanzhou-Xining Urban Agglomeration Based on Adaptive Cycle. Arid Zone Res. 2024, 41, 856–864. [Google Scholar]
- Wang, Z.Y.; Gao, Y.; Li, F.; Cheng, C. Research Progress on Urban Ecological Space Under Territorial Spatial Planning. Chin. Landsc. Archit. 2024, 40, 22–28. (In Chinese) [Google Scholar]
Disclaimer/Publisher’s Note: The statements, opinions and data contained in all publications are solely those of the individual author(s) and contributor(s) and not of MDPI and/or the editor(s). MDPI and/or the editor(s) disclaim responsibility for any injury to people or property resulting from any ideas, methods, instructions or products referred to in the content. |
© 2025 by the authors. Licensee MDPI, Basel, Switzerland. This article is an open access article distributed under the terms and conditions of the Creative Commons Attribution (CC BY) license (https://creativecommons.org/licenses/by/4.0/).

