Abstract
The structural safety of multi-span ultra-high-voltage (UHV) substation gantries is a cornerstone for the reliability and resilience of sustainable energy grids. The wind-resistant design of the structures is complicated by their complex modal behaviors and highly non-uniform wind load distributions. This study proposes a novel hybrid framework that integrates segmented high frequency force balance (HFFB) testing with a multi-modal stochastic vibration analysis, enabling the precise assessment of wind load distribution and dynamic response. Five representative segment models are tested to quantify both mean and dynamic wind loads, a strategy rigorously validated against whole-model HFFB tests. Key findings reveal significant aerodynamic disparities among structural segments. The long-span beam, Segment 5, exhibits markedly higher and direction-dependent responses. Its mean base shear coefficient reaches 4.34 at β = 75°, which is more than twice the values of 1.74 to 2.27 for typical tower segments. Furthermore, its RMS wind force coefficient peaks at 0.65 at β = 60°, a value 2.5 to 4 times higher than those of the tower segments, all of which remained below 0.26. Furthermore, a computational model incorporating structural modes, spatial coherence, and cross-modal contributions is developed to predict wind-induced responses, validated through aeroelastic model tests. The proposed framework accurately resolves spatial wind load distribution and dynamic wind-induced response, providing a reliable and efficient tool for the wind-resistant design of multi-span UHV lattice gantries.
1. Introduction
Under the global imperative to achieve carbon neutrality, the rapid expansion of renewable energy systems, such as wind, solar, and hydropower, has become a cornerstone of sustainable development. However, the geographical disparity between renewable energy generation sites and electricity demand centers necessitates robust, long-distance transmission infrastructure to minimize energy loss and maximize grid efficiency [1,2]. 1000 kV UHV transmission technology plays a pivotal role in enabling sustainable energy integration [3,4,5,6]. As critical nodes in UHV networks, substation gantries support conductors and electrical equipment, ensuring the stability and reliability of renewable energy transmission [7]. UHV substation gantries often adopt multi-span lattice structures, combining high-rise and long-span features to meet operational demands. However, their inherent characteristics, such as low natural frequencies and complex modal distributions, heighten their susceptibility to wind-induced vibrations. Consequently, they face significant risks of structural deformation, fatigue damage, and potential power outages under extreme wind conditions [8]. Addressing these challenges through precise assessment of wind load distribution and wind-induced response is essential not only for structural safety but also for advancing the resilience of sustainable energy infrastructure.
A lattice substation gantry functions as an integrated and multi-span frame, unlike an isolated single-lattice tower. This results in significantly more complex aerodynamic behavior for the gantry structures. However, both the structures share similarities in their lattice-type construction and member-level wind sensitivity. Consequently, the extensive research on wind effects on single-lattice towers, including methodologies such as theoretical analyses, computational fluid dynamics (CFD), and wind tunnel tests, provides a valuable foundation for understanding gantry behavior subjected to the strong wind.
The quasi-steady theory offers a computationally efficient approach for estimating along-wind loads and gust responses of lattice towers [9,10,11,12,13], making it suitable for preliminary design. This method, however, often overlooks cross-wind dynamics and relies on simplified spatial coherence, limiting its accuracy for complex flow around multi-span systems. In contrast, Computational fluid dynamics (CFD) simulations can capture more detailed wind-structure interaction and wake effects [14,15,16,17,18,19], but their application to large-scale lattice structures is often constrained by prohibitive computational costs and challenges in modeling turbulence accurately.
Aeroelastic model testing is regarded as a comprehensive method for assessing overall wind-induced responses, as it captures the synergistic effects between aerodynamic forces and structural dynamics. This technique has been instrumental in systematically examining wind-induced vibrations, including amplitude and frequency under various wind conditions [20,21,22]. Furthermore, it enables the identification of dynamic wind loads through inverse methods and the reassessment of key parameters like drag coefficients [23,24]. And its application extends to complex wind environments, investigating tower-line coupling effects and responses to extreme events such as downbursts [25,26,27]. Beyond single towers, it has also been applied to study the wind-excited performance of UHV substation gantries [28]. Despite its comprehensiveness, aeroelastic testing remains time-consuming, costly, and, most critically, does not directly get the detailed wind load distributions necessary for generalized design applications.
In contrast, HFFB wind tunnel test has been widely recognized for its efficacy in directly measuring global wind loads on scaled models of structures [29]. Researchers have applied HFFB to study the influence of lattice tower geometric parameters, such as member solidity ratio and tower taper ratio on global wind load characteristics, establishing quantitative relationships between structural geometry and wind load coefficients [30,31,32,33,34]. Studies have leveraged HFFB data to develop mode shape corrections and formulate generalized forces for higher modes [35,36,37], significantly improving response predictions. Additionally, HFFB has been employed to investigate the wind load interference effects between adjacent lattice towers in complex tower clusters, measuring the variation in wind-induced forces on target towers with changes in spacing and arrangement of surrounding towers, which provides essential data for the anti-interference design of tower groups [38]. While most studies have concentrated on lattice towers, some recent research has extended the HFFB technique to more complex substation gantry structures. Niu et al. [39] quantified deviations in shape coefficients and dynamic response factors for a 500 kV gantry via HFFB tests, indicating the non-conservative bias of current codes. Tang et al. [40,41] conducted HFFB tests on a one-span substation frame, quantifying aerodynamic coefficients and dynamic response factors under varying terrains and wind directions.
Notably, these methodological developments have provided significant assistance in studying the wind effects on multi-span lattice frames, which are critical for modern substations. However, critical gaps remain in accurately predicting wind load distribution and response of multi-span UHV substation gantries. Existing studies predominantly focus on single-lattice towers, lower-voltage structures such as 500 kV or simplified single-span configurations, while UHV gantries with multi-span lattice frames introduce unique challenges due to their complex modal and wind load distribution. In detail, conventional HFFB testing of whole models often fails to resolve localized load distributions, limiting its utility for optimizing wind-resistance of complex geometries. These gaps underscore the need for a refined methodology that estimates precise wind load distribution of the substation gantry, and hence the wind-induced response.
To address these challenges, this study proposes a hybrid experimental and computational framework to accurately determine wind load distribution and wind-induced responses of multi-span UHV substation gantries. The overall workflow of the proposed hybrid framework is illustrated in Figure 1. Phase I is segmented and global wind load testing. The whole structure is segmented into representative components based on distinct structural characteristics. Five critical segment models are independently tested via the HFFB technique to quantify both mean and dynamic wind loads. Concurrently, HFFB tests on the whole substation gantry model are conducted, wherein directly measured base shear forces and overturning moments are compared with aggregated results derived from segment model data, thereby validating the reliability of the segmented testing methodology. Phase II is computational model development for response prediction. A computational method based on structural stochastic vibration theory is developed. This model integrates mode shapes, spatial coherence, and cross-modal contributions, using the spatially distributed wind loads obtained from Phase I as input. Phase III is validation via aeroelastic model wind tunnel test. The feasibility of the computational framework is rigorously verified by comparing its predictions with experimental outcomes from aeroelastic model tests under identical wind conditions. Through this three phase workflow, the study bridges experimental precision with theoretical rigor, advancing the application of HFFB techniques and delivering a reliable framework for the wind-resistant evaluation of critical UHV infrastructure.
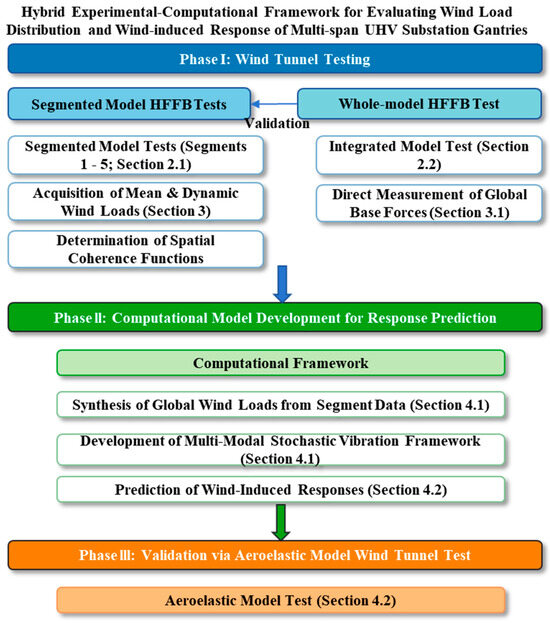
Figure 1.
Flowchart of the proposed hybrid experimental and computational framework for predicting wind load distribution and response of multi-span UHV gantries.
2. HFFB Wind Tunnel Testing
HFFB wind tunnel experiments are conducted on both segment and whole models of a 1000 kV substation gantry in the WD-1 wind tunnel at Wuhan University. The segment model tests enable precise quantification of the wind load distribution across the gantry structure, while the whole model tests provide direct measurements of the base shear force and overturning moment under wind action.
The WD-1 wind tunnel features a test section of 16 m in length with a cross-sectional area of 3.2 m (width) × 2.1 m (height). Wind speeds within the tunnel are continuously adjustable from 1 m/s to 30 m/s.
2.1. Segmented Model Tests
As shown in Figure 2, a 1000 kV substation gantry comprises a 61 m high lattice frame, featuring two 51 m spans. Five representative segments (Segments 1 to 5) are extracted from the 1000 kV substation gantry to serve as prototypes for the test models, as illustrated in Figure 3. Segments 1 and 2 represent the typical tower body sections. Located in the mid-height and upper regions of the main towers, these segments are critical for determining the global base shear and overturning moment of the structure. Segments 3 and 4 represent the critical tower-beam connection zones. These segments are structurally complex, featuring a transition in geometry. This discontinuity in structural form leads to complex, three-dimensional flow patterns and localized concentrations of wind load. Segment 5 represents the long-span beam. This segment is aerodynamically sensitive due to its large slenderness and unique cross-section.
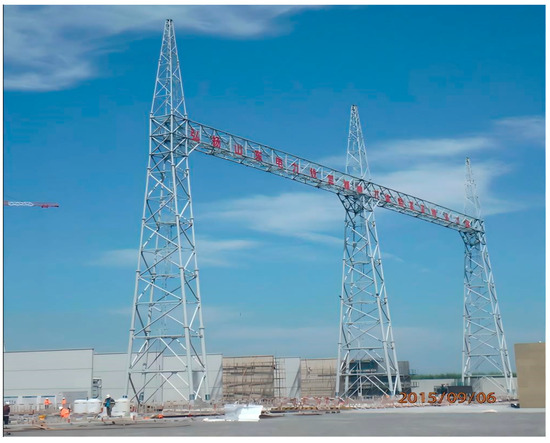
Figure 2.
Prototype of a 1000 kV substation gantry.
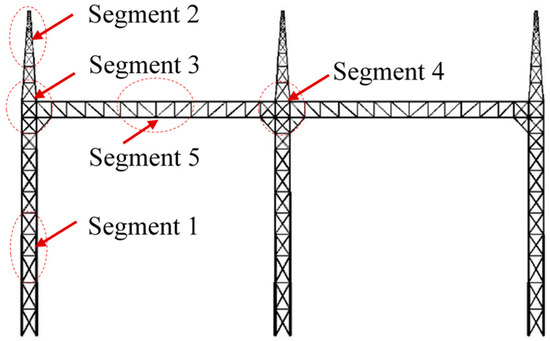
Figure 3.
Typical segment from the whole lattice frame.
These representative segments are subsequently scaled down at a ratio of 1:30 using stainless steel tubes as shown in Figure 4. Figure 5 shows the custom-designed pedestal used to rigidly secure the models within the wind tunnel and defines the wind direction β and local coordinate system, taking Segment 1 as an example. Each segment model underwent independent HFFB testing under a uniform turbulent flow field with a constant wind speed (U = 10.5 m/s) and turbulence intensity (Iu = 0.1) as shown in Figure 6. In the wind tunnel test, base shear forces and overturning moments are measured by an ATI Delta HFFB system, configured with a sampling frequency of 500 Hz and a measurement duration of 60 s for each test case.

Figure 4.
Five segment models: (a) Segment 1; (b) Segment 2; (c) Segment 3; (d) Segment 4; (e) Segment 5.
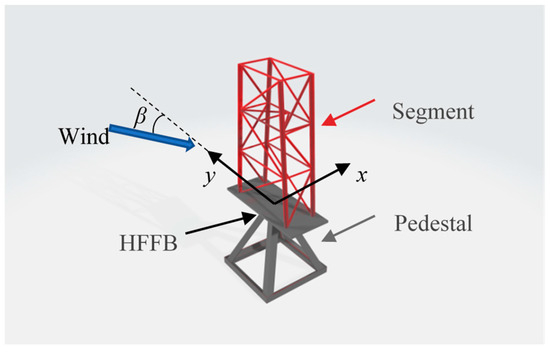
Figure 5.
Schematic of the experimental setup and local coordinate system for the segment model test.
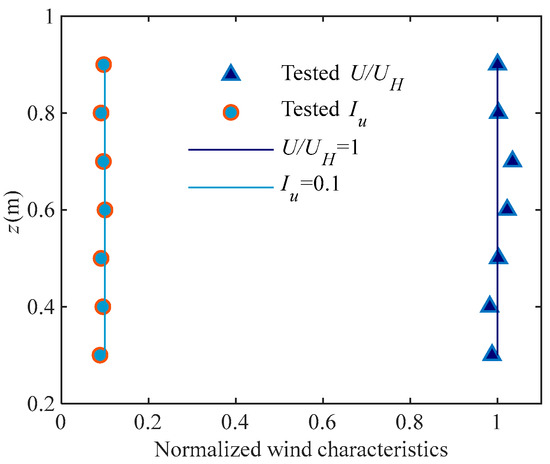
Figure 6.
Turbulence and mean wind velocity profile of the uniform turbulent flow field.
The Reynolds number, based on the diameter of the main leg members, ranges from approximately 3.21 × 10³ to 1.02 × 10⁴ across the models, which resides within the subcritical regime. In this regime, the aerodynamic force coefficients for circular sections remain acceptably stable, and this regime aligns with the common practice in wind tunnel testing for lattice structures [26,34]. It is important to note that all experimental components in this study are performed within this consistent subcritical regime, thereby ensuring valid comparisons and mutual verification among the different methodological components of the proposed hybrid framework. While the flow around isolated circular cylinders may exhibit some Reynolds number sensitivity even in the subcritical regime, the aerodynamic behavior of lattice structures is dominated by strong interference effects among closely spaced members. These complex interactions significantly alter the flow characteristics compared to those of an isolated member, making the precise simulation of Reynolds number effects particularly challenging in such configurations. Consequently, the primary focus of this study remains the development and validation of the hybrid framework under consistent experimental conditions.
2.2. Whole-Model Validation Tests
Through the wind tunnel test of the segment model, the wind load distribution of the substation gantry is determined. The base shear force and overturning moment of the entire structure can be calculated by summing up the wind loads along the height. However, the calculated base shear force and overturning moment values require validation due to potential testing errors caused by three-dimensional flow effects at the top of the model in segment model tests. To address this, a HFFB wind tunnel test of the whole substation gantry model is carried out to directly obtain the base shear force and overturning moment, thereby validating the accuracy, feasibility, and effectiveness of the segment test method.
As depicted in Figure 7, a whole substation gantry model fabricated from stainless-steel tubes is tested by HFFB. The wind direction and global coordinate system are defined as shown in Figure 8. Since the substation gantry is situated in a flat area, this wind tunnel test is conducted in terrain B (exponent α = 0.15) as defined by GB50009–2012 [42]. The target exponential profile is physically generated using a well-established passive simulation technique with spires and roughness elements, and the tested wind profile is presented in Figure 9. As shown in Figure 10, the wind speed power spectral density (PSD) shows a good fit with the Vor Karman PSD. The mean oncoming wind speed at the top of the structure, at a height of 1.22 m, is 9 m/s. The sampling frequency of the HFFB is 500 Hz, and the measurement duration is 60 s for each test case.
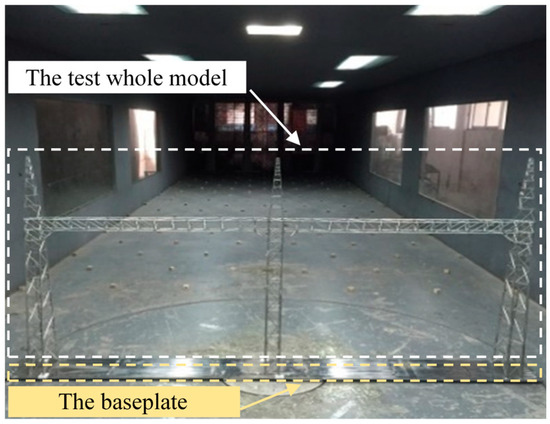
Figure 7.
The whole substation gantry model.
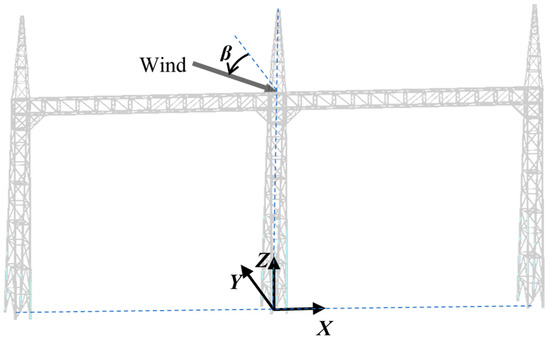
Figure 8.
Wind direction and global coordinate system.
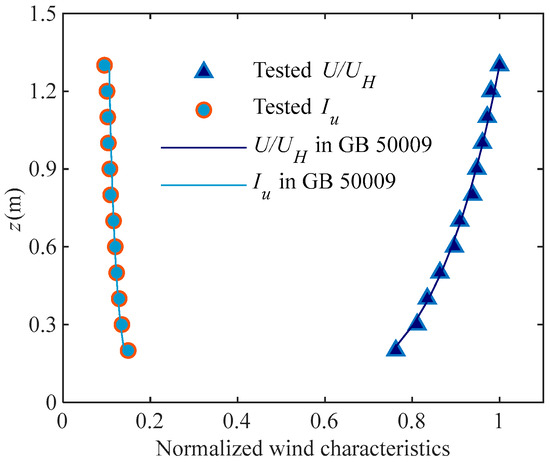
Figure 9.
Turbulence and mean wind velocity profile of terrain B.
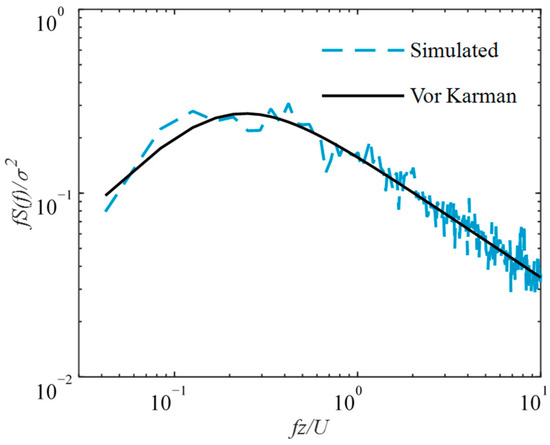
Figure 10.
Normalized wind speed PSD.
3. Analysis of Wind Load Distribution Characteristics
3.1. Static Wind Force Coefficients and Distribution Patterns
The aerodynamic force coefficient serves as an important indicator of how a structure’s geometric configuration governs wind pressure distribution and resultant load effects. This coefficient plays an important role in substation gantry design, particularly for ensuring structural resilience subjected to strong wind. In HFFB wind tunnel test, this aerodynamic characteristic is typically quantified through the base shear coefficient and the overturning moment coefficient, as mathematically defined in Equations (1) and (2):
where is the time history of base shear coefficient; is the time history of base shear; is the air density; is the mean wind speed; is the projected area of the model when the wind direction β = 0°; is the overturning moment coefficient time history; is the overturning moment time history; is the height of the test segment. Then, mean base shear coefficient and mean overturning moment coefficient are derived by taking the average of and .
As illustrated in Figure 11, the general trends of and for each segment are comparable in the corresponding axis. and start near zero, peak at around β = 75°, and then experience a slight decline. Conversely, and show a slight increase, reach the maximum at β = 15°, and then decrease as the wind direction increases. It is important to note that Segments 1 to 4 represent tower segment models with similar rectangular cross-sections, resulting in comparable coefficients across these models. For Segment 5, however, the value of and is significantly higher compared to that of the other segments, primarily due to its long span and smaller windward area in the x-axis. For example, its mean base shear coefficient in x direction of approximately 4.34 at β = 75° is more than double the values for the tower segments (Segments 1–4), which range from 1.74 to 2.27.
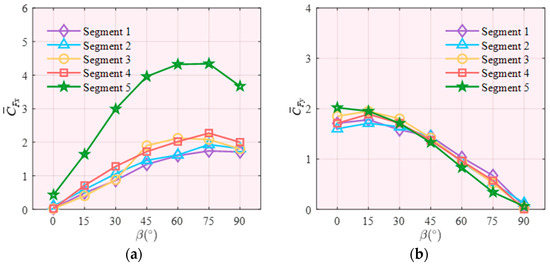
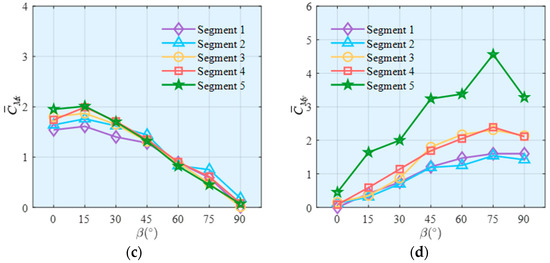
Figure 11.
Mean wind force coefficients: (a) ; (b) ; (c) ; (d) .
HFFB wind tunnel test of the entire substation gantry model is conducted to validate the predictive accuracy of segment model results. Equations (3) and (4) are employed to calculate the mean base shear and overturning moment of the entire structure, respectively:
where is the total height of the substation gantry model; is the mean wind speed on the top of the structure; is the exponent of power law; is the solidity ratio; is the width of the model at height z.
As illustrated in Figure 12, the direct measured results (MR) obtained from the test of the entire model in each wind direction demonstrate a high degree of consistency with the estimated results (ER) derived from Equations (3) and (4) through the tests of segment models. The error is far within ±10%. This consistency validates the effectiveness of the HFFB wind tunnel tests on segment models. In other words, the impacts of three-dimensional flow in these segment tests are deemed to be relatively negligible.
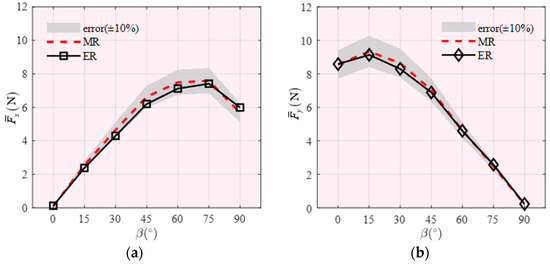
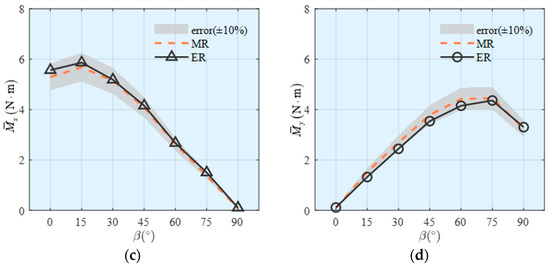
Figure 12.
Comparison of mean base force and bending moment: (a) base shear in x direction; (b) base shear in y direction; (c) overturning moment in x direction; (d) overturning moment in y direction.
3.2. Dynamic Wind Load Characteristics
Dynamic wind loads represent a critical design consideration for substation gantries, as their complex wind-induced vibration patterns and structural stresses profoundly impact long-term integrity and operational reliability. The statistical characterization of wind loads through kurtosis and skewness proves particularly valuable, as these metrics quantify the non-Gaussian distribution characteristics inherent to turbulent wind flow. Kurtosis and Skewness of and are illustrated in Figure 13 and Figure 14. As can be seen in Figure 13, kurtosis of segments is between 2.8 and 3.2, and most of the segments is close to 3, indicating that the distribution of wind force coefficients for the substation gantry segments has tails similar to a Gaussian distribution. As shown in Figure 14, Skewness of all the segments is close to zero, indicating that the distribution of wind force coefficients is symmetric around its mean value. There is no significant directional bias in the force magnitudes. Thus, the combination of kurtosis close to 3 and skewness near 0 allows engineers to simplify design processes by leveraging standard probabilistic models, such as the normal distribution, for estimating wind load on substation gantries.
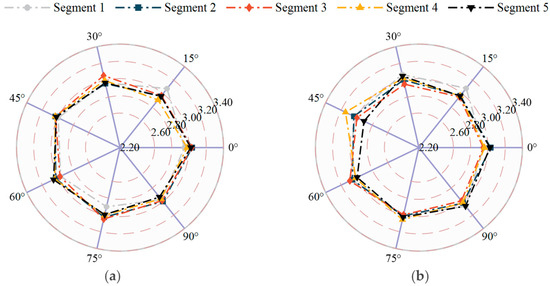
Figure 13.
Kurtosis of base shear coefficient: (a) x; (b) y.
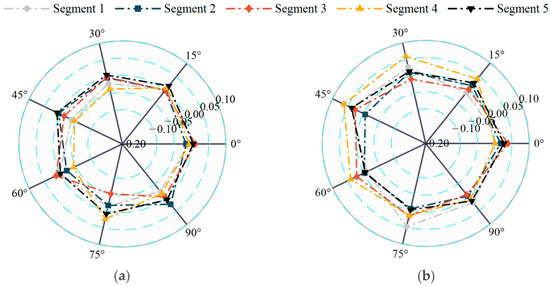
Figure 14.
Skewness base shear coefficient: (a) x; (b) y.
The root mean square (RMS) wind force coefficients are indispensable for assessing dynamic wind loads and ensuring the structural integrity of substation gantries, as they quantify fluctuating aerodynamic forces that drive fatigue, resonance risks, and overall stability under varying wind directions. As illustrated in Figure 15, in the x-axis direction, the RMS wind force coefficients of all segments exhibit a consistent pattern of initial increase followed by stabilization as the wind angle increases to 30°. Notably, Segment 5, the long-span beam, demonstrates markedly heightened aerodynamic sensitivity, with its coefficients in the x-axis direction increasing significantly from β = 45°, peaking at 0.65 at β = 60°, which is substantially higher than those of the tower-type segments. In contrast, Segment 1 displays lower and more stable values, with minimal fluctuations; specifically, the RMS values of Segment 1 remain below 0.16, while those of Segments 2–4 do not exceed 0.26. Furthermore, in the y-axis direction, the RMS values of all segments initially increase with wind angle, reach their maximum at approximately β = 30°, and subsequently undergo a monotonic decrease.
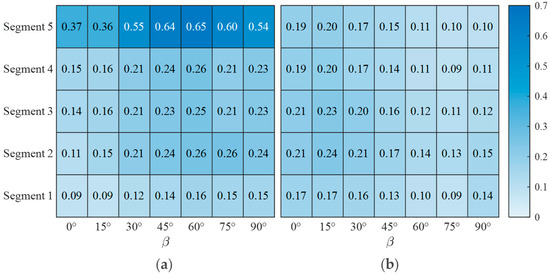
Figure 15.
RMS aerodynamic force coefficient: (a) x; (b) y.
These results underscore not only the strong direction-dependence of Segment 5 but also carry important implications for design practice for substation gantries. The significantly elevated and directionally sensitive dynamic wind loads on the long-span beam suggest that current methods, based on simplified assumptions or derived from single tower configurations, may substantially underestimate wind effects on such multi-span gantries. Such underestimation could lead to potential safety hazards, including inadequate fatigue resistance or unexpected vibration serviceability issues, in addition to possible design inefficiencies resulting from oversimplified load distributions. Consequently, there is a critical need for segment-specific and direction-aware wind load provisions in the design of multi-span gantries, particularly for long-span beams whose behavior affects the overall dynamic response.
The normalized PSD of wind loads plays a critical role in the wind-resistant design of substation gantries by providing insights into the frequency-dependent energy distribution of wind-induced forces. Figure 16 presents the normalized PSD of wind loads on different segments of the substation gantry at β = 0°, demonstrating consistent variation patterns in normalized PSD at varying heights. The abscissa axis, fB/U and fb/U is non-dimensional wind speed, where B represents the windward width at the base of the segment and b denotes the diameter of the segment’s main rod. As can be seen in Figure 16a–e, the along-wind PSD of wind loads exhibit frequency distribution characteristics closely aligned with those of the along-wind PSD of wind velocity, primarily induced by incoming flow turbulence.
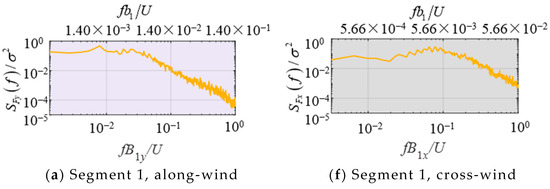
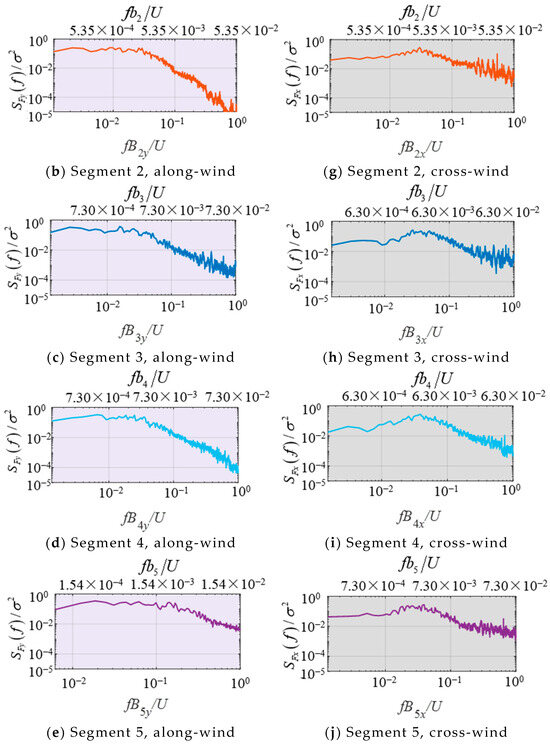
Figure 16.
Normalized wind load PSD of different segments. (a) Segment 1, along-wind; (b) Segment 2, along-wind; (c) Segment 3, along-wind; (d) Segment 4, along-wind; (e) Segment 5, along-wind; (f) Segment 1, cross-wind; (g) Segment 2, cross-wind; (h) Segment 3, cross-wind; (i) Segment 4, cross-wind; (j) Segment 5, cross-wind.
Notably, the cross-wind PSD of wind loads, as illustrated in Figure 16f–j do not display distinct spectral peak features corresponding to vortex shedding frequencies characteristic of isolated single members (as compared to the Strouhal number St or fb/U = 0.2 for circular members). This phenomenon can be attributed to two main factors: (1) The incoming turbulence intensifies three-dimensional flow characteristics and enhances flow field disorder; (2) The three-dimensional interference among structural members in the lattice structures prevents regular vortex shedding from occurring. The mechanism governing cross-wind fluctuating wind loads on lattice structures is not simply the superposition of member wake vortex shedding, but rather originates from large-scale wake structures generated through mutual interference among the wakes of multiple structural members [37,40].
4. A Computational Framework for Wind-Induced Dynamic Response
4.1. A Multi-Modal Stochastic Vibration Framework
Firstly, the substation gantry is simplified into a multi degree of freedom lumped mass model with equivalent structural stiffness. For the multi-degree-of-freedom system, the equations of motion can be expressed as:
where [M], [C] and [K] are the mass, damping, and stiffness matrices of the structure, respectively; , and are the time-history matrices of structural displacement, velocity, and acceleration, respectively; and is the time-history matrix of external loads on the structure.
Using the modal decomposition method, the decoupled motion equation for the j-th generalized coordinate of the structural vibration mode is obtained:
where is damping ratio; is the circular frequency of the j-th mode; is the generalized mass of the j-th mode; and is the generalized load of the j-th mode.
The structural displacement, velocity, and acceleration can be expressed as:
where , , and are the generalized coordinates of displacement, velocity, and acceleration for the j-th mode, respectively; and is the j-th mode shape of the structure. The first four mode shapes of the substation gantry are considered in calculation as illustrated in Figure 17. These mode shapes are obtained through a finite element analysis, where a detailed numerical model of the gantry is developed, incorporating the actual geometric configuration, material properties, and boundary conditions. The modal analysis is then performed to extract the natural frequencies and corresponding mode shapes.
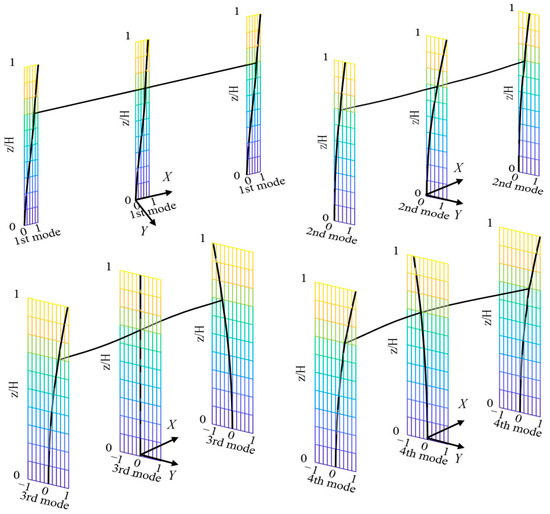
Figure 17.
The first four mode shapes of the substation gantry.
The generalized load spectrum for the substation gantry can be derived from Equation (10):
where and are the auto-spectra of wind loads at positions (zi, xi) and (zk, xk), determined by the HFFB test on the typical segment models in this study. The five typical segments have been selected to represent the aerodynamic characteristics of the entire substation gantry. Based on geometry similarity of substation gantry, the spatial distribution of aerodynamic force spectra across the gantry can be effectively obtained from the results of segment HFFB test. and are the j-th and l-th mode shapes, respectively; is the coherence function of wind loads between (zi, xi) and (zk, xk), determined by the synchronous HFFB test on the same substation gantry [38], as shown in Equation (11):
where ; ; ; ; In along-wind direction: , , , ; In cross-wind direction: ; ; ; .
The displacement and acceleration PSD of the substation gantry are calculated using the complete quadratic combination (CQC) method, as shown in Equations (12) and (13):
where is the frequency response function of the l-th mode, determined by the structural inherent properties:
According to the theory of stochastic structural vibration, the root mean square (RMS) of displacement response and acceleration response can be expressed as:
where and are the displacement and acceleration PSD at (z,x), respectively.
Equations (10)–(16) reveal that the spatial distribution of fluctuating wind loads and , the coherence function of wind loads , and the structural mode shapes and are closely related to the generalized loads, directly influencing the accuracy of the calculated wind-induced vibration responses. This study employs HFFB wind tunnel test of segment models to obtain the spatial distribution of fluctuating wind loads. The generalized loads for each mode are computed, enabling precise wind-induced response analysis by Equation (10). This method accounts for contributions from multiple modes and cross-modal terms, ensuring high accuracy in evaluating wind-induced responses for complex multi-span substation gantries with both tall and long-span characteristics.
4.2. Experimental Validation Against Aeroelastic Benchmarking
To validate the proposed computational method, the predicted wind-induced responses of the substation gantry are rigorously benchmarked against measurements from aeroelastic model tests as shown in Figure 18, the detailed description of which can be found in the previously published work [28]. The geometric and dynamic characteristics of the computational model are fully consistent with those of the aeroelastic model. This comparative analysis provides a direct performance evaluation of the computational framework under realistic wind conditions. Aerodynamic damping ratios, identified from the aeroelastic model test data, are incorporated into the computational framework to ensure consistent calculation conditions. Figure 19 illustrates the configuration of measurement points on the aeroelastic model, which includes key positions at the top of tower a and tower b (i.e., Ya,H, Yb,H) and mid-height (i.e., Ya,0.7H, Yb,0.7H) of the structure, as well as cross-wind measurement points (i.e., Xa,H, Xa,0.7H).
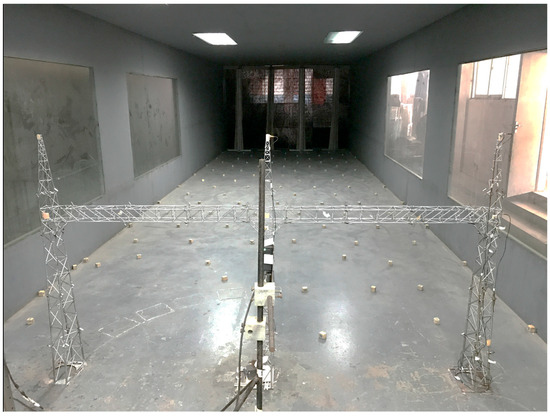
Figure 18.
Wind tunnel test for the UHV substation gantry aeroelastic model.
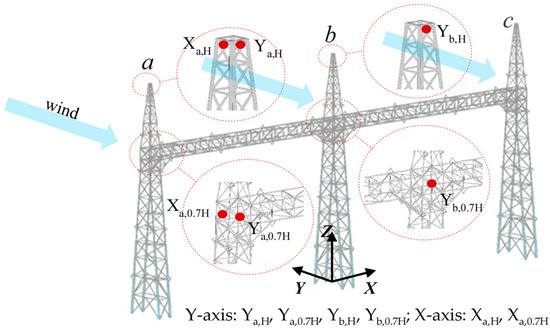
Figure 19.
Configuration of the measuring points of the aeroelastic model.
Figure 20 provides a direct comparative analysis between calculated acceleration responses (denoted as AH, derived from the HFFB-based methodology) and experimentally measured values (denoted as AAM obtained through aeroelastic model testing) at specified monitoring points under varying wind speeds. The AH and AAM results demonstrate close agreement in both response magnitude and variation trend, particularly under high wind speed conditions. This agreement is quantified at the top of the structure, where predictions deviate by less than ±4% from the measured values. Furthermore, critical insights into wind-induced structural responses can be extracted from comparative data. Notably, the along-wind acceleration responses at the top of the central tower (Yb,H) and side tower (Ya,H) exhibit nearly identical values. The cross-wind responses at the top (Xa,H) and mid-height (Xa,0.7H) of the side tower exhibit approximately 50% lower magnitudes compared to their along-wind counterparts; however, their relative contribution to overall structural responses remains significant. Cross-wind contribution to structural responses remains non-negligible, necessitating careful consideration in design optimization.
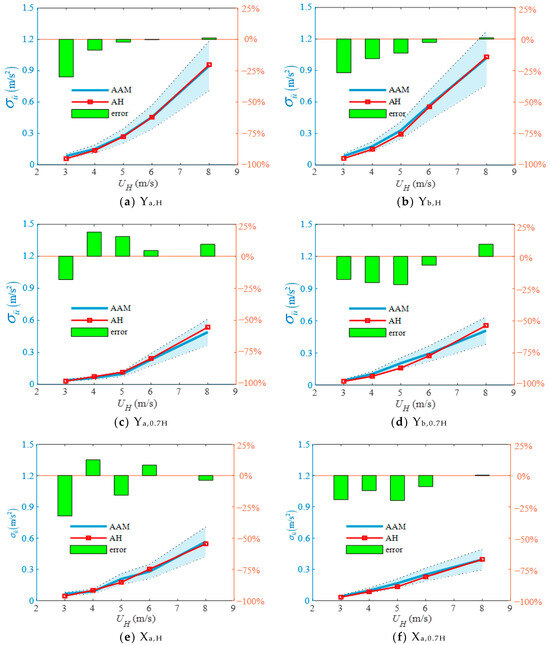
Figure 20.
with ±25% error margin, dotted line with light blue shading, in typical position: (a) Ya,H; (b) Yb,H; (c) Ya,0.7H; (d) Yb,0.7H; (e) Xa,H; (f) Xa,0.7H.
The close alignment between AH and AAM validates the accuracy of the proposed method. The minor discrepancies observed, which are more pronounced in relative terms at low wind speeds, primarily arise from several physical factors not fully captured by the linear computational framework. These include a less favorable signal-to-noise ratio in measurements, the fact that aerodynamic damping is too small to be accurately identified, and challenges in accurately simulating the wind field at low speeds. Nevertheless, the overall consistency confirms the robustness of integrating segment-based HFFB data with stochastic vibration theory for predicting wind-induced responses in complex multi-span gantries. This approach effectively extends the applicability of HFFB techniques to scenarios where whole-model testing is impractical to obtain the wind load distribution of the structure, providing a reliable tool for optimizing the wind-resistant design of critical substation infrastructure.
5. Conclusions
This study presents a hybrid experimental and computational framework for evaluating wind load distribution and dynamic response of multi-span UHV substation gantries, integrating segment-based HFFB wind tunnel testing with stochastic vibration analysis. The proposed methodology provides essential insights for securing the wind resilience of UHV transmission systems, which are important for the development of sustainable energy grids. The main conclusions are summarized as follows:
The segmented HFFB testing approach demonstrates high accuracy in capturing wind load distributions. Validation against whole-model tests shows that the aggregated base shear forces and overturning moments from segment data agree with direct measurements within a margin of ±10% across all wind directions, confirming the reliability of the segmented approach.
Significant disparities in wind load characteristics are identified among different structural segments. The long-span beam segment, Segment 5 exhibits markedly higher and direction-dependent responses than tower segments. Its mean base shear coefficient of approximately 4.34 at β = 75° is more than double the value for the tower segments (Segments 1–4), which ranges from 1.74 to 2.27. Furthermore, Segment 5 exhibits a markedly higher dynamic response, with its RMS wind force coefficient peaking at 0.65 at β = 60° in x direction. This value is 2.5 to 4 times greater than those of the tower segments, all of which remained below 0.26. These pronounced differences underscore the critical necessity for segment-specific wind-resistant design strategies on substation gantries.
Dynamic analysis reveals near-Gaussian distributions of wind load fluctuations, with kurtosis values between 2.8 and 3.2 and skewness values close to 0. This simplifies probabilistic modeling in design. The cross-wind spectra do not exhibit clear vortex-shedding peaks, indicating that wake interference rather than isolated member shedding dominates the load mechanism.
The proposed multi-modal computational framework, integrating spatially coherent wind loads and mode shapes, enables accurate prediction of wind-induced responses. Validation against aeroelastic test results demonstrates a high level of agreement, with structural top response predictions deviating by less than ±4% from measured values, supporting the method’s applicability for complex lattice structures.
The hybrid methodology provides a practical and efficient alternative to aeroelastic testing and extends the application of HFFB techniques to complex multi-span spatial structures. It offers refined input for the wind-resistant design and optimization of multi-span gantries, and can be adapted to other large-scale lattice infrastructures subjected to the strong wind.
Author Contributions
Conceptualization, F.L., L.Z. and H.J.; Methodology, F.L. and L.Z.; Software, F.L. and Y.W.; Validation, Y.W., X.J. and L.F.; Formal analysis, F.L. and Y.W.; Investigation, F.L. and Y.W.; Resources, F.L., L.Z. and H.J.; Data curation, F.L. and X.P.; Writing—original draft, F.L. and Y.W.; Writing—review and editing, F.L., L.Z., X.J. and X.P.; Visualization, F.L. and Y.W.; Supervision, L.Z. and H.J.; Project administration, F.L.; Funding acquisition, F.L. and L.Z. All authors have read and agreed to the published version of the manuscript.
Funding
This research was funded by the Youth Natural Science Foundation of Zhejiang University of Science and Technology (Grant No. 2025QN028) and National Natural Science Foundation of China (Grant No. 52478556).
Institutional Review Board Statement
Not applicable.
Informed Consent Statement
Not applicable.
Data Availability Statement
The data presented in this study are available on request from the corresponding author.
Conflicts of Interest
The authors declare no conflicts of interest.
Nomenclature
| projected area of the model | |
| windward width at the base of the segment | |
| windward width of the model at height z | |
| average windward width of two segments | |
| diameter of the segment’s main rod | |
| [C] | damping matrix of the structure |
| time history of base shear coefficient | |
| mean base shear coefficient | |
| time history of overturning moment coefficient | |
| mean overturning moment coefficient | |
| coherence function of wind loads | |
| Parameters of the coherence function, n = 1, 2, 3, 4 | |
| time history of base shear | |
| natural frequency | |
| total height of the substation gantry model | |
| frequency response function for the l-th mode | |
| height of the test segment | |
| turbulence intensity of incoming flow | |
| [K] | stiffness matrix of the structure |
| [M] | mass matrix of the structure |
| generalized mass of the j-th mode | |
| time-history matrix of external loads on the structure | |
| generalized load of the j-th mode | |
| generalized coordinates of displacement for the j-th mode | |
| generalized coordinates of velocity for the j-th mode | |
| generalized coordinates of acceleration for the j-th mode | |
| solidity ratio the substation gantry at height z | |
| auto-spectral density of the wind load at location (z, x) | |
| generalized load spectrum | |
| displacement spectral density of the substation gantry at location (z, x) | |
| acceleration spectral density of the substation gantry at location (z, x) | |
| mean wind speed of the incoming flow | |
| mean wind speed on the top of the structure | |
| time-history matrix of structural displacement | |
| time-history matrix of structural velocity | |
| time-history matrix of structural acceleration | |
| average height of two segments | |
| terrain roughness exponent | |
| wind direction | |
| horizontal distance between two segments | |
| vertical distance between two segments | |
| structural damping ratio | |
| air density | |
| root mean square of displacement response at location (z, x) | |
| root mean square of acceleration response at location (z, x) | |
| structural mode shape matrix of the j-th mode | |
| circular frequency of the j-th mode |
References
- Huang, G.; Wu, G.; Guo, Y.; Liang, M.; Li, J.; Dai, J.; Yan, X.; Gao, G. Risk assessment models of power transmission lines undergoing heavy ice at mountain zones based on numerical model and machine learning. J. Clean. Prod. 2023, 415, 137623. [Google Scholar] [CrossRef]
- Huang, G.; Yan, B.; Guo, Y.; Zhang, B.; Wu, G. Experimental study on dynamic response characteristics of isolated-span transmission lines after ice-shedding. High Volt. 2023, 8, 196–208. [Google Scholar] [CrossRef]
- Humpert, C. Long distance transmission systems for the future electricity supply—Analysis of possibilities and restrictions. Energy 2012, 48, 278–283. [Google Scholar] [CrossRef]
- Liang, Z.; Li, Y.; Hu, H.; Jia, J. Design of UHV AC transmission line in China. Eur. Trans. Electr. Power 2012, 22, 4–16. [Google Scholar] [CrossRef]
- Wei, W.; Wu, X.; Li, J.; Jiang, X.; Zhang, P.; Zhou, S.; Zhu, H.; Liu, H.; Chen, H.; Guo, J.; et al. Ultra-high voltage network induced energy cost and carbon emissions. J. Clean. Prod. 2018, 178, 276–292. [Google Scholar] [CrossRef]
- Wang, Y.; Zhen, J.; Pan, H. Ultra-high-voltage construction projects and total factor energy efficiency: Empirical evidence on cross-regional power dispatch in China. Sustainability 2024, 16, 8083. [Google Scholar] [CrossRef]
- Wu, Y.; Chen, H.; Li, B.; Fang, J. Design and research of UHV AC substation. Eur. Trans. Electr. Power 2012, 22, 17–32. [Google Scholar]
- Kempner, L., Jr. Substation Structure Design Guide; American Society of Civil Engineers: Reston, VA, USA, 2008. [Google Scholar]
- Edgar, T.H.; Sordo, E. Structural behaviour of lattice transmission towers subjected to wind load. Struct. Infrastruct. Eng. 2017, 13, 1–14. [Google Scholar] [CrossRef]
- Holmes, J.D. Along-wind response of lattice towers: Part I—Derivation of expressions for gust response factors. Eng. Struct. 1994, 16, 287–292. [Google Scholar] [CrossRef]
- Holmes, J.D. Along-wind response of lattice towers—II Aerodynamic damping and deflections. Eng. Struct. 1996, 18, 483–488. [Google Scholar] [CrossRef]
- Holmes, J.D. Along wind response of lattice towers—III Effective load distributions. Eng. Struct. 1996, 18, 489–494. [Google Scholar] [CrossRef]
- Calotescu, I.; Solari, G. Alongwind load effects on free-standing lattice towers. J. Wind Eng. Ind. Aerodyn. 2016, 155, 182–196. [Google Scholar] [CrossRef]
- Li, J.; Yang, S.; Hao, J.; Gao, G.; Wang, F.; Bai, H.; Zhao, G.; Li, Y.; Xue, X. Advances and applications of wind engineering in exceptional terrain. J. Traffic Transp. Eng. 2024, 11, 1023–1209. [Google Scholar] [CrossRef]
- Yao, J.; Tu, Z.; Xu, H. Numerical simulation investigation of wind field characteristics and acceleration effects over V-shaped hills. Sustainability 2024, 16, 9274. [Google Scholar] [CrossRef]
- Allegrini, J.; Maesschalck, J.; Alessi, G.; Glabeke, G.; Christophe, J.; van Beeck, J. Porous and geometry-resolved CFD modelling of a lattice transmission tower validated by drag force and flow field measurements. Eng. Struct. 2018, 168, 462–472. [Google Scholar] [CrossRef]
- Zhang, D.; Song, X.; Deng, H.; Hu, X.; Ma, X. Experimental and numerical study on the aerodynamic characteristics of steel tubular transmission tower bodies under skew winds. J. Wind Eng. Ind. Aerodyn. 2021, 214, 104678. [Google Scholar] [CrossRef]
- Hadane, A.; Redford, J.A.; Gueguin, M.; Hafid, F.; Ghidaglia, J.M. CFD wind tunnel investigation for wind loading on angle members in lattice tower structures. J. Wind Eng. Ind. Aerodyn. 2023, 236, 105397. [Google Scholar] [CrossRef]
- Liu, M.; Wu, S.; Guan, W.; Zhang, C.; Xie, Z. Wind loads on square lattice towers with tubular members based on wind tunnel test and numerical simulation. Phys. Fluids 2024, 36, 127129. [Google Scholar] [CrossRef]
- Lou, W.; Sun, B.; Tang, J. Wind tunnel test and numerical computation on wind-induced vibration for tall lattice tower. J. Vib. Eng. 1996, 9, 108–112. (In Chinese) [Google Scholar]
- Deng, H.; Si, R.; Hu, X.; Chen, Q. Wind tunnel test on aeroelastic model of UHV latticed transmission tower. J. Tongji Univ. (Nat. Sci.) 2010, 38, 673–678. (In Chinese) [Google Scholar]
- Yao, J.; Shen, G.; Tu, Z.; Chen, Y.; Lou, W. Wind tunnel tests of an aeroelastic model of a long-span transmission tower. Sustainability 2022, 14, 11613. [Google Scholar] [CrossRef]
- Zhang, Q.; Fu, X.; Lai, T.; Ren, L. Wind load identification of lattice towers using multi-source heterogeneous monitoring data. J. Wind Eng. Ind. Aerodyn. 2023, 236, 105402. [Google Scholar] [CrossRef]
- Zhang, W.; Li, C.; Xiao, Y.; Liu, G. Reconstruction of dynamic wind forces on a transmission steel lattice tower using aeroelastic wind tunnel test data. Eng. Struct. 2023, 275, 115167. [Google Scholar] [CrossRef]
- Liang, S.; Zou, L.; Wang, D.; Cao, H. Investigation on wind tunnel tests of a full aeroelastic model of electrical transmission tower-line system. Eng. Struct. 2015, 85, 63–72. [Google Scholar] [CrossRef]
- Xie, Q.; Cai, Y.; Xue, S. Wind-induced vibration of UHV transmission tower line system: Wind tunnel test on aero-elastic model. J. Wind Eng. Ind. Aerodyn. 2017, 171, 219–229. [Google Scholar] [CrossRef]
- Alawode, K.J.; Azzi, Z.; Elawady, A.; Chowdhury, A.G. Dynamic properties of an aeroelastic transmission tower subjected to synoptic and downburst-like outflows. J. Wind Eng. Ind. Aerodyn. 2023, 242, 105557. [Google Scholar] [CrossRef]
- Li, F.; Chen, Y.; Zou, L.H.; Song, J.; Liang, S.G. Performance of wind-excited 1000 kV substation gantry by aeroelastic model wind tunnel test. Wind Struct. 2021, 33, 331–341. [Google Scholar]
- Boggs, D.W. The past, present and future of high-frequency balance testing. Wind Struct. 2014, 18, 323–345. [Google Scholar] [CrossRef]
- Prud’homme, S.; Legeron, F.; Langlois, S. Calculation of wind forces on lattice structures made of round bars by a local approach. Eng. Struct. 2018, 156, 548–555. [Google Scholar] [CrossRef]
- Zhou, Q.; Ma, B.; Zhu, Q.; Zhang, H. Investigation on wind loads on angle-steel cross-arms of lattice transmission towers via direct force measurement. J. Wind Eng. Ind. Aerodyn. 2019, 191, 117–126. [Google Scholar] [CrossRef]
- Zhou, Q.; Zhang, H.; Ma, B.; Huang, Y. Wind loads on transmission tower bodies under skew winds with both yaw and tilt angles. J. Wind Eng. Ind. Aerodyn. 2019, 187, 48–60. [Google Scholar] [CrossRef]
- Zhou, Q.; Zhao, L.; Zhu, Q.; Zhu, Y. Mean wind loads on equilateral triangular lattice tower under skewed wind loading. J. Wind Eng. Ind. Aerodyn. 2021, 208, 104467. [Google Scholar] [CrossRef]
- Li, Y.; Li, Z.; Yan, B.; Yan, Z. Wind forces on circular steel tubular lattice structures with inclined leg members. Eng. Struct. 2017, 153, 254–263. [Google Scholar] [CrossRef]
- Holmes, J.D. Mode shape corrections for dynamic response to wind. Eng. Struct. 1987, 9, 210–212. [Google Scholar] [CrossRef]
- Zou, L.; Shi, T.; Song, J.; Cai, C. Application of the high-frequency base balance technique to tall slender structures considering the effects of higher modes. Eng. Struct. 2017, 151, 1–10. [Google Scholar] [CrossRef]
- Zou, L.; Liang, S.; Li, Q.S.; Zhao, L.; Ge, Y. Investigation of 3-D dynamic wind loads on lattice towers. Wind Struct. 2008, 11, 323–340. [Google Scholar] [CrossRef]
- Li, F.; Zou, L.; Song, J.; Liang, S.; Chen, Y. Investigation of the spatial coherence function of wind loads on lattice frame structures. J. Wind Eng. Ind. Aerodyn. 2021, 215, 104675. [Google Scholar] [CrossRef]
- Niu, H.; Kong, K.; Chen, Y.; Chen, Z. 500 kV whole combined substation framework shape factor of wind tunnel test and dynamic response factor analysis. J. Hunan Univ. 2015, 42, 80–87. [Google Scholar]
- Tang, H.; Li, F.; Zhi, X.; Zhao, J. Wind load characteristics and effects of 1000kV UHV substation frame based on HFFB. Wind Struct. 2024, 38, 477–492. [Google Scholar]
- Li, F.; Tang, H.; Zhi, X. Wind load characteristics of 1000 kV UHV substation frame. J. Harbin Inst. Technol. 2021, 53, 129–135. (In Chinese) [Google Scholar]
- GB 50009; Load Code for Design of Building Structures. China Architecture & Building Press: Beijing, China, 2012. (In Chinese)
Disclaimer/Publisher’s Note: The statements, opinions and data contained in all publications are solely those of the individual author(s) and contributor(s) and not of MDPI and/or the editor(s). MDPI and/or the editor(s) disclaim responsibility for any injury to people or property resulting from any ideas, methods, instructions or products referred to in the content. |
© 2025 by the authors. Licensee MDPI, Basel, Switzerland. This article is an open access article distributed under the terms and conditions of the Creative Commons Attribution (CC BY) license (https://creativecommons.org/licenses/by/4.0/).