Article

Determination of Typologies of Andean Suburban Agroecosystems in Southern Ecuador

1
Facultad de Ciencias Agropecuarias, Campus Yanuncay, Universidad de Cuenca, Cuenca EC010114, Ecuador
2
Departamento de Recursos Hídricos y Ciencias Ambientales, Universidad de Cuenca, Cuenca EC010207, Ecuador
3
Facultad de Ciencias Exactas y Naturales, Universidad Técnica Particular de Loja, San Cayetano Alto s/n, Loja EC1101608, Ecuador
4
Sede Matriz Cuenca, Universidad Politécnica Salesiana, Calle Vieja 12-30 y Elia Liut, Cuenca EC010105, Ecuador
*
Authors to whom correspondence should be addressed.
Sustainability 2025, 17(21), 9760; https://doi.org/10.3390/su17219760
Submission received: 24 August 2025 / Revised: 24 October 2025 / Accepted: 27 October 2025 / Published: 1 November 2025
(This article belongs to the Section Sustainable Agriculture)

Abstract

The identification of producer typologies is a crucial tool for understanding the heterogeneity of agroecosystems and designing targeted policies. Andean agroecosystems, particularly those in rapidly suburbanizing areas, have been understudied in this regard, creating a critical knowledge gap. This study addressed this void by determining the typologies of smallholder agroecosystems in the suburban periphery of Cuenca, Ecuador, by applying an unsupervised machine learning technique, Partitioning Around Medoids (PAM) Clustering, to survey data from 293 farmers. Our analysis revealed three distinct typologies, highlighting a socio-economic and productive gradient defined by income sources, market access, and agrochemical use. The typologies range from economically vulnerable households to more commercially oriented and environmentally sustainable ones, underscoring the complex interplay between livelihoods strategies and environmental management. This research provides one of the first empirical typologies of suburban Andean agroecosystems, demonstrating the value of unsupervised learning for capturing farm heterogeneity in data-scarce contexts. The findings offer a robust evidence base for moving beyond one-size-fits-all approaches, enabling the design of differentiated agricultural and territorial policies that enhance sustainability, equity, and resilience at the rural–urban interface.

1. Introduction

Suburbanization is a dynamic, multidimensional process driving profound social, economic, and environmental transformations, which in turn reshape the functional and spatial structure of urban areas [1]. This process has spurred residential expansion into formerly agricultural areas at the urban fringe [2]. This zone, often termed the rural–urban interface, constitutes a complex landscape molded by a multitude of socioeconomic forces [3]. Therefore, suburban spaces have presented both opportunities and challenges for farmers. For instance, the emergence of a new customer base—typically urban residents—has provided farmers with new opportunities for higher-value crops. Consequently, farmers have demonstrated remarkable adaptability by adjusting their production systems to capitalize on emerging economic opportunities in the urban periphery [4]. This rural dependency on urban areas has been emphasized by Bock [5], who argues that urban dynamics will define rural spaces, and that rural areas will increasingly depend on their ability to meet urban needs. Suburbanization is a global phenomenon observed across diverse geographical contexts, including Latin American cities. Here, demographic explosions have led to farmers concentrating around urban peripheries seeking subsistence [6].
Traditionally, agroecosystems have been regarded as complex ecological systems modified by humans to produce food, fiber, and other agricultural products. Their complexity stems primarily from the interaction between socioeconomic and ecological processes [7]. Various definitions of agroecosystems exist, depending on their composition and purpose [8]. However, a general and widely accepted definition characterizes them as systems of biological and natural resources managed by humans, primarily for food production but also for other socially valuable non-food goods and environmental services [9]. Gliessman [10] maintains that an agroecosystem is created when humans manipulate and alter an ecosystem to establish agricultural production. The diversity of agroecosystems exhibits complexity and stability similar to that of natural systems. Therefore, understanding this diversity—characterized by a mosaic of interconnected elements shaped by resource flows interacting with local rural cultural practices—forms the foundation for sustainable agroecosystem management [11]. The structure and function of agroecosystems are largely determined by local context, including the interaction between ecological conditions (encompassing biological, geological, and chemical factors) and social factors such as farmers’ economic needs, cultural and spiritual values, social structure, and technology [12]. Humans play a crucial role within agroecosystems. Consequently, to fully characterize an agroecosystem or identify potential alternative management options, any agroecosystem analysis must incorporate indicators of the economic, cultural, and social forces that shape human activities [13].
Approximately 28% to 30% of the Earth’s land surface is occupied by agricultural land (cropland and pastures). This cultivated area extends across all continents, covering roughly 1.3 billion hectares and encompassing diverse agroecosystems—from large-scale systems to small farm plots and fragmented cultivation zones [8]. Small agroecosystems, typically represented by smallholdings or family farms, dominate rural landscapes across the Global South while persisting in the Global North [14].
Rural households employ heterogeneous livelihood strategies conditioned by environment-specific constraints and opportunities. Agroecological systems, market structures, and cultural contexts thus generate regionally distinct land-use configurations and farm management approaches [15]. Significant intra-community variation exists among households due to differential resource endowments, production orientations, ethnic backgrounds, educational attainment, experiential knowledge, and managerial capacities [16], yielding diverse natural resource governance approaches. Policy frameworks aiming to assist resource-poor farmers must therefore prioritize understanding this multi-scale variability—occurring within farms, between farm systems, and across geographic locations [15]. In this context, capturing agroecosystem heterogeneity through farm typology analysis is crucial for designing sustainable policies and enhancing technology adoption [17]. Particularly, understanding the variability of Andean agroecosystems—characterized by smallholder farms—is essential for accurately representing their reality.
A farm or agricultural holding constitutes the basic unit in typology analysis [18]. Farm typologies serve as the foundation for analyzing farm performance and rural livelihoods [19]. However, agroecosystem typologies have been employed for diverse purposes. Sarker et al. [20] summarize several applications, including: studying greenhouse and climate-smart technology adoption, assessing food security, evaluating resource efficiency, identifying potential adopters of alternative farming methods, and classifying farm categories. These authors emphasize that typologies form the basis for developing appropriate interventions and policies. Nevertheless, farm-level typological analyses are essential for developing tailored management strategies for these agricultural production systems. Research on smallholder farmers remains notably scarce in Ecuador’s Andean highlands. Vanegas et al. [21], in their examination of peasant agriculture in southern Ecuador’s Andes, demonstrate that understanding Andean smallholder systems requires deeper, more inclusive analytical frameworks.
The development of typologies serves as a methodological tool to understand agroecosystem complexity by providing a simplified representation of their diversity through classification into homogeneous groups based on multiple characteristic combinations [19]. Various approaches exist for developing typologies [22]. At a general level, however, Maton et al. [23] distinguish two classes of farm typologies: those employing positivist methods based on statistical data analysis, and those using constructivist approaches grounded in expert knowledge. Most studies related to farm typology construction have utilized positivist methodologies [24].
The criteria defining agroecosystem or farm types may be derived from local stakeholders’ knowledge or directly from farmer survey data [24]. Traditional data analysis has undergone a significant transition, with automated statistical techniques largely replacing manual analysis. Currently, multivariate statistical techniques are most frequently employed for typology construction. However, typologies remain constrained by study objectives, data availability, and sample size [19]. Regarding statistical techniques for typology development, unsupervised machine learning methods—particularly clustering approaches—are widely used. Graskemper et al. [25] provide a synthesis of studies applying clustering techniques to develop farmer typologies across different world regions. Unlike supervised learning, unsupervised learning does not predict outcomes but rather identifies previously unrecognized patterns in data. These exploratory methods can subsequently inform predictive model development [26].
Therefore, the present study addresses a critical gap in both the scientific and applied literature by characterizing the diversity of Andean suburban agroecosystems and identifying farm typologies that reflect distinct socioeconomic, productive, and environmental profiles. While most typology research in Ecuador has focused on rural or commercial farming systems, the suburban scale remains largely undocumented despite its growing importance for urban food security and territorial planning. This study contributes to filling that void by providing an empirical basis for understanding how suburban households organize their production, manage natural resources, and integrate into urban markets. Accordingly, this study aimed to (i) characterize production agroecosystems in suburban areas near Cuenca city in the Southern Ecuadorian Andes, and (ii) determine the principal smallholder farm typologies based on livelihood systems using an unsupervised machine learning method.

2. Materials and Methods

2.1. Study Area

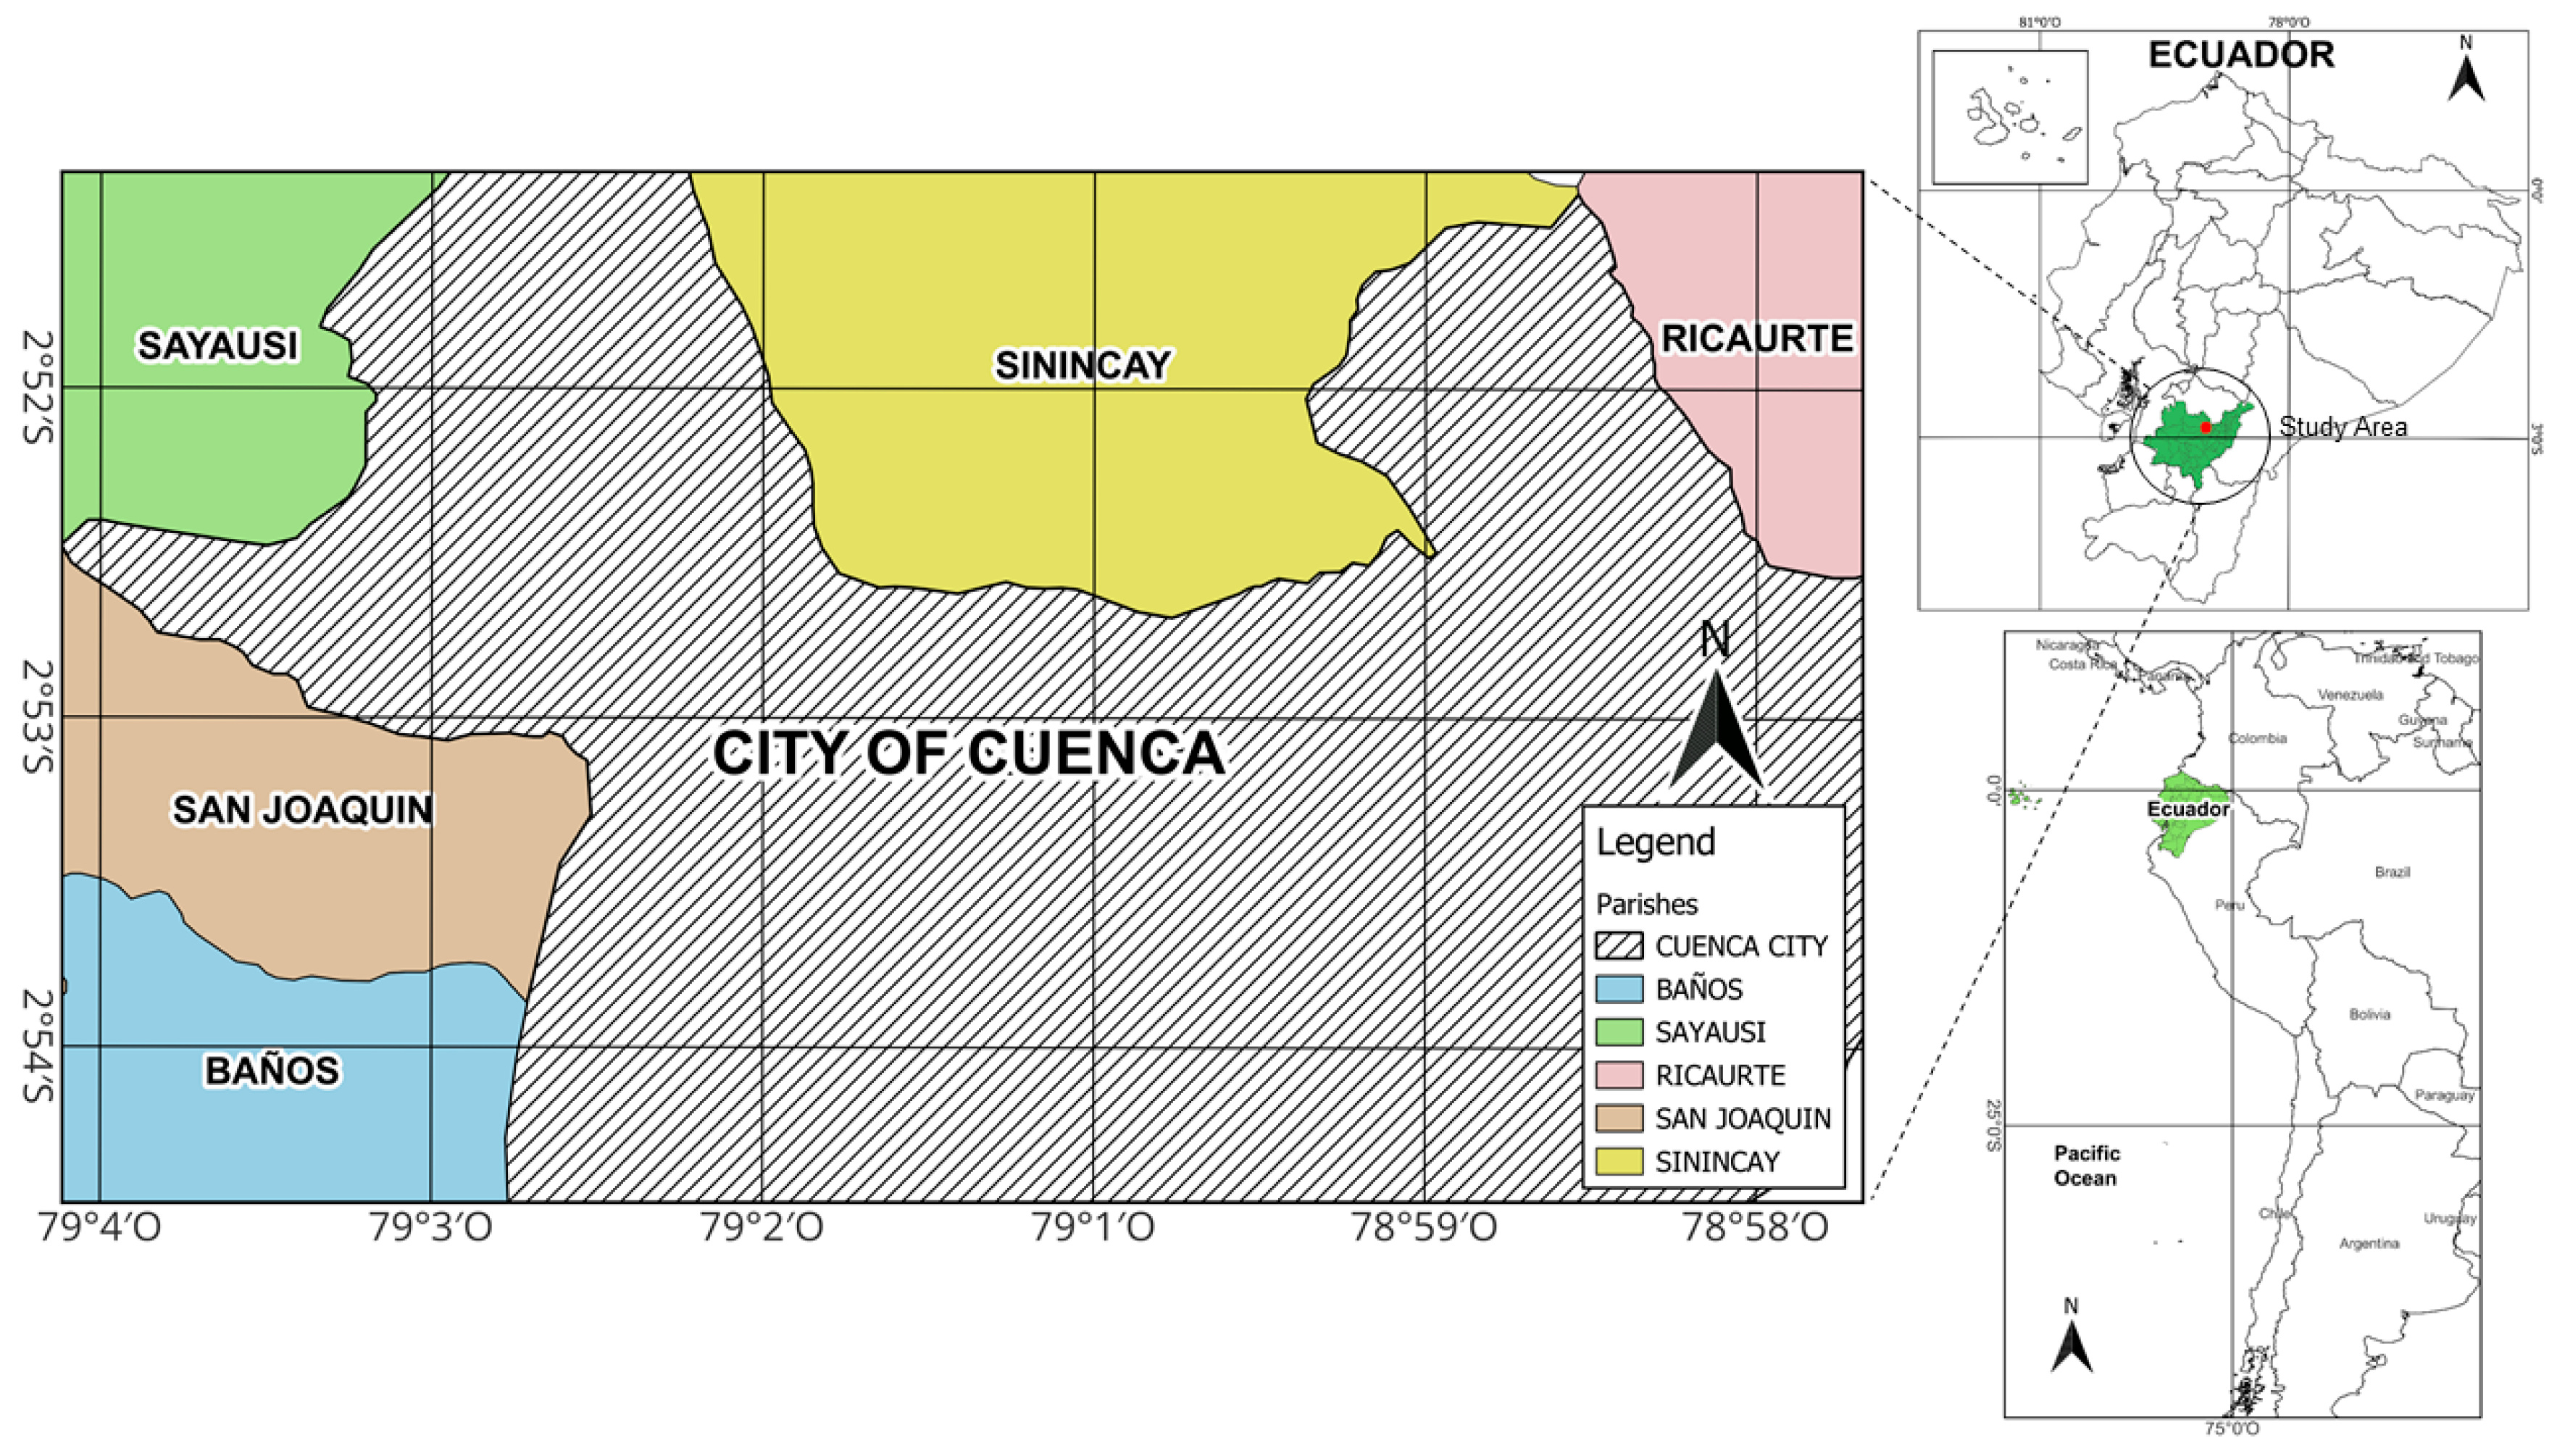
The city of Cuenca (officially named ‘Santa Ana de los Ríos de Cuenca’) is Ecuador’s third largest city and the second largest Andean city after the national capital, Quito. Located in southern Ecuador, Cuenca serves as the capital of Azuay province. The city lies within an inter-Andean valley at 2550 m above sea level, characterized by cool to cold temperate climates [27]. Administratively, Cuenca belongs to the canton of the same name. Its urban area comprises the cantonal seat (formed by urban parishes), surrounded by rural parishes [28]. The rural parishes nearest to Cuenca’s cantonal seat (Cuenca city) constitute what this study considers the suburban zone (Figure 1). Five parishes—hereafter referred to as districts—were selected from this area as they represent Cuenca’s primary agricultural peripheries. The study districts are (a) San Joaquín, (b) Ricaurte, (c) Sinincay, (d) Baños, and (e) Sayausí. All operate under decentralized autonomous parish-level governments (GADs).

2.2. Sampling and Data Collection

The data were obtained from farmer surveys conducted as part of the research project ‘Re-territorialization of Local Agri-food Practices in Semi-urban Areas of Cuenca Canton,’ funded by the Universidad de Cuenca (Ecuador). The study population consisted of all agricultural households registered in the five districts, totaling 1090 households. These registries were provided by each district’s local government (GAD). Data were collected through a questionnaire administered to a sample of 293 farmers during the second half of 2021. A proportional stratified sampling design [29] was applied to ensure representation across districts.
The questionnaire was administered as a digital form developed using KoBoToolbox (KoBoToolbox, Harvard Humanitarian Initiative, Cambridge, MA, USA; available at: https://www.kobotoolbox.org, accessed on 15 January 2022). The questionnaires were administrated by a trained team of researchers, technicians and students from the University of Cuenca. Questionaries were applied in person. During fieldwork, several challenges were encountered, including reluctance of some farmers to disclose information, and logistic restrictions associated with the COVID-19 pandemic. These issues were addressed through collaboration with local parish councils, which facilitated access to communities and helped established trust with respondents. Anonymity and confidentially were guaranteed to all participants.
While the original survey contained 146 questions covering multiple producer characteristics, 117 questions focused on ethnographic and organizational aspects (e.g., customs, beliefs, language, myths, ideologies) and organizational management themes (SWOT analysis of producer associations), which are part of a separate study. Consequently, the current analysis considers only 29 questions addressing farmers’ socioeconomic characteristics, agricultural practices, and marketing strategies (Table 1 and Appendix A Table A1). This study is grounded in the foundational theory of the marketing mix, commonly conceptualized as the 4Ps framework (Product, Price, Place, and Promotion) [30]. However, our analysis focuses on a set of specific, operational marketing variables that are of critical importance within the context of our study. The assessment of marketing strategies was based on key marketing variables for short food supply chains and direct-to-consumer sales [31], such as destination of production, commercialization, association memberships, and product transportation. At the national level, these marketing dimensions are aligned with the Ecuadorian agricultural commercialization policies established by the Minister of Agriculture and Livestock of Ecuador, which aim to strengthen local markets and reduce dependency on intermediaries.

2.3. Data Analysis

To address the first study objective (to characterize production agroecosystems in suburban areas near Cuenca city in the Southern Ecuadorian Andes), descriptive analytics were applied to survey-derived data. The quantitative variables—‘tam_hogar’ (household size), ‘adul_trab’ (working adults), ‘ingreso_aliment’ (food income), and ‘Ingreso’ (total income)—were converted into categorical variables (see variable definitions in Table 1) for statistical processing. Analytical procedures included contingency table construction and chi-square tests (α = 0.05) to examine variable–district relationships.
For the second objective (to determine the principal smallholder farm typologies based on livelihood systems using an unsupervised machine learning method), we implemented an unsupervised learning approach using the PAM (Partitioning Around Medoids) clustering algorithm [32]. The analysis was conducted in R [33] using the “pam” function from the “cluster” package [34].
PAM algorithm was selected due to its particular suitability for datasets containing categorical, binary, or mixed data types, which is the dominant characteristic of our survey data (Table 1). Furthermore the use of medoids enhances the robustness of the algorithm to outliers and, critically, provides interpretable and representative ‘typical cases’ for each cluster. This is essential for constructing a meaningful and actionable typology of agroecosystems, as it allows the resulting agroecosystem types to be directly understood and related to real-world decision-making contexts, thereby aligning the methodology directly with the study’s objective. The quantitative variables ‘tam_hogar’ (household size), ‘adul_trab’ (working adults), ‘ingreso_aliment’ (food income), and ‘Ingreso’ (total income) were converted to categorical format for this analysis. Cluster generation employed Gower’s dissimilarity coefficient [35], which calculates pairwise dissimilarities between observations (e.g., i and j) relative to their nearest medoid in PAM.
The optimal number of clusters was determined based on a combination of statistical indicators using the Silhouette method [26] and interpretative relevance, balancing quantitative rigor and practical meaning. This approach evaluates clustering quality by calculating the Silhouette Index (SI), where values approaching +1 indicate well-separated, distinct clusters, values near −1 suggest poor clustering, and values around zero reflect ambiguous group assignments [36]. The optimal k corresponds to the value maximizing the average SI across potential k values—higher average silhouette widths denote superior clustering solutions. Following Alvarez et al. [37], we constrained our cluster solutions to between 3 and 7 groups, consistent with typical typology studies for capturing heterogeneity while avoiding oversimplification. To assess statistical differences between the selected clusters, we analyzed the Silhouette Index (SI) values of individual observations within each cluster using the non-parametric Kruskal–Wallis test (α = 0.05), followed by Benjamini–Hochberg post hoc procedures to control for false discovery rates. For two-dimensional cluster visualization, we employed t-distributed Stochastic Neighbor Embedding (t-SNE), a nonlinear dimensionality reduction technique [38], implemented through the Rtsne package [39]. For cluster interpretation, clusters were characterized by descriptive statistics (frequency counts) and chi-square tests (α = 0.05) to assess variable–cluster associations.

3. Results

3.1. Characterization of Agroecosystems

The characterization of Andean suburban agroecosystems was conducted at the study area level, examining three fundamental aspects: (a) socioeconomic conditions, (b) production system structure and management, and (c) agricultural output destinations.

3.1.1. Socioeconomic Characteristics of Farm Households

Table 2 presents the percentage values of socioeconomic variables for surveyed farm households by district, which form the basis of the socioeconomic characterization described below.
At the general level, most household heads (73.6%) self-identified as intermediary farmers. Family units typically consisted of 3–4 members (45.3% of respondents), with 1–2 household members primarily engaged in agricultural work (82% of cases). While agriculture served as the main income source (35.5% of households), earnings were frequently supplemented through other activities—most notably remittances from migrant family members. This contributed to approximately 41% of households earning above $715 monthly. However, the majority (~50%) reported incomes below $400 (equivalent to Ecuador’s 2021 unified basic monthly wage). Consequently, 84.5% of households received economic assistance, primarily through the government’s Human Development Bonus program. A significant proportion (45%) relied on products and services from Cuenca city. As shown in Table 2, household economic variables (agricultural income, income sources, remittances, monthly earnings, and economic assistance receipt) demonstrated statistically significant district-level variation (Chi-square test; p < 0.05).

3.1.2. Structure and Management of the Production Systems

Table 3 presents the percentage values for the variables related to the structure and management of the production systems.
The farmers are, for the most part (58.3% of those surveyed), the owners of the land used for their agricultural activities. The main crops are vegetables (71.6%), with corn as a secondary crop. The production systems are characterized by being based on manual tillage for soil preparation, fumigation of crops for pest and disease control, and without fertilization; they do not practice crop rotation. The seeds used by the farmers are typically their own. Approximately, 56% of farms lack water for their crops, and approximately 48% of respondents state that water availability is dependent on the time of year. Approximately 51.4% report that they have not received any form of technical assistance or support from public or private institutions for production.
As can be observed in Table 3, all variables, except for “Fertilization,” show a significant relationship (Chi-square test; p < 0.05, Table 3) with the districts, which would indicate a high diversity in the aspects of structure and management of the production systems among the districts.

3.1.3. Destination of Agricultural Production

The majority of respondents (approximately 75%) stated that they sell their products, marketing them at parish and city of Cuenca markets and fairs (Table 4). Because this study was conducted during the COVID-19 pandemic, products were also marketed virtually according to the majority of respondents (79.6%). Transportation of production is primarily carried out using their own vehicles (40.4% of respondents) and by rental pickup trucks (39.3% of respondents). Some 57.1% of producers report being members of a producers’ association, and the advantages of this membership are primarily having more opportunities to sell their products and also receiving technical assistance. All variables corresponding to the aspect discussed in this section (“Destination of agricultural production”) show a significant relationship (Chi-square test; p < 0.05, Table 4) with the districts, which would also indicate that these variables are responsible for the diversity of the production systems among the districts.

3.2. Agroecosystems Typologies

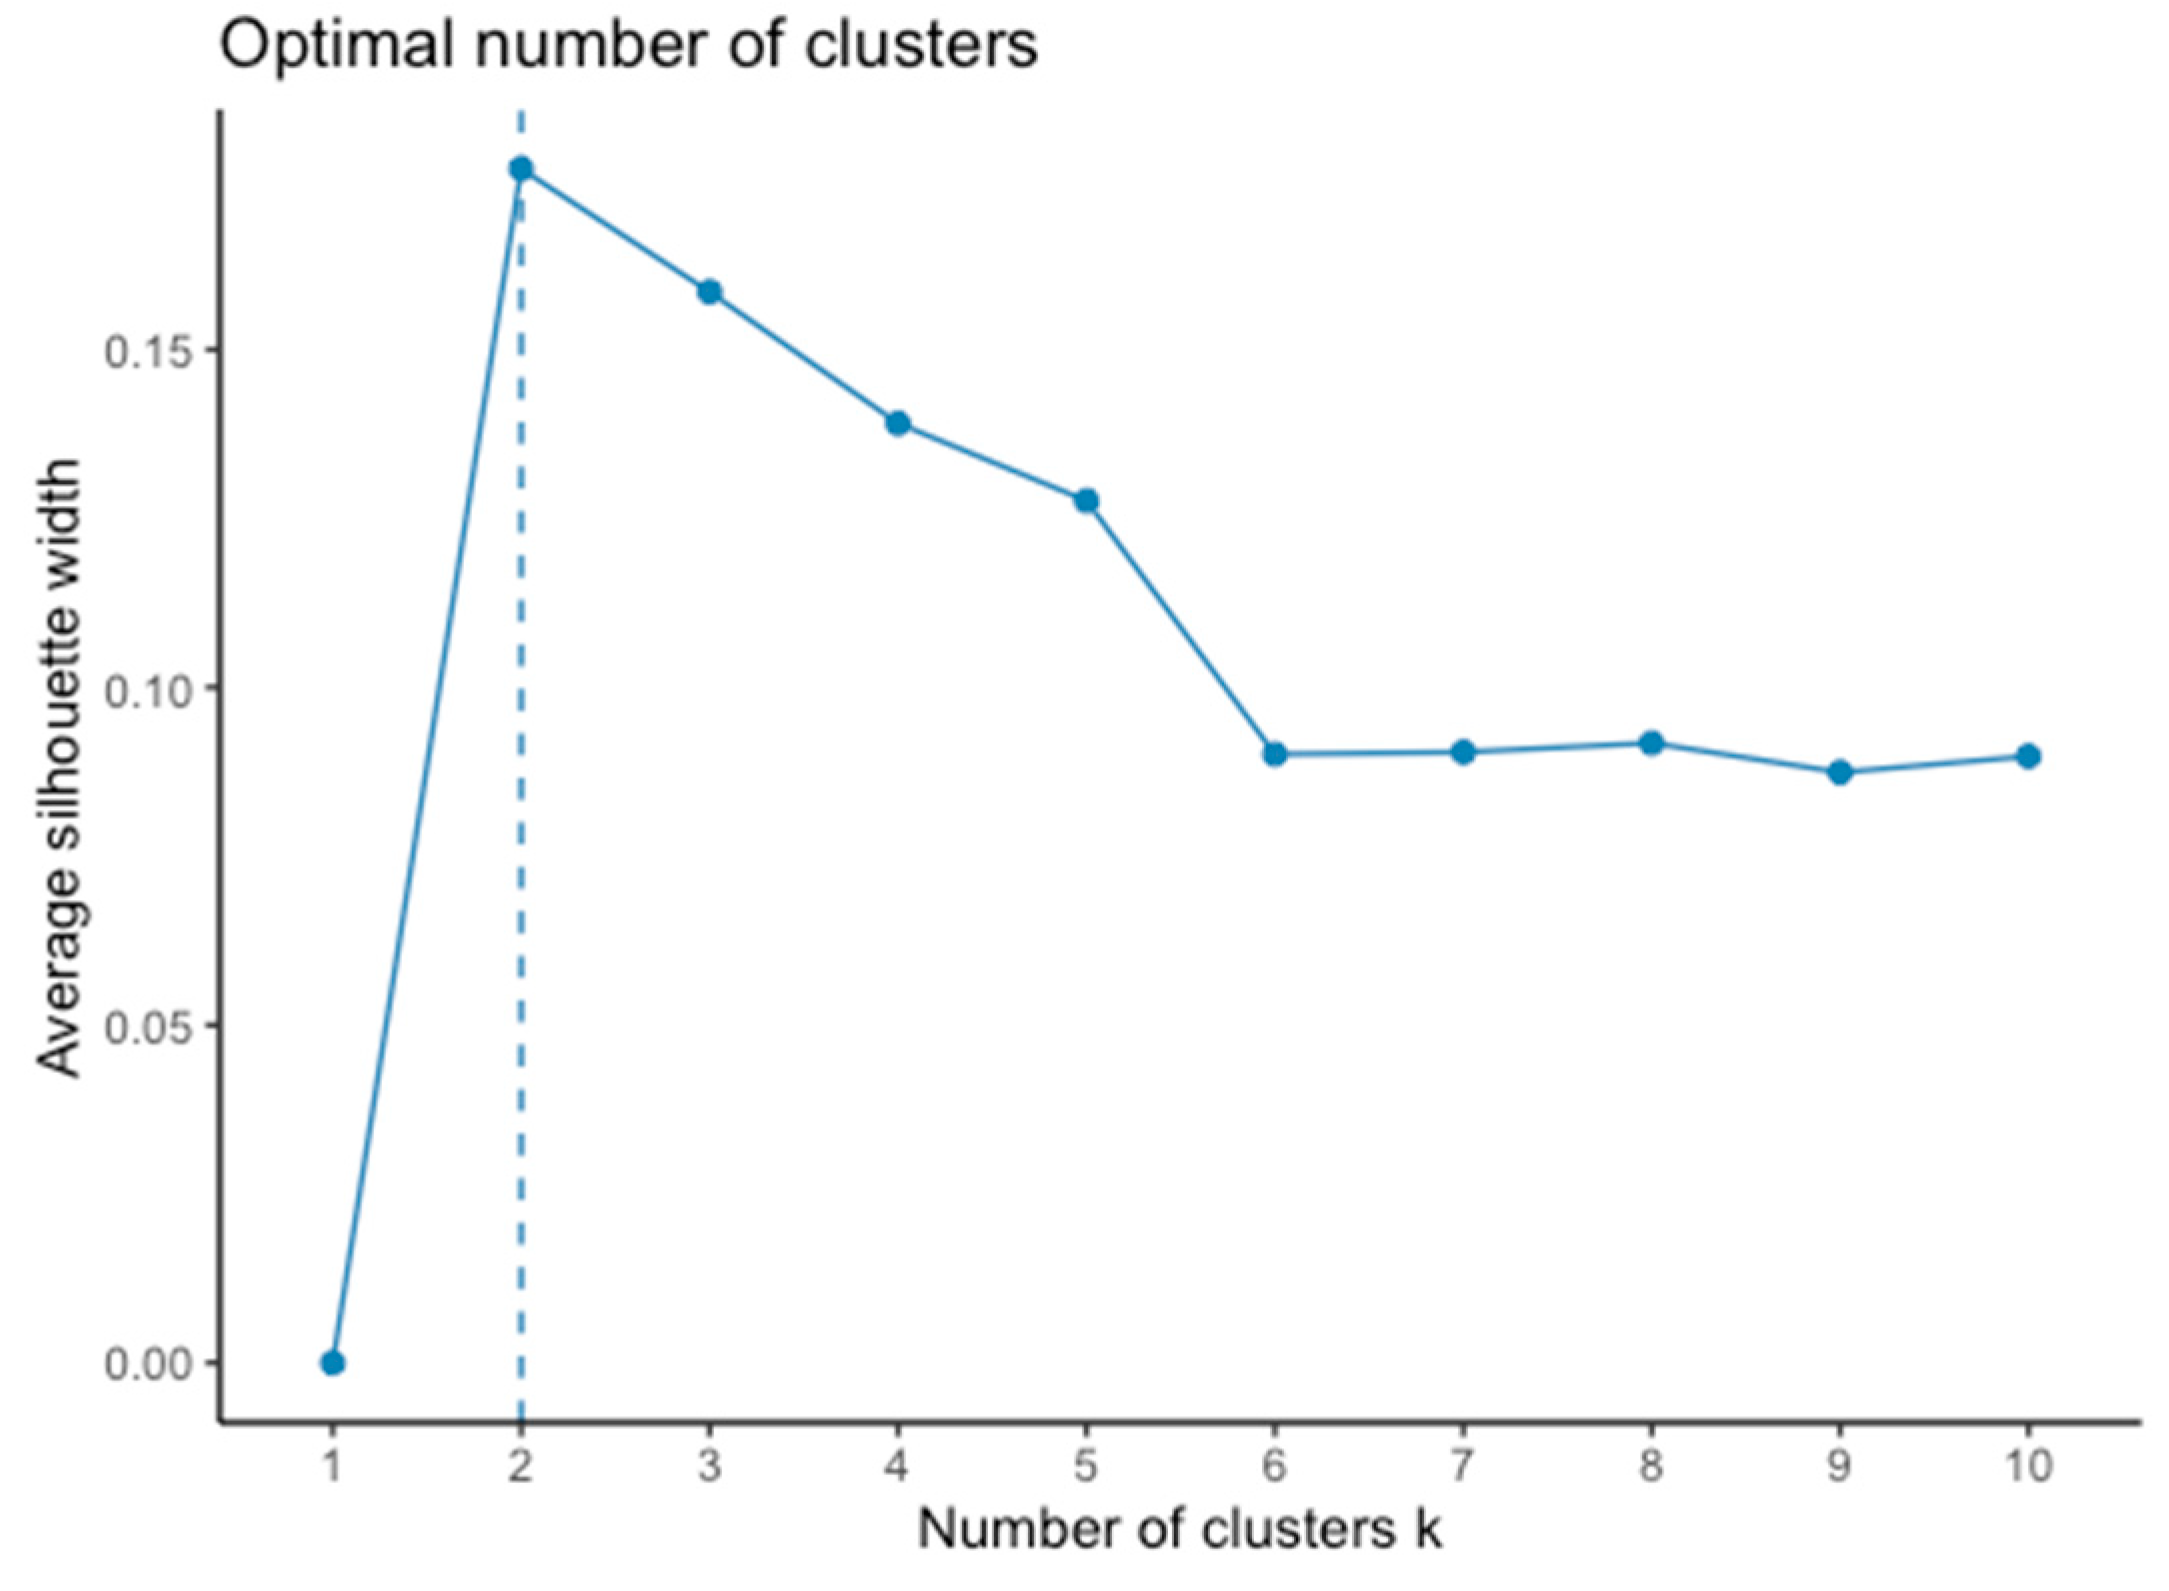
The determination of the optimal number of typologies balanced statistical metrics with establishing methodological conventions. The average Silhouette width [26] indicated that a two-cluster solution provided the statistically optimal partition of the data (Figure 2). However, following established practices in typological development, where the number of clusters commonly ranges from three to seven to ensure sufficient discrimination without excessive complexity [37], a three-cluster solution was selected for this study. This decision was substantively driven by the finding that the three-cluster model, while resulting in a marginally lower average Silhouette width, yielded a more nuanced and theoretically meaningful segmentation. Three clusters captured typologies that were conceptually distinct and critical to the research objectives. Retaining only two clusters would have consolidated differences, resulting in an oversimplification that masked important heterogeneity within the data. Consequently, the three-cluster solution was adopted for its superior interpretative utility and alignment with typological standards, despite the marginal statistical trade-off.
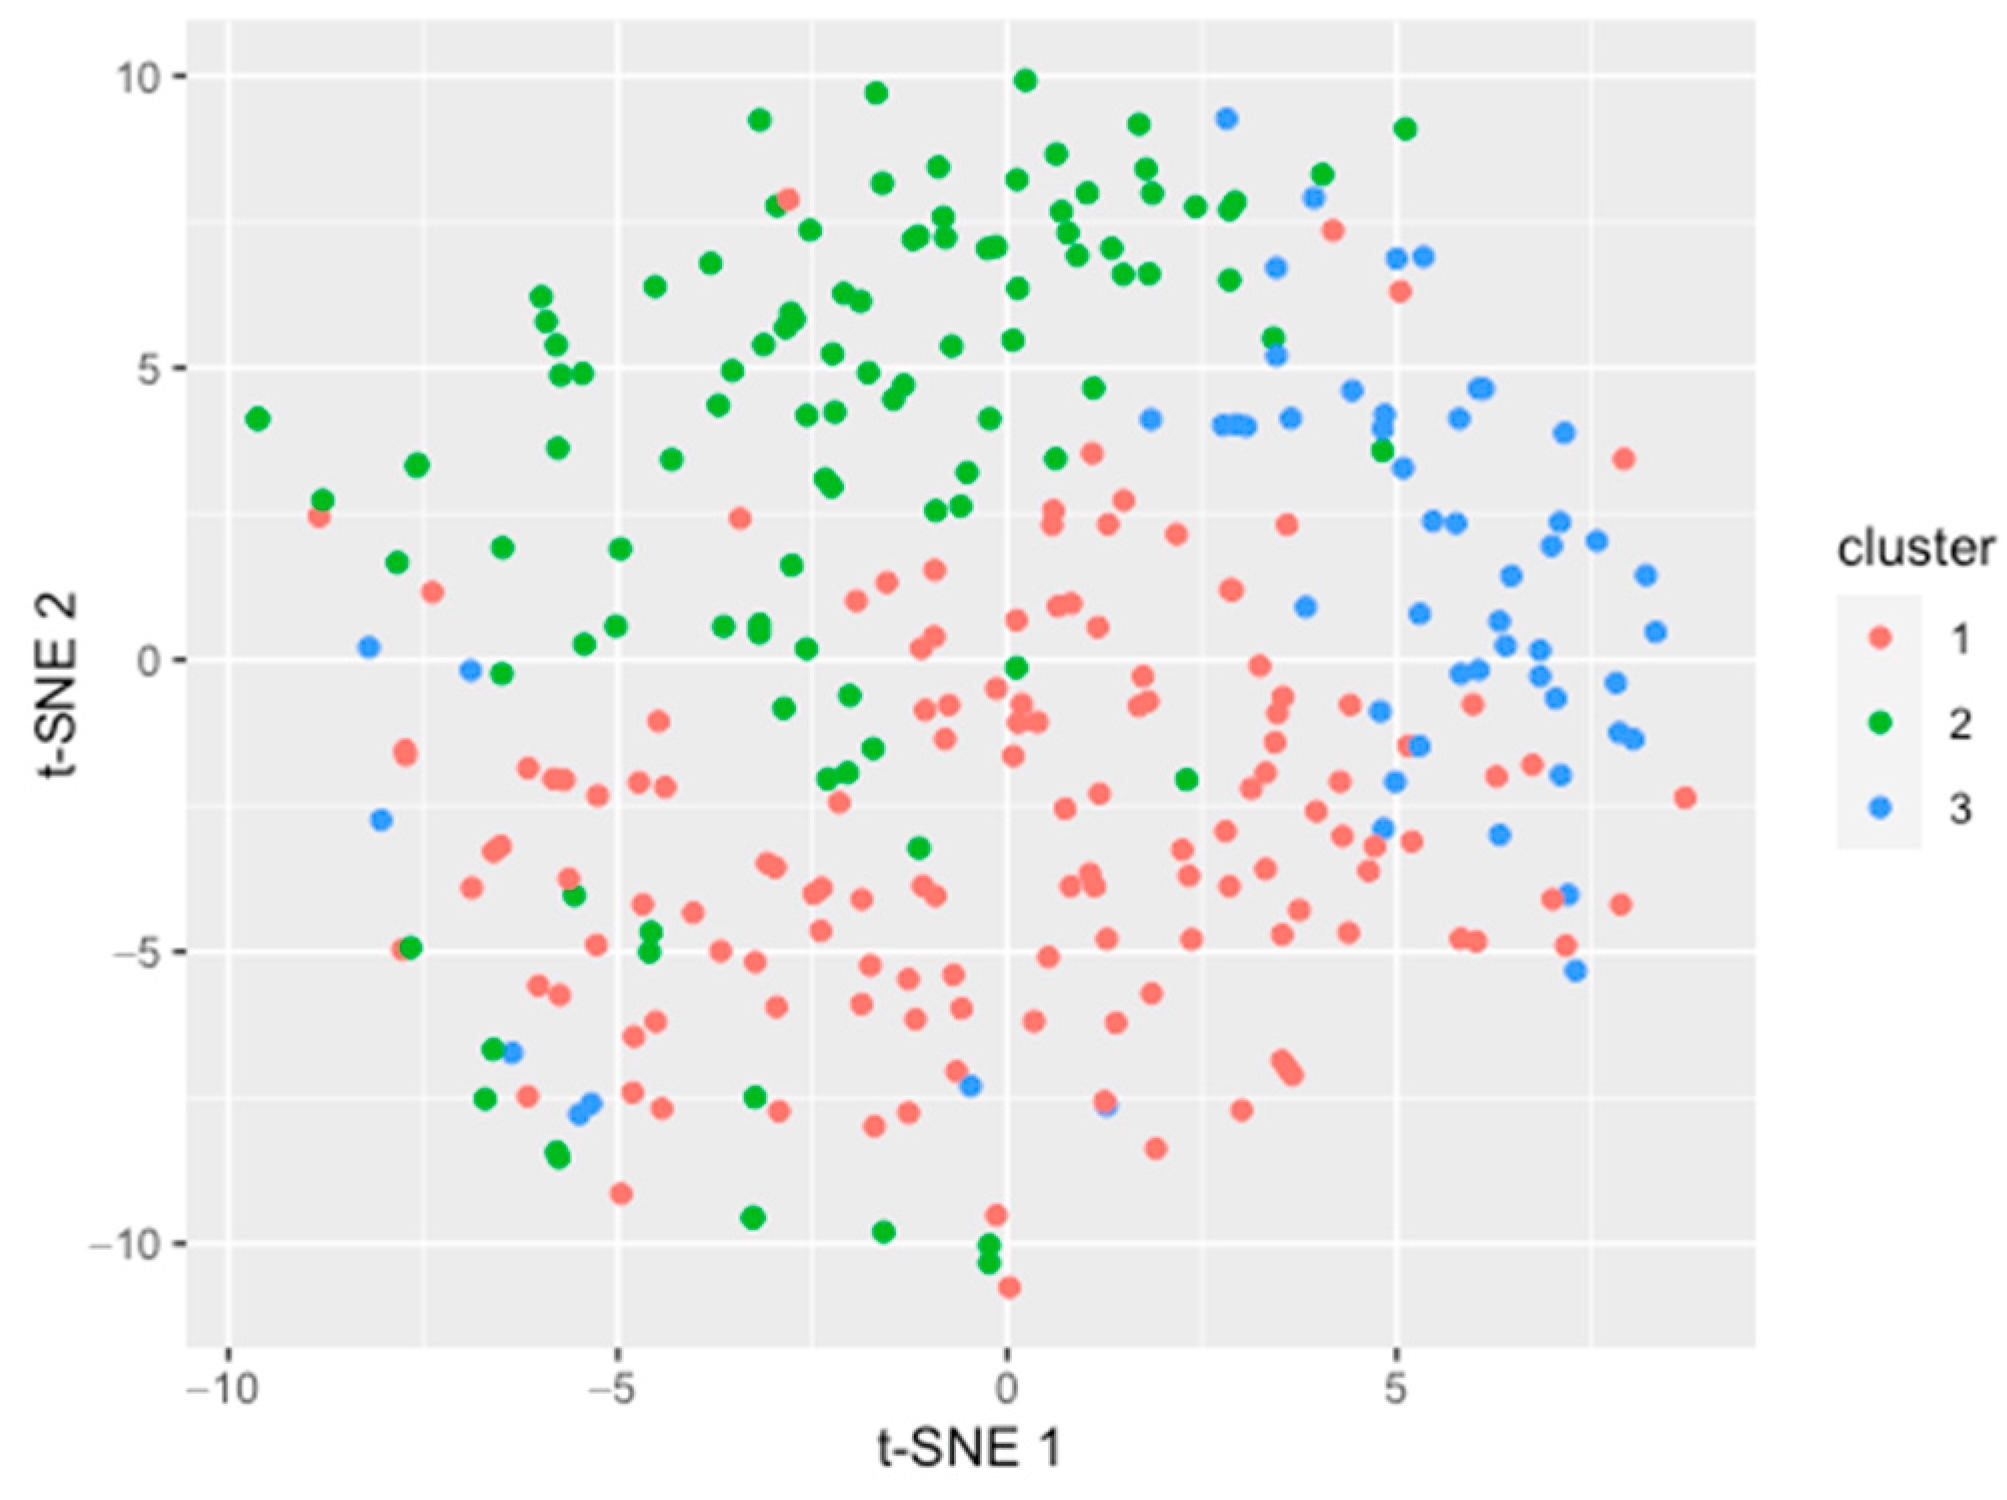
The typologies generated based on the three clusters can be visualized in Figure 3. Considering the SI values of the observations belonging to each cluster and comparing them between clusters, statistical differences were evidenced between the clusters (Kruskal–Wallis, p < 0.01054). Subsequently, using the BH procedure as a post hoc analysis, differences were detected between cluster 1 and clusters 2 and 3 (Table 5). Although statistically similar, clusters 2 and 3 showed a difference in their mean SI value; thus, the minimum number of typologies is three.
The characteristics of each are described in Table 6, taking into account only the values of the highest frequencies found for each of the variables (socioeconomic, agricultural aspect, and marketing variables) within each cluster. Although this approach has its limitations by considering only the highest frequencies, it has the advantage of synthesizing the most representative information for each typology (the values for all response frequencies of the variables can be found as Supplementary Material: Tables S1–S3). However, the statistical relationship between the variables and the clusters was also evaluated using the Chi-square test (α = 0.05), which evidenced that the agricultural and marketing aspect variables are the most influential in determining the clusters (17 of the 19 variables show a significant relationship with the clusters, Table 6). A description of each cluster is provided below.

3.2.1. Typology 1

Cluster 1 corresponds to a typology of farmers with a high economic level, with incomes exceeding 715 USD (the unified basic monthly wage (SBU) in Ecuador for 2021 was 400 USD). This income originates predominantly from their activities as intermediary farmers; this cluster presented the highest percentage of intermediary farmers (approximately 74% of farmers). They allocate up to approximately 25% of their income to food. They are characterized by owning their own land (land ownership is a common characteristic across all three typologies), where vegetables and corn are the dominant crops. Their production systems are based on practices that are predominantly reduced in the use of fertilizers (approximately 94% of its farmers), although a low percentage (approximately 6%) use chemical fertilizers. Some 55% of farmers resort to fumigation for pest and disease control in their crops. They prepare the land manually, practice crop rotation, the majority (approximately 65%) lack water for irrigation, and also the majority (approximately 68%) do not receive technical advice from institutions, whether governmental or non-governmental. The destination of production is sale at parish and city markets and fairs, and for transporting production they use rental pickup trucks. In this typology, the majority of farmers (approximately 70%) do not belong to producer associations.

3.2.2. Typology 2

Cluster 2 corresponds to a typology of producers with the lowest incomes among the clusters (Table 6). They earn an income below the Ecuadorian monthly SBU (<400 USD) for the sustenance of a typical household of 3 to 4 members. This income does not originate from agricultural activities (74.29%), and it is the cluster with the highest percentage of farmers who sell their labor—particularly to other cultivated fields, as the majority of their income comes from agriculture and they also act as intermediaries (Table 6). They allocate up to 25% of their income to food, and since their income is below the monthly SBU, this affects the quality of life of households in this typology, particularly in terms of nutrition.
Their cultivated land is their own, and they maintain a greater diversity of crops (predominantly cultivating vegetables, corn associated with legumes—commonly with beans) than farmers in Typology 1 (which lacks fruit trees) and Typology 3 (which lacks both fruit trees and pasture)—see Table S2. Their land management is similar to that of Typology 1, meaning they prepare their land manually, rotate crops, do not use fertilizers, and use pesticides. Unlike Typology 1, the majority of farmers in this typology have irrigation and receive technical assistance.
The destination of their production is the markets and fairs of the city of Cuenca; they belong to producer associations and use rental pickup trucks for product transport. Economically, this typology is the least sustainable due to having the lowest income, which results in a lower quality of life.

3.2.3. Typology 3

Cluster 3 corresponds to a typology of farmers who earn incomes above the unified basic wage (>715 USD), but it is a typology with the highest number of household members (5 to 6 people, approximately 51%). Although agriculture remains an income source for this cluster, it can be observed (Table 6) that there are other main sources of economic income, which, being equally high (>715 USD), can be attributed to money coming particularly from remittances.
Regarding income allocated to food, receiving financial aid, and bringing products and services from the city, and land tenure, their trends are similar to the other typologies. On their land, crop diversity is lower than the other typologies since they predominantly only grow vegetables (they do not sow pastures nor have fruit trees, as is the case with the other typologies). The majority prepare their soil with a tractor (approximately 66%). They do not use fertilizers (approximately 95%), and those who do use natural fertilizers; also, the majority (85%) do not fumigate their crops. These aspects would indicate that these are production systems characterized by the lowest use of agrochemicals, making it the most environmentally friendly typology.
Similarly to the other typologies, they use their own seeds and do not rotate crops, but the majority have irrigation (85%) and also receive technical assistance (approximately 78%). The destination of their production is the markets and fairs of Cuenca, transporting their production in their own vehicles, and the majority are also not associated (60%).

4. Discussion

4.1. Socioeconomic Heterogeneity and Livelihood Diversification

The characterization of Andean suburban agroecosystems in southern Ecuador revealed a notable heterogeneity in both the socioeconomic aspects of households and the structure and management of production systems, as well as in the destination of agricultural production. This heterogeneity successfully fulfills the first specific objective of the study, which aimed to describe the conditions of small farmers in suburban areas near the city of Cuenca. A key finding that emerged from this characterization is that, despite of its variability, agricultural activity is often an insufficient sole source of income for these households. Many farming families complement agricultural earnings with off-farm employment and remittances from relatives living abroad, a pattern that reflects both the vulnerability and adaptability of these agroecosystems. Similar livelihoods diversification strategies have been reported in other Andean territories by Toledo et al. [40] and Haro et al. [41], where migration and wage labor function as mechanisms to cope with unstable agricultural incomes and increasing production costs. This dependence on external income sources highlight the fragility of local agricultural economies and the urgent need for strategies that enhance the profitability and resilience of small-scale farming.

4.2. Production Systems and Environmental Sustainability

From a production standpoint, vegetables dominate the cropping systems, which suggests a strong integration with urban markets. Nevertheless the widespread use of synthetic fertilizers and pesticides, combined with limited crop rotation, raises concern regarding the long-term environmental sustainability of these agroecosystems. This result coincides with previous studies in Andean agroecosystems that warn of the increasing pressure towards more input-intensive agriculture, even on small scales [42,43,44,45,46]. The intensive management practices observed may compromise soil health, reduce biodiversity, and increase production risks associated with pest resistance and input price volatility. Despite the evident short-term economic benefits, such reliance on chemical inputs reflects a path dependency that is difficult to reverse without targeted interventions. Therefore, promoting ecologically based management practices, such as diversified rotations, integrated pest management, and the use of organic amendments, should be prioritized to reduce environmental pressures while maintaining productivity [47]. Strengthening technical assistance programs, access to sustainable inputs, and farmer-to-farmer training could help transition suburban agriculture toward more sustainable and resilient production systems.
It is important to acknowledge that the results presented here capture a single temporal snapshot of suburban agroecosystems, corresponding to the period of fieldwork conducted during the second half of 2021. Consequently, seasonality variability in crop management and income composition was not fully captured. In the Andean highlands, marked climatic seasonality strongly influences crop calendars, labor allocation, and market prices, leading to fluctuations that can substantially modify farmers’ decisions through the year [48]. Likewise, long-term processes—such as demographic changes, migration patterns, and shifts in agricultural policies—can reshape the socioeconomic conditions and sustainability trajectories of suburban households over time. Future studies should therefore incorporate longitudinal and multi-seasonal approaches that enable the identification of dynamic changes in production practices and livelihood strategies.

4.3. Theoretical Framing of Typologies: Livelihood Strategies and Sustainability Transitions

The pursuit of our second objective—determining farmer typologies using data mining techniques– revealed that the observed heterogeneity is not random but can meaningfully categorized into three distinct typologies. These typologies represent distinct livelihood strategies shaped by differential access to resources, market integration, and adaptation to the suburban context.
The significant heterogeneity of agroecosystems has also been highlighted in similar studies, such as the one conducted in southern Ecuador by Vanegas et al. [21]. Our findings can be further interpreted through the lens of sustainability transition theory [49,50], which provides a dynamic perspective on how these different farm types interact within a broader system. In this framework: Typology 2 represents the most vulnerable group, whose practices are often marginalized by the dominant socio-economic “landscape”. Their low incomes and high vulnerability highlight systemic pressures and exclusions. Typology 1 embodies the dominant “socio-technical regime” of commercial, input-intensive agriculture that is well integrated into existing market structures but faces growing environmental sustainability challenges. Typology 3 can be viewed as an emerging “niche” characterized by practices that align more closely with sustainability principles (e.g., lower agrochemical use), potentially supported by alternative income sources like remittances. This framing moves beyond a static classification and helps identify leverage points for policy. The goal becomes not just to support each type in isolation, but to foster interactions that can empower niche innovations (Typology 3), reshape the prevailing regime (Typology 1) towards greater sustainability, and create protective buffers for the most vulnerable (Typology 2).

4.4. Concrete Policy Implications for Differentiated Interventions

The typologies identified in this study provide a valuable empirical foundation for designing differentiated policies that move beyond one-size-fits-all approaches. The following concrete, actionable recommendations are linked directly to the specific profiles of each typology:
For Typology 2 (vulnerable, low-income households): Policy should focus on poverty alleviation and risk reduction. This includes facilitating access to social safety nets, microcredit for basic inputs, and programs that promote food security and subsistence production. Training in low-cost, sustainable practices (e.g., homemade organic pesticides) and support for forming commercial alliances could help improve their market position and resilience.
For Typology 1 (commercial, input-intensive farms): Interventions should aim at “sustainable intensification”. This group would benefit from technical assistance and economic incentives for adopting integrated pest management and precision fertilization to reduce environmental externalities without sacrificing yields. Policies that strengthen their access to stable, value-added markets (e.g., through contracts or branding) and provide green subsidies for environmentally friendly technologies are key.
For Typology 3 (lower-input, remittance-supported households): This group represents a potential model for transition. Policy should aim to “empower the niche” by providing support for organic or agroecological certification, creating market linkages for sustainably produced goods, and offering training in advanced agroecological techniques like crop diversification and agroforestry, as shown by Córdova et al. [51], such strategies can reduce dependence on off-farm activities and income. This could help solidify their environmentally friendly practices and enhance their economic viability, making them a demonstration model for others.
For all typologies, the high dependence on remittances underscores the need for policies that strengthen the autonomy and profitability of the agricultural sector itself. National initiatives of the Ecuadorian government such as the “Plan Nacional para el Buen Vivir” and the “Estrategia Nacional para la Soberanía Alimentaria” emphasize the dual need to improve rural livelihoods while safeguarding environmental integrity, they could be actively implemented in these suburban contexts, which often occupy an ambiguous policy space between urban and rural frameworks [52,53].
The patterns identified in this study are closely aligned with broader debates on agricultural policy and territorial development in Ecuador. Our findings suggest that suburban agriculture in Cuenca occupies an ambiguous policy space, where it is neither fully integrated into urban planning frameworks nor adequately supported by rural development programs. The typologies identified provide a practical diagnostic tool that can inform local governments, development agencies, and non-governmental organizations in designing evidence-based interventions.
Future research should build upon this foundation by integrating longitudinal monitoring and participatory approaches. The inclusion of time-series data or repeated surveys would help to assess the stability of the typologies identified and to determine whether households move between types in response to climatic shocks, market opportunities, or policy interventions. Such an approach would also strengthen the capacity of typology-based research to serve as an early warning tool for assessing the resilience and adaptability of suburban agroecosystems under conditions of environmental and socioeconomic uncertainty. All this work will be essential to foster transitions toward more equitable and sustainable suburban food systems in Ecuador and across the broader Andean region.

5. Conclusions

This study characterized the heterogeneity of Andean suburban agroecosystems in southern Ecuador and identified three distinct smallholder farm typologies using an unsupervised clustering approach (PAM with Gower’s distance). The typologies reveal that suburban agriculture at the rural–urban interface is not a monolithic entity but a complex landscape where households employ diverse livelihood strategies. These range from economically vulnerable, subsistence-oriented systems to more commercially integrated and environmental conscious operations. A critical cross-cutting finding is the heavy reliance on remittances and off-farm income, underscoring both the economic vulnerability and the adaptive capacity of these agroecosystems in the face of limited agricultural profitability.
From a conceptual perspective, this research makes a significant contribution by demonstrating that farm typologies, when interpreted through frameworks like sustainability transition theory, provide a powerful lens for understanding the dynamics of agricultural systems. The identified typologies—representing vulnerable, regime, and niche profiles—offer a structured way to analyze interactions, constrains, and potential pathways for change within the suburban agricultural landscape.
From a practical and policy standpoint, the findings provide a robust, empirical basis for designing differentiated interventions. The one-size-fits-all approach is demonstrably inadequate for the diverse realities captured in this study. Instead, policymakers and local governments can use this typology to tailor support: (i) targeting economic strengthening and safety nets for vulnerable households (Typology 2); (ii) promoting sustainable intensification and market integration for commercial farmers (Typology 1), and (iii) empowering and scaling agroecological practices among the more environmentally sustainable producers (Typology 3).
The novelty of this research lies in the integration of machine learning techniques with territorial analysis in a suburban Andean context—a region where empirical typologies are scarce despite the growing importance of peri-urban agriculture for urban food security and territorial resilience.
Finally, we acknowledge the limitations of a cross-sectional design and the conversion of some quantitative variables into categorical data. Future research should employ clustering on mixed data, with continuous variables retained, to test sensitivity. Furthermore, longitudinal and multi-seasonal are needed to explore how household typologies evolve in response to environmental change and policy changes. Socializing and validating these typologies with the producers themselves will be a critical next step. Undoubtedly, this will be a task for future work, which can continue to use the findings of this study as a starting point. Such efforts are essential to advance our understanding of these dynamic agroecosystems and to support their transition toward greater sustainability, equity, and resilience in the face of rapid urbanization in the Andean region.
Supplementary Materials

The following supporting information can be downloaded at: https://www.mdpi.com/article/10.3390/su17219760/s1, Table S1: Relative frequency values of variables related to socio-economic aspects in the clusters generated by PAM clustering. * and NS (not significant) indicate whether a significant relationship exists between the variables and the clusters as a result of the Chi-square test (α = 0.05); Table S2: Relative frequency values of variables related to the structure and management aspects of the production system in the clusters generated by PAM clustering. * and NS (not significant) indicate whether or not a significant relationship exists between the variables and the clusters as a result of the Chi-square test (α = 0.05); Table S3: Relative frequency values of variables related to the destination of agricultural production (marketing aspects) in the clusters generated by PAM clustering. * and NS (not significant) indicate whether or not a significant relationship exists between the variables and the clusters as a result of the Chi-square test (α = 0.05).

Author Contributions

Conceptualization: P.Q. and R.V.; methodology: P.Q.; formal analysis: P.Q. and S.B.; investigation: R.V., S.G. and H.C.; data curation: S.G.; writing—original draft preparation: P.Q., L.J. and S.B.; writing—review and editing: P.Q., S.B., R.V. and L.J.; visualization: P.Q.; supervision: P.Q.; project administration: P.Q.; funding acquisition: P.Q. and R.V. All authors have read and agreed to the published version of the manuscript.

Funding

This research was funded by “Vicerrectorado de Investigación e Innovación de la Universidad de Cuenca (VIIUC), Cuenca-Ecuador”, grant number DIUC_XVIII_2019_68_QUICHIMBO_PABLO, research project “Re–territorialización de las prácticas locales agroalimentarias en áreas semi urbanas del cantón Cuenca”.

Institutional Review Board Statement

The study was conducted in accordance with the Declaration of Helsinki, and the protocol was approved by the Bioethics Committee of the University of Cuenca (COBIASUCuenca)(DIUC_XVIII_2019_68_QUICHIMBO_PABLO) on 3 June 2019.

Informed Consent Statement

Verbal informed consent was obtained from all participants prior to data collection. Verbal consent was considered appropriate due to literacy and cultural considerations in the study area. Participation was voluntary, and the research was endorsed and supported by the local decentralized autonomous governments (GADs) of each parish involved.

Data Availability Statement

All relevant data are within the manuscript and as Supplementary Material.

Acknowledgments

We extend our deepest gratitude to the local farmers for their invaluable cooperation and active participation in this study. Their insights and willingness to engage in surveys were indispensable to our research. We also sincerely appreciate the dedicated efforts of the students who contributed to the successful execution of this project. Finally, we extend our gratitude to Francisco Maroto Molina and Adolfo Peña Acevedo, supervisors of Pablo Quichimbo’s master’s thesis in the “DigitalAgri” Master’s program at the Universidad de Córdoba (Spain), which served as the basis for this scientific article.

Conflicts of Interest

The authors declare no conflicts of interest.

Abbreviations

The following abbreviations are used in this manuscript:
GADDecentralized autonomous parish-level government
PAMPartitioning Around Medoids
SISilhouette Index

Appendix A

Table A1. Survey questions considered for the present study.
VIP
1How do you consider yourself? Producer/Intermediary/Producer-Intermediary
2How many people make up your household?
3How many adults >18 years old in your household work or help in agriculture?
4Does your household’s economic income come solely from agriculture? YES/NO
5From what other activities do those economic incomes come? Agriculture/Sale of labor/Raising and commercializing animals/Food preparation and sale/Others
6Do you receive remittances? YES/NO
7What percentage of your economic income is allocated to household food?
8Do you receive any social assistance from the Government or from another public or private institution? YES/NO
9Do you bring products or services from Cuenca? YES/NO
10What is your approximate monthly economic income entering the household?
11The lands you have for cultivation are: rented/sharecropped/communal/family patrimony/owned/loaned/inherited
12What is the main crop you produce? vegetables/fruit trees/pastures/corn/roots and tubers/other
13What is the secondary crop you produce? vegetables/fruit trees/pastures/corn/roots and tubers/other
14Do you plant corn in association with other crops? YES/NO
15Do you have fruit trees? YES/NO
16Do you plant pastures? YES/NO
17How do you prepare your lands for planting? manual/tractor/animal traction/mixed/other
18Do you fertilize your lands? YES/NO
19What type of fertilizers do you use to fertilize your lands? natural/chemical/mixed
20Do you fumigate your crops to control pests and diseases? YES/NO
21When you plant, do you rotate crops? YES/NO
22Where do you get the seeds to plant your crops? own/purchased/exchanged
23Do you believe you have enough water to cover the needs of your crops? YES/NO/Depends on the time of year
24Do you have an irrigation system for your crops? YES/NO
25Have you received technical assistance or help from public or private institutions? YES/NO
26What is the destination of your agricultural products? Markets and fairs in the parish/Markets and fairs in Cuenca/Markets and fairs in other cities/Intermediaries/Family consumption/Supermarkets
27Do you sell your products through virtual means? YES/NO
28Are you a member of a Producers’ Association? YES/NO
29How do you transport your products to the points of sale? Public transport/Rental trucks/Taxi/Own vehicle

References

  1. Kryczka, P.; Sikorski, D.; Figlus, T.; Lisowska-Kierepka, A.; Musiaka, Ł.; Spórna, T.; Sudra, P.; Szmytkie, R. Defining Suburbanization in Central and Eastern Europe: A Systematic Literature Review. Cities 2025, 158, 105626. [Google Scholar] [CrossRef]
  2. Lopez, R.A.; Adelaja, A.O.; Andrews, M.S. The Effects of Suburbanization on Agriculture. Am. J. Agric. Econ. 1988, 70, 346–358. [Google Scholar] [CrossRef]
  3. Inwood, S.M.; Sharp, J.S. Farm Persistence and Adaptation at the Rural–Urban Interface: Succession and Farm Adjustment. J. Rural Stud. 2012, 28, 107–117. [Google Scholar] [CrossRef]
  4. Wu, J.; Fisher, M.; Pascual, U. Urbanization and the Viability of Local Agricultural Economies. Land Econ. 2011, 87, 109–125. [Google Scholar] [CrossRef]
  5. Bock, B.B. Rural Futures: Inclusive Rural Development in Times of Urbanisation; Wageningen University & Research: Wageningen, The Netherlands, 2018. [Google Scholar]
  6. Parés-Ramos, I.K.; Álvarez-Berríos, N.L.; Aide, T.M. Mapping Urbanization Dynamics in Major Cities of Colombia, Ecuador, Perú, and Bolivia Using Night-Time Satellite Imagery. Land 2013, 2, 37–59. [Google Scholar] [CrossRef]
  7. Conway, G.R. The Properties of Agroecosystems. Agric. Syst. 1987, 24, 95–117. [Google Scholar] [CrossRef]
  8. Krishna, K.R. Agroecosystems: Soils, Climate, Crops, Nutrient Dynamics and Productivity; Apple Academic Press: New York, NY, USA, 2013; ISBN 978-0-429-17098-0. [Google Scholar]
  9. Wood, S.; Sebastian, K.; Scherr, S.J. Pilot Analysis Of Global Ecosystems: Agroecosystems; International Food Policy Research Institute and World Resources Institute: Washington, DC, USA, 2000. [Google Scholar]
  10. Gliessman, S.R. Agroecology and Agroecosystems. In Agroecosystems Analysis; Agronomy Monograph No. 43; Rickerl, D., Francis, C., Eds.; American Society of Agronomy: Madison, WI, USA, 2004; pp. 19–29. [Google Scholar]
  11. Sans, F.X. La diversidad de los agroecosistemas. Ecosistemas 2007, 16, 44–49. [Google Scholar]
  12. Stinner, D. Agriculture and Biodiversity. In Encyclopedia of Plant and Crop Science; Goodman, R.M., Ed.; CRC Press: Boca Raton, FL, USA, 2004; pp. 1–4. [Google Scholar]
  13. Smith, O.H.; Petersen, G.W.; Needelman, B.A. Environmental Indicators of Agroecosystems. In Advances in Agronomy; Sparks, D.L., Ed.; Academic Press: Cambridge, MA, USA, 1999; Volume 69, pp. 75–97. [Google Scholar]
  14. Guarín, A.; Rivera, M.; Pinto-Correia, T.; Guiomar, N.; Šūmane, S.; Moreno-Pérez, O.M. A New Typology of Small Farms in Europe. Glob. Food Secur. 2020, 26, 100389. [Google Scholar] [CrossRef]
  15. Tittonell, P.; Muriuki, A.; Shepherd, K.D.; Mugendi, D.; Kaizzi, K.C.; Okeyo, J.; Verchot, L.; Coe, R.; Vanlauwe, B. The Diversity of Rural Livelihoods and Their Influence on Soil Fertility in Agricultural Systems of East Africa—A Typology of Smallholder Farms. Agric. Syst. 2010, 103, 83–97. [Google Scholar] [CrossRef]
  16. Crowley, E.L.; Carter, S.E. Agrarian Change and the Changing Relationships Between Toil and Soil in Maragoli, Western Kenya (1900–1994). Hum. Ecol. 2000, 28, 383–414. [Google Scholar] [CrossRef]
  17. Pacini, G.C.; Colucci, D.; Baudron, F.; Righi, E.; Corbeels, M.; Tittonell, P.; Stefanini, F.M. Combining Multi-Dimensional Scaling and Cluster Analysis to Describe the Diversity of Rural Households. Exp. Agric. 2014, 50, 376–397. [Google Scholar] [CrossRef]
  18. Kostrowicki, J. Agricultural Typology Concept and Method. Agric. Syst. 1977, 2, 33–45. [Google Scholar] [CrossRef]
  19. Alvarez, S.; Timler, C.J.; Michalscheck, M.; Paas, W.; Descheemaeker, K.; Tittonell, P.; Andersson, J.A.; Groot, J.C.J. Capturing Farm Diversity with Hypothesis-Based Typologies: An Innovative Methodological Framework for Farming System Typology Development. PLoS ONE 2018, 13, e0194757. [Google Scholar] [CrossRef]
  20. Sarker, M.R.; Galdos, M.V.; Challinor, A.J.; Hossain, A. A Farming System Typology for the Adoption of New Technology in Bangladesh. Food Energy Secur. 2021, 10, e287. [Google Scholar] [CrossRef]
  21. Vanegas, R.; Demoulin, F.; Ruivenkamp, G.; Henry, S. Analysis of the Peasants’ Livelihood Strategies in the Paute Basin of Ecuador. Maskana 2020, 11, 70–80. [Google Scholar] [CrossRef]
  22. Landais, E. Modelling Farm Diversity: New Approaches to Typology Building in France. Agric. Syst. 1998, 58, 505–527. [Google Scholar] [CrossRef]
  23. Maton, L.; Leenhardt, D.; Goulard, M.; Bergez, J.-E. Assessing the Irrigation Strategies over a Wide Geographical Area from Structural Data about Farming Systems. Agric. Syst. 2005, 86, 293–311. [Google Scholar] [CrossRef]
  24. Kuivanen, K.S.; Michalscheck, M.; Descheemaeker, K.; Adjei-Nsiah, S.; Mellon-Bedi, S.; Groot, J.C.J.; Alvarez, S. A Comparison of Statistical and Participatory Clustering of Smallholder Farming Systems—A Case Study in Northern Ghana. J. Rural Stud. 2016, 45, 184–198. [Google Scholar] [CrossRef]
  25. Graskemper, V.; Yu, X.; Feil, J.-H. Farmer Typology and Implications for Policy Design—An Unsupervised Machine Learning Approach. Land Use Policy 2021, 103, 105328. [Google Scholar] [CrossRef]
  26. Kassambara, A. Practical Guide to Cluster Analysis in R: Unsupervised Machine Learning. In Multivariate Analysis; STHDA: Hessen, Germany, 2017; ISBN 978-1-5424-6270-9. [Google Scholar]
  27. Donoso, M.E. Análisis crítico de la planificación urbana de la Ciudad de Cuenca. Maskana 2016, 7, 107–122. [Google Scholar] [CrossRef]
  28. Hermida, M.A.; Hermida, C.; Cabrera, N.; Calle, C. La Densidad Urbana Como Variable de Análisis de La Ciudad: El Caso de Cuenca, Ecuador. EURE 2015, 41, 25–44. [Google Scholar] [CrossRef]
  29. Paul, L.; Ellis, O.J. Practical Research: Planning and Design, 12th ed.; Pearson Education: London, UK, 2020; ISBN 978-0-13-687493-5. [Google Scholar]
  30. Kotler, P.; Keller, K.L.; Chernev, K. Marketing Management, 16th ed.; Pearson Education: London, UK, 2021; ISBN 978-0-13-588715-8. [Google Scholar]
  31. Morgan, E.H.; Severs, M.M.; Hanson, K.L.; McGuirt, J.; Becot, F.; Wang, W.; Kolodinsky, J.; Sitaker, M.; Jilcott Pitts, S.B.; Ammerman, A.; et al. Gaining and Maintaining a Competitive Edge: Evidence from CSA Members and Farmers on Local Food Marketing Strategies. Sustainability 2018, 10, 2177. [Google Scholar] [CrossRef]
  32. Kaufman, L.; Rousseeuw, P.J. Partitioning Around Medoids (Program PAM). In Finding Groups in Data; John Wiley & Sons, Ltd.: Hoboken, NJ, USA, 1990; pp. 68–125. ISBN 978-0-470-31680-1. [Google Scholar]
  33. R Core Team. R: A Language and Environment for Statistical Computing; R Core Team: Vienna, Austria, 2022. [Google Scholar]
  34. Maechler, M.; Rousseeuw, P.; Struyf, P.; Hubert, M.; Hornik, K. Cluster: Cluster Analysis Basics and Extensions, R Package Version 2.1.4; R Core Team: Vienna, Austria, 2022.
  35. Gower, J.C. A General Coefficient of Similarity and Some of Its Properties. Biometrics 1971, 27, 857–871. [Google Scholar] [CrossRef]
  36. Everitt, B.S.; Landau, S.; Leese, M.; Stahl, D. Cluster Analysis; Wiley Series in Probability and Statistics; Wiley: Hoboken, NJ, USA, 2011; ISBN 978-0-470-97844-3. [Google Scholar]
  37. Alvarez, S.; Paas, W.; Descheemaeker, K.; Tittonell, P.; Groot, J.C.J. Constructing Typologies, a Way to Deal with Farm Diversity: General Guidelines for the Humidtropics; Plant Sciences Group, Wageningen University: Wageningen, The Netherlands, 2014; pp. 1–36. [Google Scholar]
  38. van der Maaten, L.; Hinton, G. Visualizing Data Using T-SNE. J. Mach. Learn. Res. 2008, 9, 2579–2605. [Google Scholar]
  39. Jesse, K. Rtsne: T-Distributed Stochastic Neighbor Embedding Using a Barnes-Hut Implementation, R Package Version 0.16; R Core Team: Vienna, Austria, 2022.
  40. Toledo, L.; Chiguano, R.L.C.; Salazar, O.V. Influencia de la agricultura en la economía y su contraste frente a los objetivos de desarrollo sostenible: Caso Ecuador. Universidad-Verdad 2023, 83, 28–49. [Google Scholar] [CrossRef]
  41. Haro, D.M.L.; Solís, O.P.L.; Gómez Romo, M.d.C.; Morales, T.P.M. Las remesas y su efecto en la distribución del ingreso en el Ecuador bajo un enfoque macroeconométrico, 1990–2018. LATAM Rev. Latinoam. Cienc. Soc. Y Humanidades 2023, 4, 3348–3366. [Google Scholar] [CrossRef]
  42. Toledo, L.; Salmoral, G.; Viteri-Salazar, O. Rethinking Agricultural Policy in Ecuador (1960–2020): Analysis Based on the Water–Energy–Food Security Nexus. Sustainability 2023, 15, 12850. [Google Scholar] [CrossRef]
  43. Antle, J.M.; Cole, D.C.; Crissman, C.C. Further Evidence on Pesticides, Productivity and Farmer Health: Potato Production in Ecuador. Agric. Econ. 1998, 18, 199–207. [Google Scholar] [CrossRef]
  44. Kromann, P.; Pradel, W.; Cole, D.; Taipe, A.; Forbes, G.A. Use of the Environmental Impact Quotient to Estimate Health and Environmental Impacts of Pesticide Usage in Peruvian and Ecuadorian Potato Production. J. Environ. Prot. 2011, 2, 581–591. [Google Scholar] [CrossRef]
  45. Garcia-Perez, T.; Pelaez-Samaniego, M.R.; Delgado-Noboa, J.; Chica, E.J. Combined Effect of Biochar and Fertilizers on Andean Highland Soils before and after Cropping. Sustainability 2022, 14, 8912. [Google Scholar] [CrossRef]
  46. Mihai, R.A.; Melo Heras, E.J.; Terán Maza, V.A.; Espinoza Caiza, I.A.; Pinto Valdiviezo, E.A.; Catana, R.D. The Panoramic View of Ecuadorian Soil Nutrients (Deficit/Toxicity) from Different Climatic Regions and Their Possible Influence on the Metabolism of Important Crops. Toxics 2023, 11, 123. [Google Scholar] [CrossRef]
  47. Agula, C.; Akudugu, M.A.; Dittoh, S.; Mabe, F.N. Promoting Sustainable Agriculture in Africa through Ecosystem-Based Farm Management Practices: Evidence from Ghana. Agric. Food Secur. 2018, 7, 5. [Google Scholar] [CrossRef]
  48. Blackmore, I.; Rivera, C.; Waters, W.F.; Iannotti, L.; Lesorogol, C. The Impact of Seasonality and Climate Variability on Livelihood Security in the Ecuadorian Andes. Clim. Risk Manag. 2021, 32, 100279. [Google Scholar] [CrossRef]
  49. Geels, F.W.; Schot, J. Typology of Sociotechnical Transition Pathways. Res. Policy 2007, 36, 399–417. [Google Scholar] [CrossRef]
  50. Nesari, M.; Naghizadeh, M.; Ghazinoori, S.; Manteghi, M. The Evolution of Socio-Technical Transition Studies: A Scientometric Analysis. Technol. Soc. 2022, 68, 101834. [Google Scholar] [CrossRef]
  51. Córdova, R.; Hogarth, N.J.; Kanninen, M. Sustainability of Smallholder Livelihoods in the Ecuadorian Highlands: A Comparison of Agroforestry and Conventional Agriculture Systems in the Indigenous Territory of Kayambi People. Land 2018, 7, 45. [Google Scholar] [CrossRef]
  52. Rodríguez, A.; Jácome-Polit, D.; Santandreu, A.; Paredes, D.; Álvaro, N.P. Agro-Ecological Urban Agriculture and Food Resilience: The Case of Quito, Ecuador. Front. Sustain. Food Syst. 2022, 6, 550636. [Google Scholar] [CrossRef]
  53. Monteros, K.; Dall’Orto, V.; Cempini, C. The Formation of the Urban–Rural Fringe Space in the San Cayetano Area: The Transformation of a Peripheral Urban Landscape in Ecuador. Land 2024, 13, 494. [Google Scholar] [CrossRef]
Figure 1. Map of the study area, comprising the suburban districts of San Joaquín, Ricaurte, Sinincay, Baños, and Sayausí, in the vicinity of the city of Cuenca, southern Ecuador.
Sustainability 17 09760 g001
Figure 2. Optimal number of clusters determined by the Silhouette method.
Sustainability 17 09760 g002
Figure 3. Two-dimensional t-SNE (t-Distributed Stochastic Neighbor Embedding) visualization of the three clusters selected for this study.
Sustainability 17 09760 g003
Table 1. Variables of small farmers used for the construction of typologies.
Variable CodeVariable DefinitionScale/Measure
Socio-economicstipoHow the person is consideredproducer/intermediary/producer-intermediary
tam_hogarPeople who make up the household1–2/3–4/5–6/7–9/>9
adult_trabAdults who work in agriculture1–2/3–4/5–6/>6
ingresos_agriIncome from agricultureyes/no
fuente_ingresoSources of economic incomeagriculture/raising and commercializing animals/food preparation and sale/sale of labor/others
remesasRemittancesyes/no
IngresosMonthly income (USD)<400/401–715/>715/prefer not to answer
ingreso_alimentIncome for food0–25%/26–50%/51–75%/76–100%
ayud_econonReceives economic assistance from institutionsyes/no
pro_ser_cuencaProducts/services from Cuencayes/no
Agricultural aspectsterrenoLand ownershiprented/sharecropped/communal/family patrimony/owned/loaned/inherited
cultivo1Main cropvegetables/fruit trees/pastures/corn/roots and tubers/other
cultivo2Secondary cropvegetables/fruit trees/pastures/corn/roots and tubers/other
maiz_asocAssociated cornyes/no
frutalFruit treesyes/no
pastoPasturesyes/no
terreno_prepLand preparationmanual/tractor/animal traction/mixed/other
fertilizacionFertilizationyes/no
tipo_fertilizanteType of fertilizernatural/chemical/mixed
fumigacionFumigationyes/no
rotacion_cultCrop rotationyes/no
semillasSeed acquisitionown/purchased/exchanged
agua_suficiencPerception of water sufficiencyyes/no/depends on the time of year
riegoIrrigationyes/no
asisten_tecTechnical assistanceyes/no
Marketingdest_proDestination of agricultural productionmarkets and fairs in the parish/markets and fairs in Cuenca/markets and fairs in other cities/intermediaries/family consumption/supermarkets
comercializacionVirtual commercializationyes/no
asociacionProducers’ associationyes/no
transporteTransportation of productionpublic transport/rental trucks/assistance from a producers’ association/taxi/GAD assistance/own vehicle
Table 2. Socio-economic variables (relative frequencies) of farm households by district, (n = 293), * (significant) and NS (not significant) indicate whether or not a significant relationship exists between the variables and the districts as a result of the Chi-square test (α = 0.05).
Baños (%)Ricaurte (%)San Joaquín (%)Sayausí (%)Sinincay (%)TotalX2p-Value
How the person is considered
Producer4.6503.914.445.453.6910.510.2309
Intermediary58.1490.9169.5371.1178.1873.58 NS
Producer-intermediary37.219.0926.5624.4416.3622.73
100.00
Number of people who make up the household
1–211.6318.1814.0624.4421.8218.0314.780.5405
3–455.8140.9143.7544.4441.8245.35 NS
5–627.9127.2732.0326.6723.6427.50
7–94.659.096.252.2212.736.99
>904.553.912.2202.14
100.00
Number of adults working in agriculture
1–283.7281.8285.9482.2276.3682.0110.870.5402
3–416.2818.1811.7215.5618.1815.98 NS
5–6000.782.225.451.69
>6001.56000.31
100.00
Income from agriculture
Yes58.1472.7339.8464.4487.2764.4839.36.04 × 10−8
No41.8627.2760.1635.5612.7335.52 *
100.00
Sources of economic income
Agriculture41.8627.2760.1635.5612.7335.5272.14.27 × 10−9
Raising and commercializing animals11.6313.647.038.8934.5515.15 *
Food preparation and sale13.9540.9112.58.8925.4520.34
Sale of labor4.6500.784.4401.97
Other27.9118.1819.5342.2227.2727.02
100.00
Remittances
Yes90.772.7385.946076.3677.1518.230.00111
No9.327.2714.064023.6422.85 *
100.00
Monthly income
<400 USD58.1427.2763.2844.4454.5549.5429.580.00323
401–715 USD04.555.472.2210.914.63 *
>715 USD30.2363.6426.5651.1132.7340.85
Prefer not to answer11.634.554.692.221.824.98
100.00
Income for food
0–25%41.865067.1948.8945.4550.6819.030.0877
26–50%41.86502537.7845.4540.02 NS
51–75%13.9507.0311.117.277.87
76–100%2.3300.782.221.821.43
100.00
Receives economic assistance from institutions
Yes79.0795.4590.6286.6770.9184.5414.90.00492
No20.934.559.3813.3329.0915.46 *
100.00
Products/services from Cuenca
Yes34.8854.5553.9137.7843.6444.957.2720.1222
No65.1245.4546.0962.2256.3655.05 NS
100.00
Table 3. Agricultural variables (relative frequencies) of farms by district, (n = 293). * (significant) and NS (not significant) indicate whether or not a significant relationship exists between the variables and the districts as a result of the Chi-square test (α = 0.05).
Baños (%)Ricaurte (%)San Joaquín (%)Sayausí (%)Sinincay (%)TotalX2p-Value
Land ownership
Rented000.782.225.451.6964.4521.43 × 10−6
Sharecropped9.39.0931.2517.781.8213.85 *
Inherited6.984.552.34205.457.86
Family patrimony18.64.553.1211.1116.3610.75
Loaned9.39.0910.1609.097.53
Owned55.8172.7352.3448.8961.8258.32
100.00
Main crop
Fruit trees00003.640.7389.8627.84 × 10−11
Vegetables53.4990.9197.6666.6749.0971.56 *
Corn16.2800.7817.7821.8211.33
Pastures11.634.55011.115.456.55
Roots and tubers13.954.550.782.2214.557.21
Other4.6500.782.225.452.62
100.00
Secondary crop
Fruit trees2.339.096.256.677.276.3236.4591.36 × 10−2
Vegetables34.8813.6421.8826.6725.4524.50 *
Corn27.9122.7323.4437.7843.6431.10
Pastures6.984.5514.064.441.826.37
Roots and tubers4.6536.3621.8811.1114.5517.71
Other23.2613.6412.513.337.2714.00
100.00
Associated corn
Yes23.2622.7356.2517.7818.1827.6441.6391.98 × 10−8
No76.7477.2743.7582.2281.8272.36 *
100.00
Fruit trees
Yes30.2327.2753.9126.6736.3634.8916.9052.02 × 10−3
No69.7772.7346.0973.3363.6465.11 *
100.00
Pastures
Yes18.618.1853.9131.1121.8228.7231.5312.39 × 10−6
No81.481.8246.0968.8978.1871.28 *
100.00
Land preparation
Manual86.0572.7347.6666.6765.4567.7172.5273.59 × 10−9
Tractor11.6327.2727.342012.7319.79 *
Animal traction000.78000.16
Mixed0022.662.221.825.34
Other2.3301.5611.11207.00
100.00
Fertilization
Yes9.34.557.8111.1118.1810.195.44982.44 × 10−1
No90.795.4592.1988.8981.8289.81 NS
100.00
Type of fertilizer
Natural2.3313.6438.2811.115.4514.1651.6227.23 × 10−7
Chemical88.3781.8251.5675.5676.3674.74 *
Mixed9.34.557.8111.1118.1810.19
None002.342.2200.91
100.00
Fumigation
Yes74.425024.2257.7876.3656.5660.4472.34 × 10−12
No25.585075.7842.2223.6443.44 *
100.00
Crop rotation
Yes11.634.5510.1613.3330.9114.1216.1342.84 × 10−3
No88.3795.4589.8486.6769.0985.88 *
100.00
Seed acquisition
Own76.7486.3697.6673.3367.2780.2740.9372.14 × 10−6
Purchased2.3300000.47 *
Exchanged20.9313.642.3426.6732.7319.26
100.00
Perception of water sufficiency
Yes13.9513.6410.9415.5621.8215.18100.352.20 × 10−16
No69.7727.275.4742.2250.9139.13 *
Depends on the time of year16.2859.0983.5942.2227.2745.69
100.00
Irrigation
Yes74.4213.6421.8846.6763.6444.0558.4176.24 × 10−12
No25.5886.3678.1253.3336.3655.95 *
100.00
Technical assistance
Yes30.2359.0971.8835.566051.3532.8091.31 × 10−6
No69.7740.9128.1264.444048.65 *
100.00
Table 4. Marketing variables (relative frequencies) of farms by district, (n = 293). * (significant) indicates a significant relationship between the variables and the districts, based on the Chi-square test (α = 0.05).
Baños (%)Ricaurte (%)San Joaquín (%)Sayausí (%)Sinincay (%)TotalX2p-Value
Destination of agricultural production
Family consumption30.2313.6415.6213.3330.9120.74684.851.01 × 10−8
Family consumption and markets0002.2200.444 *
Intermediaries0010.1605.453.122
Markets and fairs in Cuenca46.51054.6935.562031.352
Markets and fairs in the parish23.2686.3617.1946.6743.6443.424
Markets and fairs in other cities001.562.2200.756
Supermarkets000.78000.156
100
Virtual commercialization
Yes69.7772.7389.8482.2283.6479.6411.42.24 × 10−2
No30.2327.2710.1617.7816.3620.36 *
100
Producers’ association
Yes090.9168.7511.1143.6442.8821032.20 × 10−16
No1009.0931.2588.8956.3657.118 *
100
Transportation of production
Rental trucks48.8440.9139.8446.672039.25226.449.31 × 10−3
Taxi4.6501.564.4402.13 *
Public transport20.939.0911.7222.2227.2718.246
Own vehicle25.585046.8826.6752.7340.372
100
Table 5. Mean and standard deviation values of the Silhouette Index (SI) for each cluster. Statistical differences (α = 0.05) were determined by the Kruskal–Wallis test (K-W) with the Benjamini–Hochberg procedure (BH) as a post hoc analysis (different letters indicate significant differences between clusters).
ClusterMean SIp-Value (K-S)Differences (BH)
10.108 ± 0.0910.01054a
20.074 ± 0.105 b
30.069 ± 0.097 b
Table 6. Typologies generated based on PAM (Partitioning Around Medoids) clustering. * (significant) and NS (not significant) indicate whether or not a significant relationship exists between the variables and the clusters as a result of the Chi-square test (α = 0.05).
CharacteristicsTypologiesp-Value (Chi-Square Test)Significance
Cluster 1Cluster 2Cluster 3
Socio-economicsHow the person is consideredIntermediaryIntermediaryIntermediary0.5308NS
People who make up the household3–43–45–60.0005469*
Adults who work in agriculture1–21–21–20.576NS
Income from agricultureYesNoYes1.179 × 10−15*
Sources of economic incomeAgricultureAgricultureOthers2.003 × 10−14*
RemittancesYesYesYes0.004309*
Monthly income>715<400>7152.77 × 10−12*
Income for food0–25%0–25%0–25%0.05395NS
Receives economic assistanceNoNoNo0.1981NS
Products/services from CuencaYesYesNo0.7788NS
Agricultural aspectsLand ownershipOwnOwnOwn0.05825NS
Main cropVegetablesVegetablesVegetables0.009639*
Secondary cropCornCornRoots and tubers6.039 × 10−6*
Associated cornNoYesYes4.955 × 10−13*
Fruit treesNoYesNo6.531 × 10−6*
PasturesNoYesNo2.2 × 10−16*
Land preparationManualManualTractor2.2 × 10−16*
FertilizationNoNoNo0.00408*
Type of fertilizerChemicalChemicalNatural2.2 × 10−16*
FumigationYesYesNo1.496 × 10−7*
Crop rotationNoNoNo0.006687*
Seed acquisitionOwnOwnOwn0.5232NS
Water sufficiencyDepends on the time of yearDepends on the time of yearDepends on the time of year0.00004217*
IrrigationNoYesNo2.462 × 10−8*
Technical assistanceNoYesYes1.147 × 10−14*
MarketingDestination of agricultural productionMarkets and fairs in the parishMarkets and fairs in CuencaMarkets and fairs in Cuenca0.00006811*
Virtual commercializationYesYesYes0.00699*
Producers’ associationNoYesNo9.502 × 10−10*
Transportation of productionRental trucksRental trucksOwn vehicle1.244 × 10−11*
Disclaimer/Publisher’s Note: The statements, opinions and data contained in all publications are solely those of the individual author(s) and contributor(s) and not of MDPI and/or the editor(s). MDPI and/or the editor(s) disclaim responsibility for any injury to people or property resulting from any ideas, methods, instructions or products referred to in the content.