Abstract
This study takes 22 megacities and super-large cities in China as research subjects, systematically exploring the coupled system relationship between digital maturity and resilient cities. Using methods such as information entropy theory, coupling coordination degree model, and grey relational coefficient measurement, it conducts comprehensive evaluation analysis, coupling coordination analysis, and factor contribution analysis. The results indicate that digital maturity and resilient cities exhibit a mutually reinforcing relationship. The positive interaction and coupling between digital maturity and resilient cities development have further promoted innovation in China’s urban governance and contributed to the long-term sustainable development of cities. Although the digital maturity and resilience levels of these cities show a fluctuating upward trend, they have not yet reached an ideal state, and significant differences exist among different urban clusters and regions. Megacities and super-large cities demonstrate high coupling characteristics among their internal subsystems, but their coordination level remains relatively low. Key factors such as digital governance policies, digital economy, and disaster-resistant infrastructure play a crucial role in advancing the sustainable development of resilient cities. Therefore, it is urgent to improve the coupling coordination mechanism to enhance sustainable development capacity.
1. Introduction
UN-Habitat’s report Unlocking Urban Potential: Investment Pathways for Sustainable Urban Development (2023) shows that the global urbanisation rate has reached 56%, with the urban population exceeding 5 billion. Challenges such as population density, resource constraints, and escalating systemic risks highlight the urgency of building sustainable and resilient cities [1]. Against this backdrop, China’s megacities (with a population of over 10 million) and super-large cities (with a population of 5 to 10 million) not only follow the global urbanisation trend but also face more complex systemic risks. Data from the China City Development Statistical Yearbook (2023) indicates that 22 such cities in China are home to nearly 300 million people and contribute 35% of the national total GDP. Leveraging their agglomeration and radiation effects, these cities drive urban transformation, industrial upgrading, and spatial optimisation [2]. However, their complex systems are confronting safety risks such as chain reactions (e.g., interconnections between primary and secondary risks), spillover effects (e.g., spread of internal risks to surrounding areas), and systemic vulnerabilities (e.g., disparities between old and new urban areas or urban–suburban regions) [3,4]. The consequences of these risks have become increasingly severe, underscoring the urgent need to develop robust risk control strategies.
To address these challenges, China’s “New Urbanization Strategy” prioritises sustainable and resilient cities development, with smart city initiatives as a core governance tool. Resilient cities construction emphasizes “resilient thinking” to enhance risk preparedness, recovery capacity, and scientific and sustainable management of complex urban systems, thereby preventing cascading risk diffusion [5]. Digital maturity is integral to this paradigm shift towards sustainability, enabling cities to transition from passive response to proactive prevention. Technologies such as the Internet of Things (IoT) and artificial intelligence (AI) facilitate real-time risk monitoring, early warning, and proactive mitigation, as exemplified by Hangzhou’s “City Brain 2.0,” Shanghai’s “one screen, one network” system, and Changsha’s “urban lifeline management system [6,7,8].” These cases highlight digital maturity’s role in elevating resilient cities governance, resilience, and long-term sustainability.
Despite growing recognition of digital maturity’s importance, existing research exhibits critical gaps. While studies acknowledge digital technologies as enablers of resilience [9], few systematically examine the dynamic interplay between urban digital maturity and resilience—a coupling relationship essential for aligning technological capacity with risk management needs. Most of the literature focuses on isolated aspects: either digital infrastructure (e.g., IoT deployment) or resilience outcomes (e.g., disaster recovery), lacking integrated frameworks to evaluate their synergistic effects. Additionally, empirical studies on large-scale city samples remain scarce, limiting insights into regional disparities and contributing factors shaping this coupling system.
Against this backdrop, this paper addresses the following research focus: how do urban digital maturity and resilience interact in China’s megacities and super-large cities, and what factors influence their coupling coordination? Motivated by the need to bridge the gap between technological advancement and resilience building, this study conducts a comprehensive analysis of 22 Chinese megacities and super-large cities, aiming to (1) evaluate the current status of digital maturity and resilience; (2) assess the coupling coordination level between these two systems; and (3) identify key factors driving their mutual reinforcement. By unpacking this coupling mechanism, the research seeks to provide evidence-based guidance for aligning digital maturity with resilient cities goals, ultimately supporting the construction of safer, smarter, and more sustainable megacities.
2. Literature Review
2.1. Digital Maturity
The concept of digitisation was first introduced between the 1980s and 1990s. Digitisation was initially defined as the “process of transforming physical objects into virtual bits” [10]. Subsequently, the concept of digitisation was integrated into the sociological field and its margin has extended. The digitisation process contributes a lot to economic growth and social development. The “digital city” originated from the digital virtual earth, which was mentioned by former US Vice President Al Gore in 1998. The digital city was aiming to serve human cities through Internet digital technology [11]. This concept has been gradually accepted by urban managers around the world ever since.
The concept of digital city has gradually been applied alongside the development of information technologies and urban telecommunications infrastructure in China. Ding Ding and Meng Hui (2000) defined Digital City as “Cities which use digital information processing and network communication technology in planning, running, and production management [12]. These cities can fully integrate and utilise information resources through IT. Qiu Peien (2006) defined city digital maturity as “The process which encodes different urban districts to use digitalised infrastructure and management procedures to run the city and provide public services [13]. In recent years, city digital maturity has become more multidimensional and specific, focusing more on applications and transformation in specific fields. According to the China Academy of Information and Communications Technology (2020), digital maturity was defined as “Using digital technologies (such as big data, cloud computing, artificial intelligence, information and communication technology, etc.) to transform economic development mode, urban lifestyle and governance” [14]. Digital maturity is something more than infrastructure construction, and should be focused more on economic, social development, and living standards. Zheng Lei (2021) defines cities’ digital maturity as a “Fundamental change in the urban development model and form driven by digital technology, covering transformation in many fields such as economic industries, public life, and governance” [15].
The measurement of digital maturity has been discussed for years, with many comprehensive indicators which in line with the current situation. Thajba Aljowder, Mazen Ali, and Sherah Kurnia (2023) constructed a comprehensive evaluation framework for urban contexts using the Delphi Method, proposing a model for assessing smart city maturity termed the “Focus Area Maturity Model (FAMM)” [16]. This model encompasses seven core dimensions: ICT (information and communication technology), economy, environment, society, resources, services, and governance. It aims to conduct a holistic assessment of urban smart city development levels across functional domains, facilitating cities in evaluating performance, identifying strengths and weaknesses, and providing theoretical guidance for the future development pathways of smart cities. Zhang Gui, Qian Yu, and Zhao Yongguan (2024) set the primary indicators as digital government, digital industry, and digital society and the secondary indicators as government digital attention, government digital platform construction, digital industrialisation, industrial digital maturity, digital innovation, digital society, digital living standards, and digital attention [17]. Ge Yunpeng, Shi Yijun et al. (2024) set the primary indicators as digital economy, digital society, digital infrastructure, and digital ecology [18]. The digital society and infrastructure indicators are largely the same as those of other scholars above. For instance, Digital ecology consists of research capabilities and the number of digital economic practitioners per 10,000 people. The digital economy indicator comprises per capita telecommunications business volume, the proportion of computer service and software practitioners, the proportion of transportation, warehousing, post and telecommunications practitioners, the digital finance coverage, and the depth of its application. Gregory Vial (2021) used digital governance, digital society, digital economy, and digital technology as criteria to measure digital maturity [19]. Li Jikai et al. (2025) set three dimensions in the evaluation system for digital maturity: financial input, equipment, and efficiency [20]. They used statistics of science and technology education expenditure, Internet penetration rate, the number of invention patents, and the total volume of telecommunications services to calculate the indicators above instead of collecting them directly. Chinoracky (2021) quantified the indicators of the urban digital economy by calculating the proportion of the labour force, their skills, and information and communication income [21]. The indicators he used are almost the same as Chinese scholars. Moroz (2017) employed a similar approach [22]. He constructed an indicator system that includes Information and Communications Technology (ICT) employment and skill levels. The purpose was to conduct horizontal comparisons and quantitative assessments of digital economy levels in European countries such as Poland.
2.2. Resilient Cities
Resilience refers to a material’s ability to absorb energy and recover after being deformed. It is originally a concept in physics. Resilience was proposed in systems ecology in the 1970s, representing a shift in Cold War resource management towards a non-equilibrium model of complex systems [23]. Holling tried to design a “socio-ecological resilient” system, emphasising the persistence of systems under extreme disturbances. His research shows that the Resilience theory is tied to the theory of complex systems in this period [24,25]. In the 1980s, with the development of social safety risk and urban theory, the Resilience theory was valued by researchers and administrators. The theory was implemented in urban management and safety governance. Then, “resilient cities” was first introduced at the United Nations Global Summit on Sustainable Development in 2002, targeting at helping cities deal with various challenges, including natural disasters, man-made disasters, climate change, and other risks [26]. Godschalk D R (2003) thought that “A resilient city is a sustainable network composed of physical systems and human communities” [27]. He analysed the concept of resilience by combining the physical system with the structure of human activities within the community. Sara Meerow (2016) thought that resilient cities refers to “the ability of an urban system and all its constituent socio-ecological and socio-technical networks across temporal and spatial scales to maintain or rapidly return to desired functions in the face of a disturbance, to adapt to change, and to quickly transform systems that limit current or future adaptive capacity” [28]. The features of resilient cities include synergy, adaptability, advanced technology, engineering-redundant, learnable, multi-participatory and collaborative, self-centred, and autonomous in action [29,30,31]. When facing urban disasters, resilient cities can respond and self-recover rapidly to avoid permanent damage [32]. Huang Hong, Li Ruiqi, Fan Weicheng, and Shan Chunchang (2018) defined a resilient city as “one that can effectively withstand dangers arising from internal and external economic, social, and technological systems, maintaining essential city functions even after major disasters [33]. Such a city possesses the capacity for adaptive adjustments and sustainable development”. Zhu Zhengwei et al. (2024) posits that resilience within urban safety fundamentally refers to “the proactive ability to withstand emergency events, rapidly recover from them, and foster subsequent development [34]. Its key characteristics are self-organisation and swift disaster impact reduction.” To evaluate resilient cities, Zhu developed a comprehensive three-dimensional framework to deconstruct the concept. The system includes
- 1.
- Structural resilience: this encompasses both governing bodies (government, enterprises, citizens, etc.) and institutional resilience.
- 2.
- Functional resilience: the ability to defend, recover, learn, and change from disasters.
- 3.
- Indemnificatory resilience: this includes supplies, technology, and legal safeguards.
To evaluate urban resilience levels, at the academic research level, early studies defined resilience as the ability of a system to rapidly recover without permanent damage after being subjected to shocks, and adopted the DPSIR (Driving Force–Pressure–State–Impact–Response) framework to integrate evaluation indicators for infrastructure, social, and economic subsystems [35]. Bruneau, M., Chang, S. E., Eguchi, R. T., & Lee, G. C. (2003) first proposed the four-dimensional TOSE model (Technical, Organisational, Societal, Economical) for assessing community resilience, with each dimension requiring the fulfilment of four key characteristics: Robustness, Redundancy, Resourcefulness, and Rapidity [36]. European comparative studies use the composite index method to combine quantitative data (such as network redundancy and risk GDP) with expert weights, showing that coastal cities score higher in infrastructure resilience but lower in social equity. To break through the limitations of static assessment, latest studies integrate system dynamics with GIS-based Exploratory Spatial Data Analysis (ESDA) to track the dynamic evolution of resilience under multiple disaster scenarios [37]. In terms of urban managers’ practice, in 2014, the Rockefeller Foundation launched the “100 Resilient Cities” project and proposed the City Resilience Framework Indicator System (CRI) [38]. This framework divides resilience into four dimensions: Health and Well-Being, Economic and Social, Infrastructure and Environment, and Leadership and Strategy. The People’s Government of Guangdong Province in China believes that attention should be paid to building standardised guarantee mechanisms covering safety resilience in fields such as food and drug safety, governance of organised crime and gang-related organisations, and emergency response (disaster prevention and mitigation as well as public place safety assurance) [39]. In 2018, the Technical Committee for Urban Sustainable Development proposed the “Indicators for Resilient Cities in Urban Sustainable Development” (ISO 37123), which is one of the widely used assessment indicator systems for resilient cities in the international community [40].
2.3. Digital Maturity and Resilient Cities Governance
Relevant empirical studies have fully demonstrated a close inherent relationship between urban digital maturity and resilient cities. In quantitative research, Simona Andreea Apostu et al. (2022) conducted a regression analysis on the correlation between smart cities and resilience in Europe, finding that for every one-unit increase in the smart city index, the resilient cities index increased by an average of 0.37 units, indicating a significant positive correlation between smart cities and resilient cities [41]. Ruoxi Yu et al. (2025) studied the impact of China’s urban digital transformation (a systematic process of promoting multidimensional reforms in economy, society, and governance through digital technologies such as big data and AI at the urban level) on urban innovation resilience [42]. Using the difference-in-differences (DID) method, they found that digital transformation significantly enhances urban innovation resilience by improving green total factor productivity, with the moderating effects of urban industrial upgrading and innovation vitality. This effect is more pronounced in eastern regions and large cities. Wei Jiuchang and Wang Yan (2024) also used the DID method to analyse the impact of smart city construction on work safety, finding that smart city construction has a positive effect on work safety through benchmark regression [43]. The study revealed that factors such as city size, government–enterprise relationships, and the distance between the city and the provincial capital influence governance [43]. In qualitative research, Daiane Maria de Genaro Chiroli, Thallita Puzi Ferrassa et al. (2025) focused on the transformative potential of digital platforms in building smart, resilient, and sustainable cities [44]. Through multidimensional case study comparisons, they explored how digital transformation helps cities address challenges like accelerated urbanisation and climate change. The research argues that rapid urbanisation and climate change exacerbate urban vulnerability, while digital platforms (e.g., AI, IoT, and big data) are key tools to enhance urban operational efficiency, participatory governance, and innovation capacity. The paper proposes a resilient city platform framework integrating digital transformation and maturity models, including:
- 1.
- Maturity Assessment: Dynamically track urban transformation stages based on ISO standards;
- 2.
- Real-time Monitoring (IoT): Sensor networks integrate environmental, transportation, and other data;
- 3.
- Smart Mobility: Optimises public transportation and new energy vehicle management;
- 4.
- Crisis Management: AI predicts disasters and automatically activates response protocols (e.g., flood warnings);
- 5.
- Citizen Participation: Achieve transparent governance and feedback through digital portals (e.g., New York Open Data).
Wu Chao, Huang Xi, and Wang Bing (2022) summarised the form of smart and safe cities, stating that smart and safe cities need to equip the ability to analyse big data on safety, a multi-agent collaborative working network, resilient cities basic units, and an integrated system of comprehensive safety resources [45]. Shan Yong (2018) used a Geographic Information System (GIS) to visualise public safety events, and regarded this move as an open spatial justice [46]. He believed this was beneficial to citizen participation in public safety governance and upgrades of urban public safety governance models. In addition, there is research about the emergency command brain and the urban information safety database, providing specific solutions for urban safety governance.
Existing studies indicate that the international academic community has reached greater consensus on indicators for measuring the digital maturity of smart cities, and the assessment system for resilient cities has gradually improved. Urban digital maturity is primarily measured across four dimensions: economy, society, governance, and application. Although the academic community has not yet formed a universally accepted definition of resilient cities, most researchers agree that resilient cities should possess characteristics such as Resistance, Redundancy, Adaptability, and Rapid Recovery.
However, there are still many areas that need to be further explored in the existing research. The coordination of complex subjects, the evolution dynamics between digital maturity and resilient cities, and the investigation of heterogeneous cities such as densely populated cities are all weak links in the current research, which also indicate the development direction of future research. As global urbanisation accelerates, the scale of megacities and super-large cities continues to expand, making the clear definition of resilient city assessment mechanisms tailored to these specific contexts an urgent necessity.
Therefore, based on panel data availability and policy consistency, this study selects large-scale practice samples from China. As the world’s largest developing country, China leads in the scale and speed of urbanisation, with super-large cities exhibiting typical complex challenges in population density, economic transformation, and technological application. Based on these characteristics, this study deeply analyses the internal mechanism, association pathways, and development trends between digital maturity and resilience of Chinese cities. By dynamically analysing their correlation, it reveals the key driving factors for synergistic development to enhance the universality and relevance of the research conclusions. The research aims to provide theoretical support and practical guidance for Chinese cities to improve comprehensive risk response capabilities and optimise sustainable development levels, while attempting to extract universal solutions for sustainable governance of global super-large cities from Chinese local cases.
3. Research Methodology
3.1. Coupling Relationship
Coupling refers to the phenomenon in which two or more systems influence and collaborate through various interactions. Eventually, a dynamic relationship of interdependence, coordination, and mutual reinforcement will be formed in the positive interaction among subsystems [47]. The coupling coordination is the extent to which systems interact with each other. Digital maturity and resilience interact and mutually promote each other. This phenomenon shows how subsystems become increasingly complex in modern urban development.
Digital maturity and resilience systems can be seen as two subsystems interacting with each other, as shown in Figure 1. A resilient city can be measured by the three dimensions according to the public safety triangle theory [34]: incident metrics, safety management, and disaster-bearing carriers. Digital maturity is measured by a matrix covering dimensions such as digital infrastructure, digital governance, digital innovation capabilities, and the digital economy. Digital maturity and safety resilience metrics interact and influence each other to form a unified coupling system.
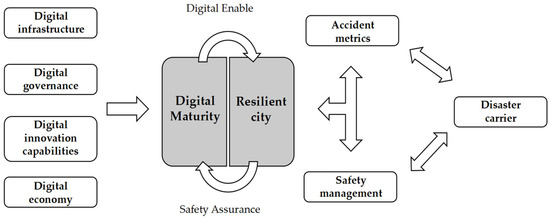
Figure 1.
Coupling mechanism of digital maturity and resilient cities. Created by the author.
3.2. Comprehensive Evaluation Model
There are methods such as the range method, Euclidean distance method, mean standardisation, logarithmic compression data method, Sigmoid (logistic) function, etc., in the data standardization and dimensionality reduction process. This paper uses the range method. It should be noted that the range method includes both positive and negative indicators. Among the positive indicators, the larger the number, the more positive it is. Conversely, in negative indicators, the smaller the number, the more positive the meaning [48].
represents the number j indicator of the i region. and are the maximum and minimum values of , respectively.
To make the calculation possible, we add 0.001 to the standardised metric. After nondimensionalizing the data, we use the entropy method and principal component analysis method to calculate the weights, respectively. The multi-index weighted model was used to derive the index of digital maturity for China’s megacities and the index of resilient cities. The calculation method is as follows:
- 1.
- The principal component score:
- 2.
- Then, calculate the model coefficients.
denotes the factor coefficient of the i-th indicator after rotation of the j-th principal component. is the normalised factor coefficient. is the eigenvalue under the principal component. var(Fj) represents the percentage of variance under the j-th principal component.
We calculate the entropy weight and the overall score. The entropy method, also known as the entropy weight method, is a method of calculating objective weights. The steps are as follows [49,50]:
- 1.
- The proportion of each indicator:
- 2.
- The information entropy value of the J indicator:
- 3.
- The coefficient of difference for the J metric:
- 4.
- The weights of each metric:
Given the average score of the survey sample, the weight is calculated based on the entropy after dimension reduction by principal component analysis. A multi-index weighting model was used for the weighted evaluation of the criterion layer:
Among them, E represents the Comprehensive Evaluation Index, which can integrate different indicators from multiple dimensions into a single, comparable value. St represents the dimensionless index score derived via the range method, and Wt denotes the weight of the corresponding indicator.
3.3. Coupling Coordination Degree Calculation
To measure the coupling coordination mechanism between the two subsystems of digital maturity and resilience, this paper specifically adopts the following steps to calculate the coupling coordination degree [51]:
- 1.
- Coupling (C) reflects the strength of interaction between systems, with values ranging from 0 to 1. The larger the value, the stronger the interdependence and influence between systems.
Ui represents the comprehensive index score of the subsystem. There are two subsystems in this research: and .
- 2.
- Coupling coordination degree (CCD) is an indicator used to measure the degree of interaction, mutual influence, and ultimate collaborative development between two or more systems (or internal elements of a system). It is denoted by “D” in the formula.
- 3.
- T represents the overall development level of the two subsystems: the digital maturity level of megacities and super-large cities, and resilient cities.
represents the weight of the subsystem, which is set to 0.5 to maintain equal importance between the two subsystems. The range of the coordination degree D is primarily divided into 10 levels [51], as shown in Table 1.

Table 1.
Evaluation criteria for coupling coordination.
3.4. Grey Relational Grade Evaluation Model
The grey relational degree evaluation model was first proposed by Dr Deng Julong (1983) [52]. With the deepening of research, this model has been used for multidisciplinary influencing factor analysis. The grey relational model is suitable for situations where sample indicator data is incomplete. Since the trend data has been derived from the internal evaluation of the subsystems in this study, and the indicators for the system can be infinite, it can be considered a grey system [52]. By calculating the grey correlation degree, we can determine the correlation between systems based on their sequence development patterns. The correlation between the indicator layers and the two subsystems (digital maturity and resilient cities) can also be understood. In a word, we analyse the indicating factors of the co-development of urban digital maturity and resilience based on the degree of correlation. As for the calculation of the grey correlation degree, it generally takes the following steps:
- 1.
- Set the reference column.
- 2.
- Set the coupling coordination as the reference sequence, and the criteria indicators of the subsystem are set as the comparison sequence.
- 3.
- Data normalisation processing was conduced by the formula mentioned in previous sections.
- 4.
- Calculate the grey correlation coefficient which equals the correlation coefficient of the comparison sequence and the reference sequence on the i metric.
- 5.
- Calculate the grey correlation degree:
The greater the grey correlation of each subsequence in the comparison sequence, the greater its influence on the reference sequence. is the resolution coefficient and equals 0.5. correlation level classification is shown in Table 2.
Table 2.
Types of grey correlation and coupling intensity.
4. Results
4.1. Comprehensive Evaluation
4.1.1. Metrics for Coupling Systems
In the study of urban digital maturity, scholars use different indicators to reflect the status of technological development. Research indicators range from single indicators (such as digital government) to composite indices (such as urban digital development index), but the core dimensions show high consistency. To improve the accuracy and standardisation of research, four verified dimensions have been generated using the comprehensive weighted model mentioned earlier, including digital infrastructure (such as 5G networks), digital governance (such as e-government), digital innovation capability (such as R&D), and digital economy (such as the scale of digital industries). These indicators jointly quantify urban digital governance, the robustness of digital infrastructure, digital innovation capability, and the development of digital economy.
Use “+”/”−” to distinguish indicators’ effects on digital maturity and resilient cities: “+” indicates positive indicators (the higher the indicator value, the more favourable). “−” indicates negative indicators (the higher the indicator value, the more unfavourable or reflective of more severe issues).
Digital Infrastructure (Code X1): Focuses on digital basic support capabilities (e.g., communication networks and user scale), and includes three indicators (Y1–Y3) such as “long-distance optical cable line density”, “mobile phone user ratio”, and “international Internet user ratio”.
Digital Governance (Code X2): Focuses on government digital management and policy guidance (e.g., digital governance platforms and policy statements), and includes two indicators (Y4–Y5) such as “frequency of digital-related words in government work reports” and “establishment time of municipal big data management platforms”.
Digital Innovation Capacity (Code X3): Measures innovation output and input in the digital field (e.g., patents, and R&D expenditures), and includes two indicators (Y6–Y7) such as “number of patent grants” and “internal R&D expenditures”.
Digital Economy (Code X4): Reflects the scale and quality of integration between the digital industry and the economy (e.g., digital industry output value, employment, and financial penetration), and includes four indicators (Y8–Y11) such as “number of employees in the information industry”, “proportion of telecommunication business revenue in GDP”, “total output value of the digital industry”, and “digital inclusive finance index”.
Several decision-making level indicators are set under each criterion layer, and the “Code Properties” of all indicators are “+”, indicating that these indicators are positive indicators (i.e., the larger the indicator value, the higher the level of the corresponding dimension or overall “digital maturity”) (Table 3).
Table 3.
Evaluation index matrix of urban digital maturity. Created by the author.
The indicators for resilient cities mainly refer to the research frameworks of Fan Weicheng, Shang Yong, Yue Qingrui, Wu Xiaolin, etc. [36,53,54,55,56], and are developed in combination with the public safety triangle theory. As shown in Table 4, the evaluation index system for resilient cities is constructed from three levels: “system layer—criteria layer specific indicator” and is used to quantitatively evaluate the resilience level of cities in responding to various risks (accidents, disasters, etc.).
Table 4.
Evaluation index matrix for resilient cities. Created by the author.
Accident Metrics (code A1): Focuses on the occurrence, loss, and impact of various safety accidents, reflecting the degree of safety threats faced by the city. They are negative indicators (B1–B7, B9–B10), such as “total number of work safety accidents (B1)”, “accident mortality rate per 100,000 population (B2)”, “unemployment rate (B9)”, etc. The larger the value, the more frequent the accidents, the worse the social stability, and the more the urban resilience is impacted.
Disaster Carrier (code A2): Focuses on the basic elements that carry/respond to disasters in the city (such as infrastructure, ecology, resources, etc.), reflecting the city’s own disaster resistance hardware conditions. All are positive indicators (B11–B20), such as “number of medical institutions (B11)”, “number of earthquake emergency shelters (B12)”, “urban green coverage rate (B14)”, etc. The larger the value, the more perfect the support systems such as medical care, emergency response, and ecology, and the stronger the “carrying capacity” of the city to respond to disasters.
Safety Management (code A3): Reflecting the city’s active management measures in safety and disaster prevention and control (such as project and fund investment), it reflects the city’s management behaviours to improve safety. All are positive indicators (B21–B22), such as “number of urban emergency system construction projects in the current year (B21)” and “expenditure on disaster prevention and mitigation and public safety (B22)”. The larger the value, the more investment/actions the city has in safety management, and the stronger its ability to reduce risks and improve resilience.
The data is collected from the China Urban Statistical Yearbook, China Statistical Yearbook, Statistical Report on the Development of China’s Internet, China Science and Technology Statistical Yearbook, China Urban Construction Statistical Yearbook, Peking University Digital Inclusive Finance Index, Statistical bulletins on the Development of emergency Services in various cities, and Statistical Bulletins on National Economic and Social Development. We also crawled official databases such as EPS, China Economic Data, the State Administration of Work Safety of China, the emergency management department, etc. We selected data from 2016 to 2022, and filled in the default values using the linear interpolation method.
4.1.2. Comprehensive Evaluation Results—Digital Maturity
- 1.
- General features: A Rising trend and inter-city disparities.
Urban tier differentiation: Top cities lead, with significant hierarchical differences.
As shown in Table 5, the assessment results of digital maturity for megacities and super-large cities in China indicate an overall fluctuating upward trend. Beijing, Shanghai, Guangzhou, and Shenzhen continue to top the total score list, while Hangzhou, Chengdu, Nanjing, and Wuhan rank in the second tier. Cities such as Kunming, Harbin, and Dalian are relatively backward.
Table 5.
Index of digital maturity in Chinese megacities and super-large cities.
First tier: Due to solid economic foundations, concentrated scientific and technological resources, and policy support, Beijing and Shanghai have consistently led. In 2016, their indices already exceeded 0.42 (Beijing 0.5870, Shanghai 0.4209); in 2022, they approached or surpassed 0.6 (Beijing 0.6929, Shanghai 0.6333). Guangzhou and Shenzhen are close behind, with their 2022 indices reaching 0.5541 and 0.6155, respectively, demonstrating strong growth momentum.
Second tier: Leveraging their unique industrial strengths (e.g., Hangzhou’s Internet industry, and Chengdu’s electronic information industry), these cities have robust momentum for digital transformation. Emerging cities like Hangzhou, Chongqing, and Chengdu perform remarkably. For instance, Hangzhou’s index was only 0.1768 in 2016 and rose to 0.3264 in 2022; Chengdu’s index increased from 0.2154 to 0.3367. Core reasons follow.
Third tier: Location conditions, economic structure (e.g., a high proportion of traditional industries), and a lack of scientific and technological talent reserves result in relatively slow digital progress. For cities like Kunming, Harbin, and Dalian, their indices were mostly below 0.1 in 2016 (Kunming only 0.0305) and remained in the 0.07–0.1 range in 2022. Core constraints follow.
Notably, due to the COVID-19 pandemic, Wuhan’s digital development assessment index declined from 2020 to 2021.
- 2.
- Geographical evolution trends: decreasing from the east shore to the west, with overall growth in each city cluster.
Geographical evolution analysis is used to analyse the regional differences in the digital maturity. By analysing the heterogeneity among regions, the trends of geographical dynamic evolution can be discovered. Regarding geographical evolution analysis, this study divides megacities and supercities into regions and urban agglomerations for research. The Capital City Cluster includes Beijing and Tianjin. The Shandong Peninsula Urban Agglomeration includes Jinan and Qingdao. The Northeast China Urban Agglomeration includes Shenyang, Harbin, and Dalian. The Yangtze River Delta Urban Agglomeration is composed of Shanghai, Nanjing, Hangzhou, and Suzhou. The Pearl River Delta Urban Agglomeration is composed of Guangzhou, Shenzhen, Foshan, and Dongguan. The Central China Urban Agglomeration includes Wuhan, Zhengzhou, and Changsha. The Western China Urban Agglomeration includes Xi’an, Kunming, Chengdu, and Chongqing.
Data from Table 6 and Figure 2 show that the digital maturity of megacities and supercities exhibits a decreasing trend from east to west, yet within each urban agglomeration, an upward momentum persists. Among them, the Capital Urban Agglomeration boasts the highest level of digital development, with the Yangtze River Delta and Pearl River Delta urban agglomerations trailing slightly behind. By 2022, the Pearl River Delta Urban Agglomeration had surpassed the Yangtze River Delta Urban Agglomeration. Since 2016, the gap between the Yangtze River Delta and the Capital Urban Agglomeration has gradually narrowed.
Table 6.
Digital maturity by urban clusters.
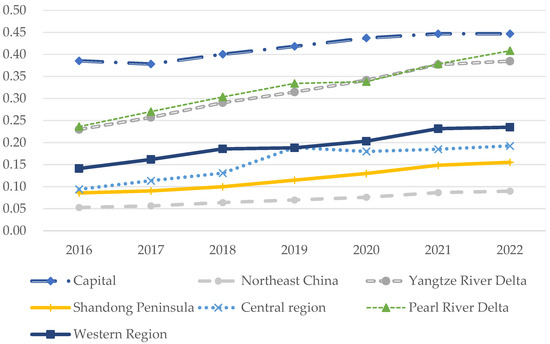
Figure 2.
Digital maturity of urban clusters.
The Central Urban Agglomeration follows a different development trajectory: Wuhan experienced a slight decline in 2020 due to the COVID-19 pandemic but rebounded from 2021 to 2022. Compared with the Chengdu–Chongqing Urban Agglomeration, the megacities in the Central and Shandong Peninsula urban agglomerations have relatively weak urban dominance, resulting in more balanced internal development in these two regions. Technology application and development are more concentrated in areas where provincial capitals exert strong dominance, leading to a slight lag in the digital maturity index of the Central and Shandong Peninsula urban agglomerations.
However, some scholars have pointed out that the digital maturity of central provinces remains higher than that of western regions [57]. Western urban agglomerations, leveraging the high urban dominance of Sichuan and Chongqing and the advantages of the Yangtze River Economic Belt, continue to drive the digital development of other cities. On the other hand, the northeastern region lags behind the national average in digital development due to its weak economy, population outflow, backward industrial structure, slow economic growth, and the impact of the pandemic. For instance, Harbin’s digital evaluation indicators showed negative growth in 2022, and Dalian’s digital maturity has declined for two consecutive years from 2021 to 2022.
In addition, the radiation effect of urban agglomerations facilitates the transfer of digital resources to surrounding cities. Driven by the three major urban agglomerations—the Yangtze River Delta, Beijing–Tianjin–Hebei, and the Pearl River Delta—the digital maturity of satellite cities such as Foshan, Dongguan, and Tianjin has improved significantly. Meanwhile, Qingdao and Jinan in the Bohai Bay region have also maintained a favourable upward trend. In the central and western regions, large cities display different patterns of digital maturity: Xi’an and Zhengzhou have achieved remarkable growth, while Kunming shows a slow but steady upward trend.
4.1.3. Comprehensive Evaluation Results—Resilient Cities
- 1.
- General characteristics: A rising trend with inter-city disparities.
From 2016 to 2022, the resilience in China’s megacities and super-large cities has shown an overall upward trend (Table 7). Beijing’s resilience index is at the top due to fewer related safety accidents, and better carrier and accident indicators. Shanghai, Guangzhou and Shenzhen are right behind Beijing due to their good infrastructure and better carrier indicators. Cities in the Central cluster, Sichuan–Chongqing cluster and the Shandong Peninsula cluster are in the middle tier. Xi’an, Foshan, Harbin, Kunming and Shenyang are at the bottom. It is worth noticing that some cities’ resilience increased in 2020 and 2021, which may be caused by pandemic production halts resulting in a decrease in the number of deaths from safety accidents. After 2020, some cities developed policies to enhance resilience and safety governance. As a result, the resilient cities in those cities continued to improve from 2020 to 2022.
Table 7.
Resilience of Chinese megacities and super-large cities.
- 2.
- Geographical trend: The resilience approximates with small variations among urban clusters.
From Figure 3, we can see that resilience in city clusters ranges from 0.15 to 0.35 with little gap. The resilience of megacities and super-large cities among different clusters has increased slowly but steadily. From 2016 to 2022, the gap between different clusters has widened slightly. Yet, the resilience difference values are still relatively small, only between 0.05 and 0.15. The resilient cities in the Capital cluster have risen rapidly, while the Northeast cluster has risen much more slowly. In conclusion, the Capital cluster, the Yangtze River Delta cluster, the Pearl River Delta cluster, and the Shandong Peninsula cluster have higher levels of resilient cities than the national average. The two western cities, Sichuan and Chongqing, have a relatively higher level of resilience.
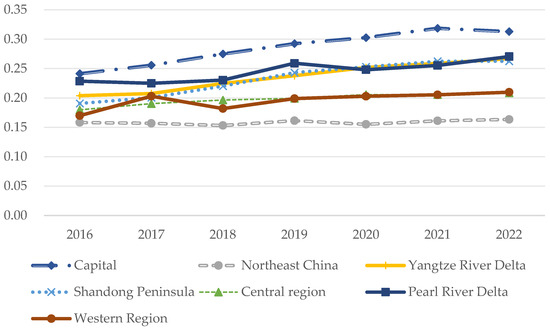
Figure 3.
A line graph of regional differences in city clusters.
4.2. Coupling Coordination Analysis
4.2.1. Coupling Coordination Calculating Results
Through a comprehensive evaluation of 22 Chinese megacities and super-large cities in previous sections, we can tell that the digital maturity and resilient cities have shown a fluctuating upward trend from 2016 to 2020. Yet, there are differences in urban development among different regions. There is also unevenness in the digital maturity and resilient cities among different cities. Therefore, to measure the interaction between the two subsystems more specifically, we use the method of coupling coordination for calculation; the results are shown in Table 8.
Table 8.
Coupling coordination degree.
Coupling degree reflects the degree of influence and dependence within or between systems. Generally, the level of coupling is closely related to the degree of dependence between systems. The results show that the coupling degree of China’s megacities and super-large cities is high, basically above 0.9. In 2016, only Kunming in the western region and a few cities in the northeast region were in a benign coupling state, and by 2022, they had basically developed into a highly coupled state. Economically developed megacities and super-large cities have always been in a highly coupled state. This indicates a high degree of dependence and influence between the digital maturity level subsystem and the resilient cities level subsystem in megacities and super-large cities. From the perspective of system interaction, digital maturity has a multiplier effect on resilience. At the data level, risk sources are digitalised. For example, Nanjing has “registered” all 320,000 actual units and 880,000 risk sources, connecting them to 12,000 comprehensive governance grids + 1600 emergency grids, forming a “single risk network” [58]. Chengdu conducts real-time sampling of “vital signs” such as gas, water supply, and drainage, bridges, and crowded places, with a sensing network coverage rate of 85% [59]. A safe environment provides basic support for digital maturity. The adoption of digital governance in urban governance has become a path dependence. Foshan has centralized accident investigation authority in the Municipal Work Safety Committee Office, using “digital accountability” to force departments to share data; once a risk occurs, the platform automatically links multi-department databases, and failure to access the system is regarded as dereliction of duty, forming a highly coupled closed loop of “data-power” [60] digital maturity and resilient cities are no longer just about information safety, but deeply coupled with the “functional safety” of lifelines such as water supply, power supply, medical care, and transportation [61].
In addition, the coupling degree between resilience and digital development in megacities and super-large cities in the northeast region is relatively low, mainly due to objective limitations in basic urban development indicators such as per capita GDP and public safety expenditure. For Beijing, the mutual coupling relationship between digital maturity and resilient urban governance needs to be further enhanced. The fundamental reason lies in its capital function positioning: as the national political centre, Beijing has long maintained a high level of basic security safeguards, and compared to other cities, its resilient urban governance system has a relatively lower dependence on digital empowerment. However, comprehensive evaluations show that Beijing’s security safeguards and digital development are still in a highly coupled state.
In summary, a high coupling degree reflects the interdependence and mutual influence between the digital maturity level and the resilient cities level in megacities and super-large cities. Urban digital maturity is reflected in all aspects of production and life, and it is bound to affect safety governance. Compared to ancient Chinese cities that relied on beacons to transmit war information, today in urban emergency response, digital technology can not only quickly predict natural disasters but also allocate resources and use artificial intelligence to assist in emergency decision-making. Digital maturity deeply empowers resilient cities governance. Similarly, it also makes safety governance inseparable from the support of digital technology. Safety level provides an environmental guarantee for digital development. Therefore, urban digital maturity and safe and resilient cities are closely linked, interdependent, and mutually promote development.
4.2.2. Coupling Coordination Dynamic Evolution Trends
It is generally believed that the degree of coupling does not directly indicate the superiority or inferiority of subsystems, but the degree of coupling coordination can indicate the efficiency and stability between subsystems [62]. A high degree of coupling indicates that subsystems develop harmony with each other. As shown in Figure 4, the average digital maturity and resilient cities in China’s megacities and super-large cities is characterised by high coupling and low coordination. The two subsystems are under the condition of “On the verge of imbalance” and “Reluctant balance”. The coupling degree is rising from 2016 to 2022, and the two subsystems are moving towards a “Reluctant balance” status. Shanghai, Guangzhou, and Shenzhen have entered “the Primary balance”. Beijing has entered “the Moderate balance” level, which proves that the efficiency and stability between the two subsystems of Beijing’s digital maturity and resilience are in good and synchronous development. With the implementation of the “safety resilience initiative” policy, more cities may enhance the coordination degree in the future.
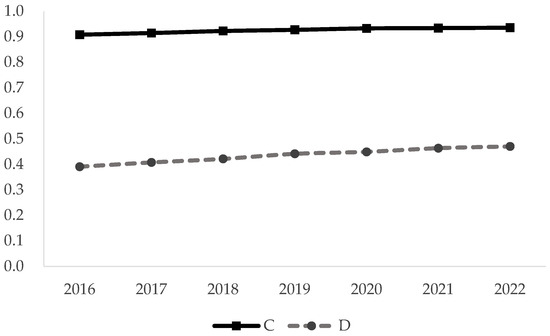
Figure 4.
Graphs of coupling and coupling coordination (2016–2022). Note: “C” represents the coupling degree, and “D” represents the coupling coordination degree.
To further explore the geographical dynamic evolution trend of the coupling coordination degree between digital maturity and resilient cities from 2016 to 2022, we selected 2016, 2018, 2020, and 2022 as time nodes and used ArcGIS 10.8.1 to analyse the evolution trend. Please see Figure 5.
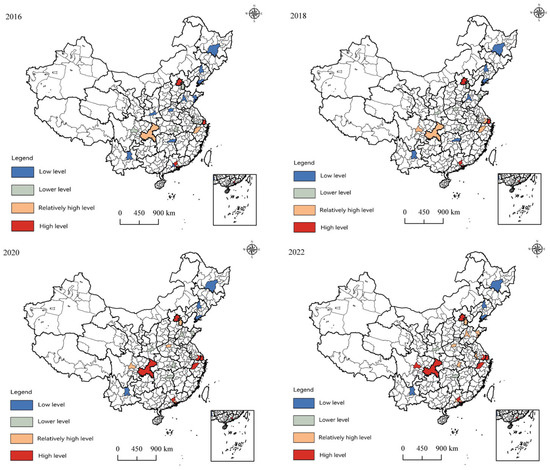
Figure 5.
Geographical diagram of coupling and coordination level.
According to the index of two subsystems, the digital maturity in Beijing, Shanghai, Shenzhen, and Guangzhou is generally higher than their resilience. The digital maturity in the central and western regions, as well as Foshan and Dongguan, are consistent with the levels of resilience. In 2016, only Beijing, Shanghai, Guangzhou, Shenzhen and some other cities reached “Reluctant balance” state with an index of 0.5 to 0.6. Cities in the central and western regions, as well as those in northeast China, had an index ranging from 0.35 to 0.5. Two years later, the coupling and coordination degrees of most of China’s megacities and super-large cities rose. Some cities in the Yangtze River Delta cluster and the Pearl River Delta cluster reached the “Reluctant balance” level. Beijing was the first Chinese city to enter the “Moderate balance” level in 2020. The coupling coordination levels of Hangzhou, Chengdu, and Chongqing have reached the “Reluctant balance” level. Cities in the central region are approaching 0.5 in 2022 and are about to enter the “Reluctant balance” level, while cities in the western region are still left behind.
These four time nodes reflect the evolving trend of the coupling and coordination degree between the digital maturity and resilience of China’s megacities and super-large cities. It shows the pattern that first-tier cities (Beijing, Shanghai, Guangzhou, and Shenzhen) took the lead, and relatively underdeveloped cities in the central, western, and northeastern regions followed. It is worth noticing that most megacities and super-large cities’ digital maturity is better than their resilience, despite their different development trends. This phenomenon indicates that digital maturity can drive public safety. In recent years, megacities and super-large cities have renewed their infrastructure with digital technology and utilised the digital elements to allocate emergency management and safety governance resources. This action has successfully improved the safety governance efficiency [63]. Secondly, both digital maturity and resilient cities have shown an upward trend in most megacities and super-large cities. Finally, although the digital maturity and resilience gap between cities has broadened, cities in the central, western regions and the northeastern region still improved their digital maturity and resilience slowly but steadily. The slow growth rate is mainly due to objective conditions such as the relatively weak economy and the decentralisation of resources. Hopefully, with the improvement of the local economy and safety governance, the situation may be able to improve.
4.3. Analysis of Contributing Factors
To clarify the specific factors contributing to the coupling coordination mechanism, this paper selects digital infrastructure (X1), digital governance (X2), digital innovation capacity (X3), digital economy (X4), accident (A1), disaster-bearing carrier (A2), and safety management (A3) for the grey relational degree calculation.
The calculation results are shown in Table 9.
Table 9.
Grey correlation coefficients.
The grey correlation degree rankings in Table 10 were obtained by calculating the annual average of the correlation degree based on the indicators above.
Table 10.
Grey correlation ranking.
Among the criteria level indicators that affect coupling coordination, the digital indicators rank as follows: digital governance, digital economy, digital infrastructure, and digital innovation capabilities. Digital governance and digital economy are the two indicators with the largest vintages correlation coefficients, which are at the level of “Strong Association” and “Moderate correlation” level, respectively. This indicates that for China’s megacities and super-large cities, digital governance and the digital economy are the most essential factors for the coupling and coordination degree between digital maturity and resilience.
As for resilient cities, the indicators rank as follows: disaster-bearing carriers, accidents, and safety management. The accident and safety management indicators have “Weak correlations” and are moving towards a “Medium correlation”. The disaster-bearing carriers indicator shows a different pattern; it is at the “Moderate correlation” level and dropping to “Slightly weak correlation”. The three indicators at the resilience evaluation level have minor differences from those at the digital level. The strong correlation between digital governance and the economy demonstrates the depth of its systemic penetration, while the divergence in resilience indicators reveals the delayed integration of traditional security systems with digital technologies.
As shown in Figure 6, the grey correlational degree trend chart shows that digital factors (X1–X4) were key factors dominating system behavior in the early stage (2016–2019), but their importance has declined in the past two years (2021–2022); while the importance of safety and risk factors (A1–A3) is relatively low the structure of influencing factors in the entire system is developing towards a more balanced direction.
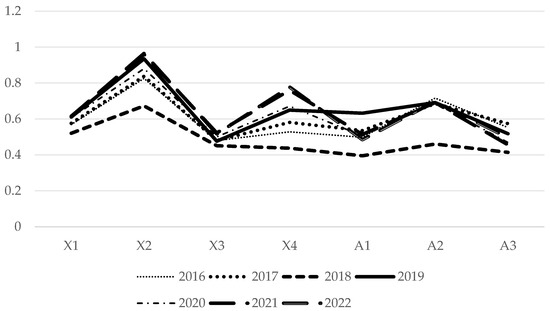
Figure 6.
Trend chart of grey correlation.
5. Discussion
The core theoretical contribution of this study lies in constructing an integrated analytical framework for digital maturity and resilient cities, addressing the limitation of “single-dimensional focus” in the existing research. Existing studies mostly regard digital technology as an instrumental variable for resilience enhancement (e.g., Wei Jiuchang et al., 2024) [43] or assess digital infrastructure and post-disaster recovery efficiency in isolation (Bruneau et al., 2003) [36]. In contrast, based on the public safety triangle theory and system coupling principle, this study attempts to clarify that the two constitute a “two-way enabling coupling system”—digital maturity reconstructs the logic of resilience governance through technological penetration, while resilience level provides a safety foundation for digital transformation.
In terms of indicator system construction, this study integrates the digital maturity dimension into four criterion levels: “infrastructure–governance–innovation–economy,” which not only covers the hardware indicators emphasised by Hwang Yu et al. (2023) [64] but also incorporates the connotation of governance transformation proposed by Zheng Lei (2021) [15]. For the three-dimensional matrix of resilient cities, this study measures the “disaster-bearing carriers” (Fan Weicheng 2020) [53] and “functional resilience” (Zhu Zhengwei, et al. 2024) [34], forming a closed-loop evaluation system of “accident monitoring–carrier support–management response” and providing a standardised tool for subsequent cross-regional comparative research.
The contribution of this study at the empirical analysis level lies in systematically measuring the coupling coordination relationship between urban digital maturity and resilience by employing methods such as entropy weighting, principal component analysis, coupling coordination degree model, and grey relational analysis.
The dual system (digital maturity and resilience) shows a significant trend of synergistic evolution. Both urban digital maturity and resilience levels exhibit a fluctuating upward trend, yet there remains substantial room for overall improvement. Measurement results indicate that from 2016 to 2022, the growth rate of digital maturity was significantly higher than that of resilience, with the digital system generally leading the resilience system in development. Urban development models display dynamic differentiation: some cities have shifted from resilience-dominated to digital-dominated, while others have transitioned to dual-system synchronous development. Systematic differences are reflected in structural differentiation: regional disparities in digital maturity are significantly greater than those in the resilience system, with the inter-regional digital divide showing an expanding trend, while the regional equilibrium of resilient city levels is relatively high, indicating that resilience construction exhibits strong spatial convergence characteristics.
Regional gradient differences are significant. The overall pattern presents an “east-high and west-low, core-led” distribution and a distinct “core-periphery” gradient structure: the Beijing–Tianjin–Hebei, Yangtze River Delta, and Pearl River Delta urban clusters are in the first tier; the Shandong Peninsula and central region urban clusters rank in the second tier; and the Northeast China and mid-western urban clusters (excluding Chengdu–Chongqing) lag relatively behind. Spatially, a declining trend of “Eastern China > Western China > Northeast China” is observed, with economically developed cities like Beijing, Shanghai, Guangzhou, and Shenzhen possessing a significant first-mover advantage in digital maturity.
There is a bidirectional interaction within the coupling coordination mechanism. Grey correlation analysis confirms that there is a significant bidirectional promotion effect between digital maturity and resilience: digital technologies enhance resilient city construction by improving governance efficiency, while resilience in turn drives the process of digital maturity. Factors such as digital governance policies, digital economy, and disaster-bearing carriers play a key role in enhancing the level of the coupling system.
However, the overall coordination level of the two systems is still in the running-in stage (the coordination level needs to be improved; this conclusion is based on data from 22 sample cities, and its applicability to small and medium-sized cities requires further verification), and the efficiency of factor flow between systems also needs further optimisation. This study suggests promoting the development of digital resilience systems in megacities (super cities) towards a high-quality collaborative stage through balanced layout of digital infrastructure, innovative cross-regional coordination mechanisms, and improvement of resilience standard systems, as well as implementing differentiated policy tools.
In addition, in the process of reshaping the operational mode of urban resilience through digitalisation, it is necessary to improve relevant regulations to avoid personal data leakage and abuse [65]. At the same time, a balance should be struck between safeguarding public safety and respecting privacy rights by strengthening data encryption technologies (such as blockchain), enhancing citizens’ digital literacy, and establishing transparent regulatory frameworks [66,67,68]. The principle of ethics first must be adhered to ensure that technological applications do not exceed the boundaries of social trust, thereby building a sustainable governance ecosystem for digital resilience development [69]. Secondly, against the backdrop of large-scale data collection and widespread application of intelligent decision-making systems, it is necessary to be vigilant against potential risks brought by technological dependence and avoid urban operational paralysis caused by system failures or cyberattacks. A multi-level, distributed technological architecture should be constructed to enhance system fault tolerance by decentralizing data storage and processing nodes, thereby improving the resilience guarantee capability of digital technologies themselves [70,71]. Finally, attention should also be paid to the marginalisation of elderly and vulnerable groups in the digital transformation to ensure technological inclusivity. The technological usage gap between different groups can be narrowed by optimizing the accessibility design of public services, promoting age-friendly intelligent terminals and user-friendly interfaces [71,72,73,74].
6. Conclusions
Taking 22 megacities and super cities in China as samples, the study systematically explored the coupling mechanism between digital maturity and resilient cities systems and their influencing factors. Core conclusions are as follows:
First, in terms of theoretical framework construction, an evaluation system for digital maturity was established. Four core dimensions were screened through the Delphi Method and principal component analysis, namely digital infrastructure (5G/IoT coverage rate), digital governance (e-government level), digital innovation capability (R&D investment intensity), and digital economy (digital industry scale). A resilient cities assessment model was constructed. Based on the public safety triangle theory, a three-dimensional evaluation matrix was built covering accident indicators (mortality rate/number of safety accidents), disaster-bearing carriers (shelter density/infrastructure redundancy), and safety management (emergency plan coverage rate/emergency material reserves).
Second, in terms of comprehensive evaluation and spatiotemporal evolution characteristics. Digital maturity shows a gradient pattern of “higher in the east and lower in the west”. The average index of the three major urban clusters (Beijing–Tianjin–Hebei/Yangtze River Delta/Pearl River Delta) reached 0.68 in 2022, while that of the northeast region was only 0.42. Core digital economy cities such as Shenzhen and Hangzhou had an average annual growth rate of over 12%. Resilient cities improved overall but showed regional convergence; the coefficient of variation of coupling coordination degree was only 0.18 in 2022 (0.32 for the digital system). Due to its political centre attribute, Beijing’s safety governance relies slightly less on digital empowerment than other cities.
Third, in terms of coupling coordination mechanism, coupling degree (C) was generally higher than 0.9, indicating a strong correlation between the digital maturity system and the resilient cities system. Coupling coordination degree (D) was in the range of 0.4–0.6, and only Beijing, Shanghai, Guangzhou, and Shenzhen reached primary coordination. Due to economic recession, the synergy efficiency of the digital-safety system in the northeast region was 37% lower than that in the Yangtze River Delta.
Fourth, in terms of influencing factors analysis, grey correlation analysis showed that digital governance and digital economy had the highest contribution. Disaster-bearing carrier indicators were higher than accident management, verifying the key role of digital governance policies, digital economy, and disaster-bearing carriers in improving the level of the coupling system.
This study has several limitations.
- 1.
- Insufficiency in indicator completeness and data accuracy: Failure to cover all indicators; quantitative indicators need to supplement the latest technical indicators; there are oversights in safety and resilience indicators. Future needs are to organise data, expand data acquisition channels, supplement missing data, and improve the evaluation system by integrating research hotspots.
- 2.
- The practical explanatory power of coupling coordination research needs to be improved: The conclusions are in line with the reality of China’s megacities, but the actual logic needs to be further explained through coupling coordination degree. Subsequent research needs to explore their actual relationships, not only relying on panel data but also obtaining actual situations through questionnaire surveys of urban managers and residents.
- 3.
- The factors selected in the model for influence factor analysis need to be improved: We need to consider the interactions between unfinished indicators. Future needs are to expand relevant variables and conduct in-depth research on influence factors.
In future research, we will focus on exploring other factors influencing the coordinated relationship between digital maturity and resilient cities, including, but not limited to, differences in resource endowments and types of economic development among different cities in the process of development. Meanwhile, we will also pay attention to the new challenges faced by digital urban construction in the era of artificial intelligence. For instance, a large amount of false content generated by artificial intelligence will increase the difficulty of content moderation, and how to tap the potential of artificial intelligence in urban resilience and expand its application pathways still requires more empirical research.
Author Contributions
Conceptualization, W.X., Z.W. and S.Y.; Methodology, W.X., Z.W. and S.Y.; Software, Z.W. and S.Y.; Validation, W.X., Z.W. and S.Y.; Formal analysis, W.X. and Z.W.; Investigation, W.X. and Z.W.; Resources, W.X.; Data curation, W.X. and Z.W.; Writing—original draft, W.X., Z.W. and S.Y.; Writing—review & editing, W.X., Z.W. and S.Y.; Visualization, Z.W.; Supervision, W.X.; Project administration, W.X.; Funding acquisition, W.X. All authors have read and agreed to the published version of the manuscript.
Funding
This research was funded by Hubei Provincial Emergency Management Department Research Project: Research on Emergency Capacity Assessment of Public Emergencies from the Perspective of Technical Governance (Grant NO.HBT-16170298-201348-1).
Institutional Review Board Statement
Not applicable.
Informed Consent Statement
Not applicable.
Data Availability Statement
The data used to support the findings of this paper are available from the corresponding author upon reasonable request.
Conflicts of Interest
The authors declare no conflict of interest.
References
- United Nations Human Settlements Programme. Unlocking the Potential of Cities: Financing Sustainable Urban Development; UN-Habitat: Nairobi, Kenya, 2023; Available online: https://unhabitat.org/sites/default/files/2023/11/unlocking_the_potential_of_cities_-_financing_sustainable_urban_development_-_06-min.pdf (accessed on 20 September 2025).
- Department of Urban Social and Economic Surveys; National Bureau of Statistics of China. China Urban Development Statistical Yearbook 2023; China Statistics Press: Beijing, China, 2023. [Google Scholar]
- Marasco, S.; Noori, A.Z.; Cimellaro, G.P. Cascading Hazard Analysis of a Hospital Building. J. Struct. Eng. 2017, 143, 04017100. [Google Scholar] [CrossRef]
- Li, M.; Zhang, J.; Wang, H. A framework for managing public security risks with complex interactions in cities and its application evidenced from Shenzhen City in China. Int. J. Environ. Res. Public Health 2020, 17, 1234. [Google Scholar]
- Central Committee of the Communist Party of China; State Council. National New Urbanization Plan (2014–2020); Central People’s Government of the People’s Republic of China: Beijing, China, 2014. Available online: https://www.gov.cn/zhengce/2014-03/16/content_2640075.htm (accessed on 20 September 2025).
- Hangzhou City Brain Research Institute; Hangzhou City Brain Construction Headquarters. City Brain 2.0 Practice and Thinking—System Solutions for Smart and Efficient Governance in Mega Cities and Very Large Cities; Zhejiang People’s Publishing House: Hangzhou, China, 2025; pp. 1–350. [Google Scholar]
- Lu, J. City Brain: The Intelligent Tool for Urban Management Innovation; Academic Frontier of People’s Tribune: Beijing, China, 2021; pp. 65–69. [Google Scholar]
- Sun, Y.; Wu, K.; Zheng, G.; Zhang, X.; Lu, H.; Fang, J. City brain promotes the co-reduction of carbon and nitrogen emissions. Earth Crit. Zone 2025, 2, 100028. [Google Scholar] [CrossRef]
- Pritchard, O.; Vernon-Avery, I.; Pricopi, J.; Frost, L.; Tiaras, E.; Walmsley, N.; Liakou, L.; Lim, L.; Tan, G. Digital Cities, Resilient Cities: Delivering Urban Resilience Through Digital Solutions; Fitzgerald, R., Ed.; Arup: London, UK; Resilient Cities Network: Singapore, 2023; Available online: https://resilientcitiesnetwork.org/digital-cities-resilient-cities/ (accessed on 20 September 2025).
- Negroponte, N. Being Digital; Alfred, A. Knopf: New York, NJ, USA, 1995. [Google Scholar]
- Gore, A. The digital earth: Understanding our planet in the 21st century. Aust. Surv. 1998, 43, 89–91. [Google Scholar] [CrossRef]
- Ding, D.; Meng, H. “Digital City” is coming to us. People’s Daily, 4 June 2000; p. 4. [Google Scholar]
- Qiu, P. Problems and proposals for urban digitalization development in China. New Horiz. 2006, 6, 41–42. [Google Scholar]
- China Academy of Information and Communications Technology. Digital Economy Development in China; China Academy of Information and Communications Technology: Beijing, China, 2020. [Google Scholar]
- Zheng, L. Content, Path and Direction of Urban digital maturity. Explor. Controv. 2021, 4, 147–152+180. [Google Scholar]
- Aljowder, T.; Ali, M.; Kurnia, S. Development of a Maturity Model for Assessing Smart Cities: A Focus Area Maturity Model. Smart Cities 2023, 2150–2175. [Google Scholar] [CrossRef]
- Zhang, G.; Qian, Y.; Zhao, Y. Impact and heterogeneity of urban digitalization on innovation-space evolution from an ecological-niche perspective. R&D Manag. 2024, 36, 77–90. [Google Scholar] [CrossRef]
- Ge, Y.; Shi, Y.; Shen, Y.; Li, H. Research on the coupling and coordinated development of resilient cities and digital maturity: A case study of the Yangtze River Delta urban cluster. In Beautiful China, Co-construction, Co-governance and Sharing, Proceedings of the 2024 China Urban Planning Annual Conference, Hangzhou, China, 5–8 July 2024; Hangzhou Urban Planning and Design Institute: Hangzhou, China, 2024; pp. 89–103. [Google Scholar] [CrossRef]
- Vial, G. Understanding digital transformation: A review and a research agenda. In Managing Digital Transformation; Routledge: London, UK, 2021; pp. 13–66. [Google Scholar]
- Li, J.; Lin, H.; Zhang, J.; Yin, Y. Research on the spatial effect and influence mechanism of urban digital maturity driving residents’ consumption. Res. World 2025, 2, 75–83. [Google Scholar] [CrossRef]
- Chinoracky, R.; Corejova, T. How to evaluate the digital economy scale and potential? Entrep. Sustain. Issues 2021, 8, 536–552. [Google Scholar] [CrossRef]
- Moroz, M. The level of development of the digital economy in Poland and selected European countries: A comparative analysis. Found. Manag. 2017, 9, 175–190. [Google Scholar] [CrossRef]
- Walker, J.; Cooper, M. Genealogies of resilience: From systems ecology to the political economy of crisis adaptation. Saf. Dialogue 2011, 42, 143–160. [Google Scholar] [CrossRef]
- Holling, C.S. Resilience and stability of ecological systems. Annu. Rev. Ecol. Syst. 1973, 4, 1–23. [Google Scholar] [CrossRef]
- Holling, C. Resilience of Ecosystems: Local Surprise and Global Change; Cambridge University Press: Cambridge, UK, 1985; pp. 228–269. [Google Scholar]
- Feng, Y.; Wang, J.; Zhang, T. The impact of smart city policies on city resilience: An evaluation of 282 Chinese cities. Sustainability 2024, 16, 8669. [Google Scholar] [CrossRef]
- Godschalk, D.R. Urban hazard mitigation: Creating resilient cities. Nat. Hazards Rev. 2003, 4, 136–143. [Google Scholar] [CrossRef]
- Meerow, S.; Newell, J.P.; Stults, M. Defining resilient cities: A review. Landsc. Urban Plan. 2016, 147, 38–49. [Google Scholar] [CrossRef]
- Xiao, W.; Wang, L. Resilient cities: Strategic choices for safe development of modern cities. Southeast Acad. 2019, 2, 89–99+246. [Google Scholar] [CrossRef]
- Berkes, F.; Ross, H. Community resilience: Toward an integrated approach. Soc. Nat. Resour. 2013, 26, 5–20. [Google Scholar] [CrossRef]
- Wildavsky, A.B. Searching for Safety; Transaction Publishers: Piscataway, NJ, USA, 1988; Volume 10. [Google Scholar]
- Yabe, T.; Rao, P.S.C.; Ukkusuri, S.V.; Cutter, S.L. Toward data-driven, dynamical complex systems approaches to disaster resilience. Proc. Natl. Acad. Sci. USA 2022, 119, e2111997119. [Google Scholar] [CrossRef]
- Huang, H.; Li, R.; Fan, W.; Shan, C. Characteristic analysis of safety-resilient city and its enlightenment to safety development of Xiong’an New Area. J. Saf. Sci. Technol. 2018, 14, 5–11. [Google Scholar]
- Zhu, Z.; Guo, R.; Yuan, L. resilient cities resilience evaluation framework in the context of new safety pattern: Exploration and construction. Public Manag. Policy Rev. 2024, 13, 138–151. [Google Scholar]
- Datola, G.; Bottero, M.; De Angelis, E.; Romagnoli, F. Operationalising resilience: A methodological framework for assessing urban resilience through System Dynamics Model. Ecol. Model. 2022, 465, 109851. [Google Scholar] [CrossRef]
- Bruneau, M.; Chang, S.E.; Eguchi, R.T.; Lee, G.C. A Framework to Quantitatively Assess and Enhance the Seismic Resilience of Communities. Earthq. Spectra 2003, 19, 733–752. [Google Scholar] [CrossRef]
- Anelli, D.; Morano, P.; Locurcio, M.; Tajani, F. Resilient cities and land-take effective management through sustainable urban planning tools. Land 2025, 14, 1335. [Google Scholar] [CrossRef]
- Rockefeller Foundation and Arup Group. City Resilience Framework. 2014. Available online: https://www.rockefellerfoundation.org/wp-content/uploads/100RC-City-Resilience-Framework.pdf (accessed on 18 May 2024).
- The People’s Government of Guangdong Province. Report on the Work of the Government. 2021. Available online: http://www.gd.gov.cn/gkmlpt/content/3/3185/post_3185894.html#45 (accessed on 24 April 2021).
- ISO 37123; Sustainable Cities and Communities—Indicators for Resilient Cities. International Organization for Standardization: Geneva, Switzerland, 2019.
- Apostu, S.A.; Vasile, V.; Vasile, R.; Rosak-Szyrocka, J. Do smart cities represent the key to urban resilience? Rethinking urban resilience. Int. J. Environ. Res. Public Health 2022, 19, 15410. [Google Scholar] [CrossRef]
- Yu, R.X.; Chen, Y.Q.; Jin, Y.H.; Zhang, S. Evaluating the Impact of Digital Transformation on Urban Innovation Resilience. Systems 2025, 13, 8. [Google Scholar] [CrossRef]
- Wei, J.; Wang, Y. Can smart city construction improve the performance of production-safety governance?—A time-varying difference-in-differences analysis based on panel data of 299 Chinese cities. J. South China Univ. Technol. (Soc. Sci. Ed.) 2024, 26, 116–131. [Google Scholar] [CrossRef]
- de Genaro Chiroli, D.M.; Ferrassa, T.P.; Idalgo, L.D.N.; Mick, M.M.A.P.; Kovaleski, J.L.; Aragão, F.V.; Tebcherani, S.M.; Zola, F.C. Digital Transformation for Smart and Resilient Cities: Assessing Platform Maturity and ISO 37123 Compliance. Platforms 2025, 3, 3. [Google Scholar] [CrossRef]
- Wu, C.; Huang, X.; Wang, B. Basic theoretical research progress and prospect of smart safe city from the perspective of big safety. China Saf. Prod. Sci. Technol. 2022, 18, 5–10. [Google Scholar]
- Shan, Y. Towards spatial justice: Technical governance of urban public safety. Stud. Social. Chin. Charact. 2018, 5, 74–79. [Google Scholar]
- Stankovski, T.; Pereira, T.; McClintock, P.V.E.; Stefanovska, A. Coupling functions: Dynamical interaction mechanisms in the physical, biological and social sciences. Proc. R. Soc. A Math. Phys. Eng. Sci. 2019, 377, 20190039. [Google Scholar] [CrossRef] [PubMed]
- Bai, W.; Chen, M.; Bai, F.; Huang, J. Priocity Intervention Evaluation of Community Regeneration in Megacities: A Baseline Framework for Sustainable Urban Transformation. Buildings 2024, 14, 2263. [Google Scholar] [CrossRef]
- Cover, T.M.; Thomas, J.A. Elements of Information Theory, 2nd ed.; John Wiley & Sons: Hoboken, NJ, USA, 2006. [Google Scholar] [CrossRef]
- Cheng, J.H.; Dong, M.T.; Zhao, L. A Combination Weight Method Based on MOEA/D. Control. Decis. 2021, 36, 3056–3062. [Google Scholar] [CrossRef]
- Li, X.; Wang, Y.; Zhang, L. Coupling Coordination Degree Model for Evaluating Sustainable Development of Urban Agglomerations. Sustainability 2023, 15, 6543. [Google Scholar] [CrossRef]
- Deng, J. Grey systematic review. World Sci. 1983, 7, 5. [Google Scholar]
- Fan, W.C. Development Trends of Safe and Resilient Cities. Labour Prot. 2020, 3, 20–23. [Google Scholar]
- Shang, Y. Research on Effectively Preventing and Controlling Risks in Urban Safe Development. Future City Stud. 2022, 5, 7–14. [Google Scholar]
- Wu, X.L.; Li, N.H. Why the Differences? Urban-District Relations in Digital Risk Prevention and Control of Megacities. Chin. Public Adm. 2024, 40, 30–41. [Google Scholar]
- Cui, W.; Liu, X.; Yue, Q.; Shi, Z.; Yang, X.; Zhou, L.; Yang, Z.; Cai, B.; Yue, Y.; Zhou, Y.; et al. Research on the classification of urban emerging risks based on the ‘hazard source-disaster-affected body-disaster mitigation capacity’ theory for urban safety. Strateg. Study CAE 2025, 27, 71–81. [Google Scholar]
- Fu, K. Measurement of Digital Transformation Level, Evolution Trend, and Regional Differences in Chinese Provinces. Hans J. 2025, 14, 2350–2360. [Google Scholar] [CrossRef]
- Nanjing Emergency Management Bureau. Pioneering Digital Transformation for Urban Safety Risk Monitoring and Early Warning. Classic Cases of Urban Comprehen-sive Digital Transformation, National Data Bureau of China. Available online: https://www.nda.gov.cn/sjj/ywpd/szsh/0110/20250110170454160281873_pc.html (accessed on 10 January 2025).
- Chengdu Emergency Management Bureau. White Paper on Chengdu Urban Safety Risk Comprehensive Monitoring and Early Warning Platform Construction; Chengdu Municipal Government: Chengdu, China, 2024. [Google Scholar]
- Wu, X.L.; Zuo, X.Y. Breaking Bureaucratic Constraints: Organizational Change in Digital Risk Prevention and Control in Megacities. Manag. World 2025, 128–142+164+8. [Google Scholar] [CrossRef]
- Li, X.; Liu, X.; Wan, X. A review of digital twin application and safety development. J. Syst. Simul. 2019, 31, 385–392. [Google Scholar] [CrossRef]
- Wang, Z.J.; Yu, Y.; Zhang, W. Research on Coupling Coordination Degree between Higher Engineering Education and High-Tech Industry. Res. High. Eng. Educ. 2021, 5, 75–82. [Google Scholar]
- Hyun, C.T.; Lee, S.; Jin, C. Digital Twin for Disaster Management in Smart City. In Future of Information and Communication Conference; Springer: Cham, Switzerland, 2024; pp. 627–641. [Google Scholar]
- Hwang, Y.K. Synergistic Effects of Digital Economy and Renewable Energy Transition on Green Economic Growth: An Empirical Study of 18 Countries in Latin America and the Caribbean. J. Clean. Prod. 2023, 418, 138146. [Google Scholar] [CrossRef]
- Wang, X.; Li, J. Legal governance in the smart cities of China: Functions, problems, and solutions. Sustainability 2022, 14, 9738. [Google Scholar] [CrossRef]
- Sullivan, C.; Burger, E. E-residency and blockchain. Comput. Law Secur. Rev. 2017, 33, 470–481. [Google Scholar] [CrossRef]
- Newell, B.C. The massive data breach: Privacy and security in the age of the mega-leak. UCLA Law Rev. Discourse 2014, 61, 194–213. [Google Scholar]
- Reding, V. The EU Data Protection Reform: Towards a New Data Protection Era. Speech at the Center for European Policy Studies. 2012. Available online: https://ec.europa.eu/commission/presscorner/detail/en/SPEECH_12_448 (accessed on 20 September 2025).
- Mcdonald, G.; Pan, S.L. The ethics of AI in organizations: A review and research agenda. J. Bus. Ethics 2020, 167, 411–421. [Google Scholar]
- Hanisch, M.; Goldsby, C.M.; Fabian, N.E.; Oehmichen, J. Digital governance: A conceptual framework and research agenda. J. Bus. Res. 2023, 162, 113777. [Google Scholar] [CrossRef]
- Kitchin, R.; Dodge, M. The (In)security of smart cities: Vulnerabilities, risks, mitigation, and prevention. J. Urban Technol. 2019, 26, 47–65. [Google Scholar] [CrossRef]
- Sourbati, M. Smart cities and ageing: Age-inclusive design and digital equity. J. Urban Technol. 2023, 30, 89–105. [Google Scholar]
- Wood, M.A. A framework for digital inclusion: Progressive policy for closing the urban digital divide. Urban Stud. 2022, 59, 2267–2285. [Google Scholar]
- Schulz, R.; Wahl, H.-W.; Matthews, J.T.; De Vito Dabbs, A.; Beach, S.R.; Czaja, S.J. Digital ageism: How technological ageism excludes older adults from the digital world. Policy Internet 2024, 16, 45–63. [Google Scholar] [CrossRef]


Disclaimer/Publisher’s Note: The statements, opinions and data contained in all publications are solely those of the individual author(s) and contributor(s) and not of MDPI and/or the editor(s). MDPI and/or the editor(s) disclaim responsibility for any injury to people or property resulting from any ideas, methods, instructions or products referred to in the content. |
© 2025 by the authors. Licensee MDPI, Basel, Switzerland. This article is an open access article distributed under the terms and conditions of the Creative Commons Attribution (CC BY) license (https://creativecommons.org/licenses/by/4.0/).