3.1. Analytical Techniques
The methodological approach of this research is structured around two key techniques: Principal Component Analysis and Network Theory. The foundations of both techniques are detailed below.
3.1.1. Principal Component Analysis (PCA)
Principal Component Analysis (PCA) is a multivariate statistical technique widely used in sustainability assessment to reduce the dimensionality of complex datasets and identify their latent structures [
42,
43]. Instead of examining numerous correlated indicators in isolation, PCA transforms them into a smaller set of uncorrelated variables known as principal components, each capturing the maximum possible variance from the original data [
44].
PCA is a well-established tool in sustainability science for its effectiveness in synthesizing complex datasets. For instance, it has been used to construct composite indicators for assessing the sustainability of manufacturing companies [
45] and to integrate diverse social and infrastructural variables in urban sustainability assessments [
46].
Mathematically, PCA transforms the original data matrix
—where
n is the number of observations and
p the number of indicators—into a set of uncorrelated variables
. Each principal component is a linear combination of the standardized indicators:
where
for
are the loadings (or weights) assigned to each indicator
in the construction of the
k-th component
. These weights are chosen so that the first component
captures the maximum possible variance. Each subsequent component then captures the highest remaining variance while being uncorrelated with the previous ones.
To apply PCA effectively, the following steps are typically followed:
- 1.
Assessment of Data Suitability: The data’s fitness for factor analysis is verified using the Kaiser-Meyer-Olkin (KMO) measure and Bartlett’s test of sphericity [
47].
- 2.
Standardization of the data: Each indicator is transformed to have a mean of zero and a standard deviation of one:
where
is the mean and
the standard deviation of the indicator
. This step ensures comparability between variables with different units.
- 3.
Computation of the correlation matrix R: Since the variables are standardized, their interdependencies are summarized in the matrix R, where each entry represents the Pearson correlation between indicators and .
- 4.
Extraction of components: The principal components correspond to the eigenvectors of the matrix
R, and the amount of variance each one explains is given by the associated eigenvalue
divided by total variance in the dataset,
- 5.
Selection of components: The decision on how many components to retain is guided by established statistical criteria, such as Horn’s parallel analysis, Velicer’s minimum average partial (MAP) test, and the visual inspection of the scree-plot “elbow” [
42,
48,
49,
50]. However, in the specific context of constructing composite indicators, interpretability is paramount.For this reason, the standard procedure is to use only the first principal component (
). This is done provided provided it explains a substantial portion of the total variance (above 0.50). This practice avoids the informational and sign-inconsistency issues that secondary components can introduce, ensuring the final index has a clear and unambiguous meaning [
5,
51,
52,
53].
- 6.
Calculation of component scores: Each observation receives a score on each retained component. These scores can be used to build composite indicators or to compare performance across regions.
In this study, we define a temporal index, denoted as RESI. The index is computed by projecting standardized indicator values onto the first principal component,
where
is the standardized value of indicator
i at time
t, and
is its corresponding loading. The resulting time series RESI summarizes the dominant trend across indicators, enabling consistent temporal evaluation.
This formulation follows the same methodological framework as the ISAM index developed for southeastern Mexico [
12], which also relies on principal component analysis to aggregate environmental indicators. The ISAM provides a static comparison across municipalities. In contrast, our version introduces a temporal perspective that allows for the identification of structural shifts and long-term trends within a single locality.
By extending the PCA-based approach to the temporal domain, the proposed index enhances the interpretative capacity of sustainability assessments. It serves as both a benchmarking tool aligned with national metrics and a diagnostic mechanism tailored to local dynamics.
It is important to acknowledge the methodological challenges inherent to this technique. A primary concern is its reliance on linear assumptions, which may fail to capture the complex, non-linear dynamics often present in socio-ecological systems [
44]. The interpretability of the resulting components can also be difficult, as these mathematical constructs may not align neatly with established conceptual frameworks of sustainability. Several studies have noted these challenges, particularly in aligning the statistical outputs with policy-relevant dimensions [
5,
54]. Furthermore, its compensatory nature can mask critical trade-offs between individual indicators [
4].
3.1.2. Network Theory
A network is formally defined as a collection of nodes (also called vertices) connected by links (or edges) [
41,
55]. The structure of the network is encoded in its adjacency matrix
, where
We focus on undirected networks, where links represent mutual relationships and the adjacency matrix A is symmetric. Several structural concepts from network theory play a central role in this study. The degree of a node i, denoted , corresponds to the number of direct links it maintains. This quantity indicates how interconnected a node is within the system.
A fundamental descriptor of the overall network structure is its density, defined as the ratio between the number of existing links
m and the maximum number of possible links. For a network with
n nodes, the density is computed as
High-density networks suggest a system of tightly interrelated components, while sparse networks may reflect compartmentalized or weakly coordinated subsystems.
The concept of a path captures the notion of connectivity between two nodes. A path is a sequence of nodes such that each consecutive pair is directly linked. The distance between two nodes u and v, denoted , is the length of the shortest path connecting them. A network is said to be connected if there exists at least one path between every pair of nodes. This property guarantees that the system forms a single coherent structure, enabling the calculation of global measures such as spectral or centrality mesures. In contrast, disconnected networks may yield misleading or fragmented diagnostics.
The clustering coefficient quantifies the extent to which the neighbors of a given node are themselves interconnected, offering insight into local cohesion. Complementarily, centrality measures identify nodes of structural significance. These include:
Degree centrality, computed as
measures the proportion of nodes directly connected to
u.
Closeness centrality, given by
reflects the proximity of a node to all others.
Betweenness centrality, defined as
quantifies how frequently node
u lies on shortest paths between other nodes. Here,
is the number of shortest paths from
s to
t, and
the number passing through
u.
Eigenvector centrality assigns higher scores to nodes connected to other central nodes. It is calculated as
where
is the
u-th component of the principal eigenvector of the adjacency matrix.
In addition to topological descriptors, spectral properties derived from the eigenvalues of the adjacency matrix provide global information about the organization, robustness, and modularity of the system. These measures form the basis for constructing more refined structural indices, as explored later in this work.
Certain archetypal structures in network theory serve as useful references for interpreting empirical networks. A
tree is a connected network that contains no cycles, meaning there is exactly one unique path between any pair of nodes. Among trees, two canonical forms are of particular interest. A
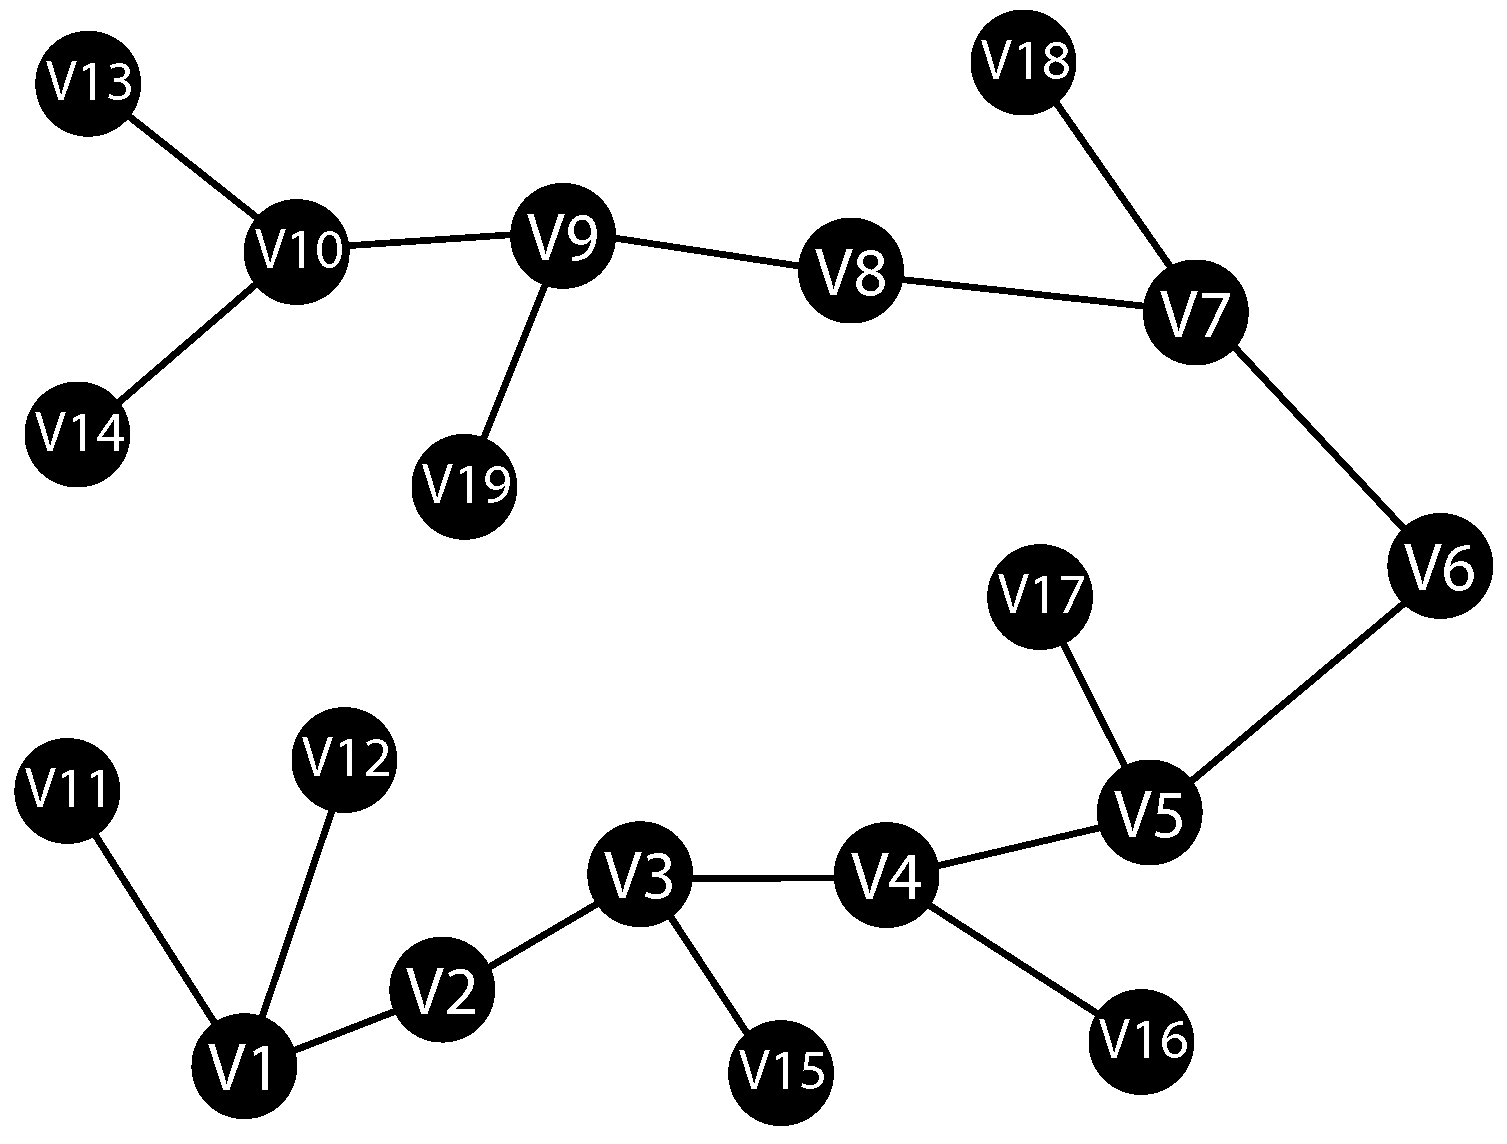
path network arranges the nodes in a linear sequence, resulting in maximal average distance and minimal centralization (see
Figure 1). In contrast, a
star network consists of a central node connected to all others, which are not connected among themselves. This configuration exhibits extreme centralization and minimal average distance. Both represent limiting cases of connectivity and centrality within minimal link structures.
At the opposite end of the spectrum lies the complete network, where every node is directly linked to every other. Such a network with n nodes has the maximum possible number of links, , and achieves a density of 1. In the context of sustainability analysis, a complete network would suggest total interdependence among all indicators. While this situation is rare in practice, it is theoretically useful as a benchmark for evaluating empirical density and redundancy.
This collection of theoretical constructs and structural metrics forms the foundation for our network-based sustainability analysis.
3.2. The Index
In order to quantify the structural–functional cohesion of sustainability networks, we introduce a novel index, denoted as
. This index builds upon the concept of
node energy formulated by Arizmendi et al. [
56]. It aims to synthesize both the local spectral prominence of each node and the topological configuration of the network as a whole.
Given an undirected, simple, and connected network with n nodes and adjacency matrix . The spectral decomposition of A yields a set of real eigenvalues and corresponding orthonormal eigenvectors .
The
energy of a node
is defined in [
56] as
where
denotes the
u-th component of eigenvector
. This value captures the extent to which the node is embedded in the network’s dominant modes of interaction, reflecting both its position and role within the overall system.
Using this localized energy, we define the
index as a sum over all unordered pair of nodes, formally:
where
denotes the shortest-path distance between nodes
u and
v. This formulation aggregates the pairwise energy, assigning more weight to proximal node pairs, and penalizing distant connections. The inclusion of
ensures that the index reflects not only the spectral prominence of nodes, but also their structural accessibility within the network.
Conceptually, captures a trade-off between energy and distance, configurations where high-energy nodes are centrally connected yield higher index values, indicating a cohesive and potentially resilient structure. In contrast, fragmented or loosely connected systems result in lower scores, revealing a loss of integrative capacity.
For a detailed example of the
index computation, the reader is referred to
Appendix A.
While the definition of
is based on pairwise interactions between all nodes, it can be elegantly reformulated to reveal the individual contribution of each node. The following result shows that the
index is equivalent to a weighted sum of the node energies, this provides a powerful node-centric perspective on the index. For the sake of clarity and brevity, the detailed proofs for all propositions in this section are presented in
Appendix B.
Proposition 1. Let G be a connected graph with set of nodes . Then, We now analyze several theoretical properties of the proposed index . By analyzing the behavior of the index under general constraints on node degrees and network distances, we derive a set of upper and lower bounds. These results offer interpretative insight into the index’s formulation and establish benchmark inequalities useful for comparative analysis across different classes of networks.
The concept of network energy was originally introduced by Gutman in the context of chemical network theory [
57]. It quantifies the total oscillatory behavior of a network’s structure through the eigenvalues of its adjacency matrix. For a network
G the total energy is defined as
This quantity captures the global spectral content of the network and has been widely used to assess structural complexity and symmetry.
In the context of the index it is natural to investigate how the total energy constrains the overall magnitude of . The following proposition establishes upper and lower bounds for in terms of and the network diameter.
Proposition 2. Let G be a connected network with n nodes, then For any connected network
G with maximum degree
, the node energy
of a node
v is bounded as follows (see [
56], Proposition 3.2 and Theorem 3.6)
This result allow us to prove the following.
Proposition 3. Let G be a connected network with maximum degree . Then, The following result establishes bounds for the index
in terms of the well-known topological index
named generalized first Zagreb index, evaluated at the exponent
. This index was defined in [
58] as
This classical degree-based index reflects the local contribution of nodes degrees to the structure of the network.
Proposition 4. Let G be a connected network with n nodes, m links, maximum degree Δ, and minimum degree δ. Then A well-known distance-based topological invariant is the Harary index, denoted
. This index is defined as
Originally proposed in [
59] as a measure of molecular compactness, the Harary index captures inverse distance efficiency. It is particularly useful in quantifying the extent of global communication or proximity within a network.
Proposition 5. Let G be a connected network with maximum degree Δ and minimum degree δ. Then, We now derive bounds for the index
in terms of the classical Wiener index
, defined as
This topological index was originally introduced by Harold Wiener in 1947 [
60] to model the boiling points of paraffin compounds. It has since become one of the most widely used descriptors in chemical graph theory.
Proposition 6. Let G be a connected network with n nodes, maximum degree Δ and minimum degree δ. Then,where . 3.3. Study Area and Data Collection
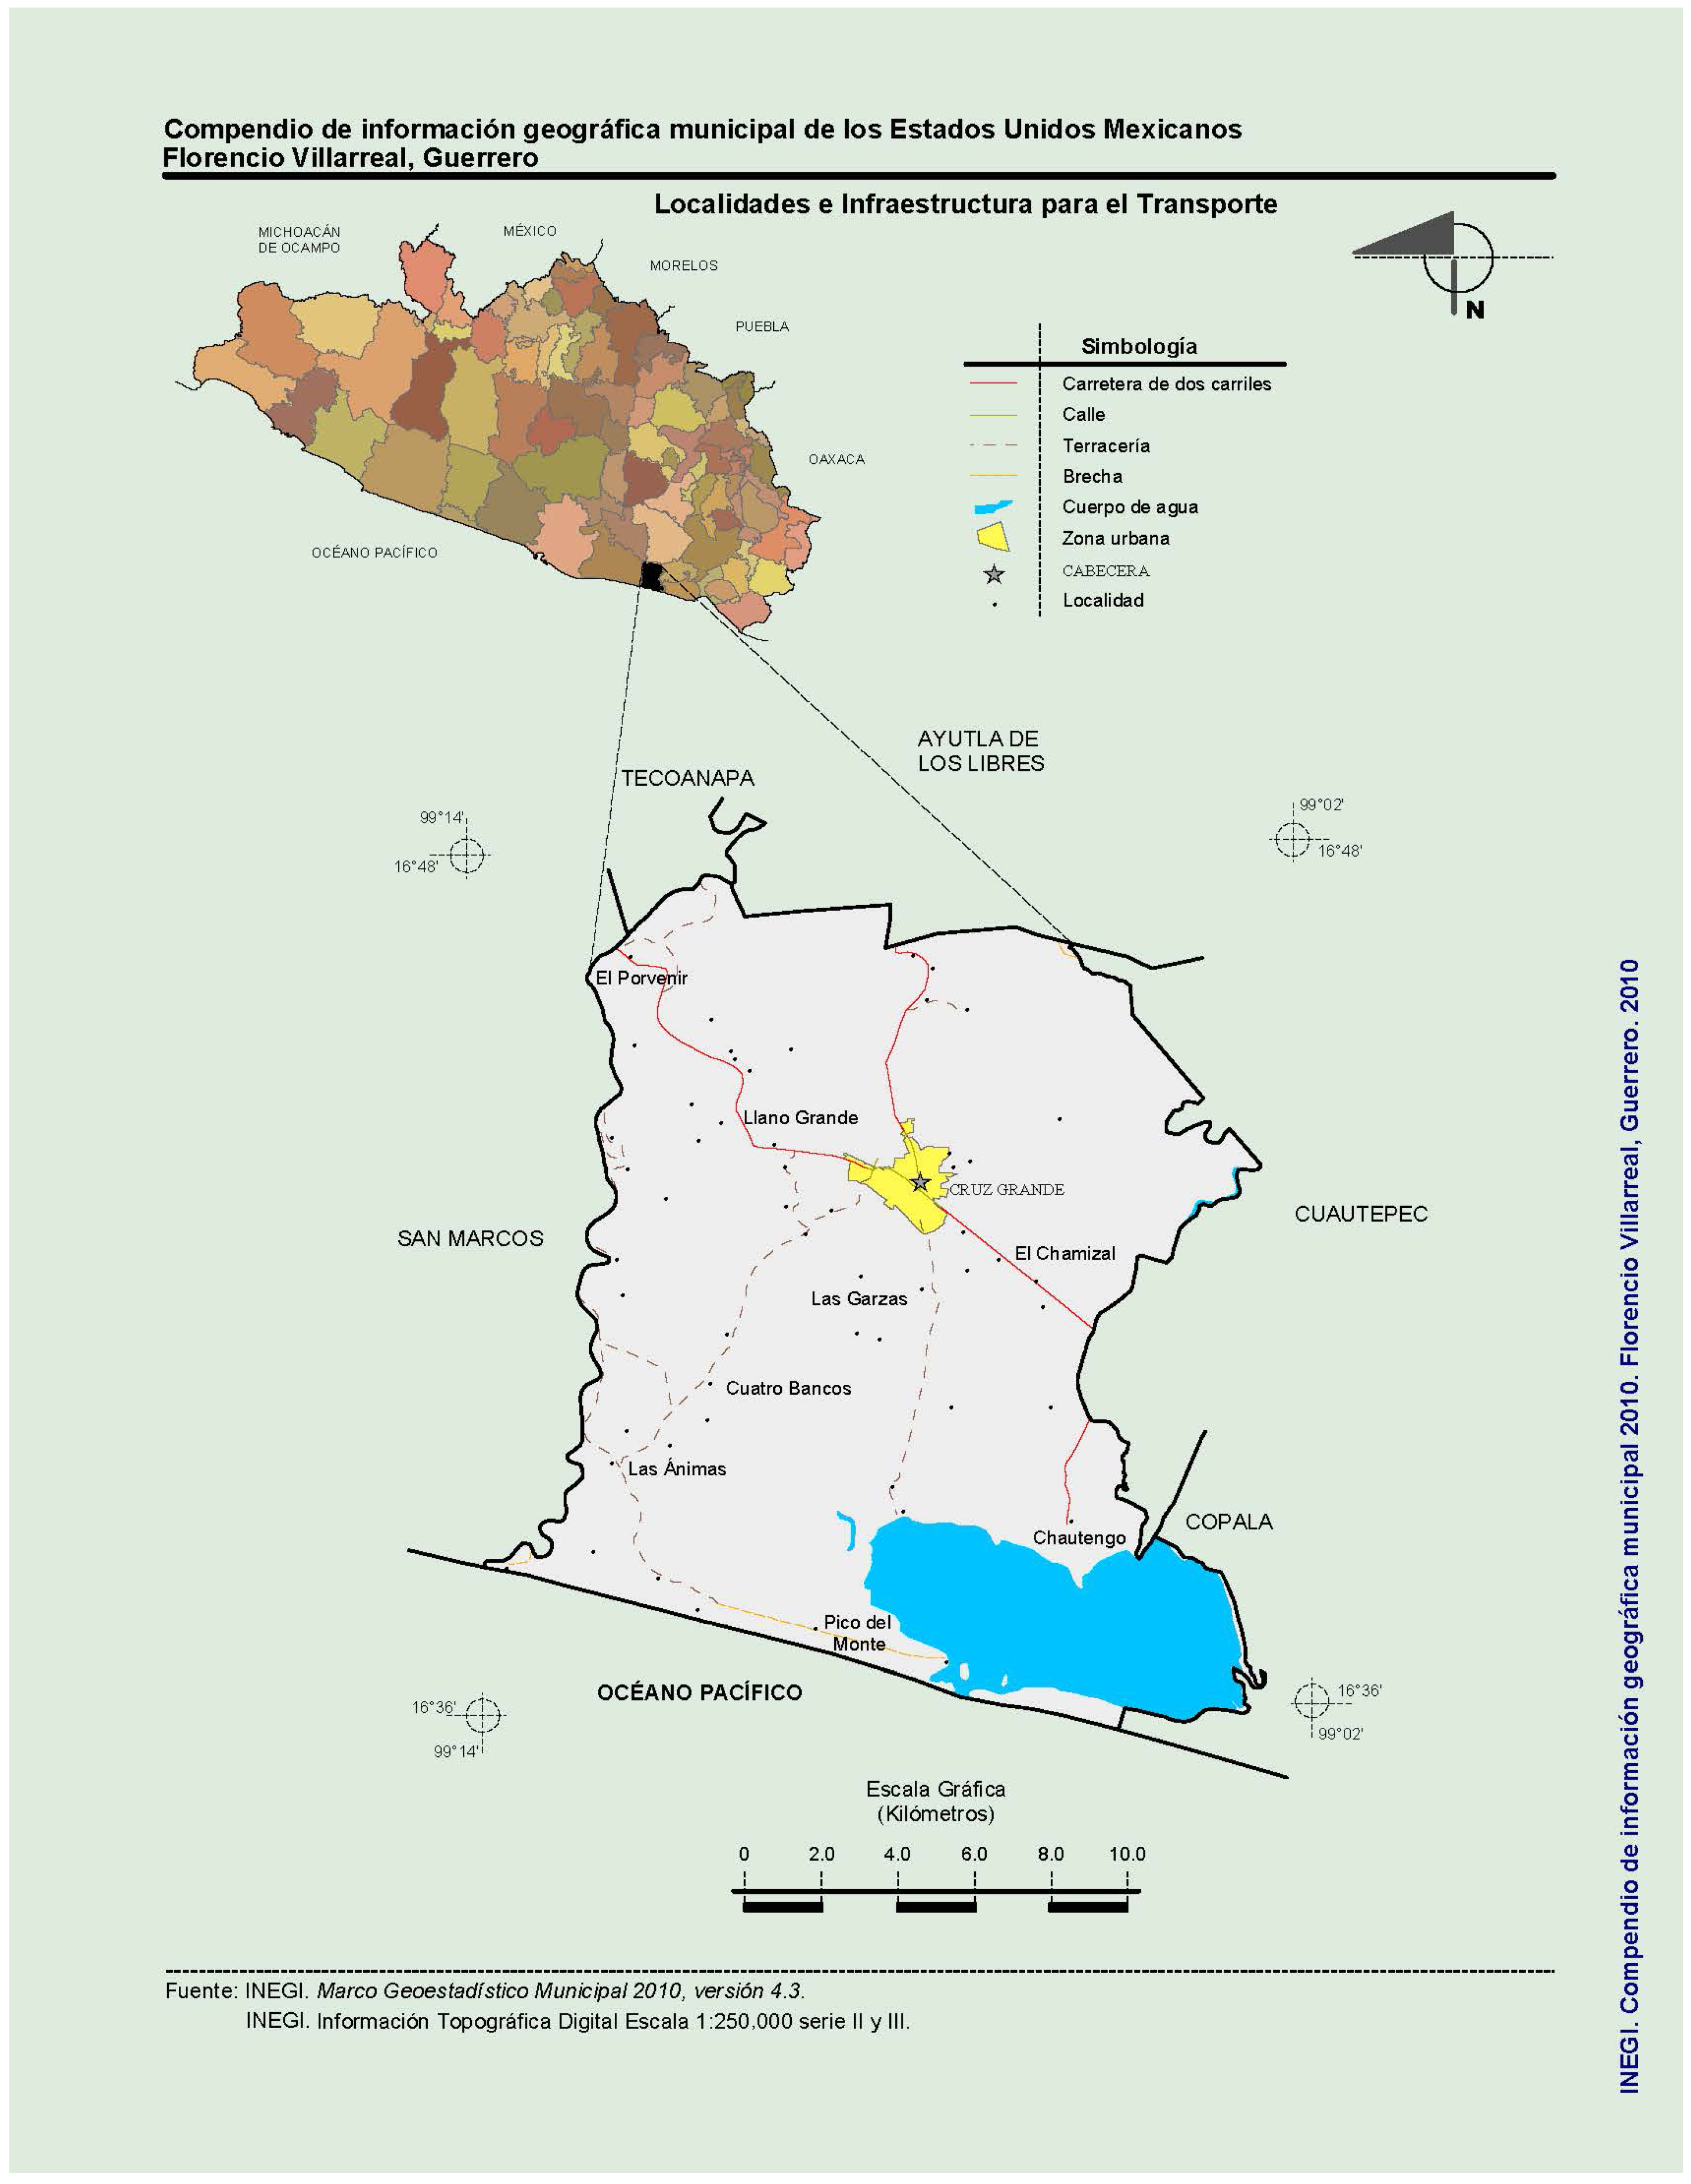
The municipality of Florencio Villarreal (
Figure 2) is located in the southern region of the state of Guerrero, Mexico, along the Costa Chica area and bordering the Pacific Ocean. Its municipal seat is the town of Cruz Grande, situated at approximately 99°07′24″ west longitude and 16°43′26″ north latitude, slightly northwest of the Equator. The municipality is bounded to the north by Ayutla de los Libres and Tecoanapa, to the east by Cuautepec and Copala, to the west by San Marcos, and to the south by the Pacific Ocean. The average elevation is approximately 30 m above sea level, and its total surface area is 372.90 km
2, accounting for 0.58% of the state’s total area, according to the Municipal Development Plan [
61].
To construct the sustainability assessment, a time-series dataset was compiled for 19 environmental indicators covering the period 2010–2023. The data were sourced from official national databases, ensuring consistency and reliability. Primary sources included the Agrifood and Fisheries Information Consultation System [
63], the Population and Housing Censuses [
64,
65,
66], the Sustainable Development Goals Indicators platform [
67], and the National Commission for the Knowledge and Use of Biodiversity [
68].
The selection of these indicators was based on their interpretability, variability, and relevance to the local context. To provide a clear conceptual structure, they were organized into three thematic categories:
Water management, including metrics on access to piped water, well density, and wastewater treatment coverage.
Land use and solid waste, with indicators such as urban encroachment near water bodies, waste collection efficiency, and land use balance.
General environmental metrics, covering aspects like CO2 emissions per capita, renewable energy consumption, and forest cover.
The selection of these 19 indicators was further validated against established international and national frameworks, including the Environmental Performance Index (EPI), the Ecological Footprint Index (EFI), the ISAM index, and the SDGs. As shown in
Table 1, 89% of the indicators (17 out of 19) have precedents in these recognized systems, which enhances the scientific robustness and comparability of our study.
The indicator for Forest and jungle coverage change (
) was quantified by analyzing historical satellite imagery from the Google Earth™ platform, following a visual comparison method similar to that of Avilés-Ramírez et al. [
69]. Polygons representing areas with loss of vegetation cover were manually digitized for different years. The surface area of these polygons, obtained from official cartography [
66], allowed for the calculation of the annual and cumulative deforestation rate.
The indicator for Environmental impact of agricultural activities (
) was estimated by quantifying four types of pollutants based on annual production records from SIACON [
63]. Applying the fundamental estimation technique proposed by the FAO [
70] and using emission factors from other international and national bodies [
71,
72,
73,
74], we calculated the annual generation of greenhouse gases, solid waste, agrochemical use and water/soil contamination. Each of these four observed values was then compared against a permissible or optimal threshold derived from the literature to express its impact as a percentage. The final value for the main indicator (
) was determined by averaging these four individual impact percentages.
Notably, the estimation methods for indicators I1 and I19 are susceptible to introducing subjective bias. This is particularly relevant for I19, which was derived from a visual analysis of satellite images.
Furthermore, two innovative indicators were used to capture local water management realities often missed by standard composite indicators. Number of private wells (
) was included to account for unofficial water extraction, a critical factor in aquifer overexploitation that remains largely invisible in official statistics [
75]. Similarly, Public water service wells (
) was designed to move beyond official information and assess the physical availability of public infrastructure. This address the gap between reported access and effective, equitable service for all households [
76,
77].
3.4. Data Validation and Preparation
Recognizing the importance of valid input data, this study, while rooted in official national and international databases, acknowledges their potential limitations in terms of representativeness and timeliness. To address this, a three-tiered complementary validation strategy was implemented. First, a direct institutional relationship between the Universidad Autónoma de Guerrero and the government of Cruz Grande allowed for the corroboration of official data with local administrative records and programs. Second, the authors’ more than ten years of personal fieldwork experience in the locality provided firsthand knowledge to contrast the indicators with observed territorial dynamics. Third, results from previously published electronic surveys of local inhabitants were integrated [
78], providing empirical support for social and perceptual indicators. Periodic meetings with residents and collaborating researchers further enabled the triangulation of findings against independent evidence [
79].
This multi-level approach was quantitatively reinforced. A prior study [
78] allowed for the in-situ corroboration of 47% of the individual indicators (
and
). For the remaining indicators, a statistical analysis showed coefficient of variation (CV) values below 15%. This threshold is interpreted as low dispersion, providing evidence of adequate consistency and reliability in the data, in line with widely accepted criteria in environmental and experimental sciences [
80,
81].
Following this comprehensive validation process, the complete dataset—a matrix of 19 indicators over 14 years (2010–2023)—was prepared for analysis. The entire matrix was standardized using the z-score transformation (Equation (
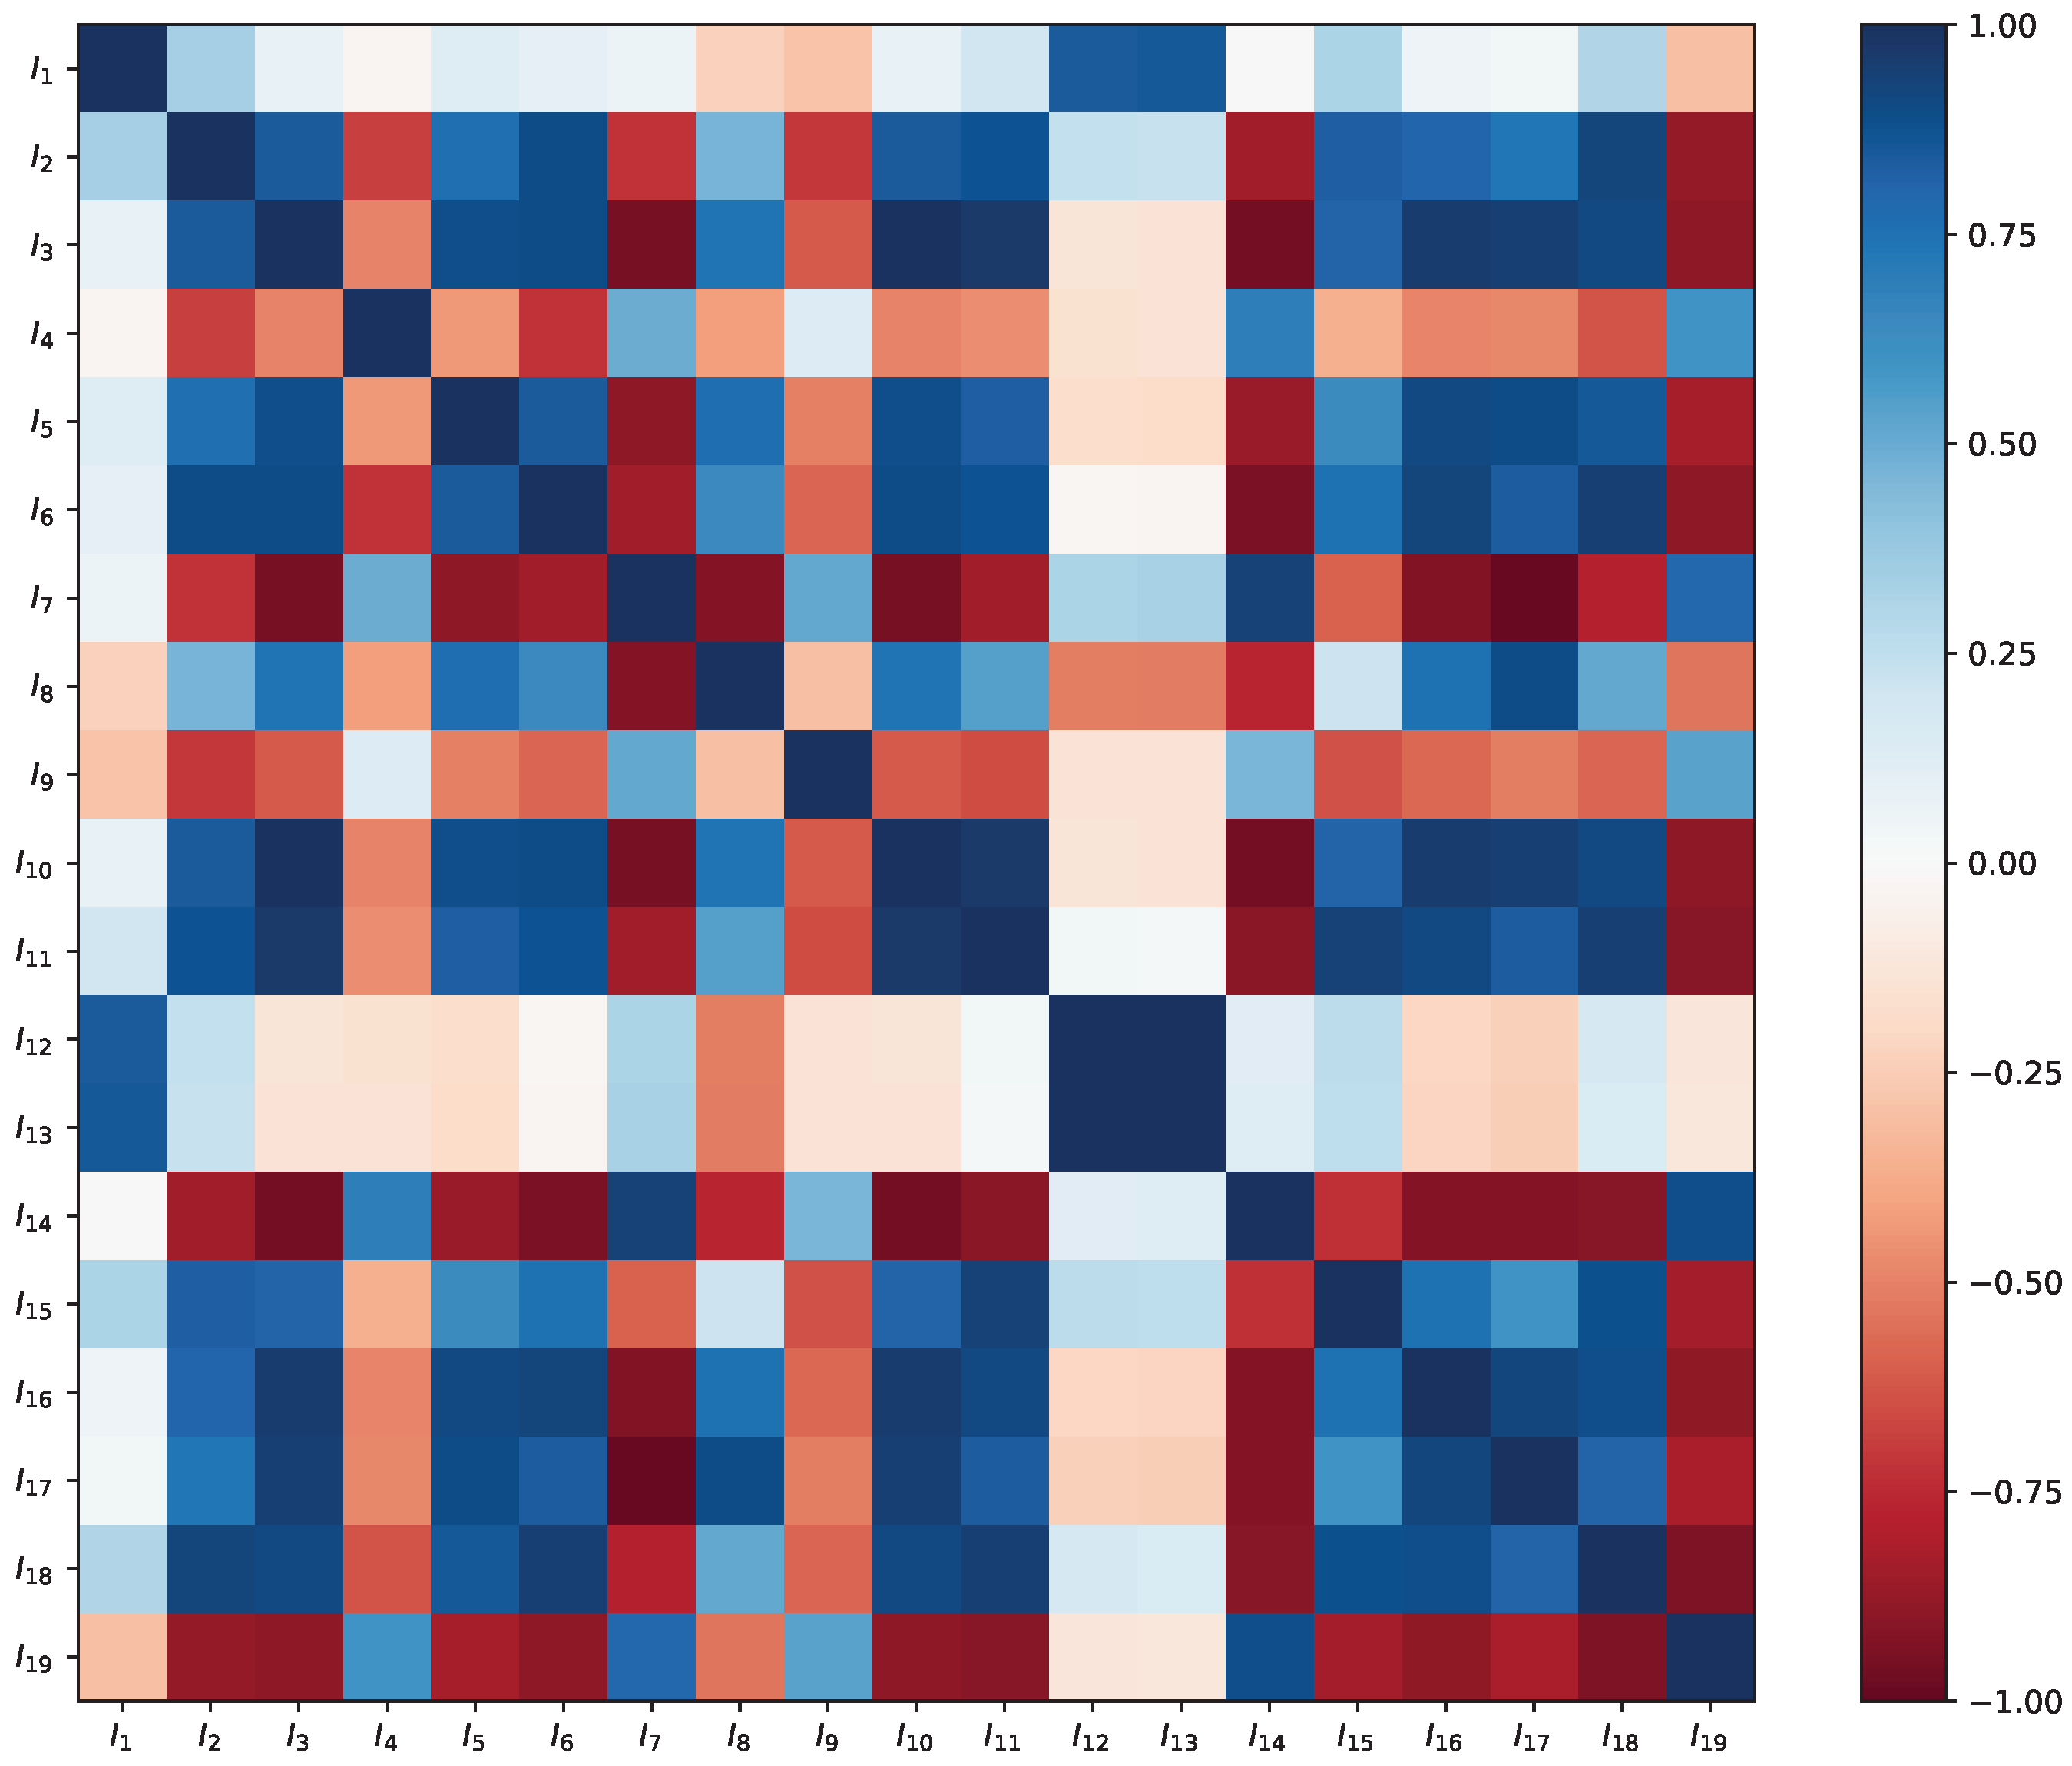
2)) to ensure all indicators were on a comparable scale. From this standardized data, the Pearson correlation matrix (
R) was computed, which served as the common input for both the temporal and structural analyses. Together, these validation and preparation steps reduce the uncertainty associated with using only official data and ensure that the results reflect not only data availability but also the interpretive richness derived from the interaction between academia, local government, and the community.
Following this comprehensive validation process, the complete dataset—a matrix of 19 indicators over 14 years (2010–2023)—was prepared for analysis. Each indicator was standardized across the whole temporal series using the z-score transformation (Equation (
2)). For every variable, its own mean and standard deviation were computed over the full 2010–2023 period, ensuring that all yearly observations of that variable share a common reference benchmark. From this standardized data, the Pearson correlation matrix (
R) was computed as the common input for both the temporal and structural analyses.
This choice of fixed, indicator-specific normalization enhances comparability across years but may attenuate changes in the overall distribution through time. Such trade-offs between fixed and time-varying goalposts are a well-known challenge in longitudinal composite indicators [
82,
83], and we interpret temporal trends in light of this limitation.
3.5. Calculation of the Regional Environmental Sustainability Index
To ensure the robustness and validity of the analysis, several key statistical assumptions and procedures were addressed. First, the suitability of the data for PCA was confirmed using two diagnostic tests. The Kaiser-Meyer-Olkin (KMO) measure of sampling adequacy was calculated to assess the proportion of common variance among the indicators, with an acceptability threshold set at KMO > 0.60, consistent with methodological recommendations [
84,
85]. Additionally, Bartlett’s test of sphericity was performed to verify that the correlation matrix was not an identity matrix, requiring a statistically significant result (
) to proceed. The assumption of linearity was evaluated by comparing the Pearson (
r) and Spearman (
) correlation matrices; pairs of indicators with a notable divergence (
) were subjected to detailed visual inspection using scatter plots. The normality assumption was assessed with the Shapiro–Wilk test, and homoscedasticity was considered addressed by the inherent standardization of the data when using a correlation matrix. Finally, to evaluate the stability of the first principal component (
), a 5-fold cross-validation procedure was implemented. The dataset (n = 14 years) was randomly split into five subsets, and
was re-calculated five times. The stability of the component was confirmed by examining the consistency of the explained variance, the similarity of the loading vectors (using cosine similarity), and the coherence of variable importance rankings (measured with Spearman’s correlation on the absolute values of the loadings) across the folds [
84].
Following these validation procedures, the RESI was calculated as defined in
Section 3.1.1 using Equation (
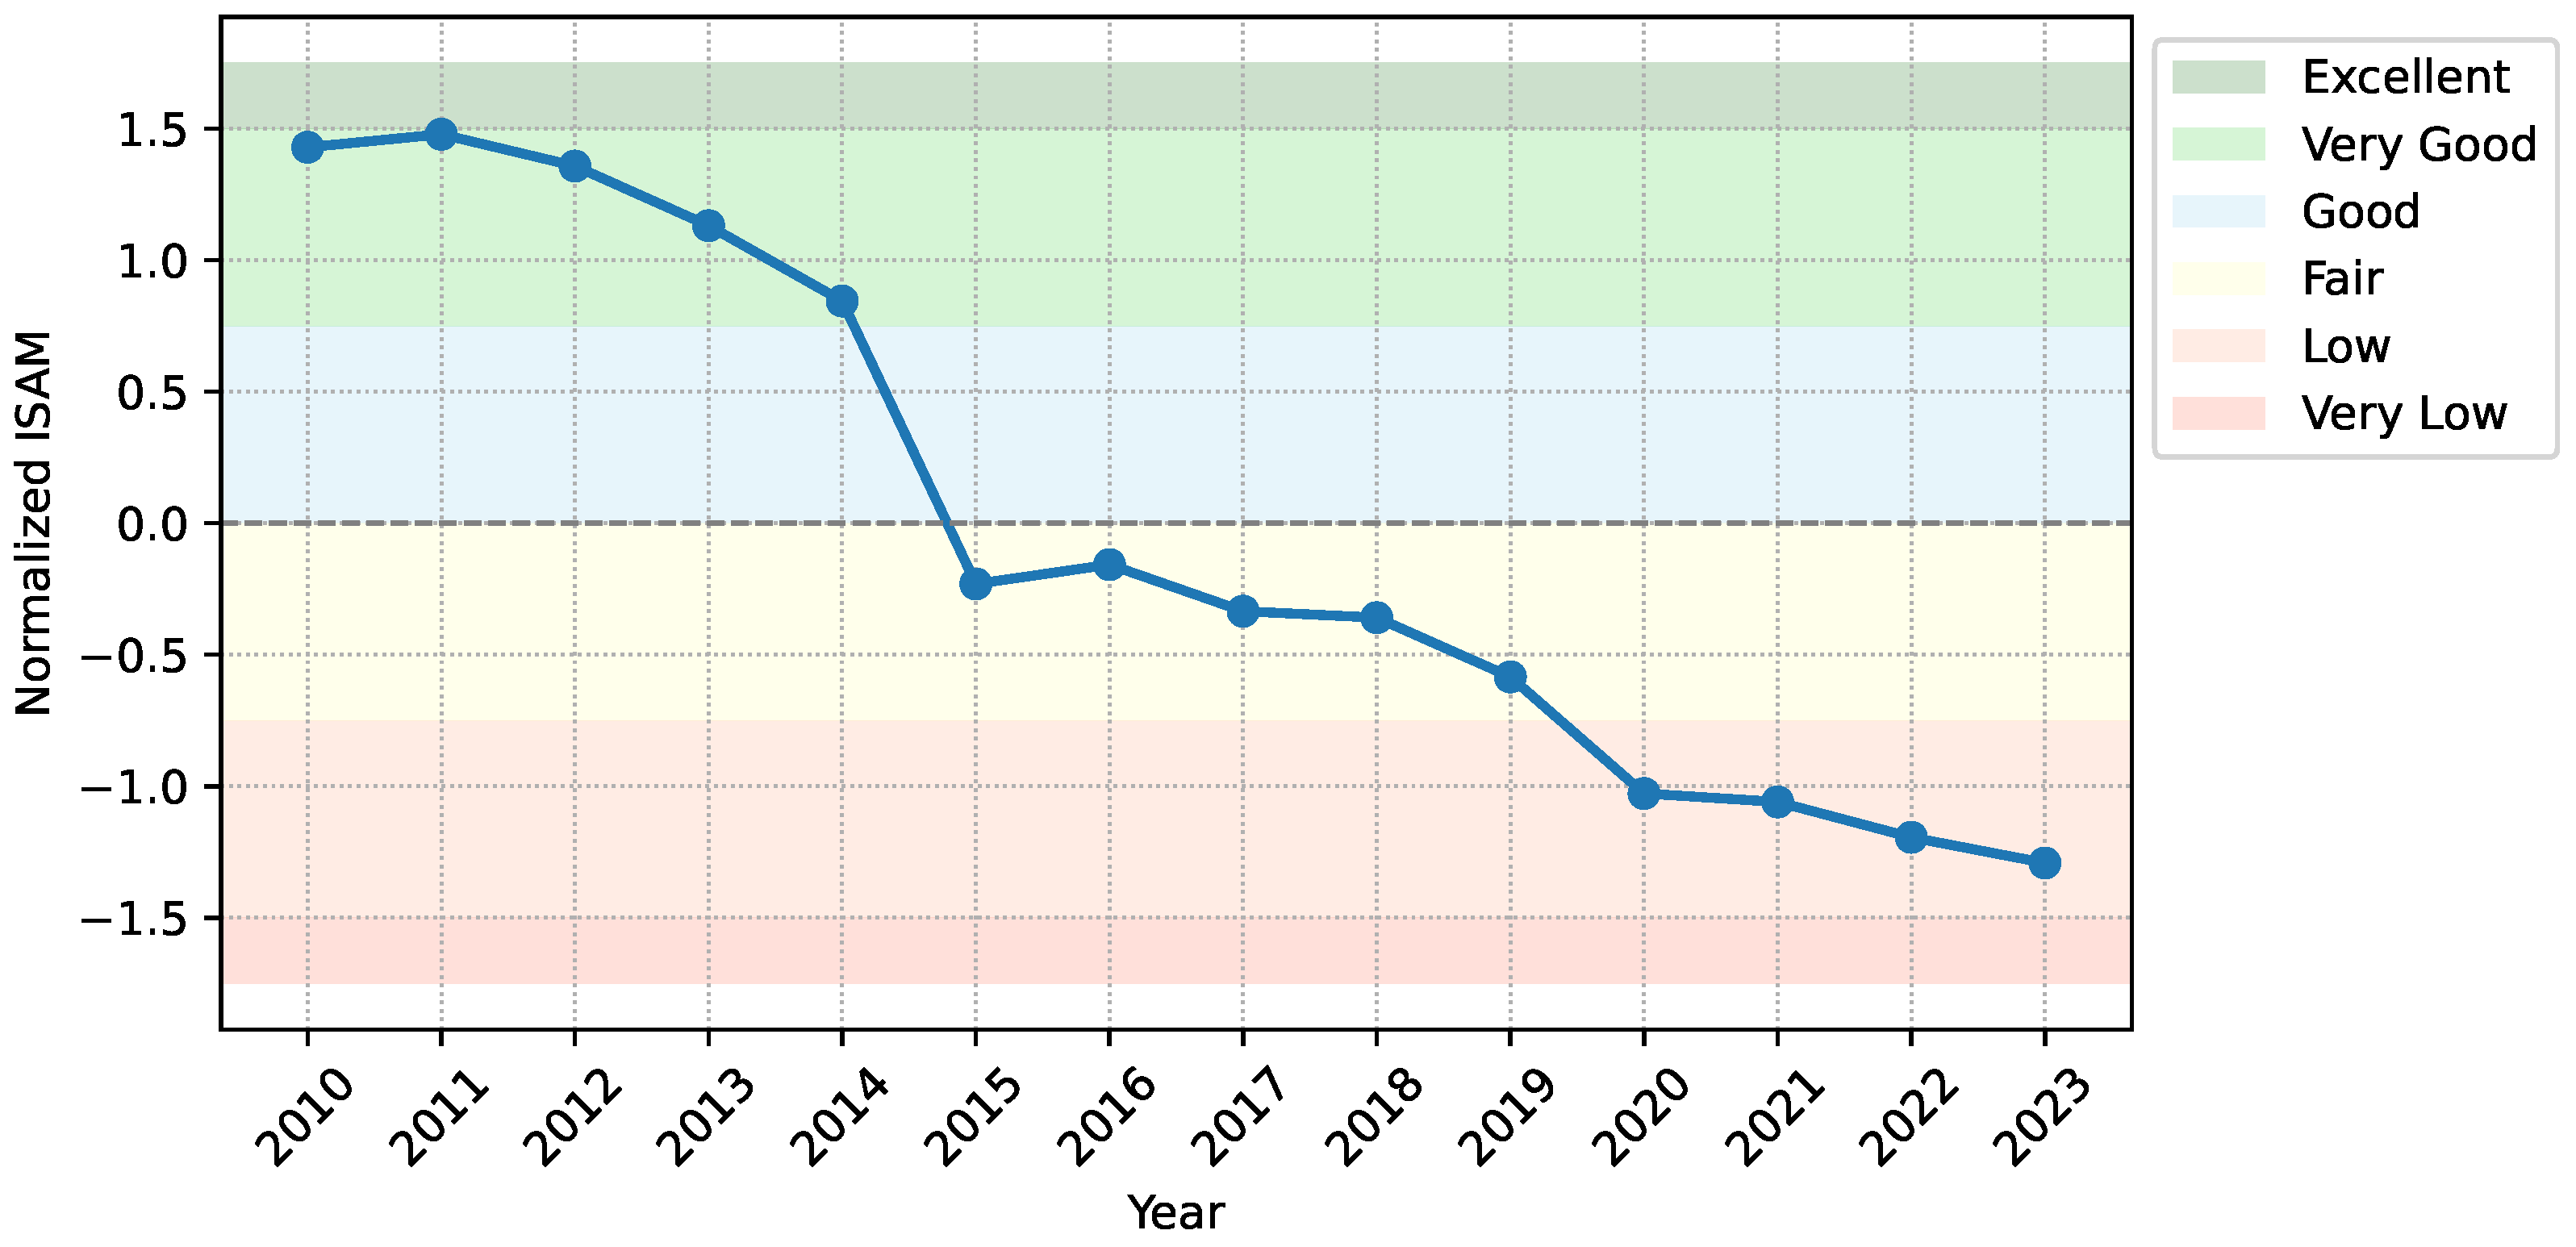
4). The resulting RESI time series was normalized (to mean 0, variance 1) and classified into six qualitative sustainability levels based on standard deviation intervals, as detailed in
Table 2.
3.6. Network Construction and Structural Analysis
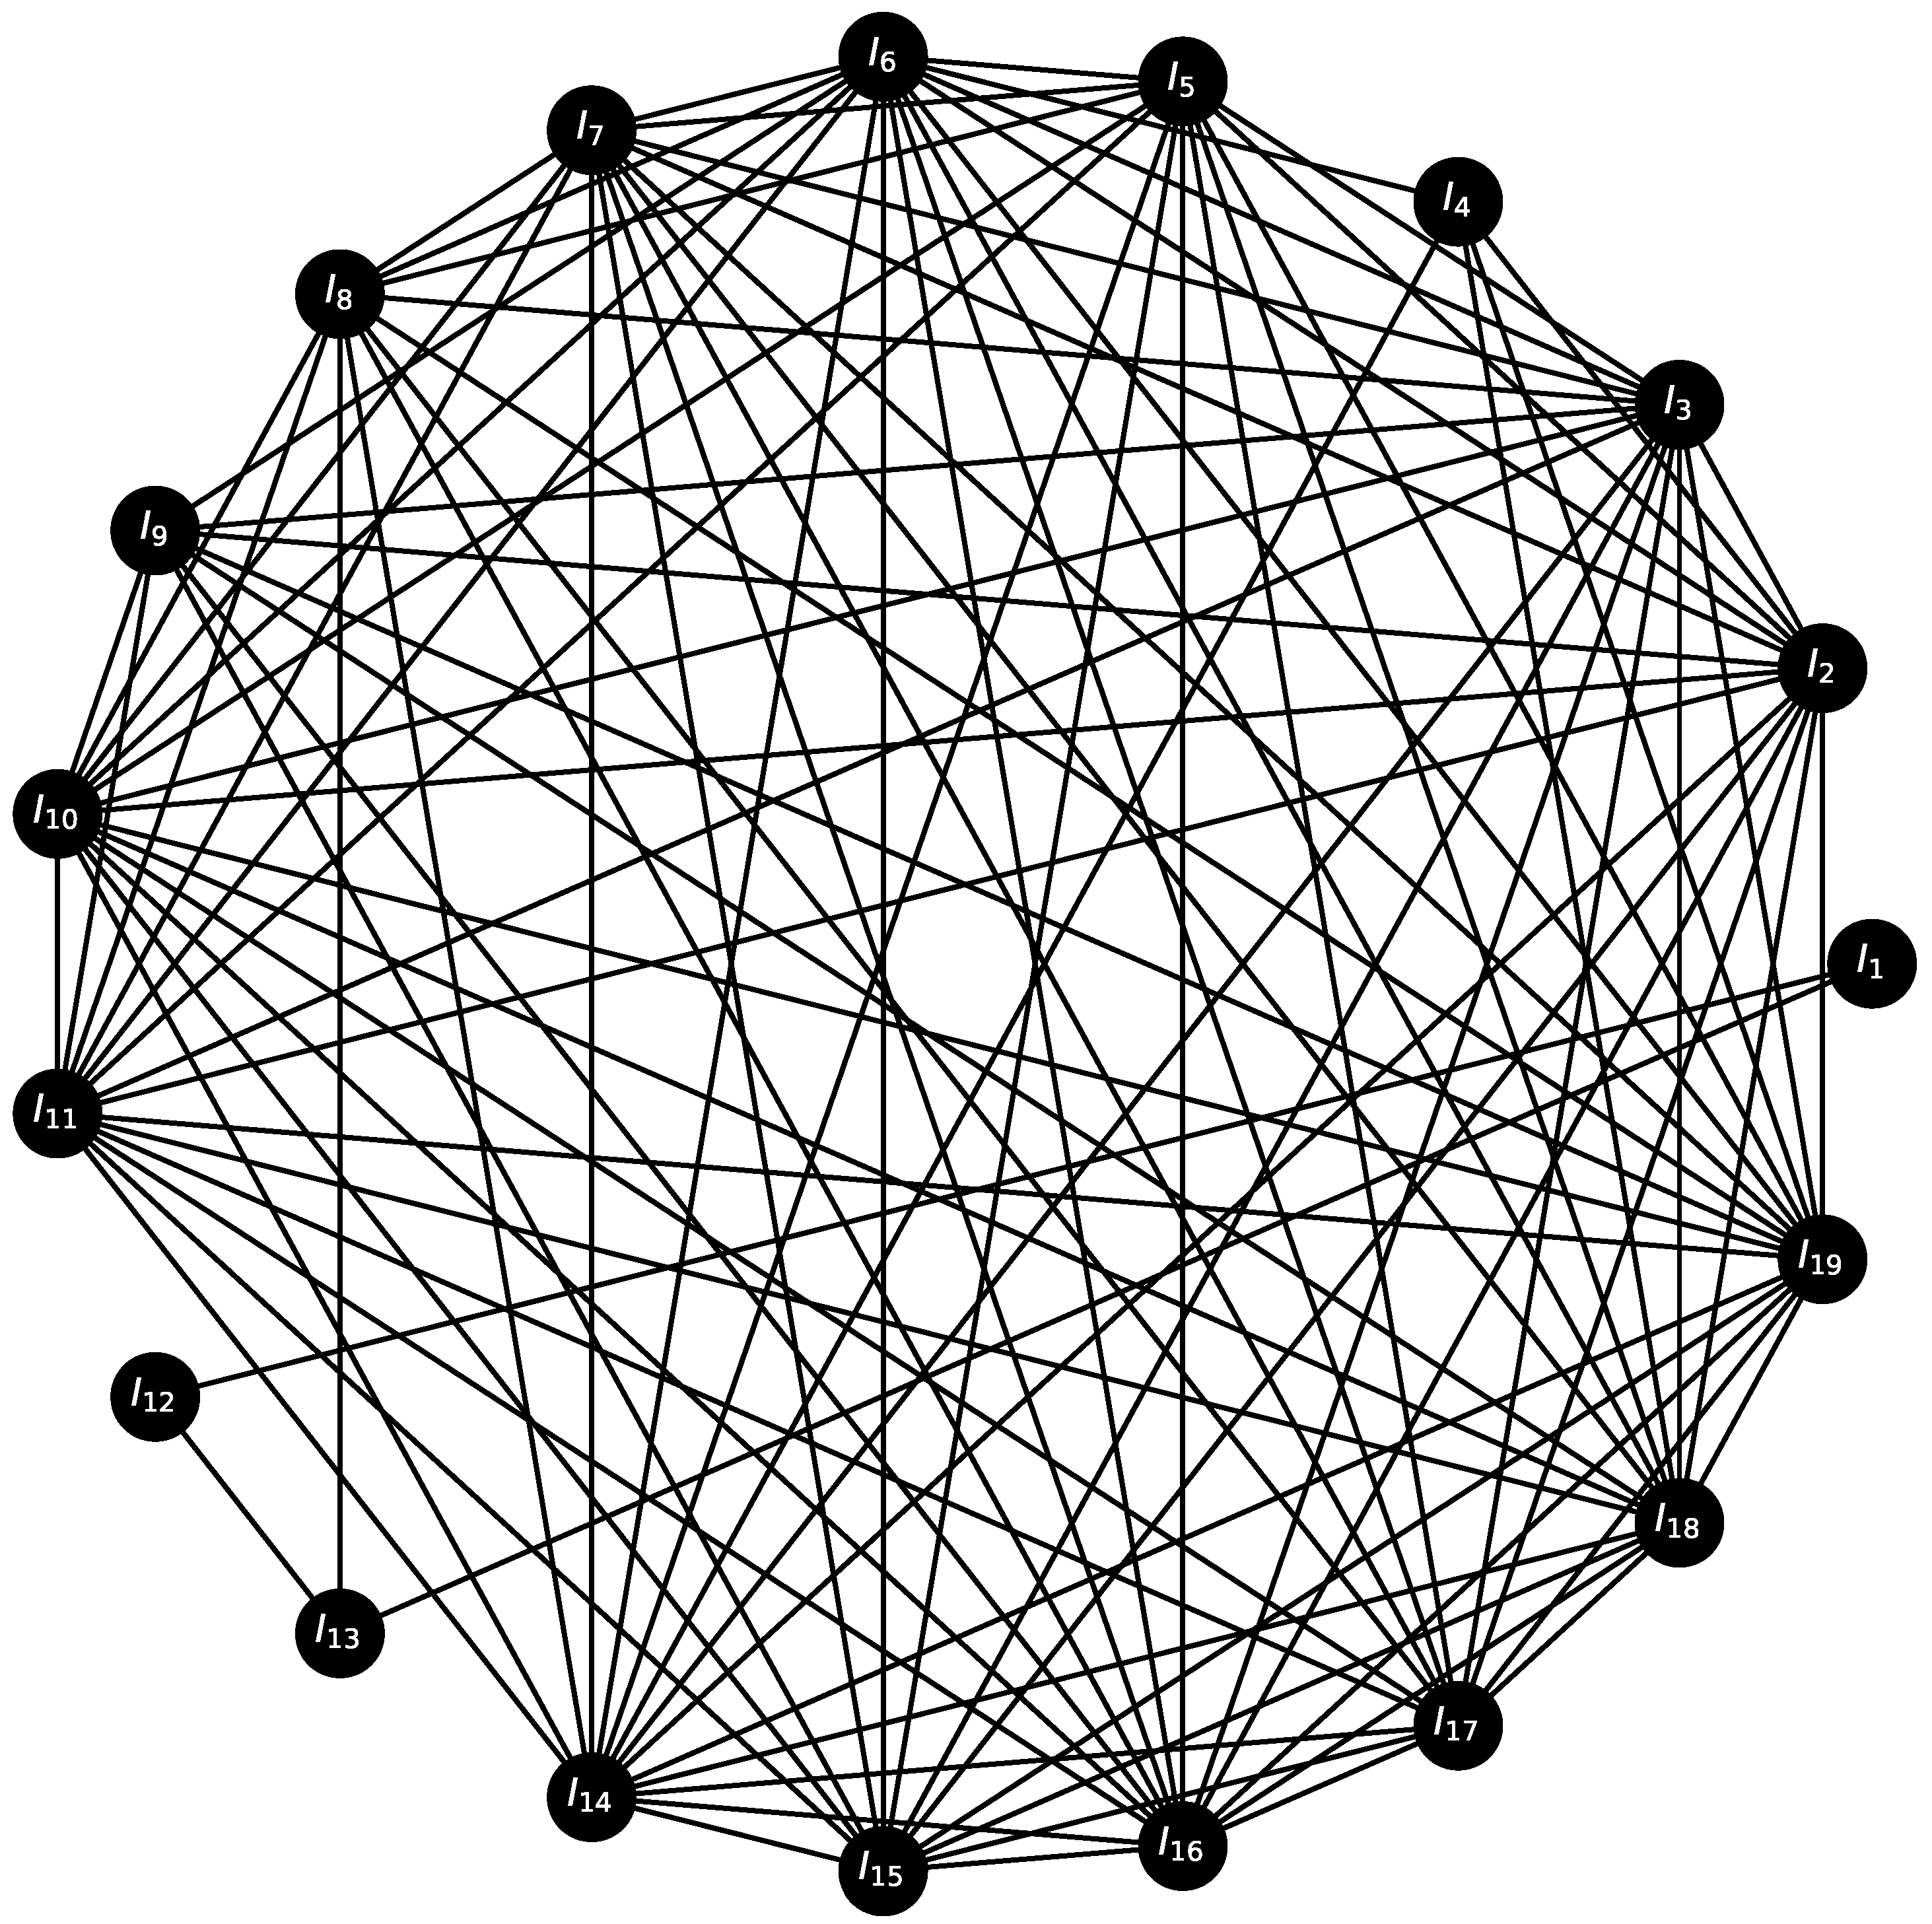
In parallel, to explore the systemic structure of the indicators, a network was constructed from the same correlation matrix R. In this network, each of the 19 indicators is represented as a node. An undirected link is established between two nodes if the absolute value of their Pearson correlation, , exceeds a specific threshold, . The value of is methodologically determined by identifying the highest possible threshold that ensures the resulting network remains fully connected. This approach preserves the core relational structure while filtering out weaker, potentially noisy correlations.
Once the network’s adjacency matrix (
A) is established, the structural–functional cohesion index,
, is calculated as defined in Equation (
11). To ensure the result is not an artifact of the specific correlation threshold (
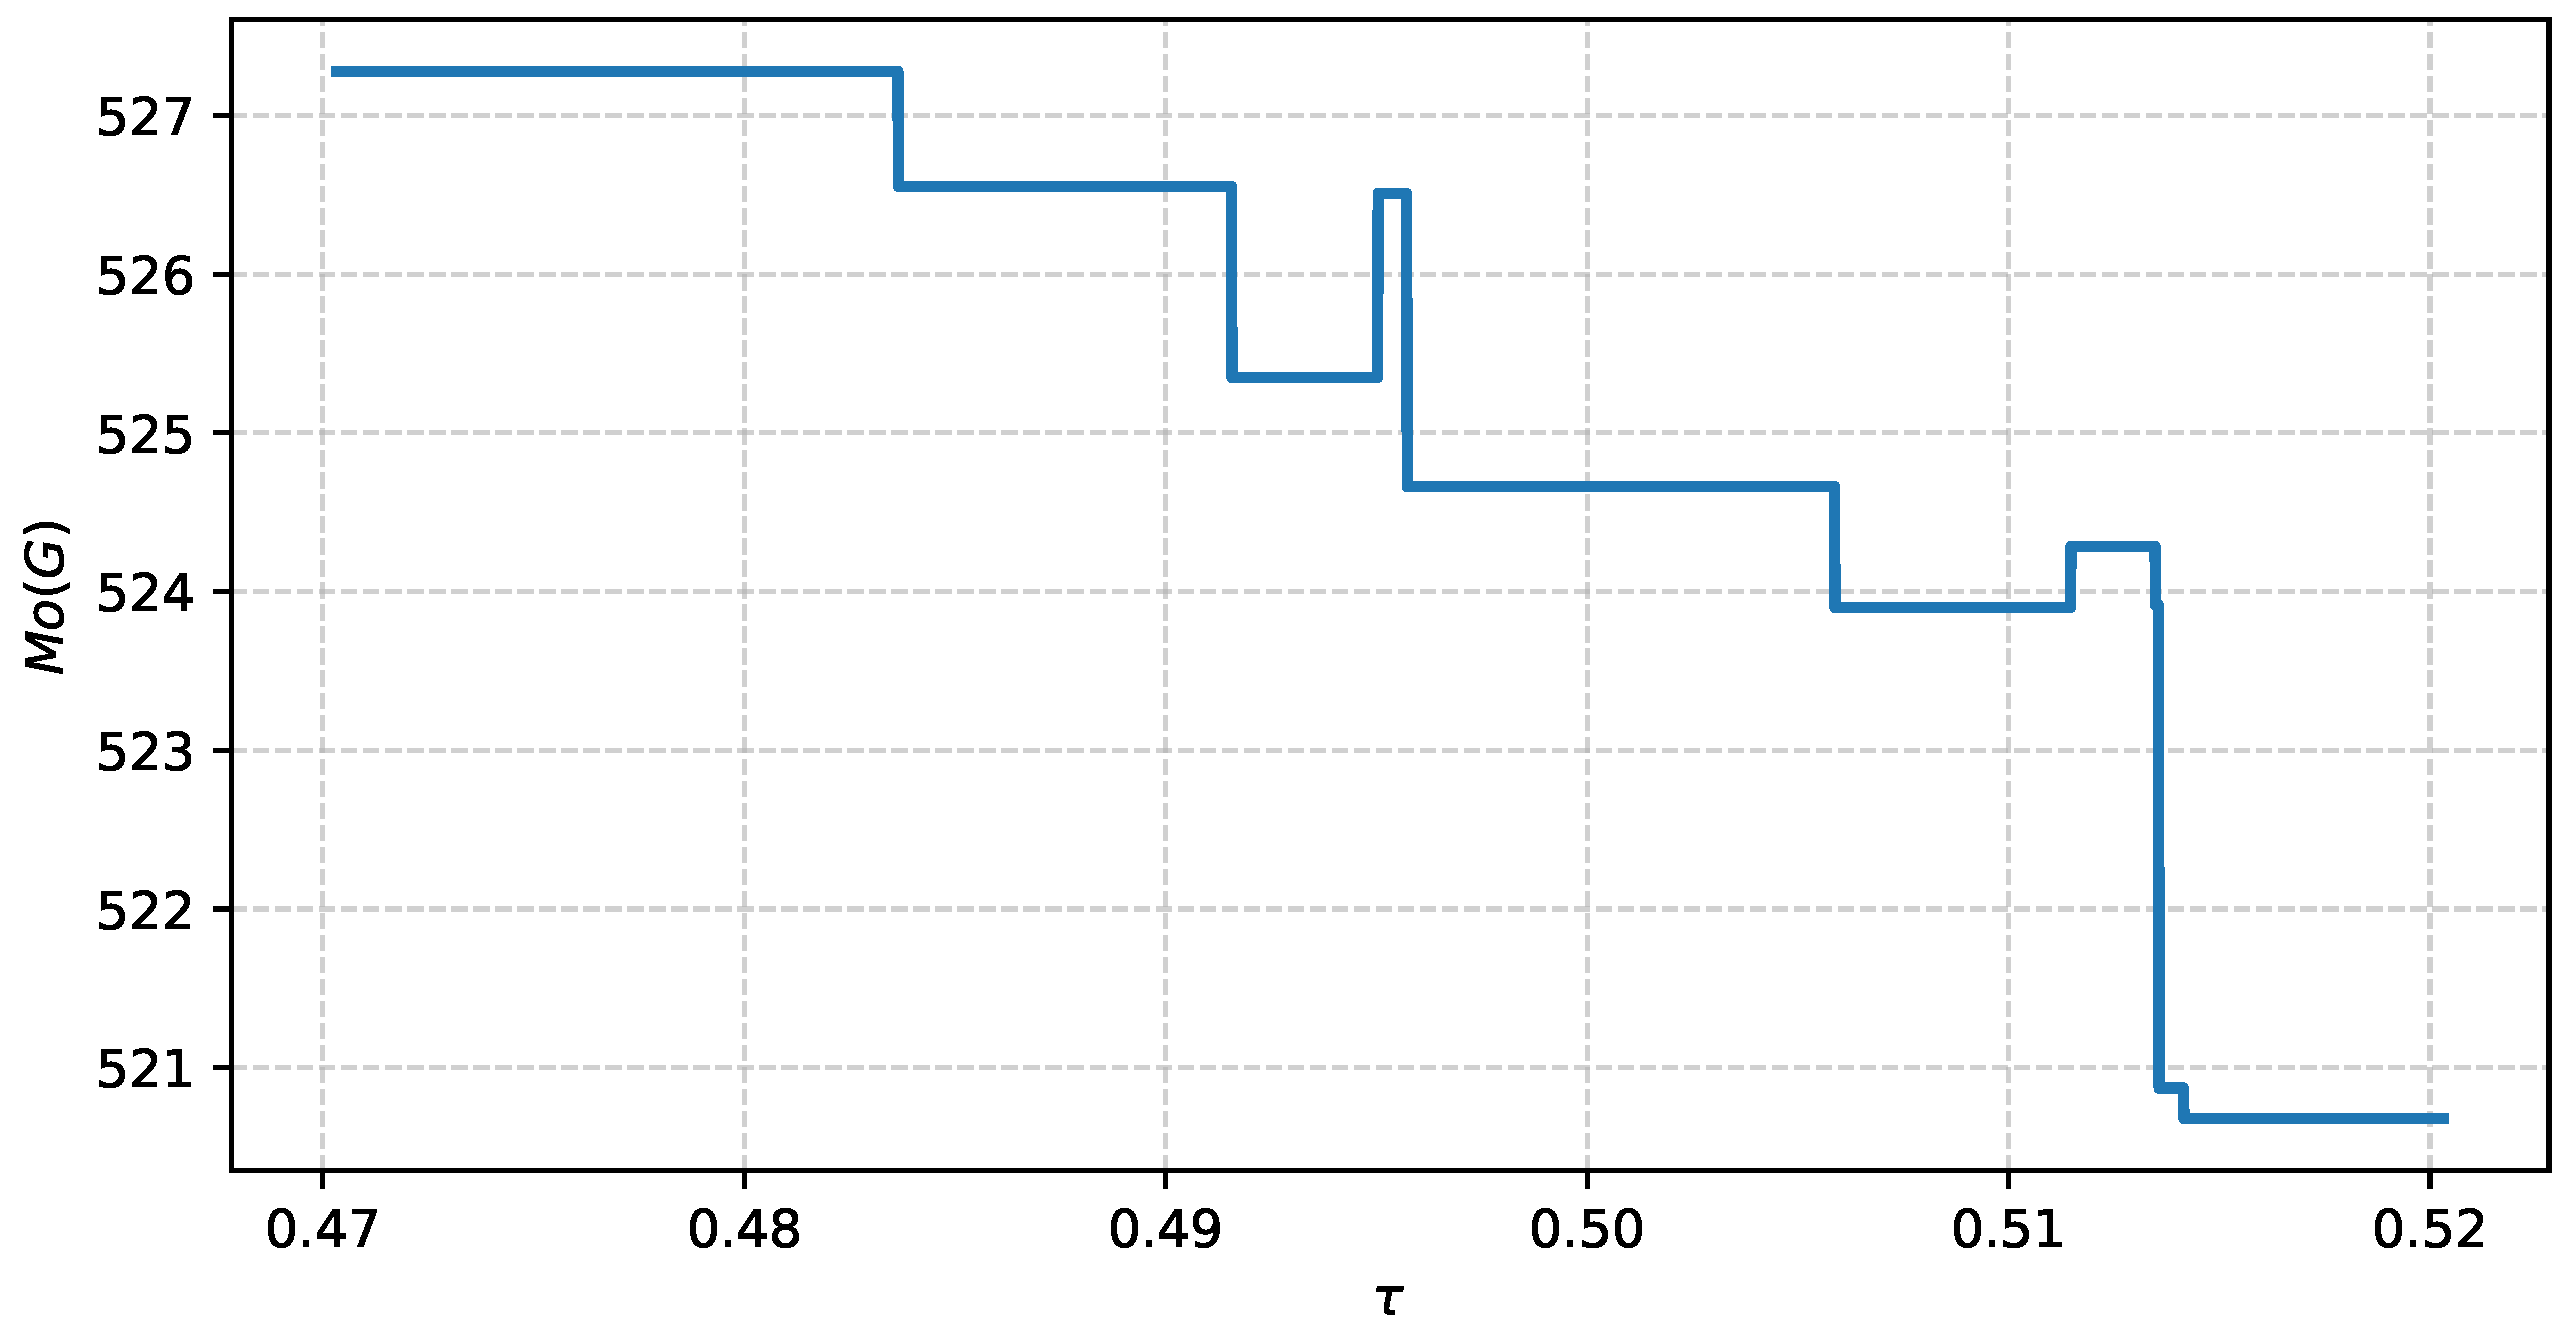
) selected, a sensitivity analysis is performed. This involves re-calculating the
index across the predefined interval
to verify the stability of the structural diagnosis.
To provide a comprehensive characterization of the network’s topology, a suite of additional metrics will be computed. These include node-level centrality measures (degree, closeness, betweenness, eigenvector), local and global clustering coefficients, and global network properties such as diameter, average path length, and modularity, as described in
Section 3.1.2.
All procedures were implemented in Python using the libraries NumPy, pandas, and NetworkX, with the aid of standard graph traversal and linear algebra routines.
3.7. Computational Study
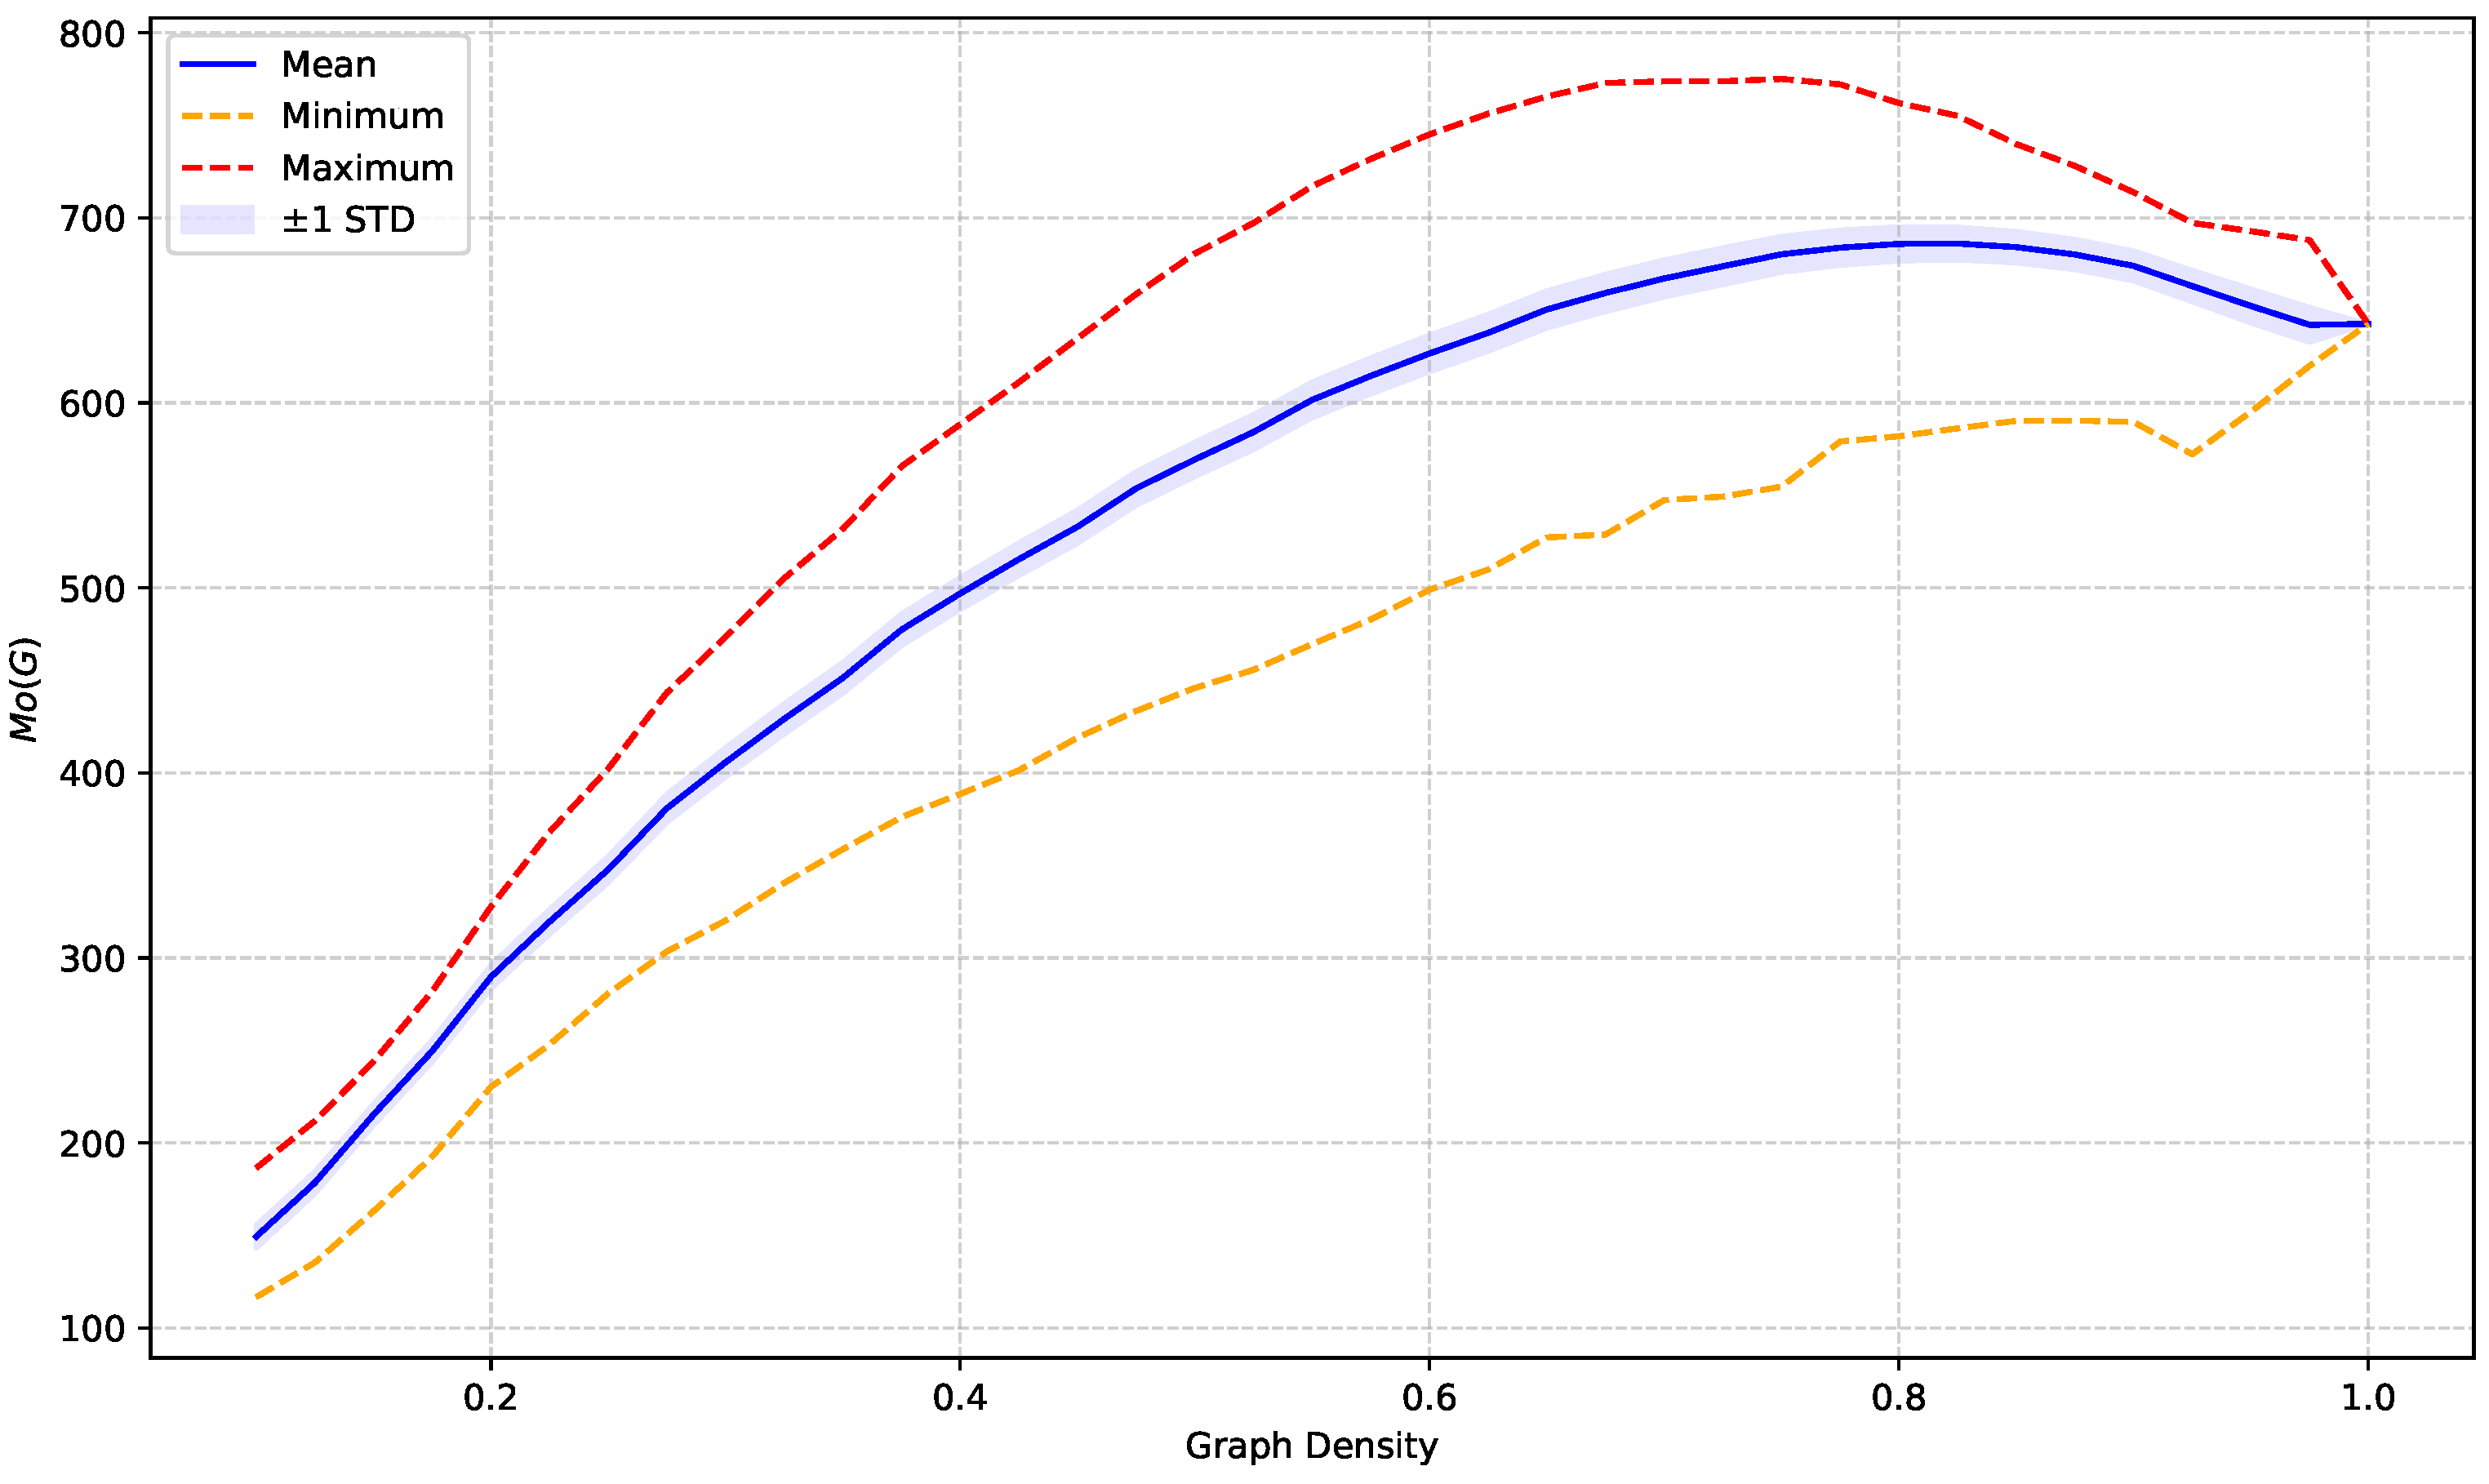
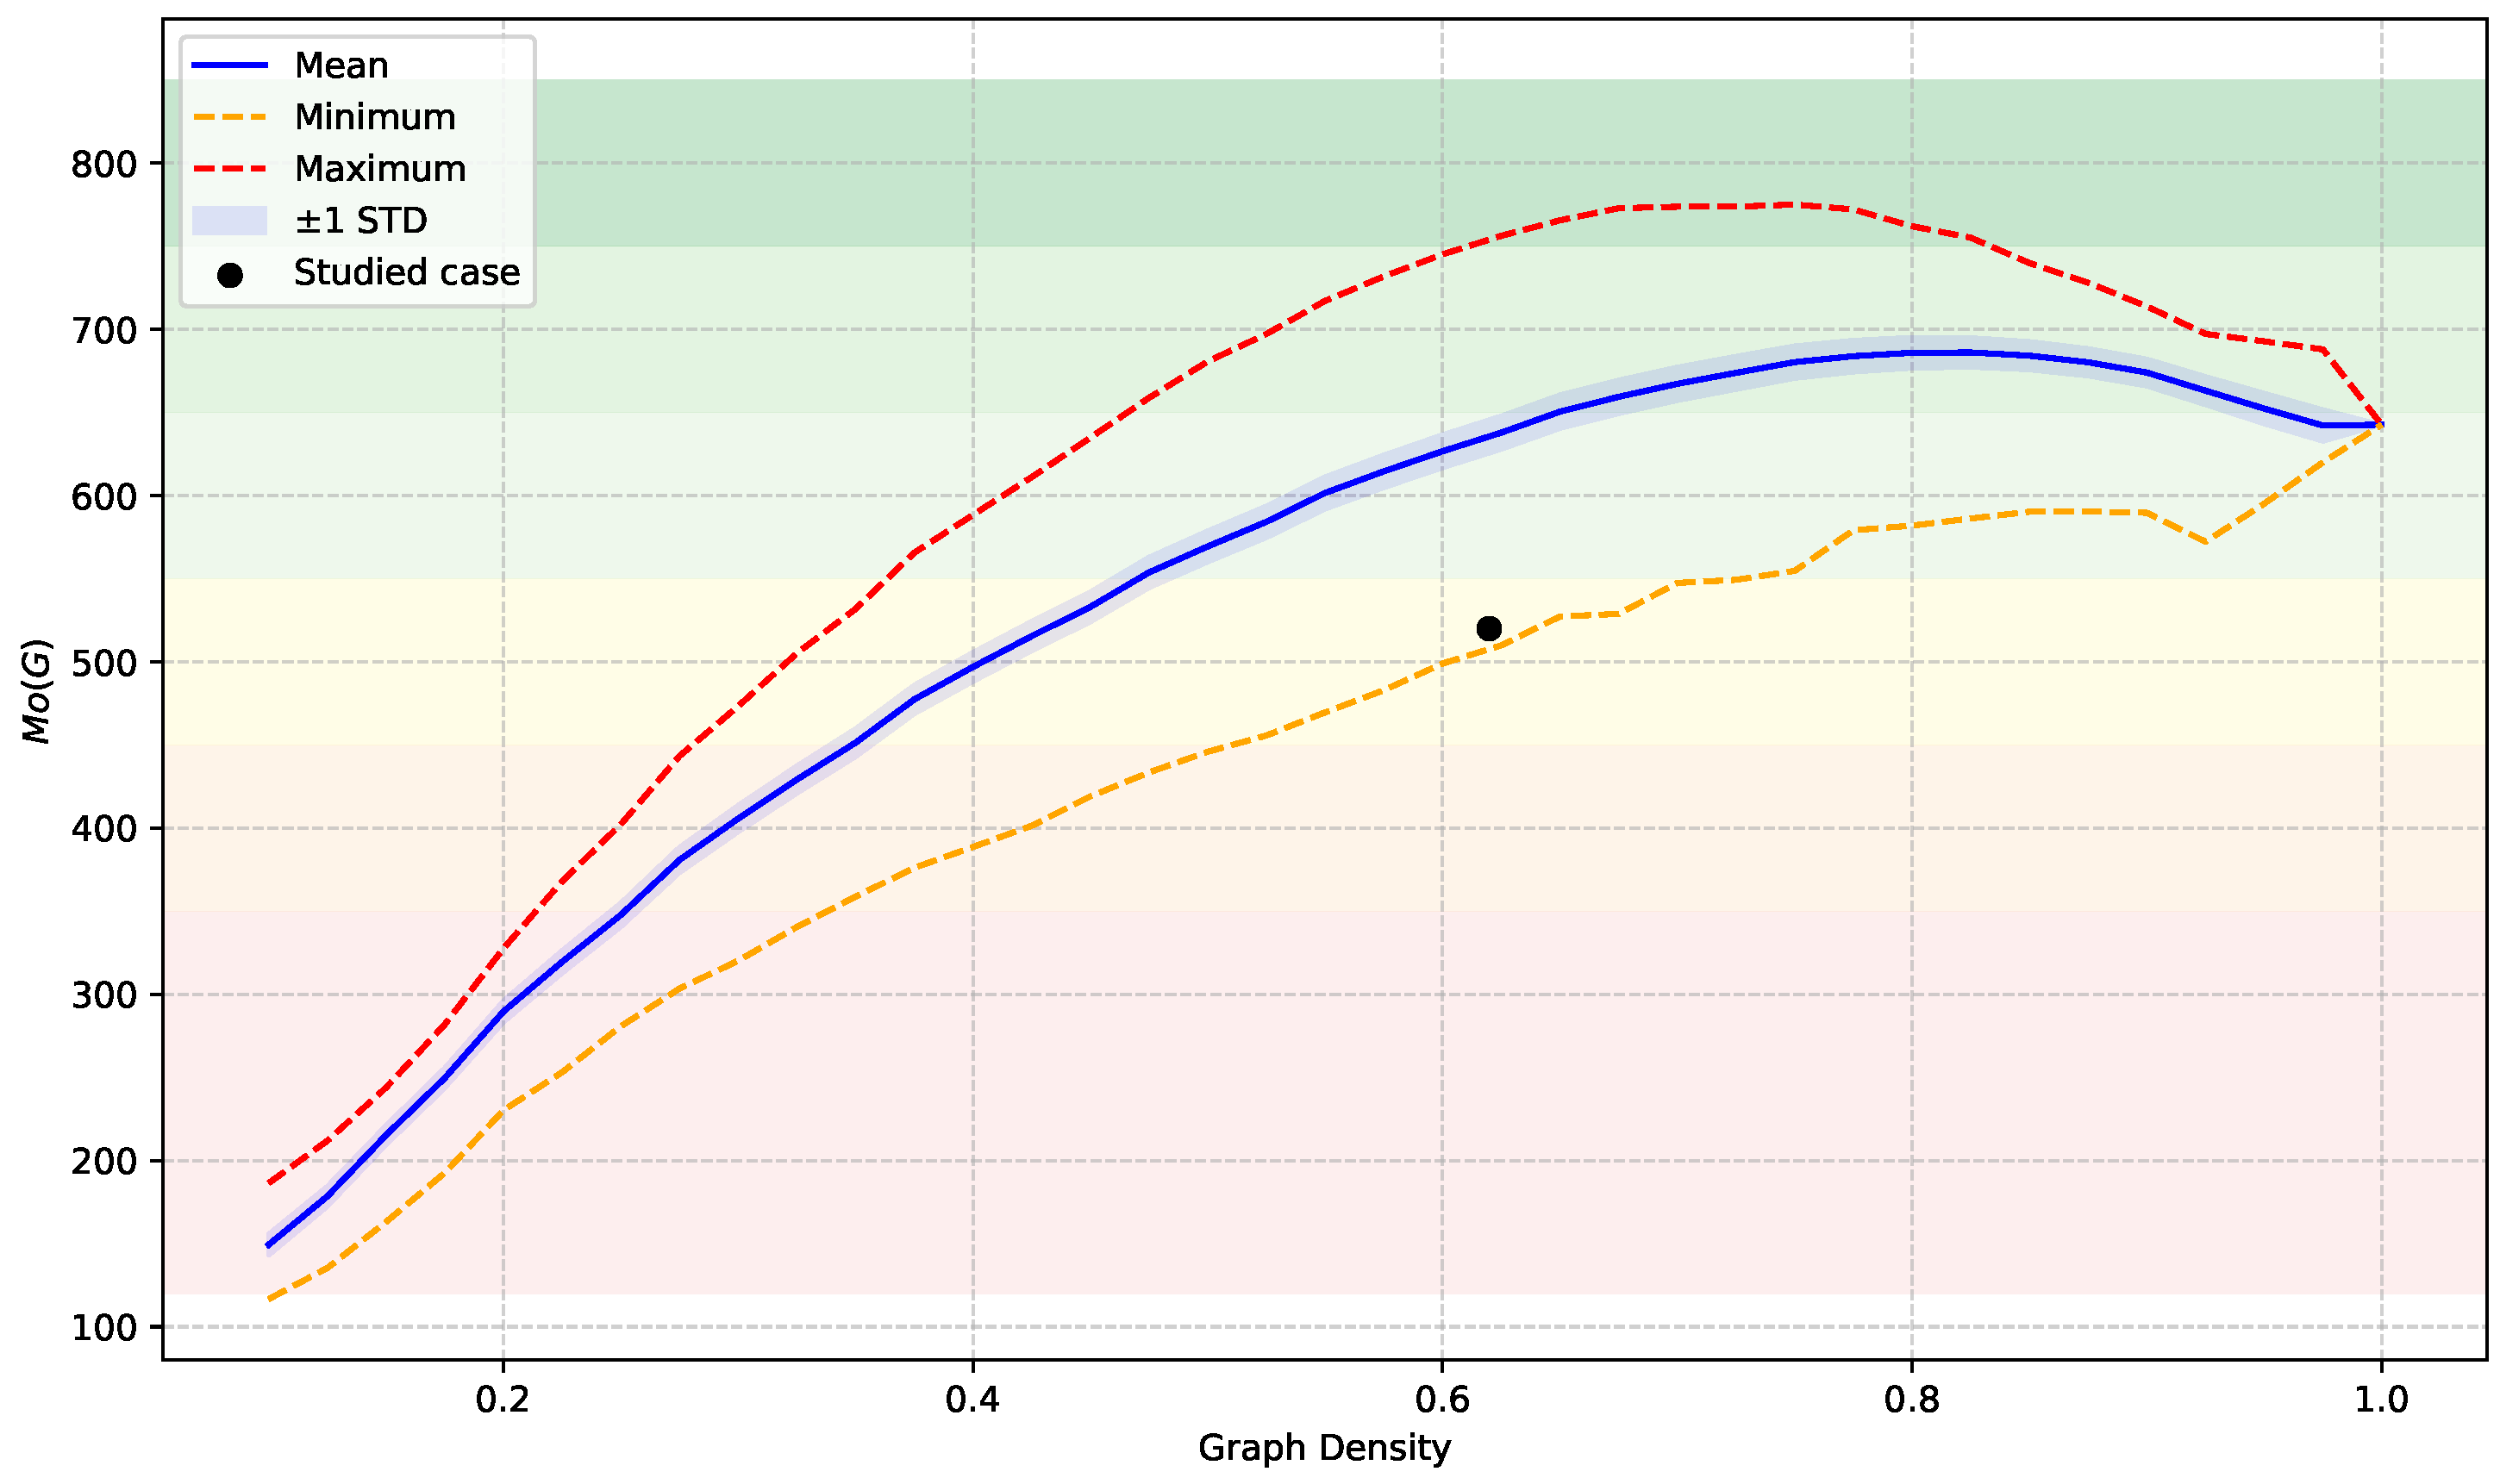
To investigate how the magnitude of the index responds to varying levels of structural complexity, we performed a computational study on an ensemble of random connected networks. The simulation was designed to assess the sensitivity, saturation, and variability of the index across the full connectivity spectrum, thereby providing a robust reference framework for interpreting empirical values.
The simulations were conducted on undirected simple networks with nodes, corresponding to the number of environmental indicators under consideration. The network density, d, was systematically varied in the range , where the lower bound ensures the possibility of connectivity. This range was discretized with a step of , and for each density level, a total of random connected networks were generated and sampled.
To guarantee connectivity, each network was generated by first constructing a random spanning tree and then adding the remaining links uniformly at random until the target density was achieved. This procedure ensures that the sample space includes only connected topologies.
For each generated network, the index
was computed according to its definition in Equation (
11). Node energy values,
, were obtained following the spectral method proposed by Arizmendi et al. [
56] and implemented according to the computational guidelines outlined by Gutman and Furtula [
86]. Eigenvalues and eigenvectors were computed using the LAPACK subroutine
DSYEV, and shortest-path distances,
, were computed using a breadth-first search algorithm.
For each density level, summary statistics of (mean, standard deviation, minimum, and maximum) were recorded across the ensemble of sampled networks. To enhance computational performance, simulations were executed in parallel using OpenMP. All outputs were stored in a CSV file for subsequent analysis.
