Evaluating Spatial Patterns and Drivers of Cultural Ecosystem Service Supply-Demand Mismatches in Mountain Tourism Areas: Evidence from Hunan Province, China
Abstract
1. Introduction
2. Materials and Methods
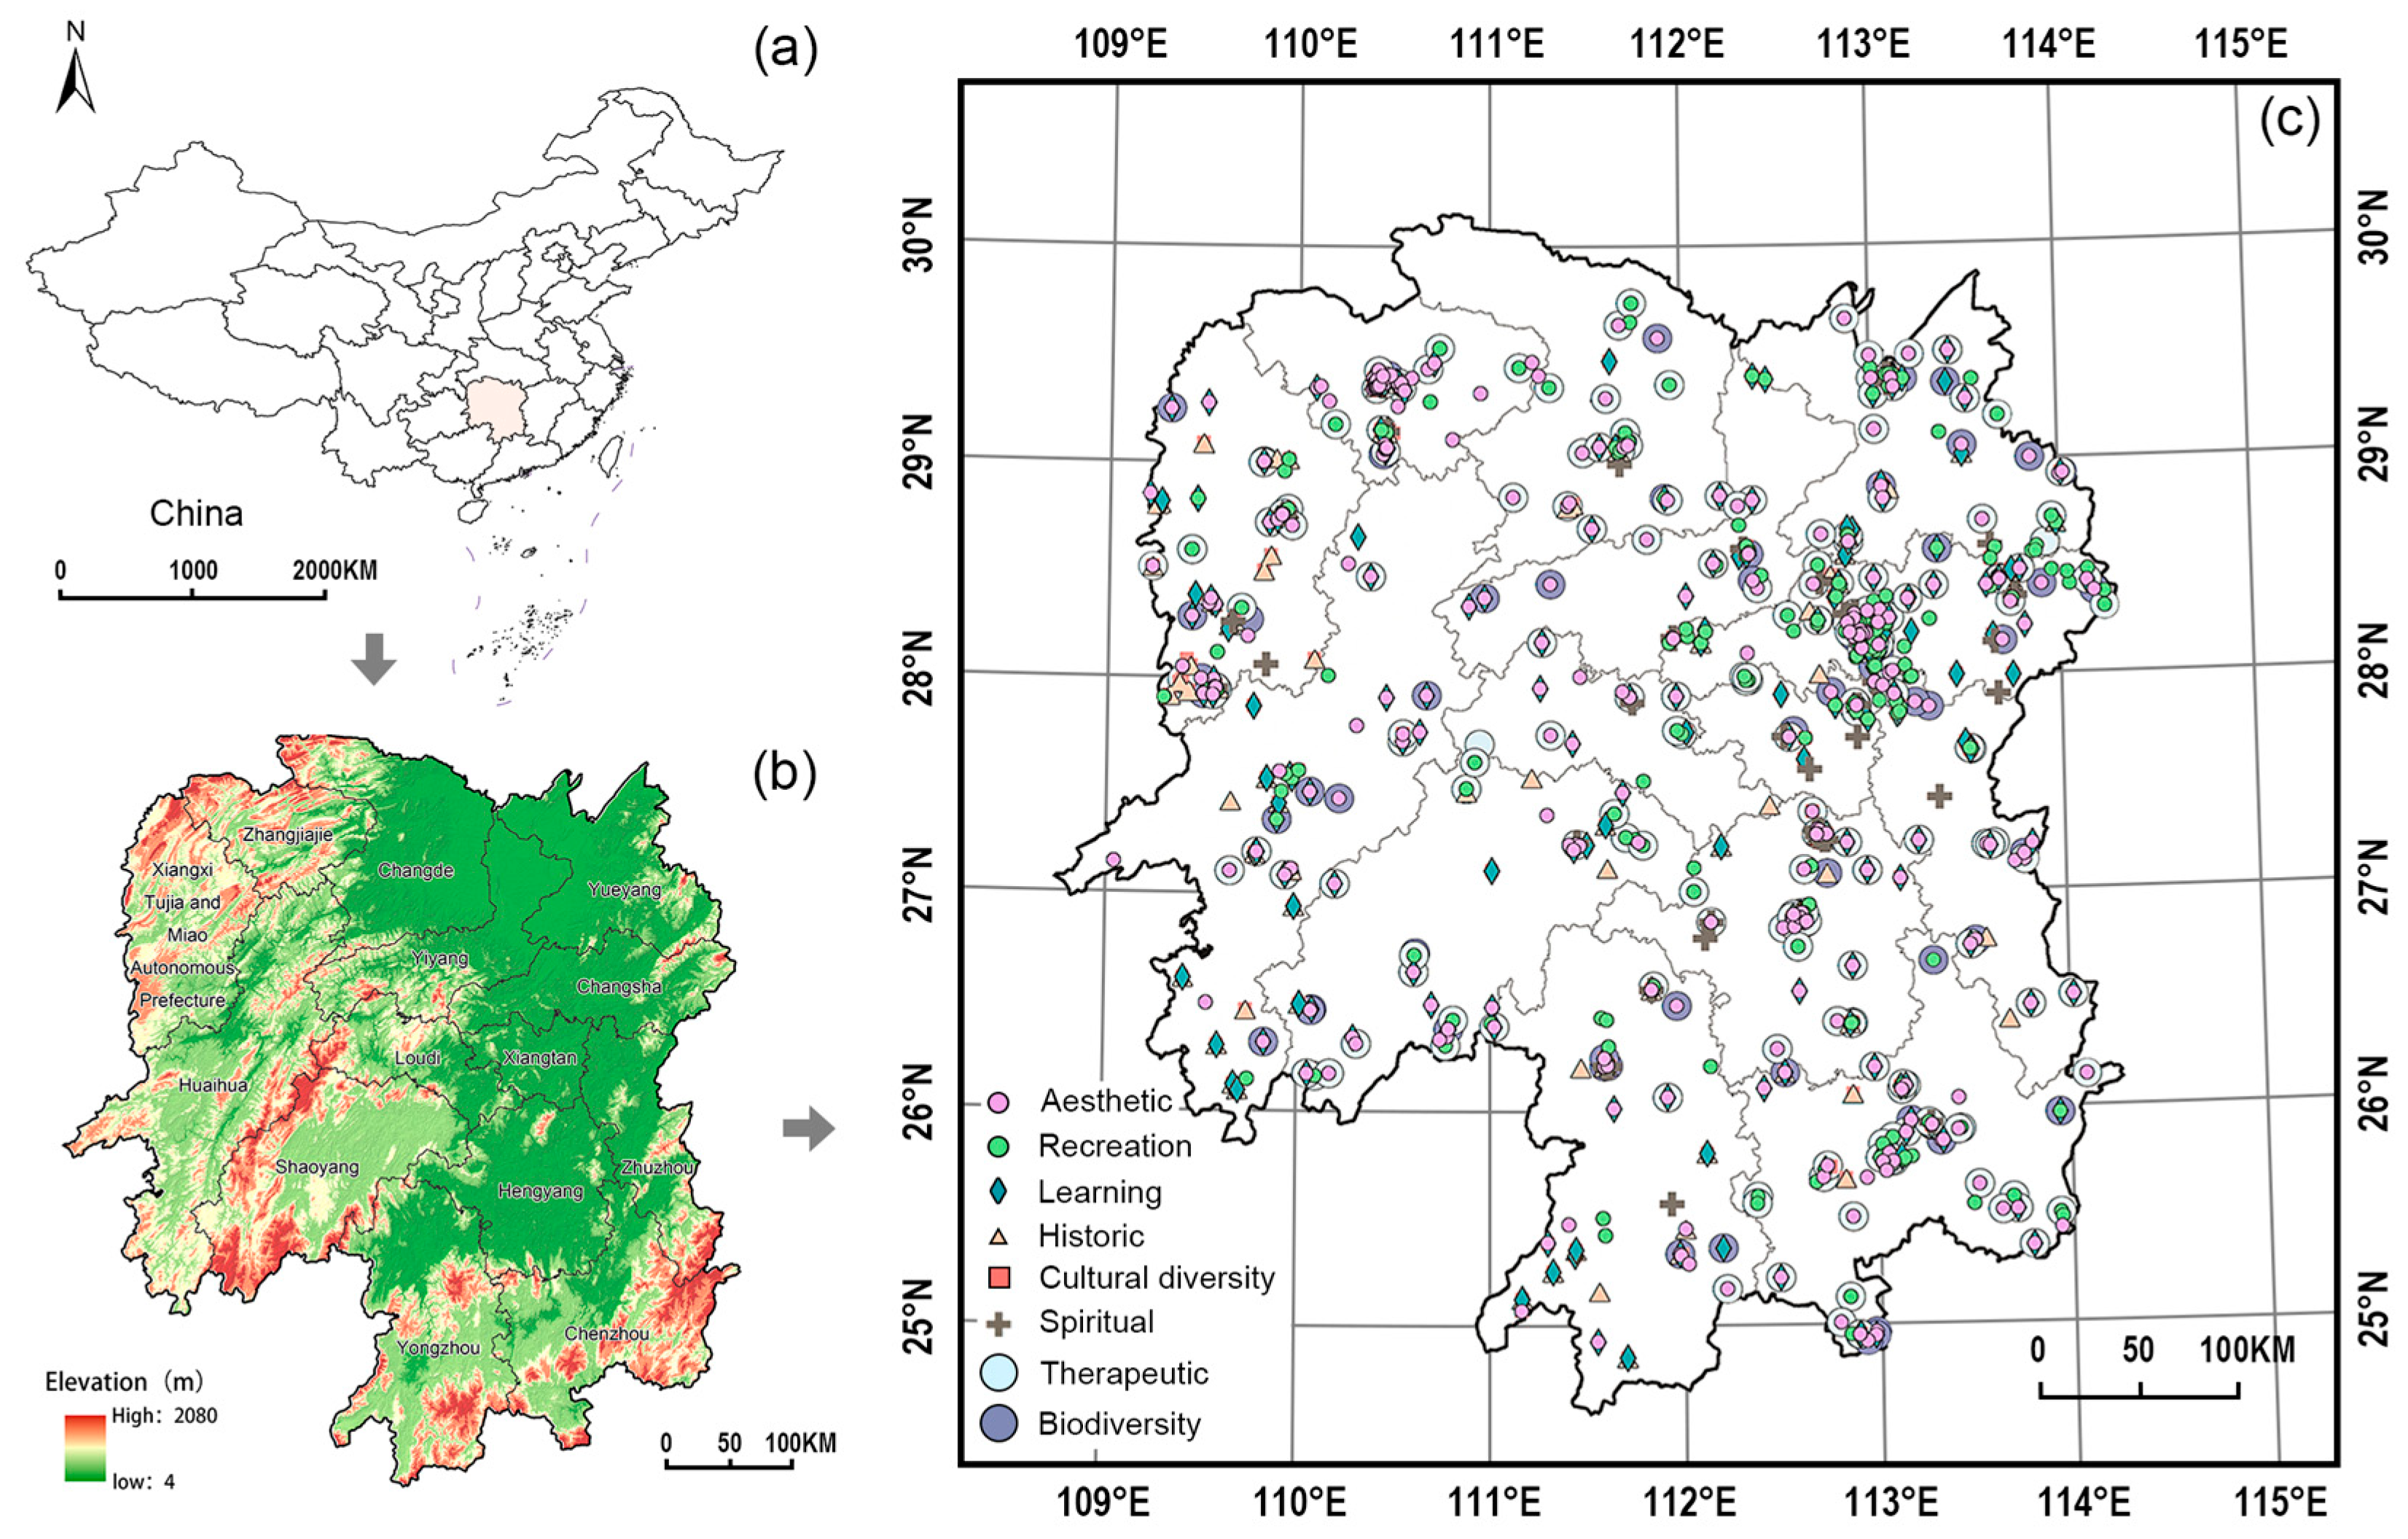
2.1. Study Area Overview
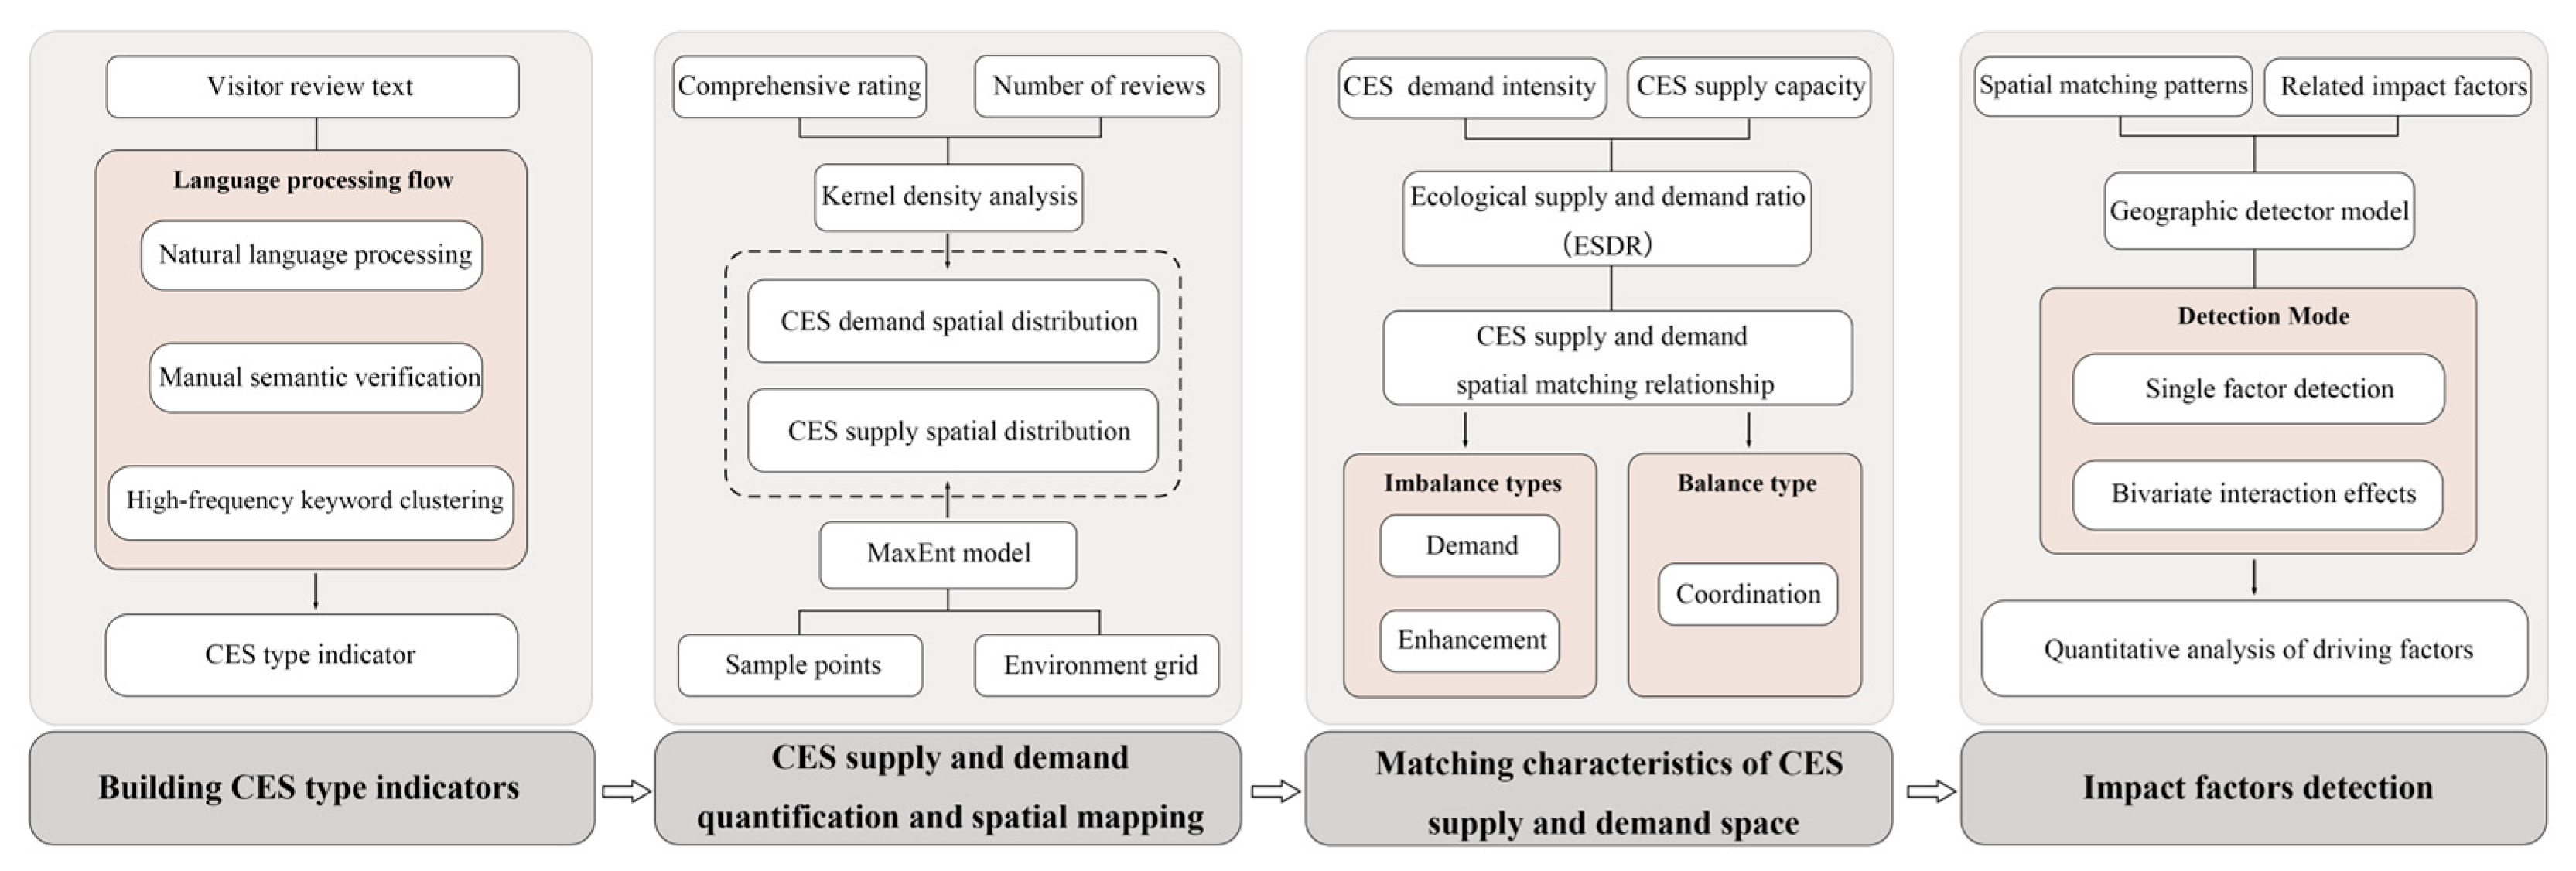
2.2. Overall Research Framework
2.3. Data Collection and Processing
2.3.1. Attraction Data
2.3.2. User Review Data
2.3.3. Environmental Variables
2.4. Analytical Methods
2.4.1. Construction of the CES Classification Framework
2.4.2. Quantification and Spatial Mapping of CES Demand
2.4.3. Quantification and Spatial Mapping of CES Supply
2.4.4. Analysis of CES Supply and Demand Alignment
2.4.5. Analysis of Factors Influencing Supply-Demand Matching
3. Results
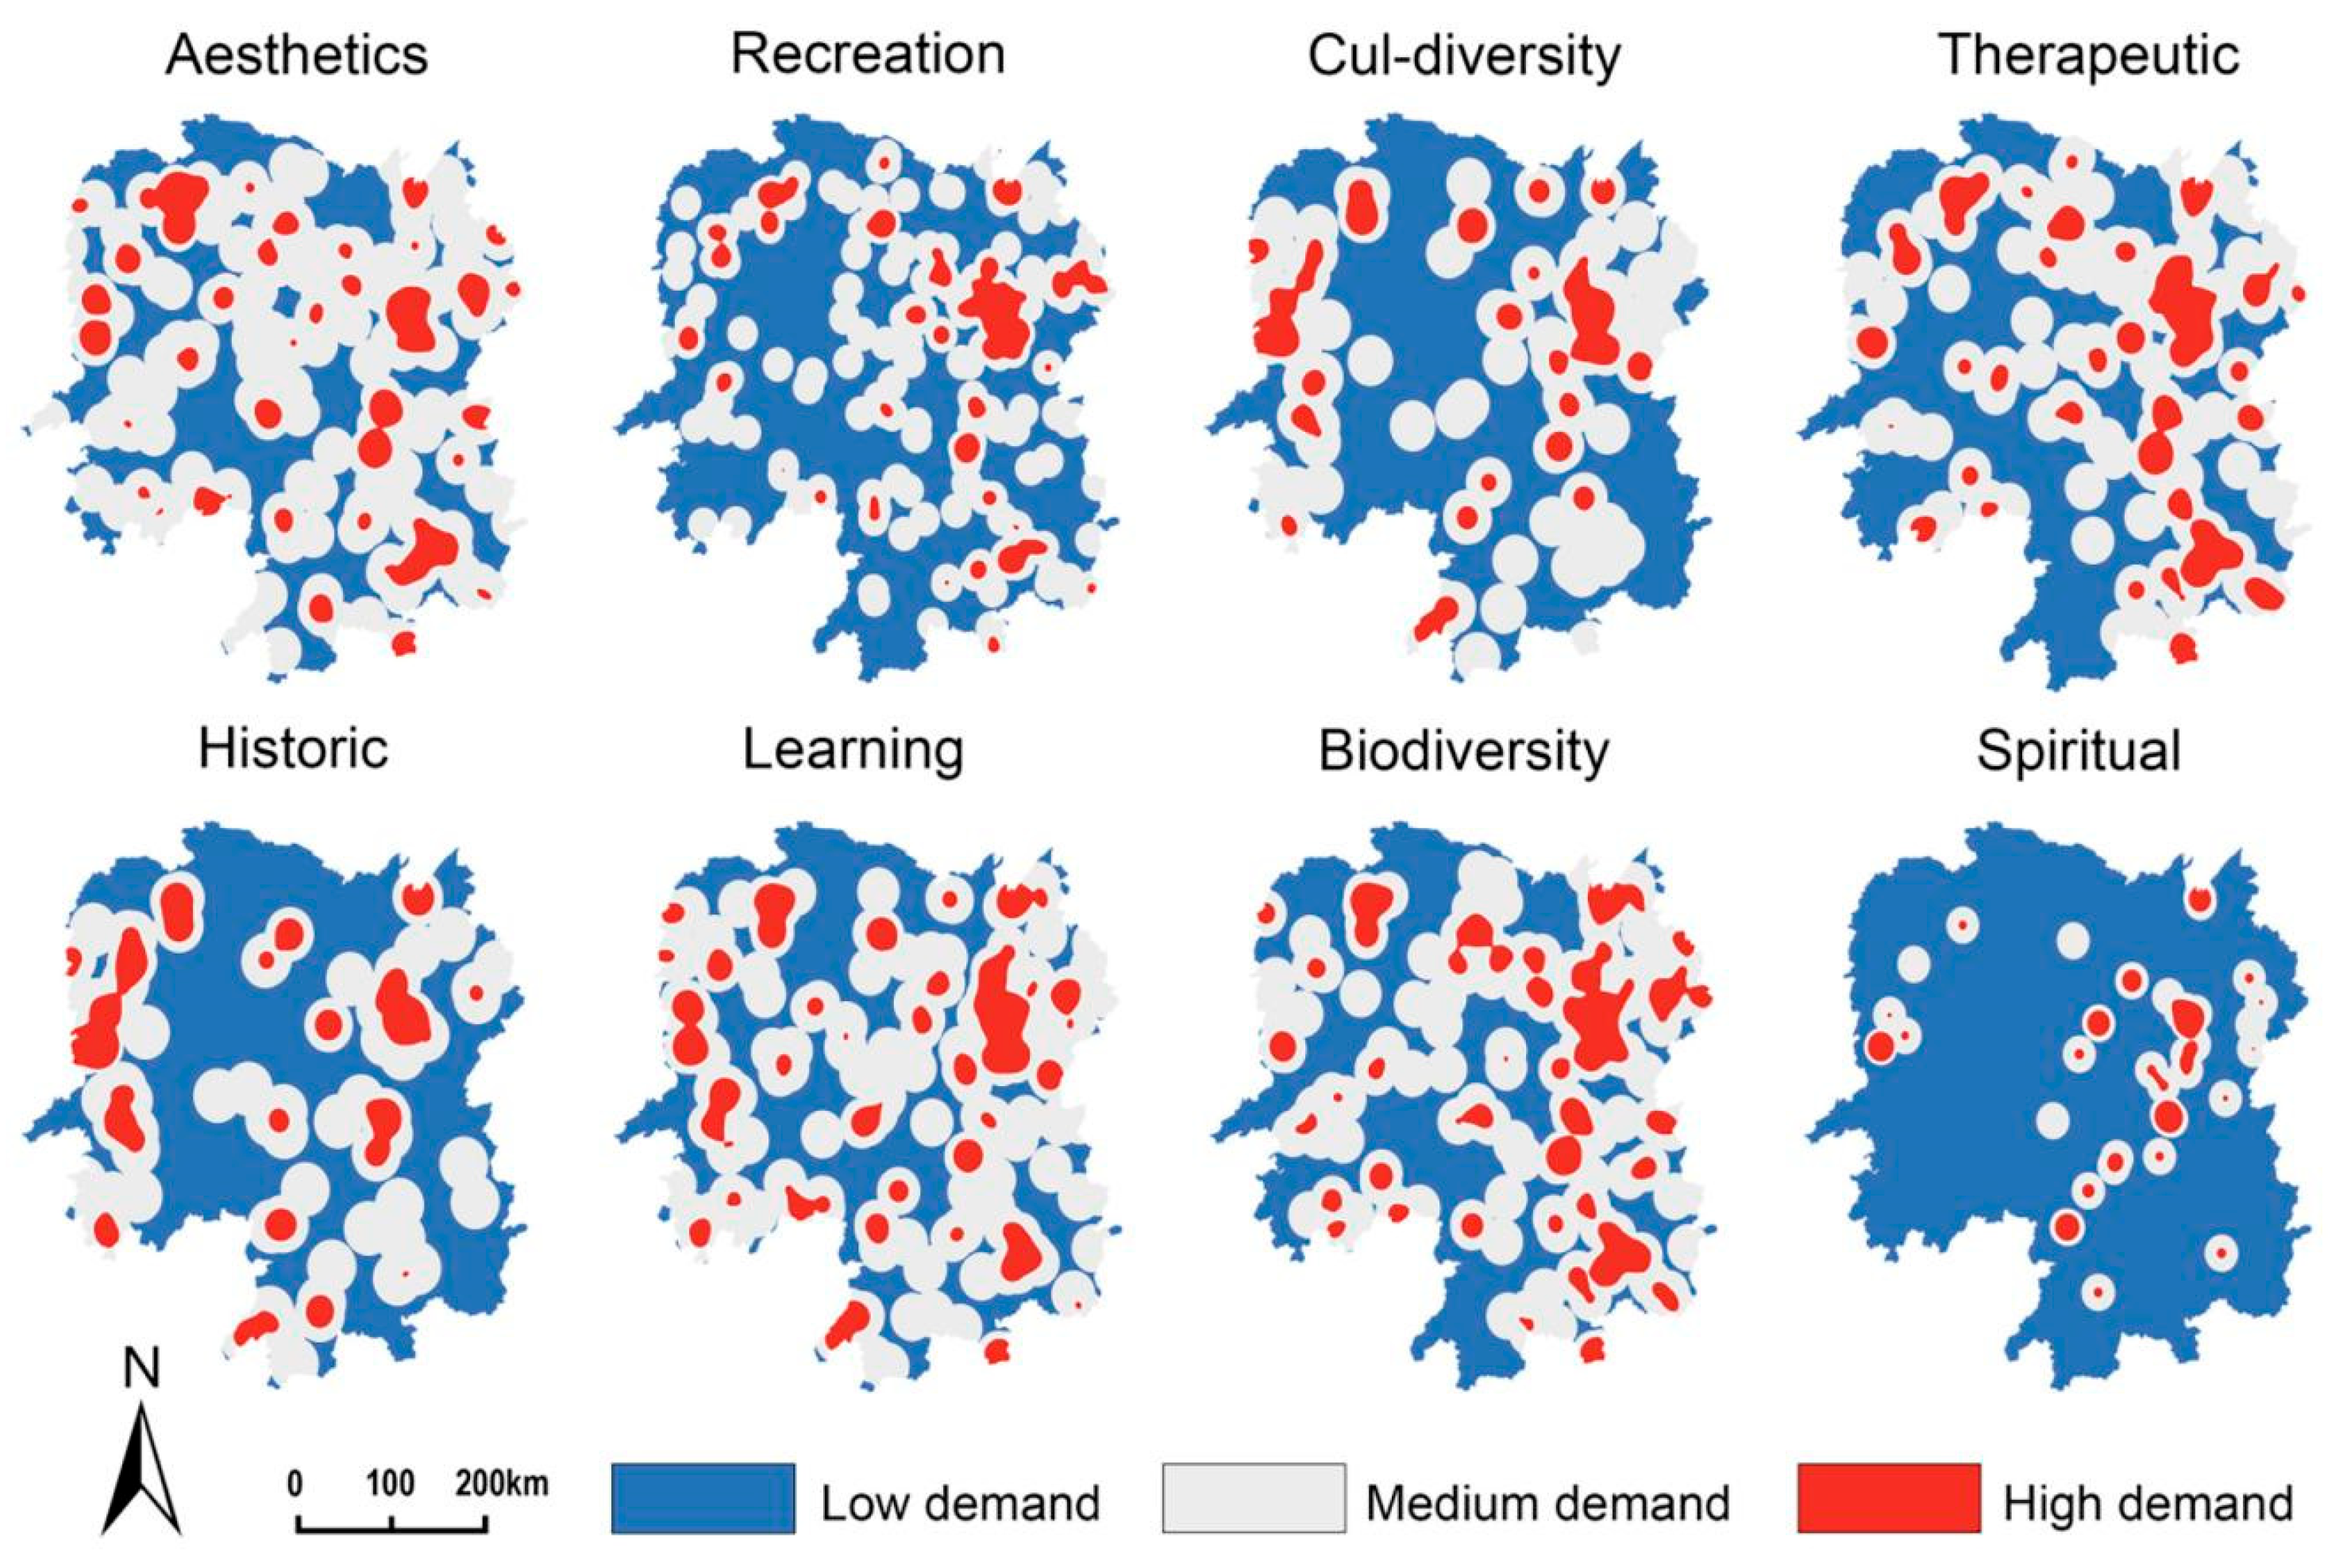
3.1. Spatial Patterns of CES Demand
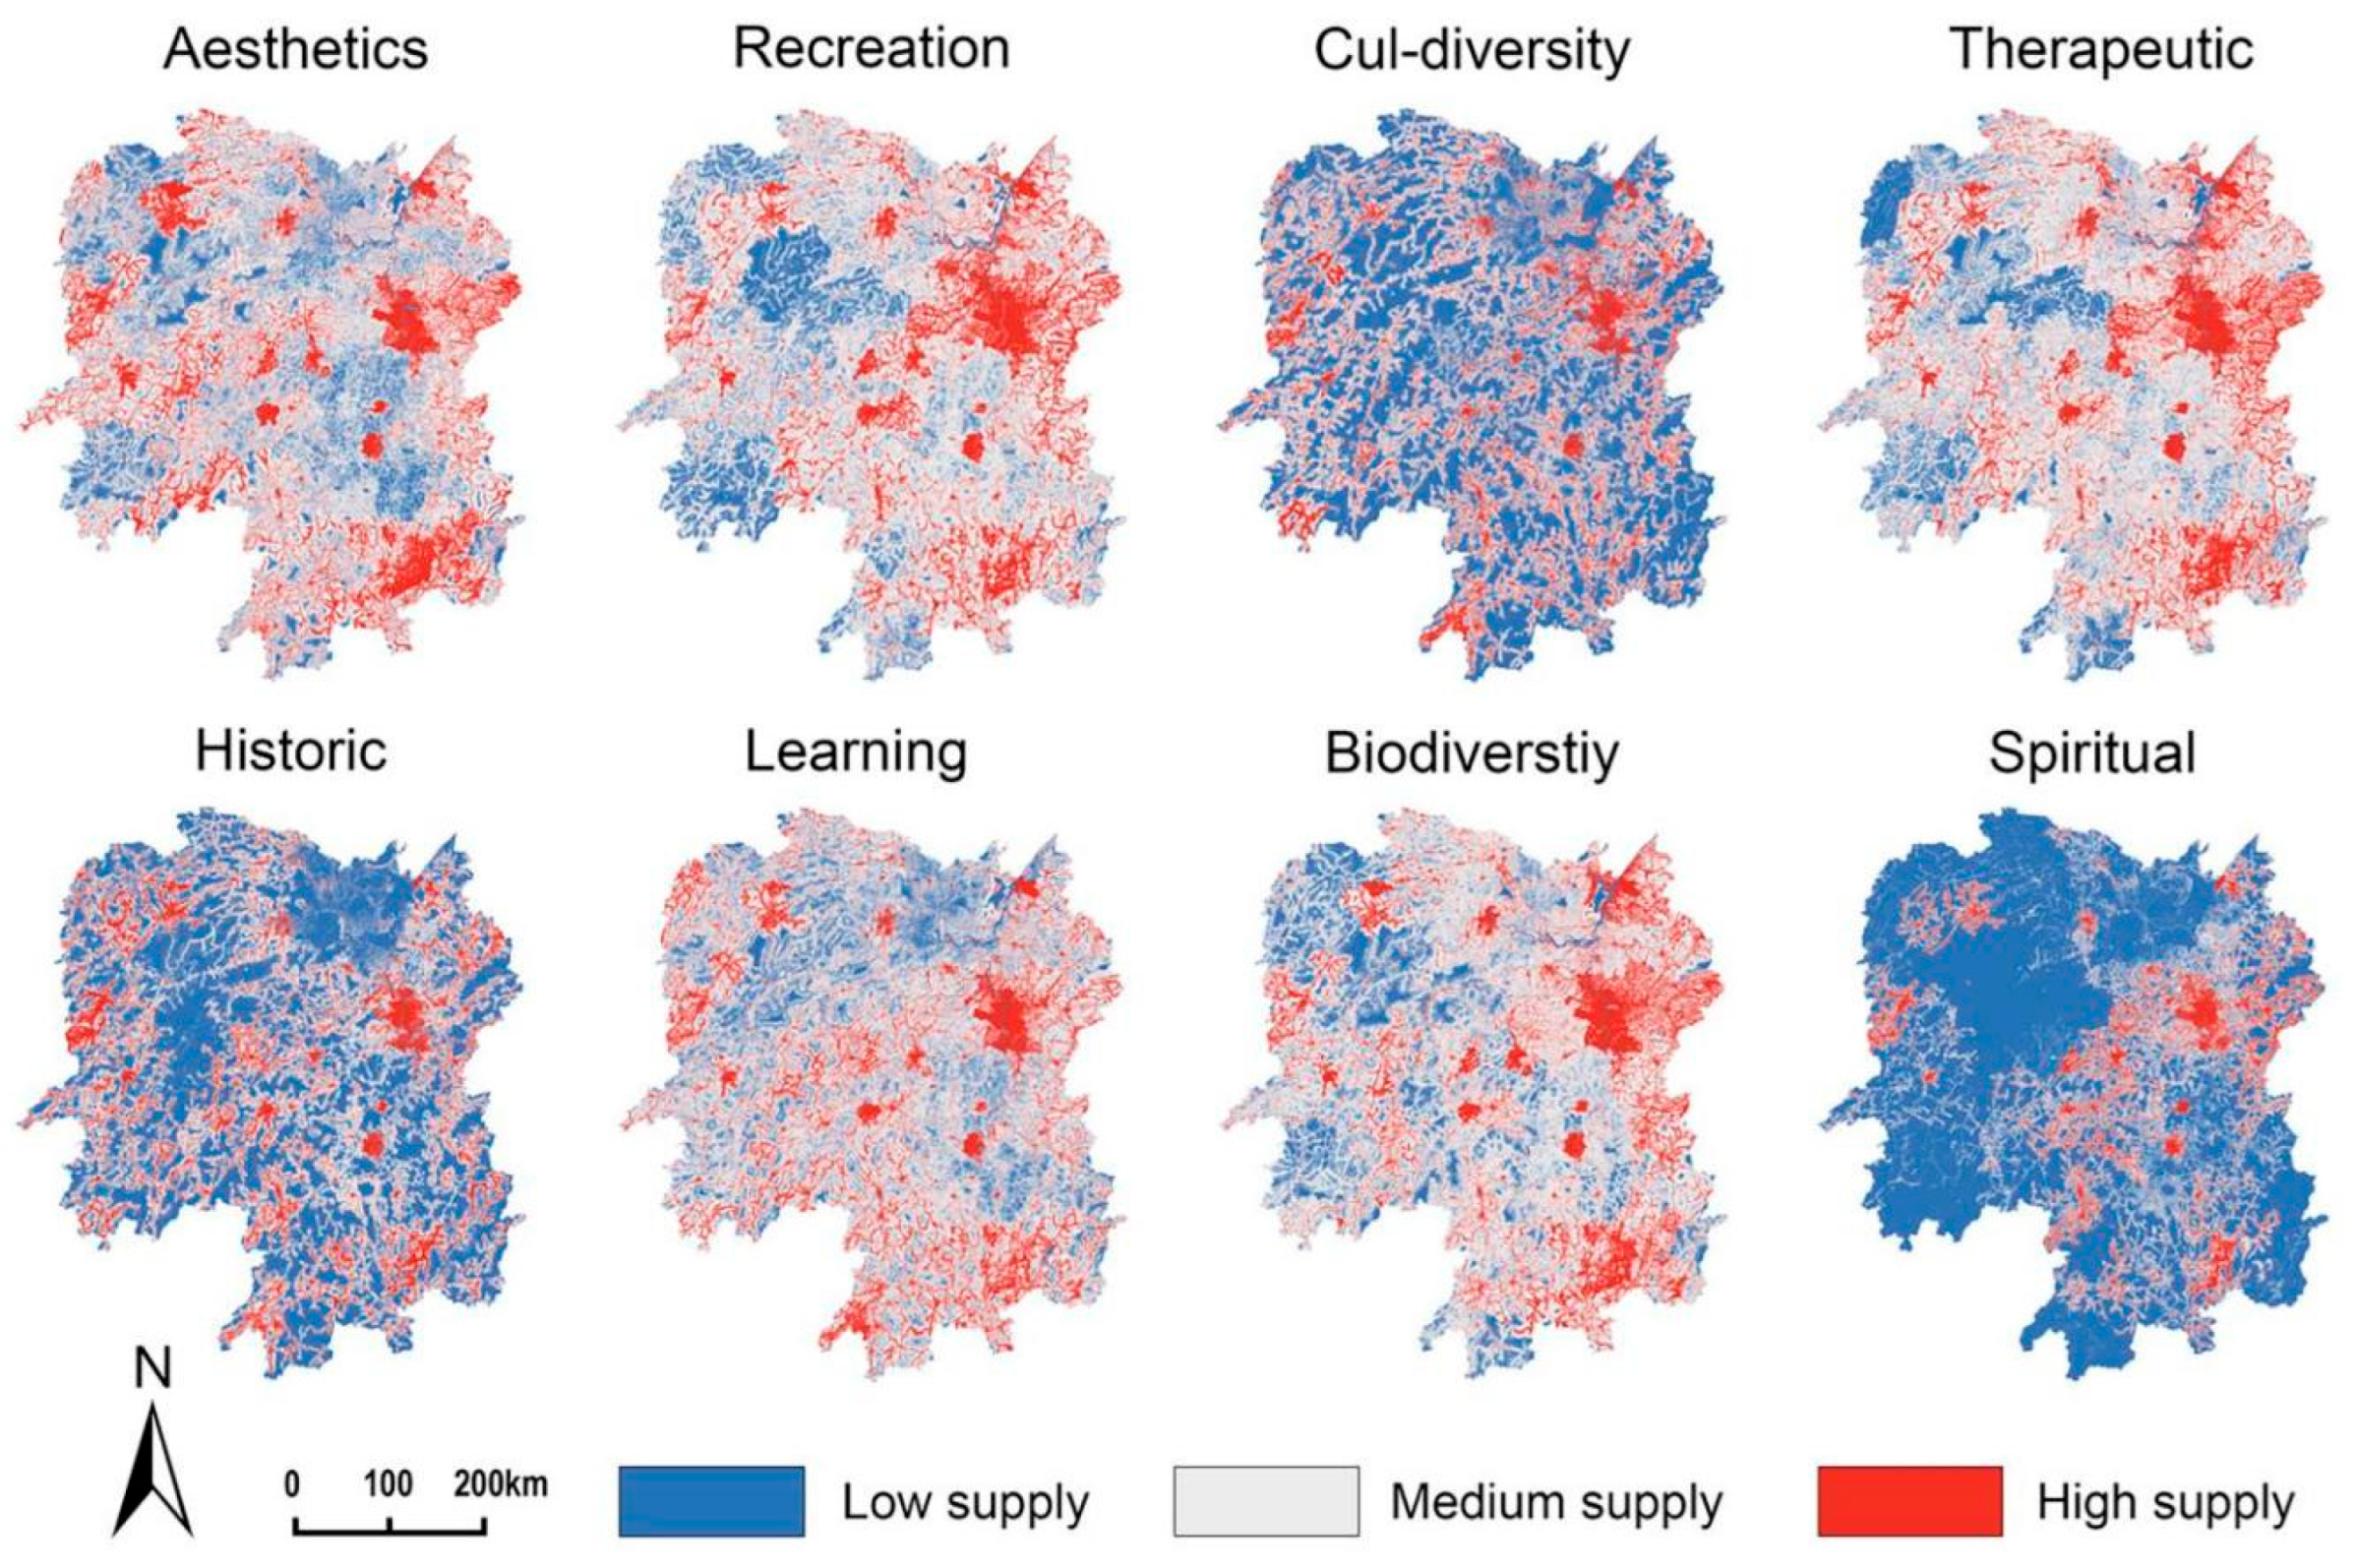
3.2. Spatial Patterns of CES Supply
3.3. Spatial Patterns of CES Supply and Demand
3.3.1. Demand Zones
3.3.2. Coordination Zones
3.3.3. Enhancement Zones
3.4. Detection of Driving Factors Influencing CES Supply-Demand Matching
3.4.1. Single-Factor Analysis
3.4.2. Interactions Among Driving Factors
4. Discussion
4.1. Regional-Scale Assessment of CES Supply and Demand
4.2. MaxEnt Model and Predictive Performance
4.3. Spatial Heterogeneity and Consistency Validation of CES Supply and Demand
4.4. Drivers of CES Supply and Demand Patterns
4.5. Implications for Planning Management
- (1)
- Optimize spatial layout and strengthen coordination. Given the significant spatial heterogeneity of high-value CES supply–demand areas, it is necessary to systematically identify the distribution and types of imbalanced regions, make rational use of transitional zones, and enhance spatial connectivity between high-supply and high-demand areas to achieve effective matching of tourism resources and regional synergy.
- (2)
- Enhance the supply capacity of demand-driven cultural service areas. By improving tourism infrastructure, diversifying products and routes, and advancing ecological restoration and environmental management, the growing demand from tourists can be effectively met.
- (3)
- Improve the value transformation efficiency of supply oriented cultural service areas. Through strategies such as digital promotion, collaborations with popular IPs, and improved transportation accessibility, the ecological and cultural advantages can be transformed into tourism attractiveness and economic benefits, thereby supporting the sustainable use of ecosystem services and the long-term development of the tourism industry.
4.6. Study Limitations and Future Research Directions
5. Conclusions
- (1)
- High-supply and -demand CES areas exhibit pronounced spatial heterogeneity. High-demand areas are characterized by a “multi-core, clustered” distribution centered on major scenic attractions, whereas high-supply areas predominantly cluster around urban hubs, water systems, and mountain ranges, extending outward along transportation corridors and river systems with a gradual decrease in intensity.
- (2)
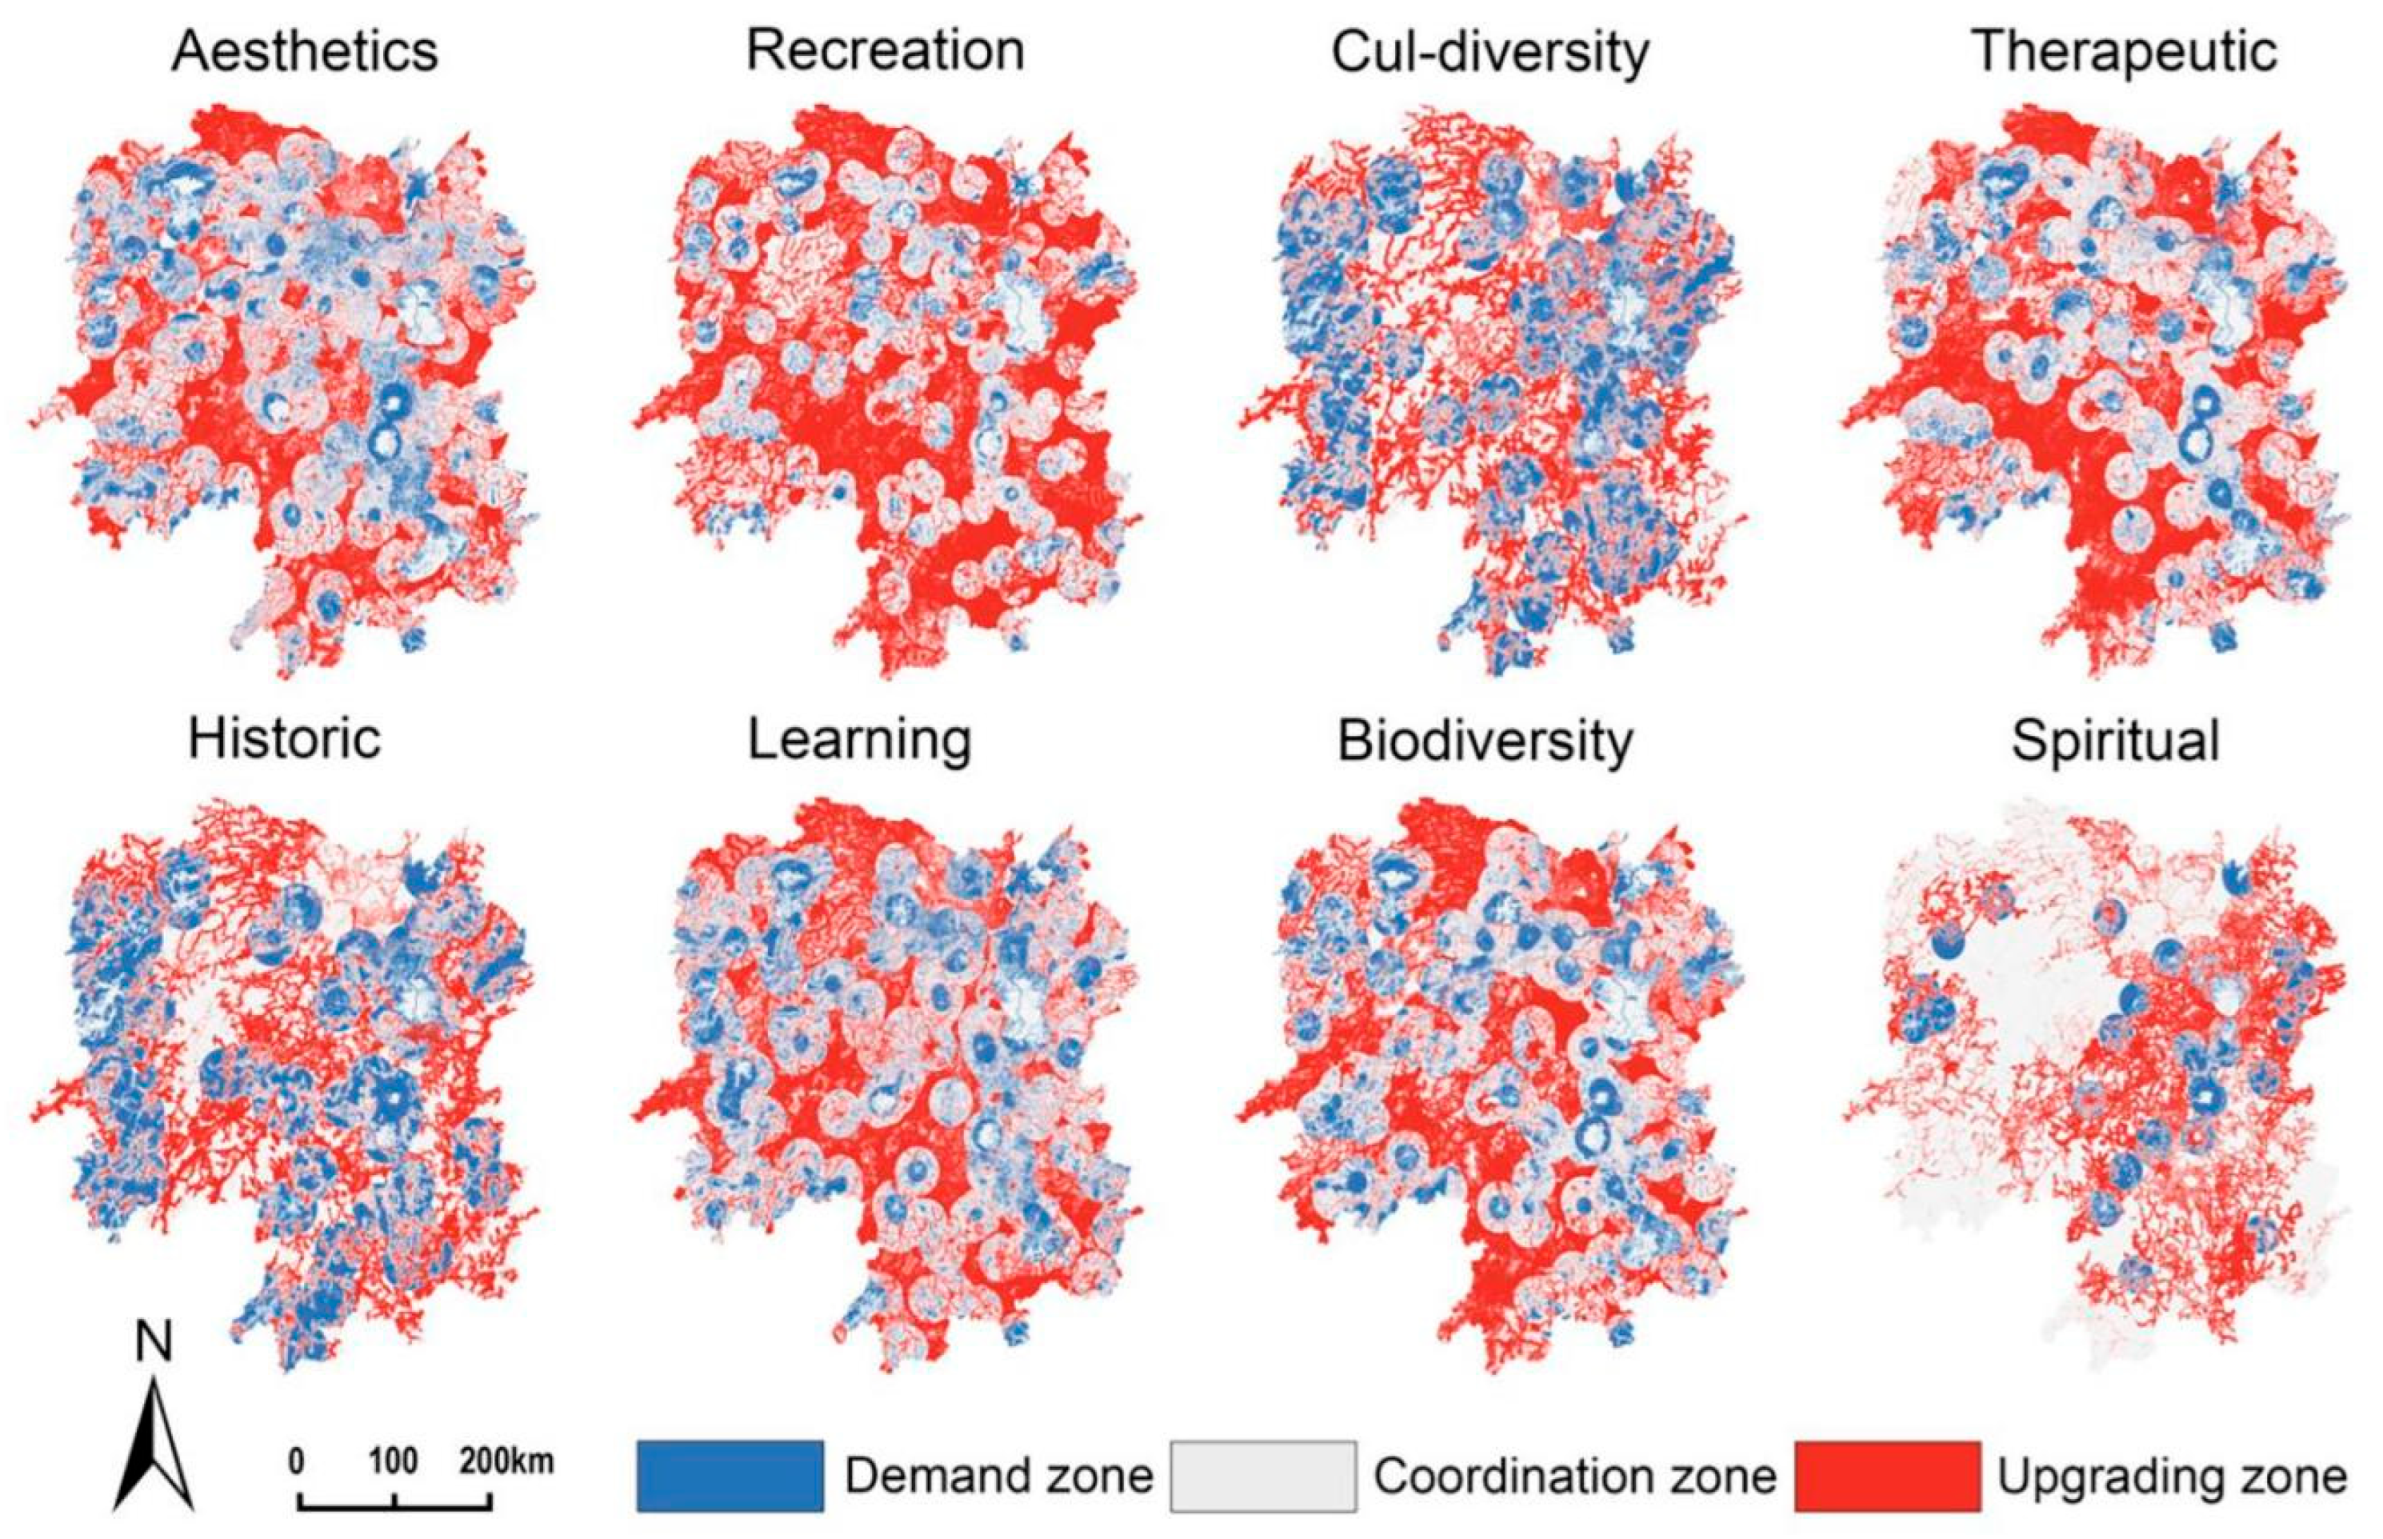
- According to the CES supply-demand pattern, Hunan Province can be classified into demand, coordination, and enhancement zones. Coordination zones dominate (45–70%), followed by demand zones (20–30%), while enhancement zones account for the smallest proportion (5–20%).
- (3)
- Urbanization intensity and land use patterns constitute the major drivers of CES supply-demand congruence, followed by vegetation cover, proximity to water, and population density.
- (4)
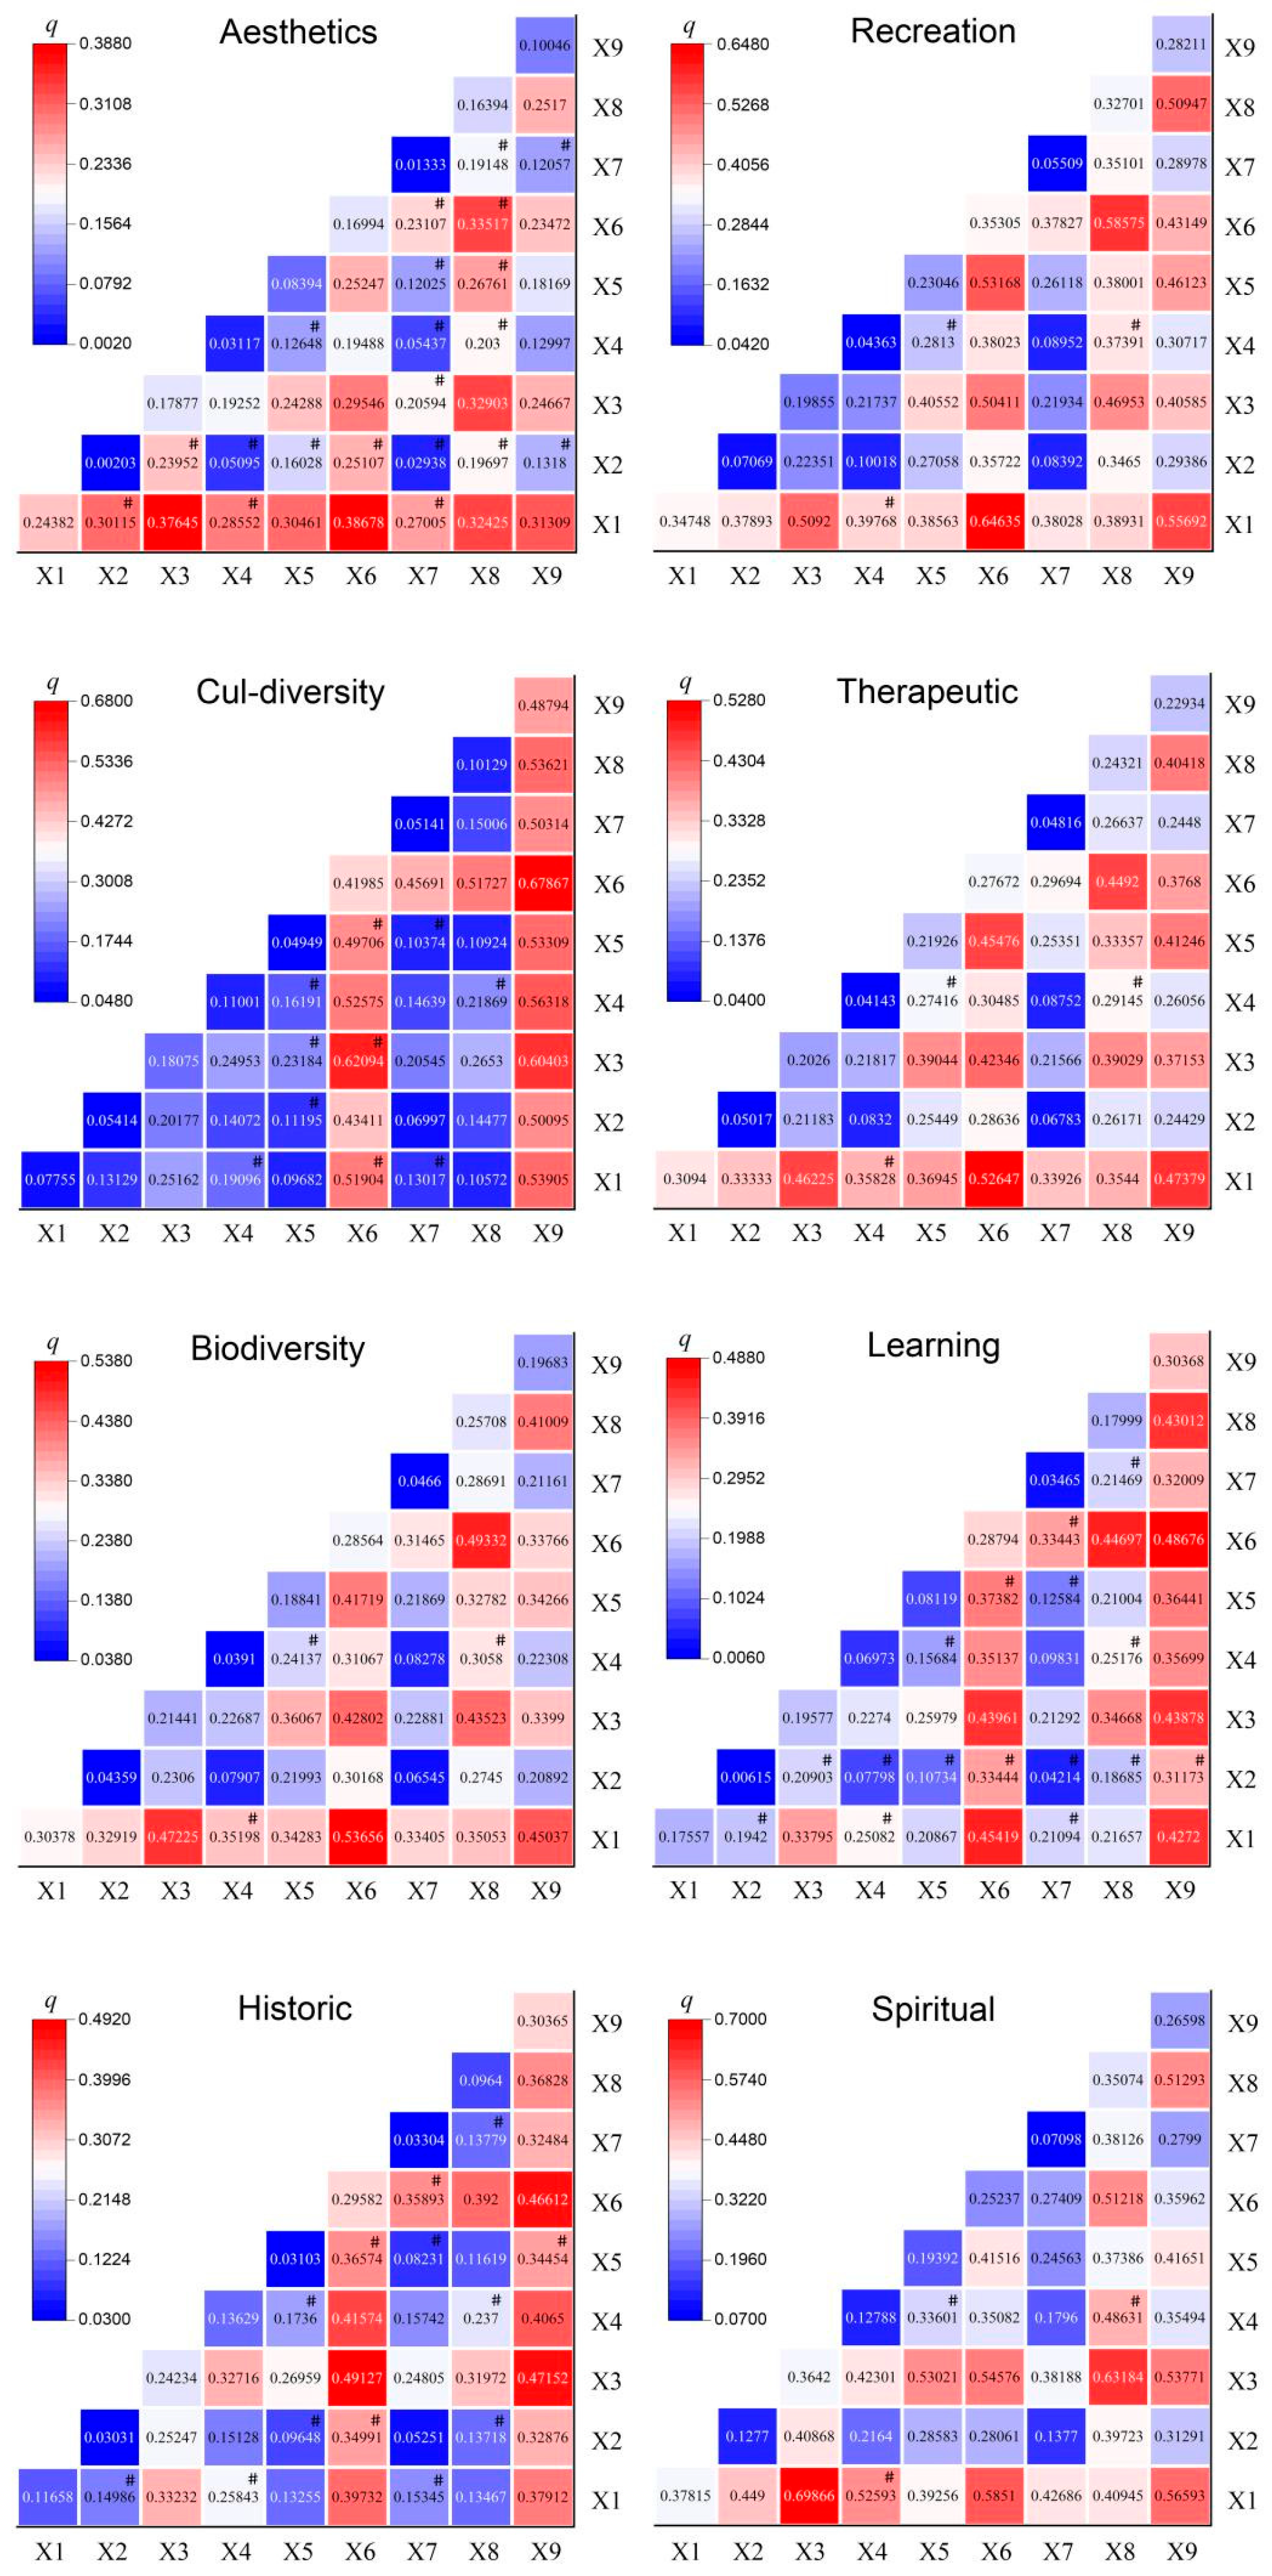
- The explanatory power of two-factor interactions exceeds that of individual factors across all eight CES categories, highlighting the critical role of synergistic multi-factor in shaping the spatial patterns of CES.
Author Contributions
Funding
Data Availability Statement
Conflicts of Interest
References
- Sarukhán, J.; Whyte, A. (Eds.) Ecosystems and Human Well-Being: Synthesis (Millennium Ecosystem Assessment); Island Press: Washington, DC, USA; World Resources Institute: Washington, DC, USA, 2005. [Google Scholar]
- Carpenter, S.R.; Mooney, H.A.; Agard, J.; Capistrano, D.; DeFries, R.S.; Díaz, S.; Dietz, T.; Duraiappah, A.K.; OtengYeboah, A.; Miguel, H.; et al. Science for managing ecosystem services: Beyond the Millennium Ecosystem Assessment. Proc. Natl. Acad. Sci. USA 2009, 106, 1305–1312. [Google Scholar] [CrossRef]
- Ingold, K.; Zimmermann, W. How and why forest managers adapt to socio-economic changes: A case study analysis in Swiss forest enterprises. For. Policy Econ. 2011, 13, 97–103. [Google Scholar] [CrossRef]
- Tribe, J. The Economics of Recreation, Leisure and Tourism; Routledge: Oxfordshire, UK, 2020. [Google Scholar]
- De Groot, R.S.; Alkemade, R.; Braat, L.; Hein, L.; Willemen, L. Challenges in integrating the concept of ecosystem services and values in landscape planning, management and decision making. Ecol. Complex. 2010, 7, 260–272. [Google Scholar] [CrossRef]
- Funsten, C.; Di Franco, C.; Borsellino, V.; Surano, N.; Asciuto, A.; Schimmenti, E. The recreational value of botanic garden events: A case study of the Zagara plant fair in Palermo, Italy. J. Outdoor Recreat. Tour. 2022, 39, 100565. [Google Scholar] [CrossRef]
- Lausi, L.; Amodio, M.; Sebastiani, A.; Fusaro, L.; Manes, F. Assessing cultural ecosystem services during the COVID-19 pandemic at the garden of ninfa (Italy). Ann. Di Bot. 2022, 12, 63–75. [Google Scholar]
- Tian, Y.; Wu, H.; Zhang, G.; Wang, L.; Zheng, D.; Li, S. Perceptions of ecosystem services, disservices and willingness-to-pay for urban green space conservation. J. Environ. Manag. 2020, 260, 110140. [Google Scholar] [CrossRef] [PubMed]
- Cheng, X.; Van Damme, S.; Li, L.; Uyttenhove, P. Evaluation of cultural ecosystem services: A review of methods. Ecosyst. Serv. 2019, 37, 100925. [Google Scholar] [CrossRef]
- Gai, S.; Fu, J.; Rong, X.; Dai, L. Users’ views on cultural ecosystem services of urban parks: An importance-performance analysis of a case in Beijing, China. Anthropocene 2022, 37, 100323. [Google Scholar] [CrossRef]
- Cui, F.; Tang, H.; Zhang, Q.; Wang, B.; Dai, L. Integrating ecosystem services supply and demand into optimized management at different scales: A case study in Hulunbuir, China. Ecosyst. Serv. 2019, 39, 100984. [Google Scholar] [CrossRef]
- Smart, L.S.; Vukomanovic, J.; Sills, E.O.; Sanchez, G. Cultural ecosystem services caught in a ‘coastal squeeze’ between sea level rise and urban expansion. Glob. Environ. Change 2021, 66, 102209. [Google Scholar] [CrossRef]
- Buchel, S.; Frantzeskaki, N. Citizens’ voice: A case study about perceived ecosystem services by urban park users in Rotterdam, the Netherlands. Ecosyst. Serv. 2015, 12, 169–177. [Google Scholar] [CrossRef]
- Costanza, R.; d’Arge, R.; de Groot, R.; Farber, S.; Grasso, M.; Hannon, B.; Limburg, K.; Naeem, S.; O’Neill, R.V.; Paruelo, J.; et al. The value of the world’s ecosystem services and natural capital. Nature 1997, 387, 253–260. [Google Scholar] [CrossRef]
- Vihervaara, P.; Kumpula, T.; Tanskanen, A.; Burkhard, B. Ecosystem services—A tool for sustainable management of human–environment systems. Case study Finnish Forest Lapland. Ecol. Complex. 2010, 7, 410–420. [Google Scholar] [CrossRef]
- Zhao, Y.; You, W.; Lin, X.; He, D. Assessing the supply and demand linkage of cultural ecosystem services in a typical county-level city with protected areas in China. Ecol. Indic. 2023, 147, 109992. [Google Scholar] [CrossRef]
- Gould, R.K.; Schultz, P. Challenges to understanding nonmaterial dimensions of human-nature connections, and how to address them. Ecol. Soc. 2021, 26, 14. [Google Scholar] [CrossRef]
- Bing, Z.; Qiu, Y.; Huang, H.; Chen, T.; Zhong, W.; Jiang, H. Spatial distribution of cultural ecosystem services demand and supply in urban and suburban areas: A case study from Shanghai, China. Ecol. Indic. 2021, 127, 107720. [Google Scholar] [CrossRef]
- Zhang, H.; Huang, R.; Zhang, Y.; Buhalis, D. Cultural ecosystem services evaluation using geolocated social media data: A review. Tour. Geogr. 2022, 24, 646–668. [Google Scholar] [CrossRef]
- Xiang, Z.; Magnini, V.P.; Fesenmaier, D.R. Information technology and consumer behavior intravel and tourism: Insights from travel planning using the internet. J. Retail. Consum. Serv. 2015, 22, 244–249. [Google Scholar] [CrossRef]
- Li, J.; Gao, J.; Zhang, Z.; Fu, J.; Shao, G.; Zhao, Z.; Yang, P. Insights into citizens’ experiences of cultural ecosystem services in urban green spaces based on social media analytics. Landsc. Urban Plan. 2024, 244, 104999. [Google Scholar] [CrossRef]
- Clemente, P.; Calvache, M.; Antunes, P.; Santos, R.; Cerdeira, J.O.; Martins, M.J. Combining social media photographs and species distribution models to map cultural ecosystem services: The case of a Natural Park in Portugal. Ecol. Indic. 2019, 96, 59–68. [Google Scholar] [CrossRef]
- Elith, J.; Phillips, S.J.; Hastie, T.; Dudík, M.; Chee, Y.E.; Yates, C.J. A statistical explanation of MaxEnt for ecologists. Divers. Distrib. 2011, 17, 43–57. [Google Scholar] [CrossRef]
- Chen, T.; Zhao, Y.; Yang, H.; Wang, G.; Mi, F. Recreational services from green space in Beijing: Where supply and demand meet? Forests 2021, 12, 1625. [Google Scholar] [CrossRef]
- Zeng, Y.; Low, B.W.; Yeo, D.C. Novel methods to select environmental variables in MaxEnt: A case study using invasive crayfish. Ecol. Model. 2016, 341, 5–13. [Google Scholar] [CrossRef]
- Arslan, E.S.; Örücü, Ö.K. MaxEnt modelling of the potential distribution areas of cultural ecosystem services using social media data and GIS. Environ. Dev. Sustain. 2021, 23, 2655–2667. [Google Scholar] [CrossRef]
- Shi, Q.; Chen, H.; Liang, X.; Liu, D.; Geng, T.; Zhang, H. Combination of participatory mapping and Maxent model to visualize the cultural ecosystem services at county scale. Ecosyst. Serv. 2025, 72, 101710. [Google Scholar] [CrossRef]
- He, S.; Su, Y.; Shahtahmassebi, A.R.; Huang, L.Y.; Zhou, M.M.; Gan, M.Y.; Deng, J.S.; Zhao, G.; Wang, K. Assessing and mapping cultural ecosystem services supply, demand and flow of farmlands in the Hangzhoumetropolitan area, China. Sci. Total Environ. 2019, 692, 756–768. [Google Scholar] [CrossRef]
- Yang, L.; Cao, K. Cultural ecosystem services research progress and future prospects: A review. Sustainability 2022, 14, 11845. [Google Scholar] [CrossRef]
- He, W.; Wang, H.M.; Liu, G.; Bai, Y.; Xue, S.; Fang, Z.; Xiao, Y.; Wang, Y.X.; Wang, W.Q. Can ecosystem services supply match local residents’ perception: Linking macro-ESs and micro-individual perceptions in the Yellow River Basin. J. Environ. Manag. 2025, 374, 124116. [Google Scholar] [CrossRef]
- Shams, A. Tourism flow and the consumption of aesthetic landscape values in high-elevation mountain areas in the Alps: A cartographic and spatio-market methodology. J. Outdoor Recreat. Tour. 2025, 51, 100911. [Google Scholar] [CrossRef]
- Zhao, Y.; Zhou, R.; Yu, Q.; Zhao, L. Revealing the contribution of mountain ecosystem services research to sustainable development goals: A systematic and grounded theory driven review. J. Environ. Manag. 2025, 373, 123452. [Google Scholar] [CrossRef]
- Zelenka, J.; Azubuike, T.; Pásková, M. Trust model for online reviews of tourism services and evaluation of destinations. Adm. Sci. 2021, 11, 34. [Google Scholar] [CrossRef]
- Millenium Ecosystem Assessment. Ecosystems and Human Well-Being: Our Human Planet; Island Press: Washington, DC, USA, 2005. [Google Scholar]
- Zhang, J.; He, C.; Huang, Q.; Li, J.; Qi, T. Evaluating the supply and demand of cultural ecosystem services in the Tibetan Plateau of China. Landsc. Ecol. 2022, 37, 2131–2148. [Google Scholar] [CrossRef]
- Huang, W.; Lu, S.; Guo, Y. Measuring the perceived heterogeneity of cultural ecosystem services in national cultural parks: Evidence from China. Sustainability 2023, 15, 9428. [Google Scholar] [CrossRef]
- Phillips, S.J.; Dudík, M. Modeling of species distributions with Maxent: New extensions and a comprehensive evaluation. Ecography 2008, 31, 161–175. [Google Scholar] [CrossRef]
- Radosavljevic, A.; Anderson, R.P. Making better Maxent models of species distributions: Complexity, overfitting and evaluation. J. Biogeogr. 2014, 41, 629–643. [Google Scholar] [CrossRef]
- Li, J.H.; Jiang, H.W.; Bai, Y.; Alatalo, J.M.; Li, X.; Jiang, H.W.; Liu, G.; Xu, J. Indicators for spatial–temporal comparisons of ecosystem service status between regions: A case study of the Taihu River Basin, China. Ecol. Indic. 2016, 60, 1008–1016. [Google Scholar] [CrossRef]
- Song, Y.; Wang, J.; Ge, Y.; Xu, C. An optimal parameters-based geographical detector model enhances geographic characteristics of explanatory variables for spatial heterogeneity analysis: Cases with different types of spatial data. GISci. Remote Sens. 2020, 57, 593–610. [Google Scholar] [CrossRef]
- Lissovsky, A.A.; Dudov, S.V.; Obolenskaya, E.V. Species-distribution modeling: Advantages and limitations of its application. 1. General approaches. Biol. Bull. Rev. 2021, 11, 254–264. [Google Scholar] [CrossRef]
- Vrbičanová, G.; Kaisová, D.; Močko, M.; Petrovič, F.; Mederly, P. Mapping cultural ecosystem services enables better informed nature protection and landscape management. Sustainability 2020, 12, 2138. [Google Scholar] [CrossRef]
- Alvarez-Codoceo, S.; Cerda, C.; Perez-Quezada, J.F. Mapping the provision of cultural ecosystem services in large cities: The case of The Andean piedmont in Santiago, Chile. Urban For. Urban Green. 2021, 66, 127390. [Google Scholar] [CrossRef]
- Li, L.; Bai, Y.; Yuan, X.; Li, F. Assessing the Supply–Demand Matching and Spatial Flow of Urban Cultural Ecosystem Services: Based on Geospatial Data and User Interaction Data. Land 2025, 14, 773. [Google Scholar] [CrossRef]
- Herrero-Jáuregui, C.; Arnaiz-Schmitz, C.; Herrera, L.; Smart, S.M.; Montes, C.; Pineda, F.D.; Schmitz, M.F. Aligning landscape structure with ecosystem services along an urban–rural gradient. Trade-offs and transitions towards cultural services. Landsc. Ecol. 2019, 34, 1525–1545. [Google Scholar] [CrossRef]
- Isbell, F.; Calcagno, V.; Hector, A.; Connolly, J.; Harpole, W.S.; Reich, P.B.; Scherer-Lorenzen, M.; Schmid, B.; Tilman, D.; van Ruijven, J.; et al. High plant diversity is needed to maintain ecosystem services. Nature 2011, 477, 199–202. [Google Scholar] [CrossRef] [PubMed]
- Li, C.; Liang, Q.; Lin, B.; Zhai, J. Landscape management and planning as a spatial organization method connecting CES supply-demand assessment and sustainable tourism development. J. Outdoor Recreat. Tour. 2023, 44, 100705. [Google Scholar] [CrossRef]

| Type | Classification | Name | Description | Source |
|---|---|---|---|---|
| Attraction data | Attraction name | - | Specific name of the attraction | Ctrip online platform (https://you.ctrip.com/) |
| Geographical coordinates of attractions | - | Geographical location of the attraction | Baidu coordinate picker | |
| User evaluation related data | Comment text data | - | User-written description of the attraction | Ctrip online platform (https://you.ctrip.com/) |
| Number of comments | - | Total number of user comments | ||
| Rating data | - | Comprehensive rating of attractions by users | ||
| MaxEnt environment raster data | Natural environmental factors | ELEV | Digital Elevation Model (DEM) | Geospatial Data Cloud (https://www.gscloud.cn/) |
| SLO | Slope | Calculation based on DEM | ||
| NDVI | Normalized difference vegetation index | Zenodo open-access repository (https://zenodo.org/) | ||
| LUCC | Land use/cover classification | GeoVIS Earth Developer Platform (https://open.geovisearth.com/) | ||
| Spatial accessibility factors | DTW | Distance to water bodies | Calculation based on road network and water body data from OpenStreetMap (https://www.openstreetmap.org/) | |
| DTR | Distance to transportation routes | |||
| Socioeconomic factors | PD | Population density | Hunan Statistical Yearbook 2023 (https://tjj.hunan.gov.cn/gnxlm/wzjj/) (acessed on 20 June 2024) | |
| GDP | Per capital gross domestic product | |||
| UI | Urbanization intensity |
| CES-Type | Regional Attributes | Tourist Comment Keywords | Attractions (n, %) |
|---|---|---|---|
| Esthetics | Areas offering esthetic satisfaction and mental enjoyment | lakes, rivers, streams, waterfalls, bays, islands, mountains, ridges, flower fields, etc. | 334 (18.27%) |
| Recreation | Offer venues and environments for relaxation and leisure activities | wandering, taking photos, camping, rowing, angling, drifting, skiing, etc. | 363 (19.86%) |
| Cultural diversity | Regions providing cultural or traditional folk experiences | historic towns, traditional hamlets, festivals, museums, arts, local customs, folklore, etc. | 189 (10.34%) |
| Therapeutic | Areas enabling people to engage with nature for therapeutic benefits to body and mind | exercise, hiking, cycling, running, field sketching, hot springs, oxygen bars, summer retreats, vacations, etc. | 229 (12.53%) |
| Biodiversity | Regions that support species habitation and reproduction | wetlands, conservation areas, flora, zoological parks, endangered species, etc. | 237 (12.96%) |
| Learning | Venues offering education, research, and experiential learning opportunities | Karst caves, peculiar rocks, exploration, scientific observation, cognition, revolutionary culture, etc. | 262 (14.33%) |
| Historic | Areas that hold natural and cultural heritage of significant historical value | pavilions, steles, terraces, towers, pagodas, relics, ruins, stone carvings, totems, rock paintings, former residences, etc. | 147 (8.04%) |
| Spiritual | Regions that provide religious faith and spiritual solace for people | temples, shrines, pagodas, filial piety, Buddhist worship, prayer, religion, etc. | 67 (3.67%) |
| Types of Cultural Ecosystem Service | Standard Deviation | Area Under the Curve (AUC) Value of the Training | Area Under the Curve (AUC) Value of the Testing |
|---|---|---|---|
| Esthetics | 0.02 | 0.89 | 0.88 |
| Recreation | 0.01 | 0.92 | 0.92 |
| Cultural diversity | 0.03 | 0.93 | 0.90 |
| Therapeutic | 0.02 | 0.90 | 0.89 |
| Biodiversity | 0.02 | 0.91 | 0.90 |
| Learning | 0.02 | 0.91 | 0.89 |
| Historic | 0.02 | 0.92 | 0.93 |
| Spiritual | 0.01 | 0.92 | 0.94 |
| Types of Cultural Ecosystem Service | Supply—Demand | ||||||||
|---|---|---|---|---|---|---|---|---|---|
| Supply Is Less than Demand | Balance | Supply Exceeds Demand | |||||||
| Low- Mid | Low- High | Mid- High | Low- Low | Mid- Mid | High- High | Mid- Low | High- Low | High- Mid | |
| Esthetics | 13.92 | 1.09 | 4.12 | 2.25 | 36.61 | 11.88 | 15.24 | 2.69 | 12.20 |
| Recreation | 4.58 | 0.07 | 2.03 | 5.47 | 26.72 | 11.59 | 31.48 | 4.58 | 13.49 |
| Cul-diversity | 14.96 | 1.13 | 5.22 | 23.44 | 27.34 | 2.12 | 24.38 | 0.29 | 1.13 |
| Therapeutic | 1.86 | 0.09 | 7.20 | 6.64 | 42.84 | 4.29 | 31.26 | 1.43 | 4.38 |
| Biodiversity | 4.29 | 0.18 | 8.30 | 4.76 | 43.45 | 4.81 | 29.17 | 0.75 | 4.29 |
| Learning | 4.10 | 0.28 | 8.55 | 2.50 | 51.80 | 3.77 | 25.74 | 0.76 | 2.50 |
| Historic | 14.38 | 1.76 | 5.94 | 24.92 | 23.64 | 2.19 | 24.73 | 0.58 | 1.86 |
| Spiritual | 3.93 | 0.71 | 1.18 | 62.09 | 6.62 | 0.87 | 22.73 | 0.98 | 0.90 |
| Types of CES | Value | Influencing Factors | ||||||||
|---|---|---|---|---|---|---|---|---|---|---|
| UI | ELEV | DTR | DTW | GDP | NDVI | SLO | PD | LUCC | ||
| Esthetics | q | 0.24 | 0.01 | 0.18 | 0.03 | 0.08 | 0.17 | 0.01 | 0.16 | 0.10 |
| p | 0.00 | 0.02 | 0.00 | 0.00 | 0.00 | 0.00 | 0.00 | 0.00 | 0.00 | |
| Recreation | q | 0.35 | 0.07 | 0.20 | 0.04 | 0.23 | 0.35 | 0.06 | 0.33 | 0.28 |
| p | 0.00 | 0.00 | 0.00 | 0.00 | 0.00 | 0.00 | 0.00 | 0.00 | 0.00 | |
| Cultural diversity | q | 0.08 | 0.05 | 0.18 | 0.11 | 0.05 | 0.42 | 0.05 | 0.10 | 0.49 |
| p | 0.00 | 0.00 | 0.00 | 0.00 | 0.00 | 0.00 | 0.00 | 0.00 | 0.00 | |
| Therapeutic | q | 0.31 | 0.05 | 0.20 | 0.04 | 0.22 | 0.28 | 0.05 | 0.24 | 0.23 |
| p | 0.00 | 0.00 | 0.00 | 0.00 | 0.00 | 0.00 | 0.00 | 0.00 | 0.00 | |
| Biodiversity | q | 0.30 | 0.04 | 0.21 | 0.04 | 0.19 | 0.29 | 0.05 | 0.26 | 0.20 |
| p | 0.00 | 0.00 | 0.00 | 0.00 | 0.00 | 0.00 | 0.00 | 0.00 | 0.00 | |
| Learning | q | 0.18 | 0.01 | 0.20 | 0.07 | 0.08 | 0.29 | 0.03 | 0.18 | 0.30 |
| p | 0.00 | 0.00 | 0.00 | 0.00 | 0.00 | 0.00 | 0.00 | 0.00 | 0.00 | |
| Historic | q | 0.12 | 0.03 | 0.24 | 0.14 | 0.03 | 0.30 | 0.03 | 0.10 | 0.30 |
| p | 0.00 | 0.00 | 0.00 | 0.00 | 0.00 | 0.00 | 0.00 | 0.00 | 0.00 | |
| Spiritual | q | 0.38 | 0.13 | 0.36 | 0.13 | 0.19 | 0.25 | 0.07 | 0.35 | 0.27 |
| p | 0.00 | 0.00 | 0.00 | 0.00 | 0.00 | 0.00 | 0.00 | 0.00 | 0.00 | |
Disclaimer/Publisher’s Note: The statements, opinions and data contained in all publications are solely those of the individual author(s) and contributor(s) and not of MDPI and/or the editor(s). MDPI and/or the editor(s) disclaim responsibility for any injury to people or property resulting from any ideas, methods, instructions or products referred to in the content. |
© 2025 by the authors. Licensee MDPI, Basel, Switzerland. This article is an open access article distributed under the terms and conditions of the Creative Commons Attribution (CC BY) license (https://creativecommons.org/licenses/by/4.0/).
Share and Cite
Song, Z.; Liu, J.; Huang, Z. Evaluating Spatial Patterns and Drivers of Cultural Ecosystem Service Supply-Demand Mismatches in Mountain Tourism Areas: Evidence from Hunan Province, China. Sustainability 2025, 17, 9702. https://doi.org/10.3390/su17219702
Song Z, Liu J, Huang Z. Evaluating Spatial Patterns and Drivers of Cultural Ecosystem Service Supply-Demand Mismatches in Mountain Tourism Areas: Evidence from Hunan Province, China. Sustainability. 2025; 17(21):9702. https://doi.org/10.3390/su17219702
Chicago/Turabian StyleSong, Zhen, Jing Liu, and Zhihuan Huang. 2025. "Evaluating Spatial Patterns and Drivers of Cultural Ecosystem Service Supply-Demand Mismatches in Mountain Tourism Areas: Evidence from Hunan Province, China" Sustainability 17, no. 21: 9702. https://doi.org/10.3390/su17219702
APA StyleSong, Z., Liu, J., & Huang, Z. (2025). Evaluating Spatial Patterns and Drivers of Cultural Ecosystem Service Supply-Demand Mismatches in Mountain Tourism Areas: Evidence from Hunan Province, China. Sustainability, 17(21), 9702. https://doi.org/10.3390/su17219702


