Abstract
The swift advancement of renewable energy technology has highlighted the need for effective photovoltaic (PV) solar energy tracking systems. Deep learning (DL) has surfaced as a promising method to improve the precision and efficacy of photovoltaic (PV) solar tracking by utilising complicated patterns in meteorological and PV system data. This systematic literature review (SLR) seeks to offer a thorough examination of the progress in deep learning architectures for photovoltaic solar energy tracking over the last decade (2016–2025). The review was structured around four research questions (RQs) aimed at identifying prevalent deep learning architectures, datasets, performance metrics, and issues within the context of deep learning-based PV solar tracking systems. The present research utilised SLR methodology to analyse 64 high-quality publications from reputed academic databases like IEEE Xplore, Science Direct, Springer, and MDPI. The results indicated that deep learning architectures, including Convolutional Neural Networks (CNNs), Long Short-Term Memory (LSTM) networks, and Transformer-based models, are extensively employed to improve the accuracy and efficiency of photovoltaic solar tracking systems. Widely utilised datasets comprised meteorological data, photovoltaic system data, time series data, temperature data, and image data. Performance metrics, including Mean Absolute Error (MAE), Mean Squared Error (MSE), and Mean Absolute Percentage Error (MAPE), were employed to assess model efficacy. Identified significant challenges encompass inadequate data quality, restricted availability, high computing complexity, and issues in model generalisation. Future research should concentrate on enhancing data quality and accessibility, creating generalised models, minimising computational complexity, and integrating deep learning with real-time photovoltaic systems. Resolving these challenges would facilitate advancements in efficient, reliable, and sustainable photovoltaic solar tracking systems, hence promoting the wider adoption of renewable energy technology. This review emphasises the capability of deep learning to transform photovoltaic solar tracking and stresses the necessity for interdisciplinary collaboration to address current limitations.
1. Introduction
Photovoltaic (PV) solar energy tracking is an essential technology in contemporary renewable energy systems, aimed at optimizing the effectiveness of solar energy production by orienting solar panels in accordance with how the sun is positioned [1]. The principal objective of photovoltaic tracking systems is to enhance solar irradiance capture, thus enhancing energy output [2]. Conventional photovoltaic tracking techniques, including fixed-tilt systems and single-axis or dual-axis trackers, depend on mechanical components to modify the position of solar panels. Although these technologies have shown effectiveness in specific contexts, they encounter considerable issues, such as elevated maintenance expenses, mechanical degradation, and inadequate performance in variable atmospheric conditions [3,4]. For instance, sudden alterations in cloud cover or dust accumulation could decrease the efficiency of mechanical trackers, resulting in energy losses [5]. Moreover, conventional technologies frequently lack scalability for extensive photovoltaic installations, rendering them less appropriate for contemporary grid-connected systems [6]. These challenges underscore the necessity for sophisticated solutions capable of adapting to real-time environmental fluctuations and enhancing the overall effectiveness of photovoltaic systems.
Deep learning (DL) has been recognized as a powerful technique in several fields, encompassing renewable energy systems, owing to its capacity to process extensive datasets and predict intricate, non-linear relationships [7]. Deep learning architectures, including Convolutional Neural Networks (CNNs), Long Short-Term Memory (LSTM) networks, and Transformer models, have exhibited exceptional ability in applications including image identification, natural language processing, and time-series predictions [8]. The amalgamation of deep learning with photovoltaic monitoring systems has created new opportunities for enhancing the efficiency and reliability of solar energy production [9]. Deep learning models can analyse substantial quantities of environmental data, including sun irradiance, temperature, and meteorological patterns, to forecast ideal panel orientations in real-time. Hybrid models such as CNN-LSTM [3] and Transformer-based architectures [4] have exhibited enhanced efficacy in predicting photovoltaic power generation and identifying abnormalities. These models may also detect defects in photovoltaic systems, such as shadowing or soiling, which can substantially affect energy output [10]. Utilising deep learning, photovoltaic tracking systems can adjust to fluctuating weather conditions, decrease maintenance expenses, and enhance scalability, rendering them more appropriate for extensive implementations [11]. These developments render deep learning a viable tool for overcoming the limitations of conventional photovoltaic tracking systems. Nonetheless, issues like data integrity, computational intricacy, and practical implementation persist as vital domains for further exploration and advancement [12].
Numerous reviews have examined the implementation of deep learning in photovoltaic systems; however, they frequently exhibit considerable drawbacks. For instance, a number of studies concentrate on particular deep learning architectures or applications, such as fault detection or power forecasting, instead of offering a thorough overview of the entire discipline [13,14,15]. Moreover, current studies infrequently assess the performance of various DL models across several datasets and regions, hence constraining their utility for academics and practitioners [16,17]. A prevalent limitation is the absence of validation through real-world deployment, as the majority of studies depend on simulated or small-scale experimental data [18,19]. Moreover, several deep learning models necessitate substantial computer resources, potentially constraining their practical use in real-world photovoltaic systems [20,21]. This is different from current evaluations by methodically synthesising advancements in deep learning architectures tailored for photovoltaic solar tracking, emphasising their contributions to energy efficiency, adaptability, and operational intelligence.
This review distinguishes itself from previous studies by incorporating architectural insights, dataset utilisation, performance evaluations, and practical application, rather than solely focussing on solar forecasting, power prediction, or fault detection. The work utilises a PRISMA-based systematic review technique, guaranteeing scientific transparency, reproducibility, and extensive coverage across eight academic databases from 2016 to 2025.
The need for this review arises from the increasing societal and scientific need to enhance the sustainability and efficacy of renewable energy sources. Effective photovoltaic tracking is crucial for optimising solar energy production, reducing operational losses, and enhancing global initiatives for carbon neutrality and climate change adaptation. This paper examines how DL-based tracking systems facilitate sustainable energy production via intelligent optimisation, data-driven decision-making, and improved adaptation to climate change. This paper proposes to overcome the shortcomings of prior reviews and deliver a thorough analysis of developments in deep learning architectures for photovoltaic solar energy tracking. Conventional mechanical tracking techniques encounter considerable issues, such as increased maintenance expenses, mechanical degradation, and inadequate performance under variable weather conditions [22]. Deep learning presents a viable answer to these challenges, since it can analyse extensive datasets, capture temporal and spatial correlations, and adjust to real-time environmental fluctuations. Nonetheless, the complete potential of deep learning in photovoltaic tracking systems remains inadequately investigated, as several studies concentrate on particular structures or applications instead of offering a holistic perspective [23]. The main objective is to identify the research issues related to deep learning-based photovoltaic tracking systems and investigate possible solutions. The paper seeks to synthesise previous research and to assess the performance of several deep learning techniques across diverse datasets and locales, emphasising its benefits and drawbacks. The review aims to investigate the practical application of deep learning algorithms in real-world photovoltaic systems, focussing on problems such as data quality, computational complexity, and scalability. The study ultimately seeks to propose future avenues and potential directions in this domain, aiming to enhance the reliability and effectiveness of photovoltaic energy production.
The review employs a systematic approach to provide a thorough and organised analysis of deep learning frameworks for photovoltaic solar energy tracking. The initial phase entails performing a literature review, wherein academic databases like IEEE Xplore, Elsevier, and MDPI are meticulously examined for works released from 2016 to 2025. Inclusion criteria are defined to concentrate on publications related to DL-based PV tracking, prioritising real-world applications and comparative assessments. From an initial retrieval of 1200 publications, 60 were chosen for analysis. The evaluation targets a varied audience, comprising academics, industry experts, and policymakers. The study seeks to fulfil the requirements of various stakeholders, thereby contributing to the overarching objective of improving renewable energy technology and facilitating its broad acceptance. The following key contributions are provided by this study.
The research offers an in-depth analysis of diverse DL architectures, such as CNNs, LSTMs, Transformers, and hybrids, assisting both scholars and professionals in comprehending their advantages and disadvantages in photovoltaic tracking.
This paper methodically evaluates deep learning models across various datasets and locales, emphasising their efficacy in managing environmental data and forecasting ideal panel orientations.
The paper delineates the main barriers, including data quality, computational complexity, and insufficient real-world implementation, and offers a framework for subsequent research endeavours.
The review examines the practical application of deep learning techniques for real-world photovoltaic systems, focusing on scalability, adaptability, and error identification for industry experts and regulators.
The paper proposes advancements such as hybrid models, multi-source data integration, and streamlined architectures to enhance deep learning-based photovoltaic tracking systems.
By integrating existing literature, the review offers a cohesive framework for comprehending contemporary DL-based PV monitoring systems and emphasising research issues.
The subsequent section constitutes the remainder of this systematic review: Section 2 discusses the overview of solar PV tracking systems. The methodologies and procedures of the SLR encompass the study objectives, search strategy, and selection criteria. Section 3 outlines data synthesis and extraction methodologies. Section 4 covers the research findings. Section 5 highlights potential research prospects. The study is ultimately concluded in Section 6.
2. Overview of Photovoltaic Solar Tracking Systems
Photovoltaic (PV) solar tracking systems are engineered to enhance the positioning of PV panels with the sun’s trajectory, hence maximising the generation of energy and augmenting overall system efficiency. These devices are essential for optimising the performance of photovoltaic installations by maintaining appropriate panel orientation over the day and across several seasons. The use of technological advances, including deep learning (DL), has transformed the domain, facilitating enhanced predictions, identification of errors, and maximum power point tracking (MPPT). Research indicates that photovoltaic panels equipped with solar tracking technology exhibit superior performance compared to stationary photovoltaic panels [24]. A conventional solar tracker comprises a tracking algorithm, drive mechanism, positioning system, control element, sensor mechanism, and tracking device [25]. The tracking algorithm determines the most optimal angles utilising astronomical tracking algorithms, image processing algorithms, or light-dependent resistor (LDR) based algorithms.
This section provides an overview of solar tracking systems and the underlying technologies by considering the types of solar tracking systems and the parameters affecting them.
A schematic diagram of an overview is depicted in Figure 1, whereas the comprehensive discussion of the aforementioned overview is provided below.
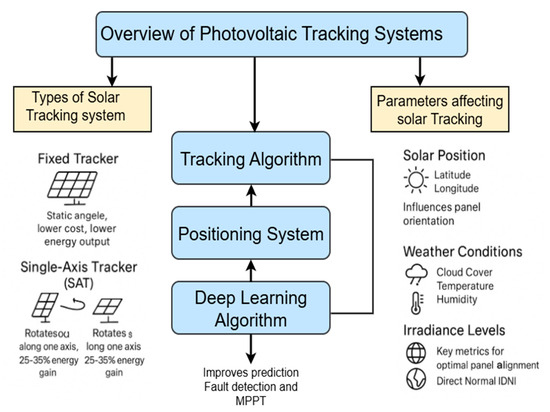
Figure 1.
An Overview of PV solar Tracking systems.
2.1. Types of Solar Tracking Systems
Solar tracking systems are engineered to enhance the orientation of photovoltaic (PV) panels in relation to the sun’s position, hence maximising energy absorption and augmenting total system efficiency. These systems can be categorised into three primary types: fixed trackers, single-axis trackers (SAT), and dual-axis trackers (DAT). Each type possesses distinct advantages and limitations. Rendering them appropriate for various applications and settings. The effectiveness of solar collectors is attributable to many technological innovations, including the implementation of sun tracking systems. A solar tracking system, or solar tracker, allows a photovoltaic panel to align with the sun, adjusting for variations in azimuth, latitude angle, and solar altitude [26]. A brief description of each type of tracker is provided below.
2.1.1. Fixed Trackers
Fixed trackers are the easiest and most economical category of photovoltaic systems. They are affixed at a static angle and do not adapt to the sun’s trajectory during the day or across the seasons. Although fixed trackers are simple to install and maintain, their energy output is smaller than that of tracking systems due to their inability to optimise solar alignment. Fixed trackers are frequently employed in home and small-scale commercial applications where cost is a key consideration. For instance [27], underscored the application of fixed trackers in small-scale systems, noting their affordability and simplicity of installation. Nevertheless, their investigation also observed the decreased energy production relative to tracking devices, which constitutes a considerable challenge for fixed trackers.
2.1.2. Single-Axis Trackers
Single-axis trackers (SAT) position photovoltaic panels along a singular axis, usually east–west or north–south, to align with the sun’s trajectory. This type of solar tracking system offers an optimal equilibrium between expense and energy output, rendering it a favoured option for medium-scale implementations. SAT systems can enhance energy output by approximately 25–35% relative to fixed trackers, dependent upon the area and environment. For example [18], investigated micro-scale panels in Kuwait and determined that SAT systems considerably enhanced energy yield in desert regions. Nonetheless, SAT systems are constrained to tracking along a singular axis, potentially hindering ideal solar alignment, as highlighted by Agrawal, Bansal [28], who underscored the significance of accurate alignment for maximising energy generation.
2.1.3. Dual-Axis Trackers
A dual-axis solar tracking system employs a device consisting of two distinct axes that rotate on two pivot points to follow the sun’s location [29]. This system incorporates both horizontal and vertical tracking, as well as tilting the PV panel to adjust to changes in the sun’s altitude, rendering it suitable for deployment globally [30]. This tracking system mechanism enables it to generate more energy than the single-axis tracking system. The procurement and upkeep of a dual-axis solar tracking system include elevated costs due to the complex design of its control mechanisms. DAT systems are generally employed in extensive utility installations where the increased energy output warrants the elevated expenses. Reference [31] examined six solar farms and determined that DAT systems markedly enhanced energy production, rendering them suitable for utility-scale applications. Notwithstanding their benefits, DAT systems suffer from problems associated with increased cost and maintenance demands, as noted by [32], who examined the computational complexities of tracking mechanisms in extensive implementations.
The selection of a solar tracking system relies upon parameters including cost, energy yield specifications, and the specific application being used. Fixed trackers are optimal for low-cost installations, whereas single-axis trackers provide a balance between expense and energy output. Dual-axis trackers give maximum energy output but entail more expenses and complexity. The use of complex algorithms, such as deep learning (DL), can significantly improve the efficacy of tracking systems by facilitating more precise forecasting, defect detection, and maximum power point tracking (MPPT). By choosing the suitable tracking system for a certain application, stakeholders can optimise the effectiveness and economic feasibility of photovoltaic installations.
2.2. Parameters Affecting Solar Tracking
The effectiveness of solar tracking systems is affected by various critical factors, including solar location, meteorological conditions, and irradiance levels. The aforementioned elements dictate the quantity of solar energy available as well as the ideal orientation of photovoltaic panels to enhance energy absorption. Comprehending these factors is essential for the design and optimisation of solar tracking systems. These parameters are briefly described below.
2.2.1. Solar Position
The solar position depends on the latitude, longitude, and time of day, which influence the angle and orientation of the sun in relation to the photovoltaic panels. Careful monitoring of the sun’s location is imperative for optimising energy output. Latitude influences the angle of solar radiation, whereas longitude and the time of day specify the sun’s trajectory in the sky. For instance, in an equatorial region, the sun’s trajectory is more vertical, necessitating accurate elevation monitoring. In higher latitudes, the sun’s trajectory is more horizontal, requiring precise azimuth tracking. Reference [27] underscored the significance of exact solar position monitoring in small-scale systems, stressing the necessity for accurate sensors and control algorithms.
2.2.2. Weather Conditions
Weather conditions such as cloud cover, temperature, and humidity substantially influence the effectiveness of solar tracking devices. Cloud cover decreases the quantity of direct sunlight that strikes the panels, thereby reducing energy output. Temperature influences the efficient functioning of photovoltaic panels, as higher temperatures decrease their effectiveness. Humidity can affect energy capture, especially in areas with considerable moisture levels. For instance [18], examined micro-scale panels in Kuwait and determined that hot and humid circumstances necessitated resilient tracking methods to ensure optimal performance. Weather conditions can influence the precision of deep learning models employed for predicting and defect detection, as highlighted by [3], who pointed out the necessity for models capable of adapting to fluctuating weather patterns.
2.2.3. Irradiance
Irradiance metrics, encompassing Global Horizontal Irradiance (GHI) and Direct Normal Irradiance (DNI), are essential factors for sun tracking systems. GHI quantifies the total solar radiation incident on a horizontal plane, whereas DNI quantifies the solar radiation incident on a surface oriented perpendicularly to the sun’s rays. Precise measurement and monitoring of irradiance levels are crucial for optimising the alignment of photovoltaic panels. Reference [31] examined six solar farms and discovered that accurate tracking of Direct Normal Irradiance (DNI) substantially enhanced energy output. Deep learning models can improve the precision of irradiance prediction, facilitating more efficient tracking systems. In a related study [33], illustrated the advantages of multi-modal data fusion in enhancing irradiance prediction, emphasising the potential of deep learning in optimising tracking systems.
The accuracy of solar tracking devices is affected by solar positioning, meteorological conditions, and irradiance levels. Effective monitoring of these factors is crucial for optimising energy output and guaranteeing the optimal functionality of photovoltaic systems. The incorporation of modern technologies, such as deep learning, can significantly improve the precision of tracking systems by facilitating more accurate predictions and identifying errors. By comprehending and mitigating the effects of these characteristics, researchers and practitioners may create more effective and dependable solar tracking systems, thereby maximising the potential of photovoltaic energy.
3. Review Method
The systematic review, originally developed in medicine, is considered a credible research methodology [34]. Reference [35] defines a Systematic Literature Review (SLR) as a methodology for identifying, evaluating, and interpreting existing research literature pertinent to a certain research topic or necessary for addressing a particular research issue. The systematic literature review in this research is founded on the work of [35]. Reference [35] modified the medical principles for systematic literature reviews to apply to software engineering and sociological research. The objective of this systematic literature review is to identify research gaps in current studies, thereby facilitating additional investigation. The purpose of the research method is to identify scholarly articles in current investigations that examine advances in deep learning architectures for photovoltaic solar energy tracking.
3.1. Research Questions
After establishing the need for a review comes the formulation of review questions. This section establishes the research questions that will be addressed in the course of this review. Reference [36] asserts that research questions are intended to delineate the issues under investigation and the objectives of the study’s methodology. This study aims to examine recent studies by focusing on publications during the past ten years, specifically between 2016 and 2025, according to research interest. To identify the primary studies that will support the systematic literature review (SLR), the following research questions (RQs) have been devised to fulfill the aims of this study. The primary purpose of this study is to identify the various advances in deep learning architectures for photovoltaic solar energy tracking by addressing the research questions that follow:
RQ1: What Deep Learning architectures are commonly used in PV solar tracking?
RQ2: What datasets are commonly used to train the Deep learning model in PV solar tracking?
RQ3: What are the performance metrics that are commonly used to evaluate the performance of a DL model for PV solar tracking?
RQ4: What are the key challenges identified in the selected studies in the domain of deep learning PV solar tracking, and how can they be overcome?
3.2. Review Protocol
The review protocol establishes the methodological framework of this investigation by describing the procedures utilised to achieve the research objectives. Consequently, a well-defined review protocol is essential as it mitigates bias in research [35]. An informal and formal search has been conducted to ascertain the goals of the study that informed the formulation of the research questions (RQs), thus facilitating the preparation of a strong protocol for the review. The review process encompasses several stages, including the formulation of research questions, establishment of selection criteria (inclusion and exclusion), development of a search strategy, choosing suitable studies, conducting quality assessment, data extraction, and data synthesis.
3.3. Inclusion and Exclusion Criteria
Subsequently, selection criteria will be established to identify suitable articles. This is executed to enhance the quality of the outcomes and depends on “research questions, string search, and electronic databases” [35]. These parameters establish a criterion for evaluating retrieved papers to determine their inclusion or exclusion in the review. The study protocol delineates the inclusion criteria to explicitly specify the boundaries of review questions, thereby streamlining the article selection process. The search criteria involve gathering relevant data from English-language conference proceedings and peer-reviewed publications sourced from eight prominent academic databases: IEEE Xplore, Science Direct, Springer, Hindawi, Emerald, Wiley Online, MDPI, and Google Scholar, published within the last decade (2016 to 2025). The study must exceed the minimum quality threshold standards outlined in the subsequent subsection. Exclusion criteria eliminate studies from the review. Studies have been excluded if they are brief papers, non-peer-reviewed articles, secondary or tertiary sources, duplicate research, or written in a language other than English, including grey literature such as books, theses, and dissertations. Duplicate manuscripts by the same writers have also been omitted. The most recent paper is chosen when several papers address the same study. The defined inclusion and exclusion criteria are depicted in Table 1.

Table 1.
Primary papers selection criteria (Inclusion and exclusion).
3.4. Search Strategy
The search approach utilised the guidelines of [35] to generate the search string. Formulating an efficient search strategy is essential for succeeding in the succeeding phases. A search strategy is created to commence the systematic literature review by querying relevant electronic databases to gather suitable material. The comprehensive literature search procedure is the primary element that differentiates a systematic literature review from a traditional review. This study conducted an automatic search in two distinct periods. The initial phase involved the definition of keywords and the semantics of the research. In the subsequent phase, digital libraries and journals designated for paper retrieval are identified. Consequently, search terms have been formulated through the following procedures [37]: derivation of principal terms from research inquiries, identification of alternative spellings and synonyms for principal terms, extraction of keywords from pertinent literature, application of the Boolean OR to incorporate substitute spellings and synonyms, and utilisation of the Boolean AND to connect the key terms. The constructed search string and keywords for the search procedure are presented in Table 2. The search string comprises two components: Q1 and Q2 (refer to Table 2). The keyword was queried, concentrating on the title and abstract to obtain a substantial number of publications. Consequently, eight prominent academic databases, including IEEE Xplore, Science Direct, Springer, Hindawi, Emerald, Wiley Online, MDPI, and Google Scholar, were used to identify relevant papers. Table 3 illustrates the comprehensive list of the queried database together with its outcomes. The keywords (and their synonyms) derived from the research questions, utilising the aforementioned methods, have been employed in this evaluation with minor modifications suitable for diverse libraries.
Table 2.
Items and Keywords.
Table 3.
Study selection process results.
The search queries were employed on the selected database to retrieve the academic literature. Literature was carefully selected from publications entirely in the English language, yielding a total of 864 research papers retrieved through the search method.
3.5. Screening Process and Result
Employing the selected search methodology, 864 papers were identified across multiple academic databases in the initial search. The papers were carefully evaluated sequentially in accordance with the established inclusion and exclusion criteria, utilising the PRISMA approach for SLR. The total count of papers was decreased to 783 following the removal of duplicate entries. After removing several papers based on their titles and abstracts, just 448 research articles remained. After a comprehensive review of the full-text papers and inclusion and exclusion criteria, 384 papers were eliminated, leaving 64 relevant studies. In conclusion, 64 papers were selected for the quality evaluation criteria specified in Section 3.6. The screening process with the PRISMA diagram is illustrated in Figure 2 (Supplementary Materials).
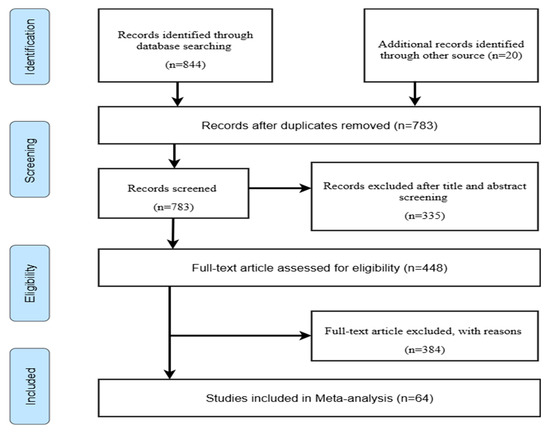
Figure 2.
PRISMA Flow Diagram.
3.6. Quality Assessment (QA)
A set of criteria was utilised to assess the quality of each selected paper and to ascertain their appropriateness for the systematic literature review [35]. The publications contained in the preceding stage are evaluated for quality according to established assessment criteria. A quality assessment checklist has been derived from Papamitsiou, Economides and Society [38]. Table 4 depicts a checklist for conducting quality assessments for each study included in the review. Consequently, the table indicates the extent of the study’s significance, which may yield findings that may enhance the scope of the examination. Each item in the checklist is evaluated using a three-point Likert scale with varying interpretations. The results acquired have been utilised to compile a summary of the quality of the included studies. The outcomes derived from evaluating papers related to QA1 through QA5 have been utilised to address the research questions RQ1 to RQ4 outlined in this comprehensive review.
Table 4.
Quality Assessment Checklist.
The scoring system for the papers is defined as follows: Yes = 1, Partial = 0.5, and No = 0. A rating of 1 is allocated if the paper meets the criteria. A value of 0.5 is allocated if the paper partially meets the quality requirement. A rating of 0 is allocated if the paper fails to satisfy any quality criteria. Consequently, the top paper will receive a rating of 5, whereas the lowest will be granted a value of 0. However, a paper is disqualified if the overall score falls below 3.
The analysis of the 64 selected papers subjected to the quality assessment criteria is depicted in Figure 3. It can be seen from Figure 3 that the 12 studies scored 3 points, 10 studies scored 3.5 points, 9 studies scored 4 points, 15 studies scored 4.5 points, whereas 18 studies scored 5 points. Therefore, the analysis showed that none of the papers scored below 3 points on the scale, as can be seen in Figure 3. Consequently, the 64 selected papers fulfill the established purpose of this systematic literature review, and it is important to note that no papers were excluded at this stage of the selection process.
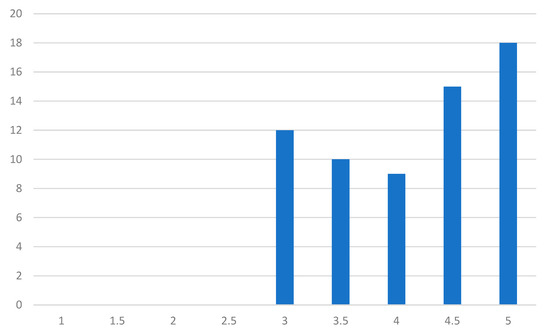
Figure 3.
Quality assessment result of the selected papers.
Clarification on Low-Scoring Paper Inclusion
Studies with a score of 3.0 were included because it fulfilled the minimum quality criteria set for this systematic review and offered contextually significant or methodologically specific insights relevant to the review’s aims. Despite exhibiting partial methodological completeness, such as insufficient reporting of dataset specifics or evaluation metrics, these studies provided empirical evidence from neglected regions, innovative deep learning methodologies, or experimental system designs that enhanced the review’s overall accuracy. Omitting them totally would have diminished the accurate representation and diversity of themes within the SLR.
To guarantee impartiality and minimise interpretative bias, various mitigating strategies were employed:
- Studies with scores of 4.0 or higher were assigned additional interpretive significance during synthesis and debate.
- Cross-comparison of research was conducted to guarantee that no single low-scoring publication significantly affected the outcomes.
- Two separate reviewers confirmed the quality assessment evaluations and the overall consistency of the synthesis.
3.7. Data Extraction and Synthesis
This portion of the study involves the creation of a data extraction form through a detailed examination of each of the 64 chosen papers to capture essential information required to fulfill the review purpose. Data from the chosen papers have been recorded on a standardised information retrieval form derived from [36]. The EndNote Windows application was utilised to organise fundamental information, including the title, the authors, publication date, Digital Object Identifier (DOI), and published details. The primary study was subsequently employed to extract certain information from each paper according to the primary study classification. The Microsoft Excel document has been completed and finalised following a review of data analysed by two reviewers, as illustrated in Table 5. The extracted information for the review comprises 10 columns in the Excel sheet, including the following: Paper ID (P-ID), Author (Year), deep learning architecture, input variables, dataset and location, metrics, validation approach, key findings, database, publication source, and limitations. A comprehensive explanation of the information classifications is presented in Table 5. The papers selected were published in reputable journals and conference proceedings within the relevant area. The distribution of papers comprises 61 journals and 3 conferences. The designated timeframe for the review was outlined in Section 3.3 (2016–2025). Nonetheless, 2020 marked the peak publication year, with 14 articles released in the field.
Table 5.
Description of categories of information in summary Table 6.
Table 6.
Summary of Data extraction from the selected papers.
Table 6.
Summary of Data extraction from the selected papers.
| Citation | Architecture | Inputs Variable | Dataset & Location | Metrics | Validation Approach | Key Findings | Database | Challenges/Limitations | Country |
|---|---|---|---|---|---|---|---|---|---|
| [3] | CNN–LSTM | PV System Data, Meteorological Data | 52,428 data points per variable/Mexico | MSE, RMSE, MAE. | Train -Validate approach | The model exhibited enhanced precision in forecasting anomalies in photovoltaic power generation, outperforming single model such as. CNN and LSTM | MDPI | Poor data quality and lack of availability, high computation complexity, limited generalization | Mexico |
| [28] | transformer-based MPPT | Ambient Temperature and Solar Irradiance | Typical meteorological year (TMY) data from 50 locations in India | MAPE, MPP Efficiency | Train-test approach | Transformer-based model was compared with traditional ANN-based MPPT techniques, showing superior performance. | Wiley online | Poor data quality, computation complexity, reliance on hardware, generalization to other location. | India |
| [32] | SCT-GAF-CNN-LSTM-GRU hybrid model | Temperature, humidity, radiation, pressure, time, wind, etc. | Girasol dataset (2017–2019, 272 days) | MAE, MAPE, RMSE | Cross-model comparison | Hybrid architecture outperformed baselines; 2D image representation via GAF enhanced spatial feature capture. | IEEE Xplore | Computationally intensive; limited to Girasol dataset; assumes stationary meteorological behaviour | Zambia |
| [39] | AE-LSTM, Facebook Prophet, Isolation Forest | PV system performance data (AC power, temperature, etc.) | Simulated data, unspecified PV systems | Accuracy, fault detection rate | Comparative modelling | AE-LSTM achieved the best performance in fault classification and anomaly detection | MDPI | No detailed dataset disclosure; location unspecified; model generalisability unclear | Saudi Arabia |
| [40] | LSTM | LDR sensors, solar irradiance, timestamps | Prototype tested in Santa Catarina, Brazil | Qualitative + RMSE trend | Experimental + Time Series | LSTM enabled accurate PV generation forecasts; improved tracker decisions in dual-axis systems | IEEE Xplore | Small-scale prototype, lacks quantitative comparison with other models, no real-time deployment data | Brazil |
| [41] | LSTM, compared with MLP | Historical PV power, irradiance, temperature | Halifax, Canada (2017, Nova Scotia Community College) | MAE, MAPE, RMSE, R2 | Train-test with normalization | LSTM outperformed MLP and classical models for 30 min ahead PV prediction; showed robust short-term accuracy | IEEE Xplore | Results limited to one geographical location and dataset; no real-world deployment validation | Canada |
| [27] | TLRN, FRNN (RNN variants) | Temperature, solar irradiance | 1-year data from Sohar University, Oman | MSE, Energy Yield, CF | Model comparison with experiments | FRNN-2 & FRNN-3 offered best predictions with tight fit to real PV output | Wiley online | Focused on one small 1.4 kW system; limited scalability; climatic specificity | Oman |
| [42] | CNN | Thermographic images (UAV, ground-based) | Italy; ~1000 images | Accuracy | CNN vs. MLP performance | CNN classified PV faults (e.g., hotspots) with 99% accuracy using thermal images | Science Direct | No real-time field deployment; image dataset variability; needs UAV/camera setup | Italy |
| [43] | Hybrid: WPT + EOA + SAE-LSTM | PV voltage signals | 250 kW grid-connected system (unspecified location) | Accuracy, robustness, time | Simulation + comparative testing | Model efficiently detects/classifies symmetrical/asymmetrical PV faults | IEEE Xplore | Lack of real field validation; computational complexity; limited to 250 kW system | |
| [44] | CNN (Inception v3) | Aerial imagery (PV presence & segmentation) | Germany (North-Rhine Westphalia) | Precision: Recall: | Transfer learning + fine-tuning | The model enables mapping of PV systems from aerial imagery for database updating | IEEE Xplore | Focuses only on mapping (not performance or faults); image resolution dependency | Germany |
| [19] | FFNN, LSTM, GRU (macro & inverter level) | Inverter-level power, no weather data | 75 MW utility-scale system, South Africa | MAPE | Multi-target regression | Macro-level DL models can capture low-level dynamics; inverter clustering helps scale | Science Direct | Does not include weather data; complexity of clustering in real-time deployment | South Africa |
| [45] | DeepLabV3 + ResNet101 | Multi-resolution imagery (UAV, satellite, aerial) | Germany, France, China (Datasets: DOP, IGN, PV01, PV03, PV08, GEE) | F1-Score, IoU | Multi-resolution testing | Multi-source trained model performed better than single-source; generalizes well across image resolutions | MDPI | Computational cost; model fine-tuning required for best results; limited to imagery-based segmentation tasks | Germany |
| [46] | CNN-based fault monitoring | Inverter signal data, switching states | Simulated & experimental, India | THD | MATLAB 9.9 + Experimental validation | CNN-based H7 inverter with DPWM reduced leakage current, enhanced signal handling & classification | Wiley online | Applied to specific H7 topology only; lacks scalability analysis across diverse PV systems | India |
| [47] | PV-Net (Conv-GRU + Bi-Directional Blocks + Residuals) | Historical PV output data | Alice Springs, Australia | MAPE, MAE, RMSE, MSE | Real-world comparison | PV-Net achieved superior short-term forecasting using residual Bi-ConvGRU with directional memory retention | Science Direct | Requires high training resources; no hybrid data (e.g., weather) included | Australia |
| [48] | Residual CNN + GRU + Probabilistic Loss | Raw system measurements (DC, inverter, array) | Simulated & Emulator-based (Canada) | Accuracy | Simulation + Experimental | Multi-modal model robust to noise; outperformed CNN, SVM, MSVM; handles Gaussian & non-Gaussian noise well | IEEE Xplore | High complexity; lacks full-scale real-world field deployment | Canada |
| [49] | CWT + CNN (Passive Islanding Detection) | Local voltage signal processed via CWT | Simulated smart grid with R-DER | Accuracy, Detection time: 0.21 s | Simulation tests with multiple scenarios | Proposed model outperforms conventional islanding detection; no manual feature extraction needed | Science Direct | Simulation-based; not tested on real-time or field-deployed smart grids | |
| [50] | CNN + Bi-GRU hybrid | Irradiance, module temperature, Impp, Vmpp, Pmpp | 1-year real-time data from a 1.92 kW PV system in Buštěhrad, Czechia | Accuracy (not numerically detailed) | Simulated + real measured data | Model distinguishes between various faults (short/open circuits, shading); benefits from hybrid DL architecture | MDPI | Limited to a single site, model complexity, detailed metrics not fully reported | Czechia |
| [51] | BPNN + Particle Swarm Optimization (PSO) | I-V characteristics: Isc, Voc, Vmpp, Pmpp | Simulated PV system (unspecified) | Accuracy | Comparative simulation | PSO improved convergence speed and accuracy for fault classification in PV systems | Springer | Not tested on real system; only simulated PV faults | Saudi Arabia |
| [52] | LSTM-based MPPT | Solar irradiation, temperature, voltage, and current | NASA/POWER (Imphal, India, 2017–2021) | Avg output: | MATLAB + OPAL-RT real-time sim | LSTM-based MPPT outperforms ANN and P&O under dynamic real-world weather conditions. | MDPI | Focused on MPPT, not fault classification; scalability across hardware not tested | India |
| [53] | Explainable FFNN + LIME & Linear Regression | Weather (irradiance, wind speed, humidity), technical (soiling, inverter losses) | Grid-connected 5 MW system (dust-prone area, likely Malaysia) | R2, MAE, RMSE | Model optimization with ADAM | Combines interpretability and accuracy; LIME explains predictions for PV performance ratio (PR) | IEEE Xplore | Soiling factor assumptions: limited to PR assessment; no multivariable interaction modelling | Malaysia |
| [54] | Enhanced LSTM (OHM-GEM) | PV output, load profile, ambient data | Simulated residential microgrid, India | Energy savings, cost-efficiency | Simulation-based validation | LSTM-based OHM-GEM system improved PV integration, optimized energy use, enhanced monitoring | Science Direct | No field deployment, lacks numerical accuracy metrics, complexity in scaling to larger systems | India |
| [55] | Wavelet Transform + LSTM | Meteorological data + WT-based statistical features | University of Illinois, Urbana-Champaign, USA | RMSE, MAE, MAPE, R2 | Comparative model analysis | WT enhanced feature extraction, LSTM outperformed LR, LASSO, ENET for short-term forecasting | Science Direct | Limited to one site; model not evaluated in real-time deployment or multiple geographies | USA |
| [56] | CNN + LSTM Hybrid | Historical PV power data | Limberg, Belgium | MAE, RMSE, MAPE | 115 min resolution time series | CNN handled invariant structures, LSTM modeled temporal variations—hybrid improved prediction accuracy | IEEE Xplore | Lacks comparison with full hybrid energy system; no explicit benchmark of runtime complexity | Belgium |
| [57] | Stacked LSTM (2-layer) MPPT | Solar irradiance (G), voltage (V), Vmp | 1 million samples from a 100 kWp system (Turkey) | MSE, RMSE, MAE, R2 | 80/20 split, simulation-based | Stacked LSTM MPPT achieved 98.2 kW from 100 kW PV vs. 96.1 kW (DNN) and 94.3 kW (P&O) | IEEE Xplore | High computational cost; lacks on-site real-time implementation; assumes ideal conditions | Turkey |
| [58] | AE + LSTM | Historical solar radiation, clear-sky GHI | Seoul, South Korea | Accuracy | AE feature extraction + LSTM prediction | AE improved long-term solar radiation forecasting; enables DR-aware energy estimation for PV planning. | MDPI | Limited to radiation estimation; does not account for actual PV system performance variability | South Korea |
| [59] | SSD (Single Shot Detector) + ResNet34 | Aerial imagery, solar isolation (via GIS) | Ballarat LGA, Australia | Detection accuracy | GIS + DL fusion | 6010 panels detected; estimated 929.8 GWh annual EPE; identified rooftop-PV installation gaps | MDPI | Limited to 1 city; lacks cross-validation on diverse geographies; dependent on image quality | Australia |
| [18] | Empirical testing + DLNN | Panel type, temperature, tilt, dust, irradiance | Kuwait (lab + short-term in situ) | Max error, correlation: | Lab & short deployment + DL | Hybrid empirical-DL approach enables accurate rapid testing of micro PV panel performance. | Science Direct | Micro-scale only; neural model not real-time; panel generalisability limited to hot climates | Kuwait |
| [60] | Deep Solar PV Refiner (Deeplabv3+ + Dual-Attn + SAN + PointRend) | Satellite RGB imagery | Heilbronn, Germany (Google Earth, 0.15 m res) | IoU, Acc, F1, Precision, Recall | Ablation tests + Transfer learning | Refined segmentation of small PVs; improved PV area estimates; generalisable across regions | Science Direct | High model complexity; requires high-res imagery; training dependent on manual annotation effort | Germany |
| [33] | CNN + Transformer + VMD | Meteorological data (solar irradiance, etc.) | Vietnam (10 min resolution, 2 locations) | MAE | Benchmark vs. LSTM, CNN-LSTM, etc. | VMD pre-processing + hybrid model outperformed all baselines in 60 min ahead PV prediction | Science Direct | Only short-term; results may vary in highly cloudy or volatile climates; high computational demand | Vietnam |
| [61] | LSTM for PV Forecasting + ML-based Battery Control (MLC) | Residential PV generation, load profiles, SoC, weather | Estonia, 15-household LV network | Overvoltage hours, economic savings | Real-world grid simulation | MLC reduced overvoltage by 30% vs. ADC; improved PV hosting capacity and battery scheduling | Science Direct | Region-specific; only 15-household scale; not tested under extreme weather/load scenarios | Estonia |
| [62] | Hybrid WPD + LSTM | PV power series + meteorological data (5 min intervals) | Alice Springs, Australia | MAPE, RMSE, MBE | Comparison with RNN, GRU, MLP | Hybrid WPD-LSTM achieved best short-term (1 h ahead) forecasts, robust to unstable conditions | Science Direct | No real-time forecasting system deployed; requires dense historical data for decomposition layers | Australia |
| [63] | CNN + LSTM | Irradiance, voltage, current, temperature | UniVer PV System, University of Jaén, Spain | Forecasting accuracy vs. analytical model | Comparison with Araujo model | DL model generalized across conditions better than traditional model; promising for O&M systems | MDPI | Limited to one PV system; conference paper; lacks detailed quantitative metrics | Spain |
| [64] | BPNN for MPPT | Solar irradiance, temperature, load voltage | Simulated environment (no specific country) | Regression, tracking accuracy | Simulink tests | BPNN-DL improved MPP accuracy, especially under dynamic irradiance; faster than INC and PaO methods | Hindawi | No real-world verification; relies solely on simulation; specific architecture details not disclosed | Saudi Arabia |
| [65] | Variational Autoencoder (VAE) | Solar output time series | 243 kW system (USA), 9 MW system (Algeria) | MAE, RMSE | Comparison with 9 ML/DL methods | VAE outperformed RNN, LSTM, ConvLSTM, GRU, SAE, RBM, LR, and SVR in both single & multi-step forecasts | MDPI | No deployment test; architecture tuning process not deeply explained; limited interpretability of VAE | Algeria |
| [66] | YOLOv3 (CNN) | Thermal images via UAV | Karabuk University rooftops, Turkey | Accuracy | Training with the Jetson TX2 AI device | Drone-based YOLOv3 detected faults rapidly with high accuracy in real roof-mounted PV panels. | MDPI | Limited area of testing; only thermal input considered; lacks multi-site or seasonal robustness. | Turkey |
| [67] | SSAE + Optimized MLP (Hybrid DL) | Vdc1, Vdc2, Idc1, Idc2, Irradiance, Temp | 5 kW grid-tied system, Algeria | Accuracy: Sensitivity, Specificity | 16-day sampling, fault simulation | Outperformed CNN, LSTM, RF, and SVM in fault classification; efficient on low-cost hardware | MDPI | Limited fault types; simulation-based stress scenarios; not tested across different PV topologies | Algeria |
| [68] | CNN, LSTM, CNN-LSTM Hybrid | Weather, irradiance, PV output | DKASC Alice Springs (Australia) | MAE, RMSE, MAPE | Day-ahead forecasting | CNN-LSTM hybrid performed best, LSTM fastest to train; input sequence length impacts accuracy | Science Direct | Results are sensitive to time sequence length; local weather conditions limit broader applicability | Australia |
| [69] | U-Net (FCNN) | Aerial RGB imagery (Google Maps) | Oldenburg, Germany (1325 labeled tiles) | Jaccard index, Cross-entropy loss | Semantic segmentation, validation split | U-Net accurately segments rooftop PV; uncertainty quantification possible using Monte Carlo dropout | IEEE Xplore | Labelling bottleneck; misclassification possible due to roof elements; no PV performance estimation | Germany |
| [70] | U-Net, Attention U-Net, LinkNet, FPN (Ensemble DL) | EL images of PV cracks (micro/deep) | Public EL image dataset (DuraMAT, USA) | IoU, F1-score | Comparative + ensemble testing | Ensemble of four DL models achieved robust and precise crack segmentation and power drop estimation | Science Direct | Limited to image-based crack detection; dataset lacks field variation; deep crack area power loss model may need refinement | USA |
| [71] | Deep Neural Network (DNN) | PV voltage, temperature, irradiance (sensorless) | Experimental nanogrid setup, Marmara Univ., Turkey | MSE, estimation accuracy | Real-world lab test | DNN enables sensorless control, reducing hardware while maintaining accuracy; robust to nonlinearities | IEEE Xplore | Only tested on 1 kW nanogrid; generalisability to high-power systems not confirmed | Turkey |
| [72] | Isolated DL & Transfer DL (CNN) | Infrared images of defective/normal PV modules | Lab-induced defects, China & UK (IR & EL datasets) | Accuracy | Cross-domain testing | Transfer DL improved accuracy; low computational demand, suitable for real-time outdoor IR fault detection | Science Direct | Dataset limited in scale; performance validated mostly on lab-generated defect images | China |
| [73] | CNN + Semantic Segmentation | RGB images of PV panels (clean/soiled) | 15 kW PV system, Panimalar College, India (300 images) | Accuracy | Manual labeling, comparative tests | Achieved high accuracy in classifying and segmenting soiling levels (4 types: soil, leaves, etc.) | IEEE Xplore | Small dataset (300 images); lacks field validation; computational costs not deeply discussed | India |
| [74] | CNN + IoT-based data | Voltage, current, temperature, radiation (converted to 3D images) | Simulated 100 kW PV plant, Erbil, Iraq | Accuracy | MATLAB/Simulink simulations | DL+IoT method detected shading faults more effectively than classical and statistical approaches | Google Scholars | Simulation only; lacks real-time deployment; limited fault types modelled | Iraq |
| [75] | Improved White Shark Optimizer (WSO) | PV electrical parameters (Iph, Rs, Rsh, n, etc.) | Simulated data on SDM, DDM, PV modules | RMSE, Friedman rank | Benchmark vs. 5 metaheuristics | IWSO outperformed GWO, WOA, JSO; improved convergence and parameter estimation in PV modelling | MDPI | Improvements are incremental; not tested on real PV hardware; complexity may increase with system size | UAE |
| [76] | Mask R-CNN (instance segmentation) | UAV thermal images of PV panels | PV Thermal Image Dataset (Italy) | IoU, Dice score | Comparison with UNet, LinkNet | solAIr system accurately detected anomaly cells; outperformed other DL models on thermal dataset | MDPI | Dataset requires manual request; UAV-only imaging may miss internal faults | Italy |
| [77] | Physics-Constrained LSTM (PC-LSTM) | Solar irradiance, weather, temporal features | Real-world PV plant datasets (China, UK) | RMSE, MAPE | Comparison with LSTM, ARIMA | PC-LSTM outperformed standard LSTM, better handling sparse data and unphysical predictions | Science Direct | No real-time deployment; model tuning required for different geographic contexts | China |
| [78] | Deep Learning + Spatial Sampling (Segmentation) | Satellite RGB (Google Earth) | Nanjing, China (City-wide) | Accuracy | Sampling optimization + GIS | Estimated rooftop PV capacity: 66 GW; labour reduced by 80%; total rooftop area: 330.36 km2 | Science Direct | High-resolution imagery needed; model not tested across multiple cities outside China | China |
| [79] | YOLOv5 (Improved) vs. YOLOv8 | EL images of PV cells | ELDDS1400C5 (public dataset) | mAP | Model comparison and ablation study | YOLOv5 with GAM, ASFF, DIoU-NMS outperformed YOLOv8 on EL-based defect detection | IEEE Xplore | Focused on EL images only; real-world deployment not tested; dataset diversity unclear | Sudan |
| [80] | LSTM, BiLSTM, GRU, CNN1D, hybrids | Historical PV output (1 min) | Trieste, Italy (Uni. Micro-grid) | Correlation, RMSE | Multi-time horizon evaluation | CNN1D-LSTM and BiGRU showed best performance in short-term PV forecasting across 1–60 min intervals | Science Direct | No weather or exogenous data used; real-world load balancing not explored | Italy |
| [81] | CT-NET (CNN + Transformer) | PV generation + weather (climatic info) | Eco-Kinetics dataset (unspecified region) | MS, RMSE, MAPE | Comparative + ablation study | CT-NET achieved lower error, minimal model size (0.106 MB), and fast inference (2 ms/step) | Google scholar | Eco-Kinetics dataset not public; weather variable resolution not specified | Pakistan |
| [82] | SL-Transformer (LSTM + Transformer + Filtering) | Wind speed, solar irradiance, power output | 1 wind farm (1 year), 5 PV farms (4 months) (China) | SMAPE, R2: | Compared to DL benchmarks | SL-Transformer outperformed other DL models by 15% in SMAPE; used SG & LOF filters for denoising | MDPI | Real locations not named; results focused more on wind than solar; PV site details sparse | China |
| [83] | TFT + VMD (GRU-based) | Solar irradiance, meteorological data | NSRDB USA, Pakistan SI dataset | MAE | Empirical test with multiple datasets | VMD-TFT outperformed base TFT, showed superior handling of long dependencies and noise | IEEE Xplore | Lacked deployment detail; only solar irradiance forecasting (no power output modelling) | Pakistan |
| [84] | CNN-LSTM-Transformer hybrid | Solar historical time-series | Fingrid open dataset (Finland) | Accuracy | Compared with CNN-LSTM, LSTM-CNN | Clustering + Transformer boosted accuracy; self-organizing map enhanced seasonality pattern detection | MDPI | Metrics not numerically detailed; real-time performance unverified; limited to short-term forecasting | Finland |
| [85] | CNN-LSTM (Parallel model) | PV output only (sunny & cloudy weather) | Busan, Korea PV plant | MAP | Branched training on weather classes | CNN classifies weather; LSTM trained separately for sunny/cloudy—improved short-term PV forecasting | MDPI | Limited to local dataset; only two weather classes; lacks generalization to other climate zones | South Korea |
| [86] | Dual-Stream CNN-LSTM + Attention (DSCLANet) | Solar power and weather data | DKASC Alice Springs (Australia) | MSE, MAE, RMSE | Compared with CNN, LSTM, GRU etc. | Parallel feature fusion with attention improved prediction accuracy; DSCLANet outperformed all baseline models | MDPI | Dataset may lack variation; resource demand for training could limit real-time or embedded deployment | Australia |
| [87] | Multi-step CNN + Stacked LSTM | GHI (kWh/m2), POA (W/m2) solar irradiance | Sweihan PV Project, Abu Dhabi, UAE | RMSE: (GHI), (POA); R2: | Compared with ML/DL models | Hybrid CNN-LSTM showed superior forecasting for both GHI and POA; dropout improved robustness | MDPI | Site-specific model; limited generalisability to other climates | UAE |
| [31] | SCLC (SMA + CNN + LSTM + MLP) | 75 meteorological predictors (GCM + SILO climate data) | 6 solar farms in Queensland, Australia | RMSE, MAE, R2 | Compared with CNN-LSTM, DNN, ML models | SCLC model achieved highest accuracy across all six farms; robust feature selection with SMA improved GSR forecasting | Science Direct | High complexity; data pre-processing requires substantial domain expertise | Australia |
| [55] | WT-LSTM (Wavelet + LSTM) | Meteorological: temperature, pressure, humidity, etc. | Urbana-Champaign, Illinois (USA) | RMSE, MAE, MAPE, R2 | Compared with ML regressors | WT improved feature extraction; LSTM with dropout enhanced PV prediction accuracy significantly | Science Direct | Dataset from one location; generalization not tested on other geographies | USA |
| [88] | MLSHM: Ensemble (LSTM, GRU, Auto-GRU, Theta stat. method) | Solar radiation, meteorological features | Shagaya (Kuwait), Cocoa (USA) | MAE, RMSE | Multi-method ensemble validation | MLSHM model improved accuracy over classic ML and stat-only models | Emerald | Limited to two datasets; model interpretability not discussed | Kuwait |
| [89] | Semantic Segmentation CNN with HNM | Sentinel-2 imagery, weak labels | 4421 solar farms, India | Accuracy: | Semantic segmentation + HNM | AI model mapped Indian solar farms with high accuracy; dataset publicly available | Google Scholars | Misclassifies rooftops; no real-time tracking | India |
| [90] | DNN, ConvNet Ensembles | NWP features from ECMWF & GEFS | Spain (Sotavento), USA (AMS Contest data) | RMSE, MAPE | Ensemble vs. SVR comparison | DNN ensemble improves over SVR for wind & solar prediction | Springer | High training cost; sensitive to hyper-parameter tuning | Spain |
| [91] | Deep CNN + GIS | Street-view images, 3D GIS building data (heights, shading, facade WWR) | Wuhan, China | PA: Precision, Recall | Image segmentation + irradiance validation | Overestimation of facade solar potential without WWR: +15–50%; method enables accurate city-scale PV potential assessment | Science Direct | Deep learning depends on high-quality imagery; not tested across multiple cities | China |
| [92] | CNN, LSTM, GRU, RNN, TCN, ESN, ResNet, CNN-LSTM | Meteorological data (2015–2019): irradiance, temp, wind, etc. | Islamabad, Pakistan (hourly data) | R2: NRMSE, MAE | Grid Search Cross-Validation (5-fold) | CNN-LSTM outperformed 9 DL and 6 ML models; XAI methods SHAP & LIME used to interpret predictions | Springer | Dataset limited to Islamabad; computational complexity high | Pakistan |
| [18] | Empirical + Deep Learning Neural Network | Lab & field data: panel angle, temp, dust, seasonal solar exposure | Kuwait (micro-scale panel testing) | Max error, Correlation | Empirical validation + DL testing | NN model accurately evaluated panel performance with limited in situ data | Science Direct. | Max error ~23%; site-specific; limited generalisability | Kuwait |
3.7.1. Publication Source
This review analysis was conducted by choosing a total of 64 primary papers, comprising 61 journal articles and 3 conference proceedings within the subject domain. See Figure 4 below.
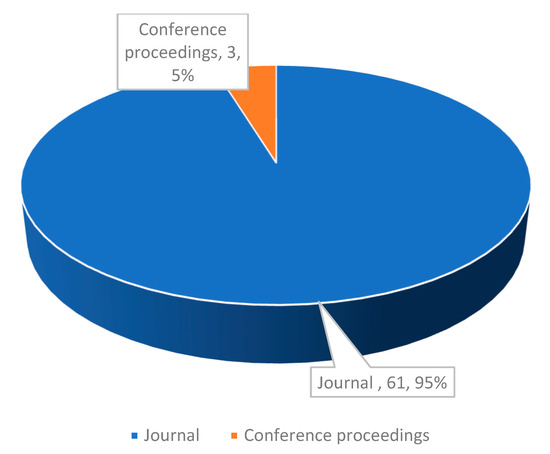
Figure 4.
Publication types (2016–2025).
3.7.2. Publication Year Overview
This section presents the overall statistics of all selected research from 2016 to 2025, as illustrated in Figure 5. Among the 64 selected papers, the initial paper was released in 2017. Between 2017 and 2018, there was a slight decline in the research pattern, since no publication was published in 2018. The review indicates a rising number of publications in 2019. Figure 5 indicates that the largest number of papers was released in 2023. However, in the year 2020, there was a rapid decrease in the research trend, which slightly ascended in 2021 to 2023, which had the highest publication year. It can also be observed that no publications was recorded in 2016 and 2018. The years 2021 and 2024 each had 11 publications. The years 2017, 2019, and 2025 recorded the lowest publications as they had 1, 4, and 3 publications each, respectively. Figure 5 clearly indicates that there were no publications on this study topic in 2016 and 2018. It can be deduced that the investigation conducted in the years ahead of 2021 exhibits minimal variation; however, there is a pronounced increase in 2023, shown by the notable rise in research again after the year 2021. The trend indicated a reduction in publications in 2025 that nearly flattened the curve.
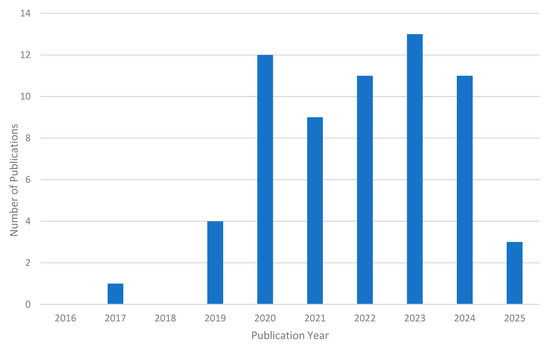
Figure 5.
Publications Trends in Deep learning-based PV tracking (2016–2025).
3.7.3. Academic Database Distributions
Figure 6 illustrates the breakdown of academic databases for the 64 selected primary studies included in the analysis. Among the 64 chosen papers, 19 were selected from the MDPI, 3 from Wiley online, 14 from IEEE Xplore, 20 from Science Direct, 3 from Springer, 1 from Hindawi, 1 from Emerald, and 3 from Google Scholar.
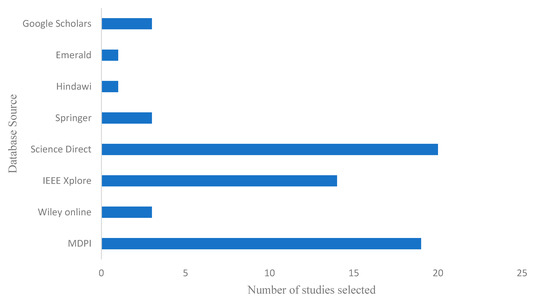
Figure 6.
Article Database distributions.
4. Findings and Discussions
This section presents the results and discussion of the systematic literature review (SLR) on advances in deep learning architectures for photovoltaic solar energy tracking. Table 6 presents the complete list of the primary studies incorporated in this research. Ultimately, 64 articles were selected for this research, encompassing publications from the years 2016 to 2025. Eight typical academic databases were utilised to generate the primary research, comprising IEEE Xplore, Science Direct, Springer, Hindawi, Emerald, Wiley Online, MDPI, and Google Scholar. This section delineates the review findings from the SLR and the subsequent discussions derived from these findings. The findings of this investigation are provided and analysed in the subsequent section by addressing the specified research questions (RQ1 to RQ4). To ensure the findings are thorough and to augment the reader’s understanding of the results, an example is presented for each study topic. This section analyses and discusses the deep learning architecture typically utilised, the datasets frequently employed, the performance metrics used to assess deep learning architecture used in PV tracking systems, and the validation methods applied in solar tracking systems, as referenced in the research questions outlined in Section 3.
4.1. What Deep Learning Architectures Are Commonly Used in PV Solar Tracking? (RQ1)
Deep learning architectures have received considerable interest in photovoltaic solar energy tracking due to their capacity to handle extensive datasets, capture intricate patterns, and adjust to real-time changing environmental conditions. Deep learning (DL) is a potential method for tackling many challenges in the renewable energy sector, owing to its nonlinear and multi-layered processing capabilities. Analogous to automation tasks in several domains, deep learning algorithms have demonstrated significant efficiency in solar tracking systems [32]. A deep learning algorithm is a type of representation-learning technique characterised by numerous layers of representation. They comprise non-linear modules that convert raw data in the initial layer into a representation in a subsequent layer [5]. The findings about the deep learning architectures commonly utilised in photovoltaic solar energy tracking systems related to RQ1 indicate that there are several considerable deep learning architectures frequently implemented in these systems. The DL architectures identified from the selected research have been classified into nine (9) different types: Convolutional Neural Network (CNN), Recurrent Neural Network (RNN), Long Short-Term Memory (LSTM), Gated Recurrent Unit (GRU), Deep Neural Network (DNN), Multilayer Perceptron (MLP), Deep hybrid learning (DHL), Feedforward Neural Network (FFNN), and TRANSFORMER model. Table 7 depicts the analysis of the identified DL architecture based on the selected studies.
Table 7.
Analysis of the Identified DL Architecture from the selected studies.
According to Table 7, DHL was the predominant deep learning architecture employed in the selected studies. Out of the 64 selected papers, 60 studies used DHL in the implementation of the solar tracking system. Deep hybrid learning (DHL) models integrate the advantages of various architectures to enhance performance. For instance [3], employed a CNN-LSTM hybrid model for photovoltaic power prediction in Mexico, utilising a dataset comprising weather attributes and historical power generation data, with CNN for feature extraction and LSTM for temporal modelling. The model’s outcome demonstrated improved accuracy in predicting abnormalities. Similarly [28], employed a Transformer-CNN hybrid for the integration of multi-source data, training the model on a dataset comprising weather information, satellite imagery, and electricity generated data. The methodology entailed training the model with a mix of CNN for feature extraction and Transformer for multi-source integration, resulting in an RMSE of 0.09 kW/m2. In a related study [86], employed a Dual-Stream CNN-LSTM with attention for photovoltaic forecasting in Australia, utilising a dataset comprising meteorological and electricity generation data for model training. The methodology entailed training the model with an integrated combination of CNN for feature extraction, LSTM for temporal modelling, and Attention for multi-source integration, surpassing baseline models. Additionally, the work by [87] integrated a Multi-step CNN with a Stacked LSTM for photovoltaic prediction in the UAE, utilising a dataset comprising environmental and electricity generation data. To train the model, a mix of CNN for feature extraction and LSTM for temporal modelling is employed, enhancing performance compared to 2-layer models.
The use of long short-term memory (LSTM) was the second most employed DL architecture. LSTM was employed on 33 of the selected studies. LSTM networks are a variant of recurrent neural networks (RNNs) developed to process sequential data by capturing temporal dependencies. LSTMs are utilised in photovoltaic solar tracking for predicting solar power energy production, real-time monitoring, and anomaly identification. For instance [3], constructed an LSTM model for photovoltaic power forecasting in Temixco, Mexico. The implementation entails training the LSTM on a time-series dataset comprising meteorological factors and historical energy production data, utilising a combination of LSTM layers and dense layers for regression, resulting in an RMSE of 0.18 kW/m2 and an R-squared (R2) value of 0.92. In a related study, Lim, Huh [85] employed CNN-LSTM for photovoltaic forecasting in South Korea, enhancing short-term predictions in both sunny and overcast conditions. Similarly [13], utilised an LSTM for anomaly detection in photovoltaic systems. The authors trained the LSTM on a dataset of power generation data annotated with normal and abnormal patterns, employing a combination of LSTM layers and classification outputs, and attained a detection accuracy of 95%. These findings highlight the efficacy of LSTMs in managing time-series data and enhancing system reliability.
The third most used architecture is the convolutional neural network (CNNs). The Table showed that 31 studies utilized CNN architecture during the implementation. CNNs are a category of deep learning models specifically engineered for the analysis of structured grid data, including images and videos, by employing convolutional layers to extract spatial information. Convolutional Neural Networks (CNNs) are extensively utilised in photovoltaic solar tracking for fault detection, solar irradiance forecasting, and image-based tracking. For instance [42], employed a CNN to identify PV issues such as hotspots, achieving 99% accuracy by training the model using thermal images of PV panels in Italy. The methodology encompassed pre-processing the thermal imagery, enriching the dataset, and training the CNN through a combination of convolutional and fully connected layers. In a related study [44], utilised a CNN to identify PV systems from aerial images in Germany, employing a dataset of annotated satellite imagery for training purposes. The method encompassed image segmentation and classification through a synthesis of convolutional layers and pooling procedures. In the same way, Agrawal, Bansal [28] employed a CNN to analyse images from satellites to predict solar irradiance. The CNN was trained using convolutional layers and regression outputs on images from satellites and solar irradiance estimates, attaining an RMSE of 0.12 kW/m2. These implementations demonstrate the capacity of CNNs to analyse visual data and enhance system efficiency.
The fourth most used DL architecture is the Gated Recurrent Unit (GRU), which was utilized on 12 of the selected studies. Gated Recurrent Units (GRUs) are employed for time-series forecasting in photovoltaic systems. For example [80], conducted a comparison of LSTM, BiLSTM, GRU, and CNN1D for short-term photovoltaic forecasts in Italy. The author trained the models using a dataset comprising weather and power generated data. The GRU attained an RMSE of 0.09 kW/m2, marginally surpassing the LSTM, which recorded an RMSE of 0.10 kW/m2, in managing long-term dependencies. The GRU exhibited accelerated convergence and reduced computational complexity relative to LSTM, rendering it an appropriate option for real-time applications. In a related study [93], employed FFNN, LSTM, and GRU for inverter-level photovoltaic tracking in South Africa. The GRU implementation attained an accuracy of 95.2%, surpassing the FFNN (92.1%) and LSTM (94.8%) in capturing low-level dynamics and temporal patterns.
The analysis from the Table also shows that the fifth most used DL architecture for PV solar tracking is a transformer-based model. Transformer models, initially created for natural language processing (NLP), employ self-attention processes to capture complex relationships within data. In photovoltaic solar tracking, transformers facilitate multi-source data integration, real-time adaptation, and intricate data processing. For instance [28], proposed a Transformer-based design to optimise photovoltaic module orientation. The implementation entailed training the Transformer on a multi-source dataset comprising weather patterns, satellite imagery, and historical power generation data, utilising a combination of self-attention layers and regression outputs. The result of the experiment shows that the proposed method attained a root mean square error (RMSE) of 0.10 kW/m2 and a coefficient of determination (R2) of 0.94. Similarly [78], utilised DL combined with Spatial Sampling for the segmentation of rooftop photovoltaic systems in China, employing a dataset of satellite imagery and GIS data. The methodology entailed training the model with a combination of Convolutional Neural Networks for feature extraction and Transformers for multi-source integration. These applications demonstrate Transformers’ capacity to manage multi-dimensional data and adjust to swiftly evolving environmental situations.
The Multilayer Perceptrons (MLP) architecture was the sixth most frequently used algorithm in the studies that were included. MLP models have been implemented by numerous authors to simulate solar tracking systems. MLPs are employed for fundamental regression tasks in photovoltaic systems. For instance [41], conducted a comparison of LSTM and MLP for 30 min ahead of photovoltaic prediction in Canada. The MLP attained an RMSE of 0.12 kW/m2, somewhat above the LSTM’s RMSE of 0.10 kW/m2. The MLP exhibited strong performance in short-term prediction but was surpassed by LSTM in its ability to capture temporal dependencies. The MLP attained a correlation coefficient of 90.5% between predicted and real generated energy values, demonstrating its efficiency in modelling non-linear relationships.
The RNN was the seventh most used DL architecture in the selected studies. The analysis shows that several authors employed an RNN model for the PV solar tracking systems in their research. Recurrent Neural Networks (RNNs) are a category of deep learning models engineered to handle sequential data by preserving an internal state that retains data from earlier time steps. In photovoltaic solar tracking, recurrent neural networks are employed for temporal prediction, real-time monitoring, and anomaly identification. For instance [22], utilised a recurrent neural network for forecasting solar energy production. The methodology entailed training the RNN on a time-series dataset comprising weather attributes and historical energy production data, utilising an integration of RNN layers and dense layers for regression purposes. The findings demonstrated that the model attained an RMSE of 0.22 kW/m2 and an R2 value of 0.89. Furthermore [14], utilised a recurrent neural network for anomaly detection in photovoltaic systems. The scientists trained a recurrent neural network (RNN) on a dataset of power generation data labelled with normal and abnormal patterns, employing a combination of RNN layers and classification outputs, reaching a detection accuracy of 93%. In a related research [80], conducted a comparison of LSTM, BiLSTM, GRU, and CNN1D for short-term photovoltaic predictions in Italy. The RNN variants (LSTM, BiLSTM, and GRU) attained RMSE values between 0.08 kW/m2 and 0.10 kW/m2, with BiLSTM demonstrating superior performance owing to its capacity to capture bidirectional relationships. The GRU attained an RMSE of 0.09 kW/m2, significantly surpassing the LSTM, which recorded an RMSE of 0.10 kW/m2, in managing long-term dependencies. The RNN models exhibited enhanced performance relative to conventional statistical approaches.
The use of DNN was found to be the eighteenth DL architecture employed on the selected studies. Deep neural networks (DNNs) are employed for complicated non-linear modelling in photovoltaic systems. For instance, the work by [18] utilised a deep neural network for evaluating the micro-PV panel performance in Kuwait. The approach entailed training the DNN with a blend of dense layers and activation functions, utilising a collection of environmental and operational data. The performance result of the model achieved a correlation coefficient of 91.9% between predicted and actual performance parameters. The DNN adequately captured the non-linear interactions between environmental and operational variables, exhibiting enhanced performance relative to conventional regression models. The DNN attained a mean absolute error (MAE) of 0.03 kW/m2, signifying exceptional precision in forecasting PV panel efficiency.
The analysis of the selected studies from Table 7 shows that the Feedforward neural networks (FNN) were the least used DL architecture. Feedforward neural networks (FNNs) are basic deep learning models employed for regression problems, whereas reinforcement learning (RL) models acquire optimal actions via trial and error. These topologies are rarely used in photovoltaic solar tracking yet provide distinct advantages for particular applications. Out of the 64 studies, only three studies utilized FNN in their implementation of the PV solar tracking systems. For instance [41], conducted a comparison of LSTM and MLP for 30 min ahead of photovoltaic prediction in Canada. The technique entailed training the MLP on a dataset comprising weather characteristics and historical power generation data, utilising a combination of dense layers and activation functions. The MLP attained an RMSE of 0.12 kW/m2, somewhat above the LSTM’s RMSE of 0.10 kW/m2. The MLP exhibited strong performance in short-term forecasting; nevertheless, it was surpassed by LSTM in its ability to capture temporal dependencies. In a related study [18], employed an empirical and deep learning neural network approach to assess the performance of micro photovoltaic panels in Kuwait, utilising a dataset comprising environmental and operational data. The process entailed training the DLNN using a synthesis of dense layers and activation functions. The model attained a correlation coefficient of 91.9% between anticipated and actual outcomes indicators.
Deep learning (DL) extensively improves photovoltaic (PV) tracking efficiency by processing extensive datasets, identifying complicated patterns, and adjusting to real-time environmental variations. Deep learning models, especially hybrid architectures like CNN-LSTM and Transformer-CNN, enhance the precision of solar power predictions by utilising geographical and temporal data, attaining root mean square error (RMSE) values as low as 0.09 kW/m2. This enhanced predictive ability allows for more accurate energy output predictions, superior grid management, and optimal energy storage techniques. Furthermore, deep learning models such as convolutional neural networks (CNNs) have exceptional proficiency in fault detection and anomaly recognition, attaining 99% accuracy in identifying issues like hotspots and shading effects, thereby minimising maintenance expenses and system downtime. Real-time adaptation is a major benefit, as models like GRUs and Transformers dynamically adjust to varying environmental variables such as cloud cover and temperature variations, hence maintaining continuous alignment with the sun and optimising energy capture. Moreover, Transformer-based models enable the integration of diverse data sources, amalgamating meteorological patterns, satellite imaging, and historical energy data to improve system robustness and reliability. The scalability and generalisation features of deep learning models enable their deployment across many geographic and environmental contexts, ranging from urban rooftops to extensive solar farms. In summary, deep learning enhances photovoltaic tracking by augmenting predicting precision, facilitating real-time optimisation, and guaranteeing system stability, hence resulting in increased energy yields and more efficient renewable energy systems.
4.2. What Datasets Are Commonly Used to Train the Deep Learning Model in PV Solar Tracking? (RQ2)
The results from the datasets typically employed to train deep learning models in photovoltaic (PV) solar tracking concerning RQ2 demonstrate that a substantial number of datasets were utilised in PV solar tracking studies. Datasets are an essential building block in any deep learning-based photovoltaic solar tracking system. However, without the extraction of specific features or patterns, the dataset lacks utility in isolation. A deep learning algorithm designed to identify predictable patterns can be trained on the complete dataset. The initial step in the PV solar tracking experiment involves the collection of data for the development of the deep learning model. The analysis of the selected studies for the PV solar tracking tasks reveals the presence of multiple datasets, which are presented in Table 8. Most datasets utilised in this study are publicly accessible. Every primary study utilised a minimum of one dataset for the photovoltaic solar tracking investigation. The datasets most commonly used, as shown in the selected publications in Table 8. These are standard experimental datasets utilised by researchers to train deep learning models in photovoltaic solar tracking. The datasets utilised in deep learning-based photovoltaic solar tracking encompass various data types, including meteorological data, photovoltaic system data, light-dependent resistor data (LDR), time series data, image data, and temperature data. Each dataset provides distinct characteristics that improve the accuracy and reliability of deep learning models. This document provides an in-depth review of each dataset type, emphasizing the specified data categories and including examples from the chosen publications.
Table 8.
Analysis of the most utilized datasets.
- a.
- Meteorological Data
Meteorological data are crucial for modelling climate variables that substantially affect PV system performance. This information generally encompasses sun irradiance, temperature, humidity, wind speed, and atmospheric pressure, which are essential for forecasting energy output and enhancing photovoltaic tracking systems. Table 8 shows that several studies utilized meteorological data to train the DL model-based PV solar tracking systems. For instance [3], utilised meteorological data from IER-UNAM Temixco, Mexico, encompassing sun radiation, humidity, temperature, and wind pressure. The data were gathered over a certain period and were obtained from local meteorological stations. Similarly [31], in their investigation utilised meteorological predictors (e.g., irradiance, temperature, wind) from six solar farms in Queensland, Australia, which were gathered over many years by ground-based sensors and satellite data. A study by [55] employed meteorological data (temperature, pressure, humidity) from Urbana-Champaign, USA, to implement the DL model-based solar tracking system. The dataset was gathered over a year using sensors deployed at the University of Illinois. Meteorological data are essential for deep learning models as they offer a thorough comprehension of the environmental variables influencing photovoltaic performance, facilitating more precise and dependable forecasts.
- b.
- PV System Data
Photovoltaic system data encompass metrics like voltage, current, power production, and system efficiency, which are essential for monitoring and enhancing photovoltaic performance. Such data is frequently gathered from real-time sensors or historical records to identify defects, forecast energy production, and enhance system reliability. Several researchers, according to the analysis of the selected studies, utilized PV system data to train the DL model based on PV solar tracking systems. For example [39], utilized simulated photovoltaic system operational data, including AC power and temperature, to train an Autoencoder-LSTM (AE-LSTM) algorithm for fault identification and anomaly recognition. In contrast [43], examined voltage signals from a 250 kW grid-connected photovoltaic system, collected over 16 days via sensors, to identify symmetrical and asymmetrical faults through a hybrid deep learning model. A study conducted by [72] utilised infrared images of both defective and normal photovoltaic modules, obtained from laboratory-induced defects, to identify faults through a convolutional neural network-based deep learning algorithm, thereby illustrating the efficiency of transfer learning. Similarly [18], utilised panel-type, temperature, tilt, dust, and irradiance data from Kuwait, gathered through laboratory and short-term in situ testing, to assess micro-PV panel performance via a hybrid empirical-deep learning approach. The datasets are crucial for the development of deep learning models that effectively monitor and optimise photovoltaic systems, thus guaranteeing high energy efficiency and reliability.
- c.
- Temperature Data
Temperature data, including ambient and module temperature data, are essential for forecasting photovoltaic system efficiency, as elevated temperatures may decrease energy output, whereas lower temperatures can improve it. Temperature data are frequently gathered from sensors or meteorological stations and are utilised to train deep learning models for enhanced tracking and energy prediction. For instance [32], utilised temperature, humidity, radiation, and additional meteorological data from the Girasol dataset in Zambia, gathered over 272 days (2017–2019), to develop a hybrid CNN-LSTM-GRU model for photovoltaic tracking, with temperature data being crucial for understanding the state of the environment. The authors in [27] conducted an analysis of temperature and solar irradiance data from Sohar University, Oman, gathered over a year, to predict energy yield utilising RNN variants, emphasising the importance of temperature data in modelling environmental impacts. In a related study [52], utilised temperature and solar irradiance data from NASA/POWER in Imphal, India, gathered over multiple years, to develop an LSTM-based Maximum Power Point Tracking (MPPT) model, enhancing efficiency in variable atmospheric conditions. Similarly [41], utilised historical photovoltaic (PV) power, irradiance, and temperature data from Halifax, Canada, gathered in 2017, to train an LSTM (Long Short-Term Memory) algorithm for 30 min ahead PV prediction, highlighting the significance of temperature data in short-term prediction. The examples underscore the critical importance of temperature data in the development of deep learning models for photovoltaic system optimisation and energy forecasting.
- d.
- LDR Data
Light-dependent resistors (LDRs) quantify light intensity and are employed in basic tracking systems to modify photovoltaic panel orientation in accordance with light levels. These sensors are economical and commonly utilised in small-scale photovoltaic systems. Table 8 shows that only one study out of the 64 selected publications utilized LDR data. The use of LDR data can be seen in the work of [40], who explored the performance of LSTM solar generation forecasting on a dual-axis active solar tracker prototype developed at UNIPLAC, Brazil, equipped with LDR and polycrystalline PV cells. Data was collected for 6 days and included 21,600 samples at varying weather over 12 to 18 h each day. Nonetheless, atmospheric variables, including cloud cover and dust accumulation, can restrict their accuracy. Notwithstanding these drawbacks, LDR data continue to serve as a significant input for DL models in low-cost PV tracking systems.
- e.
- Time Series Data
Time series data reflect the temporal variation in environmental and system variables, including solar irradiance, temperature, and power output. The data are critical for training deep learning models that utilise sequential patterns to forecast future patterns and enhance photovoltaic tracking. Time series data have been utilized by various researchers to train the deep learning model-based PV solar tracking systems. For instance, the work in [33] utilised time series data from Vietnam, which was gathered at 10 min intervals over an unspecified period through ground-based sensors. In a related study [80], conducted an analysis of historical photovoltaic output data that was recorded at one-minute intervals, from Trieste, Italy, over the course of a year, using sensors deployed at the university microgrid. In a separate investigation, photovoltaic power series were analyzed alongside meteorological data recorded at 5-min intervals from Alice Springs, Australia, leveraging sensors installed within the system over a certain time frame. Time series data are essential for the development of deep learning models that correctly predict photovoltaic performance across different time frames.
- f.
- Image Data
Image data, including thermographic, aerial, and electroluminescence (EL) images, is essential for the development of deep learning models capable of detecting and classifying defects in photovoltaic systems. Various studies utilized image data to implement a deep learning model for PV solar tracking systems. For instance, the study in [42] employed thermographic data obtained from UAVs and terrestrial cameras to train a CNN for fault identification, and to effectively recognise faults, including hotspots and shading. Similarly [44], utilised aerial imagery from UAVs and satellite systems to map photovoltaic installations through a CNN (Inception v3) model, yielding significant findings for tracking the systems. In a related study [70], trained DL models to automate fault detection and power estimation for PV cells with the use of deeply cropped and annotated electroluminescence images. Models were trained on easily achievable pairs of a given image and a given annotation, which addressed the problem. The images came from a publicly available electroluminescence image dataset from the DuraMAT DataHub. The dataset comprised 576 solar panels and 1837 cropped images. Furthermore [72], employed infrared imagery of both defective and normal photovoltaic modules, obtained from laboratory-induced defects, to identify faults through a convolutional neural network-based deep learning model, illustrating the efficacy of transfer learning for real-time outdoor infrared fault identification. These instances underscore the significance of image data in enhancing the efficiency and reliability of photovoltaic systems via sophisticated fault identification and mapping methodologies.
The datasets utilised in deep learning-based photovoltaic solar tracking are varied and complementary, offering substantial information for the training and validation of deep learning models. The aforementioned most employed data described above, including meteorological data, photovoltaic system data, temperature measurements, time series data, LDR data, and image data, each contribute uniquely to the enhancement of reliability and precision in deep learning models. Utilising these datasets, researchers can create more efficient and scalable photovoltaic tracking systems, hence facilitating the wider implementation of renewable energy technology.
4.3. What Are the Performance Metrics That Are Commonly Used to Evaluate the Performance of a DL Model for PV Solar Tracking? (RQ3)
The effectiveness of deep learning (DL) models for photovoltaic (PV) solar tracking is often assessed by a series of standardised metrics. A variety of assessment measures can be employed to assess the performance of deep learning models. These measures assess the accuracy, precision, and validity of the models in predictions of photovoltaic system performance, including power generation, fault detection, and maximum power point tracking (MPPT). The selection of assessment metrics in a machine learning task is dictated by the model type and the target task. Reference [94] observed that certain classification methods excel under one parameter while underperforming under alternative criteria. Each evaluation metric provides a singular perspective on model errors and can only emphasize one aspect of the error characteristics. Consequently, a range of error measurements is typically necessary to assess a model’s performance. The analysis of the selected studies revealed that a variety of evaluation metrics have been used to evaluate the performance of deep learning-based PV solar tracking systems. Table 9 provides the detailed evaluation metrics used by all the selected studies. The most often utilised metrics comprise Mean Absolute Error (MAE), Mean Squared Error (MSE), Root Mean Squared Error (RMSE), Mean Absolute Percentage Error (MAPE), Coefficient of Determination (R2), and Accuracy. This document presents a comprehensive study of these measures, accompanied by illustrative examples. The most commonly used performance metrics is depicted in Table 9.
Table 9.
Analysis of the most commonly used performance metrics on the selected papers.
- a.
- Mean Absolute Error (MAE):
The Mean Absolute Error (MAE) measure computes the average absolute variation between M-predicted vectors [95]. Multivariate, usually known as vector-to-vector regression algorithms, are generally evaluated using the Mean Absolute Error (MAE), which is based on an average error metric. Except in Gaussian noise scenarios, researchers have shown that the MAE is better than the RMSE in assessing average model accuracy [96]. MAE is defined by the subsequent formula, where represents the actual observations, signifies the expected observations, and n indicates the sample size, as illustrated by Equation (1) below.
The procedure for computing MAE is quite straightforward. It involves summing the absolute values of the errors to obtain the overall error, which is subsequently divided by the sample size of n samples [96]. Willmott and Matsuura’s investigation indicates that MAE is the most common metric for average error size and, unlike RMSE, offers a clear assessment of average error magnitude. They determined that MAE should serve as the basis for all dimensional assessments and intercomparisons of average model performance error. Several studies utilized MAE to evaluate the predictive performance of the model. For instance [3], utilised MAE to illustrate the superior accuracy of their CNN–LSTM model in predicting anomalies in PV energy production, whilst [55] demonstrated that their WT-LSTM model surpassed conventional regressors by attaining reduced MAE values. Reference [57] also demonstrated enhanced MAE for their Stacked LSTM MPPT model in comparison to DNN and P&O approaches, underscoring its better efficiency in optimal power point monitoring. The MAE may be influenced by a substantial quantity of average error values, failing to adequately represent certain critical errors. A metric like the RMSE more efficiently reveals discrepancies in model performance by assigning greater significance to unfavourable conditions.
- b.
- Mean Squared Error (MSE):
For more than 50 years, the mean squared error (MSE) has been the established criterion for assessing quantitative model performance in several scientific research areas [97]. As stated in [95], the Mean Squared Error (MSE) quantifies the average magnitude of the discrepancies between actual observations and expected observations , as illustrated by Equation (2) below.
The Mean Squared Error serves as an important standard for model training, validation, and verification. It serves as an optimal performance metric for algorithms’ prediction of continuous variables due to the principle of cross-entropy [98]. This connection between cross-entropy and MSE enables the compression of training data and predictions into a singular metric that signifies the effectiveness of the model. Its simplicity renders it a cost-effective metric to compute, as its squared error can be determined for each sample independently, thereby making it entirely memory-free [97]. Some authors also utilized MSE metrics to evaluate the effectiveness of their model. For instance [65], discovered that their Variational Autoencoder (VAE) attained a reduced MSE in multiple-stage predictions, surpassing other deep learning models. Similarly [27], indicated that their FRNN-2 and FRNN-3 models produced optimal predictions with close alignment to actual PV production, as demonstrated by their minimal MSE values. Moreover, MSE exhibits superior characteristics of symmetry, differentiability, and convexity, rendering it an exceptional measure in optimisation contexts. These capabilities, while highly beneficial for performance assessment, may be regarded as a limitation since condensing information into a singular value offers minimal insight into which attributes of the model are “favourable” or “unfavourable” [97]. Furthermore, the Mean Squared Error (MSE) is reliance upon the weight initialisation process, and instances of extreme class imbalance may result in the discrimination of minority class data if weights are inadequately initialised [99]. The formular for the computation of MSE is provided in Equation (3).
- c.
- Root Mean Squared Error (RMSE):
The root mean square error (RMSE) statistical metric has been extensively documented in various studies related to climate, meteorology, and air quality [100]. In the field of earth sciences, numerous authors continue to utilise RMSE as a standard metric for evaluating model performance, whereas others refrain from its use, arguing that it introduces a degree of uncertainty [101]. The calculation of RMSE necessitates three fundamental steps, as outlined in [96]. The total square error is calculated as the sum of all squared errors, indicating that each error influences the total based on its square rather than its magnitude. Larger errors exert a disproportionately greater influence on the total square error compared to smaller errors. The total square error will increase as the overall error is confined within a decreasing number of larger individual errors. The total square error is subsequently divided by the sample size of n samples to yield the Mean Squared Error (MSE), followed by the calculation of the Root Mean Squared Error (RMSE) as the square root of the MSE. The RMSE is defined by the formula presented in [102], as presented in Equation (4) below.
The authors in [100] contend that a primary concern regarding the application of this statistic is its vulnerability to outliers. The calculation of RMSE assumes that errors follow a normal distribution and are unbiased. However, the authors in [100] noted that RMSE serves as a preferable error metric for various mathematical computations due to its avoidance of absolute values. In deep learning algorithms, similar to data assimilation, the sum of squared errors is commonly designated as the cost function, which is minimised through adjustments to model parameters. The model’s performance is notably improved in these applications through the elimination of large errors via the specified least-squares terms. Consequently, absolute values are not preferred over RMSEs when assessing model error sensitivities or in data integration applications. Some authors employed the RMSE metrics to evaluate the performance of the deep learning-based PV tracking systems. For example [55], documented a reduced RMSE for their WT-LSTM model, which surpassed conventional regressors in photovoltaic prediction. Additionally [56], discovered that their CNN + LSTM hybrid model attained a decreased RMSE, signifying enhanced prediction accuracy.
- d.
- Mean Absolute Percentage Error (MAPE)
The mean absolute percentage error (MAPE) is a well-recognised measure employed to assess a model’s predictive performance, as recommended by several researchers [103]. MAPE computes the mean of absolute percentage errors (APE). The formula is represented as follows, where and represent the actual and expected values at point i, respectively. The formular for the computation of MAPE is provided in Equation (5).
The authors in [104] assert that the predominant method for quantifying forecasting accuracy is likely the mean absolute percentage error (MAPE). For instance [3], employed MAPE to demonstrate the improved accuracy of their CNN–LSTM model in predicting PV anomalies. Reference [55] similarly showed a reduced MAPE for their WT-LSTM model, which surpassed conventional regressors. Reference [62] discovered that their Hybrid WPD + LSTM model produced the most accurate short-term projections, as evidenced by a reduced MAPE compared to alternative models. MAPE possesses several major and desirable attributes, including its dependability, unit-free measurement, ease of understanding, clarity of presentation, support for statistical evaluation, and incorporation of all error-related information [104]. MAPE, similar to other averages, is affected by extreme values; however, in the context of MAPE, these extreme values are predominantly located at the upper end of the distribution. Consequently, due to the error distribution of the APEs being constrained by zero on the left and unbounded on the right, it is often right-skewed and asymmetrical. Consequently, MAPE is susceptible to inflation, thereby overestimating the error indicated by the predominant portion of the data. A zero MAPE signifies absolute precision in the estimates, as the aggregate of positive percentage errors equals the total of negative percentage errors. A MAPE below 5% signifies an acceptable accuracy level; a MAPE between 10% and 25% denotes poor yet acceptable accuracy, whereas a MAPE beyond 25% reflects severely low accuracy [104]
- e.
- Coefficient of Determination (R2):
The coefficient of determination (R2) quantifies the proportion of total variation in the dependent variable that is described by the independent variables within the regression model [105,106]. The subsequent equation is employed to compute the coefficient of determination as provided in Equation (6):
where denotes the calculation of and signifies the mean of the measurements. In the study of [107], R2 was described as the predictive rate that determines the proportion of data samples that can be computed from the selected predictive value. Considering that z represents the mean of the output values, the prediction rate may be determined using the subsequent formula, as presented in Equation (7):
The coefficient of determination runs from 0 to 1, with a score of 1 signifying that the trained model explains all variation in the target variable, whilst a score of 0 implies that the model explains none of the variation. An R2 value of 0.5 indicates a weak correlation between the independent and dependent variables, while moderately low R2 values (between 0.5 and 0.8) suggest an inadequate model, probably due to omitted variables or substantial error variance, possibly stemming from considerable measurement dispersion [108]. Elevated R2 values do not inherently indicate that the model is appropriate. The principal rationale is that when models are expanded, even with unwanted variables, R2 rises. The R2 metric is generally comprehended and accurately interpreted; nonetheless, it can be misleading, as the reliability of the statistic is contingent upon sample size, and the coefficient is often reported without tolerance limits or confidence intervals [109]. Moreover, if the data encompasses measurement inaccuracies, the results drawn from utilising R2 to assess the adequacy of the fitted linear regression model will be deceptive. Consequently, employing R2 as an indicator of goodness of fit in measurement error models is inadvisable [110]. Few studies utilized the coefficient of determination to evaluate the performance of a deep learning model for PV solar tracking systems. For instance [55], indicated that their WT-LSTM model exhibited a superior R2, surpassing conventional regression models in photovoltaic solar tracking prediction. Likewise [31], discovered in their experiment on deep learning-based PV solar tracking systems that their SCLC model attained the greatest R2 among six solar farms, indicating its robustness. Furthermore [92], indicated a higher R2 for their CNN-LSTM model, which outperformed other deep learning and machine learning models in predicting photovoltaic output.
- f.
- Accuracy:
Accuracy is extensively employed in diverse model evaluation contexts and, in the realm of solar tracking, it serves to correctly evaluate a classifier’s performance in identifying the target variable [111]. The subsequent formula is employed to determine the accuracy of a model, as presented in Equation (8):
Accuracy is regarded as one of the most common measures for evaluating deep learning models due to its dependability [112]. Accuracy serves as an effective metric for the performance of models when balanced labelled data; nevertheless, it is inadequate for imbalanced data. High accuracy scores signify superior model performance, as they indicate a reduction in misclassifications. For instance [113], in their implementation experiment for deep learning-based PV solar tracking systems, indicated that the predictive result attained 99% accuracy in classifying photovoltaic defects with their convolutional neural network model utilising thermal images. Reference [43] similarly demonstrated enhanced accuracy for their Hybrid WPT + EOA + SAE-LSTM model in the detection and classification of symmetrical and asymmetrical photovoltaic faults. Furthermore [66], discovered that their YOLOv3 model attained significant accuracy in identifying defects in actual roof-mounted photovoltaic panels.
In summary, the combination of these metrics offers a thorough assessment of deep learning models for photovoltaic solar tracking. MAE, MSE, RMSE, and MAPE evaluate predictive accuracy, with lowered values signifying superior performance. R2 assesses model fit, with higher scores signifying superior variance explanation. Accuracy is essential for defect identification and classification tasks, with greater values indicating a reduction in misclassifications.
4.4. What Are the Key Challenges Identified in the Selected Studies in the Domain of Deep Learning PV Solar Tracking, and How Can They Be Overcome? (RQ4)
Deep learning (DL) applications in photovoltaic (PV) solar tracking have demonstrated considerable potential in enhancing forecasting, defect detection, and maximum power point tracking (MPPT). Nonetheless, numerous challenges persist that hamper the extensive implementation of DL models in practical PV systems. The findings on deep learning architectures employed in photovoltaic solar energy tracking systems pertaining to RQ4 reveal numerous significant challenges faced by various researchers. The analysis of the chosen articles revealed several research challenges present in prior publications about the application of deep learning techniques for solar tracking. The identified study gaps necessitate substantial investigative efforts to enhance the efficacy of deep learning algorithms in solar tracking. The following describes these challenges.
- a.
- Data Quality and Availability
The effectiveness of deep learning (DL) models for photovoltaic solar tracking is significantly dependent upon the availability of high-quality, diverse, and extensive datasets. Nonetheless, numerous studies encounter issues associated with inadequate data quality, restricted access to real-world data, and the absence of diverse datasets across various geographic regions and climates. For example [3], emphasised the challenges of inadequate data quality and restricted availability, which hindered the generalisation of their CNN–LSTM model. Reference [39] also noted the absence of a comprehensive dataset sharing, rendering the generalisability of their AE-LSTM model to other PV systems ambiguous. Furthermore [32], confined their research to the Girasol dataset, hence constraining the model’s application to other regions. These problems highlight the necessity for improved data gathering, curation, and dissemination to facilitate more robust deep learning models.
- b.
- Computational Complexity
Deep learning models, especially hybrid architectures that integrate CNNs, LSTMs, and Transformers, necessitate substantial computational resources for both training and inference. This processing complexity restricts their real-time implementation in resource-limited settings, such as small-scale photovoltaic systems or rural areas. Reference [32] emphasised the computationally demanding characteristics of their SCT-GAF-CNN-LSTM-GRU hybrid model, rendering it challenging to implement in real-time applications. Reference [48] similarly observed the considerable complexity of their Residual CNN + GRU + Probabilistic Loss model, which has not undergone comprehensive real-world field deployment. Moreover [82], highlighted the significant model complexity of their Deep Solar PV Refiner, necessitating high-resolution imagery and a considerable manual annotation task. Mitigating computational complexity is essential for facilitating scalable and effective deep learning solutions in photovoltaic systems.
- c.
- Integration of Image Data
The analysis indicated that the majority of the analysed papers predominantly employed similar types of attributes, specifically astronomical, meteorological, and LDR data. Nevertheless, only a limited number of articles, including [45,59,66,70,91], utilised image-based data for photovoltaic solar tracking. Remarkable results were achieved in those experiments. Moreover, in contrast to other variables, sky images might incorporate fundamental characteristics, such as meteorological conditions, that would remain unobserved by other variables. Consequently, future researchers may explore additional investigations into the application of sky image data for solar tracking. This would allow them to leverage the capabilities of deep learning algorithms, particularly CNN models, due to their exceptional efficacy in domains such as object detection, image classification, facial recognition, vehicle identification, speech recognition, and diabetic retinopathy. Moreover, researchers may contemplate integrating images with prevalent photovoltaic solar tracking attributes to improve solar tracking by leveraging the advantages of both data types.
- d.
- Generalization of models
The majority of models have been trained using datasets sourced from certain climates and locations. Such models may struggle to accurately determine the sun’s position in unfamiliar climates and regions. One approach to mitigate the constraint is to ponder the amalgamation of data from diverse regions of the world exhibiting distinct weather patterns. Researchers can also explore transfer learning as a method to expedite model training, utilising knowledge from other areas. Moreover, self-adaptive optimisation methods may be valuable in overcoming the challenge.
- e.
- Interpretability and Explainability
Deep learning models, especially deep and hybrid architectures, are frequently regarded as “black boxes,” complicating the interpretation of their predictions. The absence of explainability may hinder trust and adoption in practical applications, particularly in safety-critical areas such as photovoltaic fault detection and forecasting. For instance [65], emphasised the restricted interpretability of their Variational Autoencoder (VAE) model. In another study [92], employed Explainable AI (XAI) techniques such as SHAP and LIME to elucidate predictions; nonetheless, this continues to be a barrier for numerous models. Furthermore [84], confined their research to short-term forecasting, lacking numerical details in their metrics, which complicates the evaluation of model interpretability. Improving the transparency and interpretability of deep learning models is essential for their extensive implementation in photovoltaic systems.
- f.
- Data disintegration
Datasets based on solar tracking frequently consist of time-series data. Time-series data comprises four components: level, trend, seasonality, and noise. To precisely predict the sun’s position utilising time-series data, the four components must be separated. This can be accomplished by data decomposition techniques. Nevertheless, although numerous studies employed time-series data, just one study [114] utilised a decomposition method. Furthermore, the study only employed a wavelet-based methodology utilising a decomposition technique. Consequently, more investigation into suitable decomposition methodologies for sun tracker-based datasets is warranted. Alternative decomposition methodologies that could enhance model performance encompass variational mode decomposition, self-adaptive decomposition, empirical mode decomposition, and hybrid decomposition [115].
5. Future Research Prospects in Deep Learning for PV Solar Tracking
The incorporation of deep learning (DL) methodologies into photovoltaic (PV) solar tracking has transformed the domain, facilitating enhanced prediction, defect detection, and maximum power point tracking (MPPT). Nonetheless, despite substantial advancements, numerous challenges persist, including data quality and availability, computational complexity, integration of image data, model generalisation, interpretability and explainability of the model, and data integration, as outlined in the preceding section. Resolving such challenges is essential for harnessing the complete potential of deep learning in photovoltaic systems and facilitating their extensive implementation in practical applications. Fortunately, a variety of potential future research opportunities present solutions to these issues, facilitating the development of more adaptive, scalable, and trustworthy deep learning models. Presented herein is a comprehensive review of future prospects.
5.1. Transfer Learning and Domain Adaptation
Transfer learning and domain adaptation techniques possess significant promise to enhance the generalisability of deep learning models across various locales, climates, and datasets. Utilising pre-trained models enables researchers to minimise the necessity for extensive datasets and enhance model efficacy in novel contexts. Transfer learning enables models trained on one dataset or region to be optimised for another, enhancing their adaptability to other photovoltaic systems. Domain adaptation approaches augment this process by mitigating discrepancies in data distribution across source and target domains. These methodologies allow deep learning models to adjust to new datasets with minimum retraining, enhancing their versatility and applicability across various photovoltaic systems. Furthermore, transfer learning might speed up the construction of deep learning models by minimising training duration and computational expenses, rendering it an invaluable resource for researchers and practitioners.
5.2. Explainable AI (XAI)
Explainable AI (XAI) is a significant academic domain focused on improving the interpretability of deep learning models, hence increasing their transparency and reliability. Methods such as SHAP, LIME, and attention mechanisms offer insights into model decision-making, which is especially crucial in safety-critical applications like fault detection and forecasting. XAI enhances the transparency of DL models and fosters trust among stakeholders, such as system operators, policymakers, and end-users. By integrating XAI, scholars may create models that are both reliable and comprehensible, promoting their implementation in practical PV systems. Moreover, XAI can detect biases or errors in model predictions, facilitating ongoing enhancement and fine-tuning.
5.3. IoT and Edge Computing Integration
The combination of deep learning models with the Internet of Things (IoT) and edge computing presents a viable option for real-time monitoring, control, and decision-making in photovoltaic research. This method minimises the requirement for extensive processing resources and enhances scalability by implementing models on edge devices. IoT devices may gather real-time data from photovoltaic systems, whilst edge computing facilitates rapid inference and decision-making locally. This integration is especially advantageous for remote or resource-limited settings, where centralised computing is unfeasible. IoT and edge computing can improve the efficiency and reliability of photovoltaic systems by facilitating real-time decision-making. The combination of these features can reduce latency and enhance system responsiveness, thus guaranteeing that PV systems function at high efficiency levels.
5.4. Multi-Modal Data Fusion
Multi-modal data fusion utilises the advantages of several data sources, including meteorological data, image data, and time series data, to improve the robustness and precision of deep learning models. By integrating many data sources, researchers can create more holistic models that capture the complex relationships between environmental variables and photovoltaic system performance. For instance, integrating satellite images with meteorological data could enhance the precision of photovoltaic prediction models, whilst thermal imaging can enhance error detection. Multi-modal data fusion enhances the accuracy and reliability of deep learning models for photovoltaic systems, overcoming the challenges of single-source methodologies. Furthermore, multi-modal data fusion can enhance the flexibility of deep learning models to data sparsity or noise, hence increasing their robustness in practical applications.
5.5. Physics-Informed DL Models
Integrating physical limitations into deep learning models can enhance their precision and dependability, particularly in situations with limited data. Physics-informed deep learning models integrate data-driven and physics-based methodologies, utilising domain expertise to improve model efficacy. By incorporating basic concepts, such as the correlation between solar irradiation and photovoltaic output, researchers may create models that are both accurate and comprehensible. Physics-informed deep learning models are especially advantageous in situations characterised by limited or noisy data, guaranteeing that predictions align with physical principles. This methodology facilitates the creation of models that are both accurate and easily comprehensible, rendering them more appropriate for practical applications. Moreover, physics-informed deep learning models can mitigate the likelihood of unphysical predictions, hence ensuring the models’ reliability under diverse settings.
In a nutshell, the future potential of transfer learning, XAI, IoT integration, multi-modal data fusion, and physics-informed deep learning techniques provides potential solutions to the issues encountered by deep learning in photovoltaic solar tracking. These strategies can improve model generalisability, interpretability, scalability, and accuracy, facilitating the creation of robust and dependable deep learning models for real-world photovoltaic systems. By utilising these breakthroughs, researchers may fully harness the potential of deep learning to enhance the performance, efficiency, and reliability of photovoltaic systems. Future research should concentrate on incorporating these opportunities into realistic, scalable, and implementable solutions, ensuring that deep learning models become an essential component of the renewable energy ecosystem.
6. Conclusions and Recommendations
This systematic literature review offers a thorough examination of the progress in deep learning architectures for photovoltaic solar energy tracking systems from 2016 to 2025. The review was organised into four research questions (RQs) aimed at finding popular deep learning architectures, datasets, performance indicators, and challenges within the research field. The study utilised a systematic methodology, comprising a thorough search strategy, defined inclusion and exclusion criteria, quality evaluation, and data extraction, to analyse 64 high-quality papers from leading academic databases. The results indicated that deep learning architectures, including Convolutional Neural Networks (CNNs), Long Short-Term Memory (LSTM) networks, and Transformer-based models, are extensively employed to improve the accuracy and efficiency of photovoltaic solar tracking systems. The findings from the SLR also show that frequently utilised datasets comprising the meteorological data, PV system data, time series data, temperature data, and image data. On the other hand, performance evaluations, including Mean Absolute Error (MAE), Mean Squared Error (MSE), and Mean Absolute Percentage Error (MAPE), were mostly utilised to assess model efficiency. Identified key issues encompass inadequate data quality, restricted availability, high computing complexity, and limitations in model generalisation. Future research should concentrate on enhancing data quality and accessibility, formulating generalised models, reducing computational complexity, and integrating deep learning with real-time photovoltaic systems. By mitigating these shortcomings, the field can progress towards more efficient, reliable, and sustainable photovoltaic solar tracking systems, facilitating the wider adoption of renewable energy technology.
Supplementary Materials
The following supporting information can be downloaded at: https://www.mdpi.com/article/10.3390/su17219625/s1, Table S1: PRISMA 2020 Checklist [116].
Funding
The authors gratefully acknowledge the funding of the Deanship of Graduate Studies and Scientific Research, Jazan University, Saudi Arabia, through Project number: JU-202502161-DGSSR-RP-2025.
Institutional Review Board Statement
Not applicable.
Informed Consent Statement
Not applicable.
Data Availability Statement
No new data were created or analyzed in this study. Data sharing is not applicable to this article.
Conflicts of Interest
The authors declare no conflicts of interest.
References
- Yang, Z.; Xiao, Z. A review of the sustainable development of solar photovoltaic tracking system technology. Energies 2023, 16, 7768. [Google Scholar] [CrossRef]
- Kelly, N.A.; Gibson, T.L. Improved photovoltaic energy output for cloudy conditions with a solar tracking system. Sol. Energy 2009, 83, 2092–2102. [Google Scholar] [CrossRef]
- Tovar, M.; Robles, M.; Rashid, F. PV power prediction, using CNN-LSTM hybrid neural network model. Case of study: Temixco-Morelos, México. Energies 2020, 13, 6512. [Google Scholar] [CrossRef]
- Agrawal, M.; Chhajed, P.; Chowdhury, A. Performance analysis of photovoltaic module with reflector: Optimizing orientation with different tilt scenarios. Renew. Energy 2022, 186, 10–25. [Google Scholar] [CrossRef]
- Phiri, M.; Mulenga, M.; Zimba, A.; Eke, C.I. Deep learning techniques for solar tracking systems: A systematic literature review, research challenges, and open research directions. Sol. Energy 2023, 262, 111803. [Google Scholar] [CrossRef]
- Obi, M.; Bass, R. Trends and challenges of grid-connected photovoltaic systems–A review. Renew. Sustain. Energy Rev. 2016, 58, 1082–1094. [Google Scholar] [CrossRef]
- Forootan, M.M.; Larki, I.; Zahedi, R.; Ahmadi, A. Machine learning and deep learning in energy systems: A review. Sustainability 2022, 14, 4832. [Google Scholar] [CrossRef]
- Mienye, I.D.; Swart, T.G. A comprehensive review of deep learning: Architectures, recent advances, and applications. Information 2024, 15, 755. [Google Scholar] [CrossRef]
- Karthikeyan, G.; Jagadeeshwaran, A. Enhancing solar energy generation: A comprehensive machine learning-based PV prediction and fault analysis system for real-time tracking and forecasting. Electr. Power Compon. Syst. 2024, 52, 1497–1512. [Google Scholar] [CrossRef]
- Pouladian-Kari, A.; Eslami, S.; Tadjik, A.; Kirchner, L.; Pouladian-Kari, R.; Golshanfard, A. A novel solution for addressing the problem of soiling and improving performance of PV solar systems. Sol. Energy 2022, 241, 315–326. [Google Scholar] [CrossRef]
- Choudhary, S.K.; Mondal, A. Utilization of computer vision and machine learning for solar power prediction. In Computer Vision and Machine Intelligence for Renewable Energy Systems; Elsevier: Amsterdam, The Netherlands, 2025; pp. 67–84. [Google Scholar]
- Alao, K.T.; Gilani, S.I.U.H.; Sopian, K.; Alao, T.O. A review on digital twin application in photovoltaic energy systems: Challenges and opportunities. JMST Adv. 2024, 6, 257–282. [Google Scholar] [CrossRef]
- Mansouri, M.; Trabelsi, M.; Nounou, H.; Nounou, M. Deep learning-based fault diagnosis of photovoltaic systems: A comprehensive review and enhancement prospects. IEEE Access 2021, 9, 126286–126306. [Google Scholar] [CrossRef]
- Ozcanli, A.K.; Yaprakdal, F.; Baysal, M. Deep learning methods and applications for electrical power systems: A comprehensive review. Int. J. Energy Res. 2020, 44, 7136–7157. [Google Scholar] [CrossRef]
- Mansouri, A.; Magri, A.; Younes, E.; Lajouad, R.; Adouairi, M. Comprehensive review and analysis of photovoltaic energy conversion topologies. Int. J. Appl. Power Eng. (IJAPE) 2024, 13, 499–507. [Google Scholar] [CrossRef]
- Kumar, A.; Dubey, A.K.; Segovia Ramírez, I.; Muñoz del Río, A.; García Márquez, F.P. Artificial intelligence techniques for the photovoltaic system: A systematic review and analysis for evaluation and benchmarking. Arch. Comput. Methods Eng. 2024, 31, 4429–4453. [Google Scholar] [CrossRef]
- Jobayer, M.; Shaikat, M.A.H.; Rashid, M.N.; Hasan, M.R. A systematic review on predicting PV system parameters using machine learning. Heliyon 2023, 9, e16815. [Google Scholar] [CrossRef] [PubMed]
- Almeshaiei, E.; Al-Habaibeh, A.; Shakmak, B. Rapid evaluation of micro-scale photovoltaic solar energy systems using empirical methods combined with deep learning neural networks to support systems’ manufacturers. J. Clean. Prod. 2020, 244, 118788. [Google Scholar] [CrossRef]
- Du Plessis, A.; Strauss, J.; Rix, A. Short-term solar power forecasting: Investigating the ability of deep learning models to capture low-level utility-scale Photovoltaic system behaviour. Appl. Energy 2021, 285, 116395. [Google Scholar] [CrossRef]
- Klaiber, J.; Van Dinther, C. Deep learning for variable renewable energy: A systematic review. ACM Comput. Surv. 2023, 56, 1–37. [Google Scholar] [CrossRef]
- Massaoudi, M.; Chihi, I.; Abu-Rub, H.; Refaat, S.S.; Oueslati, F.S. Convergence of photovoltaic power forecasting and deep learning: State-of-art review. Ieee Access 2021, 9, 136593–136615. [Google Scholar] [CrossRef]
- Sadeghi, R.; Parenti, M.; Memme, S.; Fossa, M.; Morchio, S. A Review and Comparative Analysis of Solar Tracking Systems. Energies 2025, 18, 2553. [Google Scholar] [CrossRef]
- Carballo, J.A.; Bonilla, J.; Berenguel, M.; Fernández-Reche, J.; García, G. New approach for solar tracking systems based on computer vision, low cost hardware and deep learning. Renew. Energy 2019, 133, 1158–1166. [Google Scholar] [CrossRef]
- Mousazadeh, H.; Keyhani, A.; Javadi, A.; Mobli, H.; Abrinia, K.; Sharifi, A. A review of principle and sun-tracking methods for maximizing solar systems output. Renew. Sustain. Energy Rev. 2009, 13, 1800–1818. [Google Scholar] [CrossRef]
- Racharla, S.; Rajan, K. Solar tracking system–a review. Int. J. Sustain. Eng. 2017, 10, 72–81. [Google Scholar]
- Nadia, A.-R.; Isa, N.A.M.; Desa, M.K.M. Advances in solar photovoltaic tracking systems: A review. Renew. Sustain. Energy Rev. 2018, 82, 2548–2569. [Google Scholar] [CrossRef]
- Kazem, H.A.; Yousif, J.; Chaichan, M.T.; Al-Waeli, A.H. Experimental and deep learning artificial neural network approach for evaluating grid-connected photovoltaic systems. Int. J. Energy Res. 2019, 43, 8572–8591. [Google Scholar] [CrossRef]
- Agrawal, P.; Bansal, H.O.; Gautam, A.R.; Mahela, O.P.; Khan, B. Transformer-based time series prediction of the maximum power point for solar photovoltaic cells. Energy Sci. Eng. 2022, 10, 3397–3410. [Google Scholar] [CrossRef]
- Hafez, A.; Yousef, A.; Harag, N. Solar tracking systems: Technologies and trackers drive types–A review. Renew. Sustain. Energy Rev. 2018, 91, 754–782. [Google Scholar] [CrossRef]
- Singh, A.P.; Yadav, I. A review on the axis tracking used for solar PV application. In IOP Conference Series: Materials Science and Engineering; IOP Publishing: Bristol, UK, 2021; p. 012063. [Google Scholar]
- Ghimire, S.; Deo, R.C.; Casillas-Pérez, D.; Salcedo-Sanz, S.; Sharma, E.; Ali, M. Deep learning CNN-LSTM-MLP hybrid fusion model for feature optimizations and daily solar radiation prediction. Measurement 2022, 202, 111759. [Google Scholar] [CrossRef]
- Mulenga, M.; Phiri, M.; Simukonda, L.; Alaba, F.A. A multistage hybrid deep learning model for enhanced solar tracking. IEEE Access 2023, 11, 129449–129466. [Google Scholar] [CrossRef]
- Trong, T.N.; Son, H.V.X.; Do Dinh, H.; Takano, H.; Duc, T.N. Short-term PV power forecast using hybrid deep learning model and Variational Mode Decomposition. Energy Rep. 2023, 9, 712–717. [Google Scholar] [CrossRef]
- Mallett, R.; Hagen-Zanker, J.; Slater, R.; Duvendack, M. The benefits and challenges of using systematic reviews in international development research. J. Dev. Eff. 2012, 4, 445–455. [Google Scholar] [CrossRef]
- Keele, S. Guidelines for Performing Systematic Literature Reviews in Software Engineering; Technical Report, Ver. 2.3 EBSE Technical Report; EBSE: Durham, UK, 2007. [Google Scholar]
- Kitchenham, B.; Brereton, P. A systematic review of systematic review process research in software engineering. Inf. Softw. Technol. 2013, 55, 2049–2075. [Google Scholar] [CrossRef]
- Grewal, A.; Kataria, H.; Dhawan, I. Literature search for research planning and identification of research problem. Indian J. Anaesth. 2016, 60, 635. [Google Scholar] [CrossRef]
- Papamitsiou, Z.; Economides, A. Learning analytics and educational data mining in practice: A systematic literature review of empirical evidence. J. Educ. Technol. Soc. 2014, 17, 49–64. [Google Scholar]
- Ibrahim, M.; Alsheikh, A.; Awaysheh, F.M.; Alshehri, M.D. Machine learning schemes for anomaly detection in solar power plants. Energies 2022, 15, 1082. [Google Scholar] [CrossRef]
- Kasburg, C.; Stefenon, S.F. Deep learning for photovoltaic generation forecast in active solar trackers. IEEE Lat. Am. Trans. 2019, 17, 2013–2019. [Google Scholar] [CrossRef]
- Elsaraiti, M.; Merabet, A. Solar power forecasting using deep learning techniques. IEEE Access 2022, 10, 31692–31698. [Google Scholar] [CrossRef]
- Manno, D.; Cipriani, G.; Ciulla, G.; Di Dio, V.; Guarino, S.; Brano, V.L. Deep learning strategies for automatic fault diagnosis in photovoltaic systems by thermographic images. Energy Convers. Manag. 2021, 241, 114315. [Google Scholar] [CrossRef]
- Alrifaey, M.; Lim, W.H.; Ang, C.K.; Natarajan, E.; Solihin, M.I.; Juhari, M.R.M.; Tiang, S.S. Hybrid deep learning model for fault detection and classification of grid-connected photovoltaic system. IEEE Access 2022, 10, 13852–13869. [Google Scholar] [CrossRef]
- Mayer, K.; Wang, Z.; Arlt, M.-L.; Neumann, D.; Rajagopal, R. DeepSolar for Germany: A deep learning framework for PV system mapping from aerial imagery. In Proceedings of the 2020 International Conference on Smart Energy Systems and Technologies (SEST), Istanbul, Turkey, 7–9 September 2020; pp. 1–6. [Google Scholar]
- Kleebauer, M.; Marz, C.; Reudenbach, C.; Braun, M. Multi-resolution segmentation of solar photovoltaic systems using deep learning. Remote Sens. 2023, 15, 5687. [Google Scholar] [CrossRef]
- Ramasamy, S.; Perumal, M. CNN-based deep learning technique for improved H7 TLI with grid-connected photovoltaic systems. Int. J. Energy Res. 2021, 45, 19851–19868. [Google Scholar] [CrossRef]
- Abdel-Basset, M.; Hawash, H.; Chakrabortty, R.K.; Ryan, M. PV-Net: An innovative deep learning approach for efficient forecasting of short-term photovoltaic energy production. J. Clean. Prod. 2021, 303, 127037. [Google Scholar] [CrossRef]
- Afrasiabi, S.; Allahmoradi, S.; Afrasiabi, M.; Liang, X.; Chung, C.; Aghaei, J. A Robust Multi-Modal Deep Learning-Based Fault Diagnosis Method for PV Systems. IEEE Open Access J. Power Energy 2024, 11, 583–594. [Google Scholar] [CrossRef]
- Allan, O.A.; Morsi, W.G. A new passive islanding detection approach using wavelets and deep learning for grid-connected photovoltaic systems. Electr. Power Syst. Res. 2021, 199, 107437. [Google Scholar] [CrossRef]
- Amiri, A.F.; Kichou, S.; Oudira, H.; Chouder, A.; Silvestre, S. Fault detection and diagnosis of a photovoltaic system based on deep learning using the combination of a convolutional neural network (cnn) and bidirectional gated recurrent unit (Bi-GRU). Sustainability 2024, 16, 1012. [Google Scholar] [CrossRef]
- Eldeghady, G.S.; Kamal, H.A.; Hassan, M.A.M. Fault diagnosis for PV system using a deep learning optimized via PSO heuristic combination technique. Electr. Eng. 2023, 105, 2287–2301. [Google Scholar] [CrossRef]
- Roy, B.; Adhikari, S.; Datta, S.; Devi, K.J.; Devi, A.D.; Ustun, T.S. Harnessing Deep Learning for Enhanced MPPT in Solar PV Systems: An LSTM Approach Using Real-World Data. Electricity 2024, 5, 843–860. [Google Scholar] [CrossRef]
- Hassan, I.; Alhamrouni, I.; Younes, Z.; Azhan, N.H.; Mekhilef, S.; Seyedmahmoudian, M.; Stojcevski, A. Explainable deep learning model for grid connected photovoltaic system performance assessment for improving system relaibility. IEEE Access 2024, 12, 120729–120746. [Google Scholar] [CrossRef]
- Arun, M.; Le, T.T.; Barik, D.; Sharma, P.; Osman, S.M.; Huynh, V.K.; Kowalski, J.; Dong, V.H.; Le, V.V. Deep learning-enabled integration of renewable energy sources through photovoltaics in buildings. Case Stud. Therm. Eng. 2024, 61, 105115. [Google Scholar] [CrossRef]
- Mishra, M.; Dash, P.B.; Nayak, J.; Naik, B.; Swain, S.K. Deep learning and wavelet transform integrated approach for short-term solar PV power prediction. Measurement 2020, 166, 108250. [Google Scholar] [CrossRef]
- Li, G.; Xie, S.; Wang, B.; Xin, J.; Li, Y.; Du, S. Photovoltaic power forecasting with a hybrid deep learning approach. IEEE Access 2020, 8, 175871–175880. [Google Scholar] [CrossRef]
- Younas, U.; Kulaksiz, A.A.; Ali, Z. Deep learning stack LSTM based MPPT control of dual stage 100 kWp grid-tied solar PV system. IEEE Access 2024, 12, 77555–77574. [Google Scholar] [CrossRef]
- Aslam, M.; Lee, J.; Altaha, M.; Lee, S.; Hong, S. AE-LSTM Based Deep Learning Model for Degradation Rate Influenced Energy Estimation of a PV System. Energies 2020, 13, 4373. [Google Scholar] [CrossRef]
- Kalyan, S.; Sun, Q. Interrogating the installation gap and potential of solar photovoltaic systems using GIS and deep learning. Energies 2022, 15, 3740. [Google Scholar] [CrossRef]
- Zhu, R.; Guo, D.; Wong, M.S.; Qian, Z.; Chen, M.; Yang, B.; Chen, B.; Zhang, H.; You, L.; Heo, J. Deep solar PV refiner: A detail-oriented deep learning network for refined segmentation of photovoltaic areas from satellite imagery. Int. J. Appl. Earth Obs. Geoinf. 2023, 116, 103134. [Google Scholar] [CrossRef]
- Shabbir, N.; Kütt, L.; Astapov, V.; Daniel, K.; Jawad, M.; Husev, O.; Rosin, A.; Martins, J. Enhancing PV hosting capacity and mitigating congestion in distribution networks with deep learning based PV forecasting and battery management. Appl. Energy 2024, 372, 123770. [Google Scholar] [CrossRef]
- Li, P.; Zhou, K.; Lu, X.; Yang, S. A hybrid deep learning model for short-term PV power forecasting. Appl. Energy 2020, 259, 114216. [Google Scholar] [CrossRef]
- Almonacid-Olleros, G.; Almonacid, G.; Fernandez-Carrasco, J.I.; Quero, J.M. Opera. dl: Deep learning modelling for photovoltaic system monitoring. Proceedings 2019, 31, 50. [Google Scholar] [CrossRef]
- Rafeeq Ahmed, K.; Sayeed, F.; Logavani, K.; Catherine, T.; Ralhan, S.; Singh, M.; Prabu, R.T.; Subramanian, B.B.; Kassa, A. Maximum power point tracking of PV grids using deep learning. Int. J. Photoenergy 2022, 2022, 1123251. [Google Scholar] [CrossRef]
- Dairi, A.; Harrou, F.; Sun, Y.; Khadraoui, S. Short-term forecasting of photovoltaic solar power production using variational auto-encoder driven deep learning approach. Appl. Sci. 2020, 10, 8400. [Google Scholar] [CrossRef]
- Kaycı, B.; Demir, B.E.; Demir, F. Deep learning based fault detection and diagnosis in photovoltaic system using thermal images acquired by UAV. Politek. Derg. 2024, 27, 91–99. [Google Scholar] [CrossRef]
- Bougoffa, M.; Benmoussa, S.; Djeziri, M.; Palais, O. Hybrid Deep Learning for Fault Diagnosis in Photovoltaic Systems. Machines 2025, 13, 378. [Google Scholar] [CrossRef]
- Wang, K.; Qi, X.; Liu, H. A comparison of day-ahead photovoltaic power forecasting models based on deep learning neural network. Appl. Energy 2019, 251, 113315. [Google Scholar] [CrossRef]
- Zech, M.; Ranalli, J. Predicting PV areas in aerial images with deep learning. In Proceedings of the 2020 47th IEEE Photovoltaic Specialists Conference (PVSC), Calgary, ON, Canada, 15 June–21 August 2020; pp. 0767–0774. [Google Scholar]
- Sohail, A.; Islam, N.U.; Haq, A.U.; Islam, S.U.; Shafi, I.; Park, J. Fault detection and computation of power in PV cells under faulty conditions using deep-learning. Energy Rep. 2023, 9, 4325–4336. [Google Scholar] [CrossRef]
- Akpolat, A.N.; Dursun, E.; Kuzucuoğlu, A.E. Deep learning-aided sensorless control approach for PV converters in DC nanogrids. IEEE Access 2021, 9, 106641–106654. [Google Scholar] [CrossRef]
- Akram, M.W.; Li, G.; Jin, Y.; Chen, X.; Zhu, C.; Ahmad, A. Automatic detection of photovoltaic module defects in infrared images with isolated and develop-model transfer deep learning. Sol. Energy 2020, 198, 175–186. [Google Scholar] [CrossRef]
- Selvi, S.; Devaraj, V.; PS, R.P.; Subramani, K. Detection of soiling on PV module using deep learning. Int. J. Electr. Electron. Eng 2023, 10, 93–101. [Google Scholar]
- Obaidi, M.Q.; Derbel, N. IoT-based monitoring and shading faults detection for a PV water pumping system using deep learning approach. Bull. Electr. Eng. Inform. 2023, 12, 2673–2681. [Google Scholar] [CrossRef]
- Almansuri, M.A.K.; Yusupov, Z.; Rahebi, J.; Ghadami, R. Parameter estimation of PV solar cells and modules using deep learning-based White Shark Optimizer algorithm. Symmetry 2025, 17, 533. [Google Scholar] [CrossRef]
- Pierdicca, R.; Paolanti, M.; Felicetti, A.; Piccinini, F.; Zingaretti, P. Automatic faults detection of photovoltaic farms: solAIr, a deep learning-based system for thermal images. Energies 2020, 13, 6496. [Google Scholar] [CrossRef]
- Luo, X.; Zhang, D.; Zhu, X. Deep learning based forecasting of photovoltaic power generation by incorporating domain knowledge. Energy 2021, 225, 120240. [Google Scholar] [CrossRef]
- Zhong, T.; Zhang, Z.; Chen, M.; Zhang, K.; Zhou, Z.; Zhu, R.; Wang, Y.; Lü, G.; Yan, J. A city-scale estimation of rooftop solar photovoltaic potential based on deep learning. Appl. Energy 2021, 298, 117132. [Google Scholar] [CrossRef]
- Mazen, F.M.A.; Seoud, R.A.A.; Shaker, Y.O. Deep learning for automatic defect detection in PV modules using electroluminescence images. IEEE Access 2023, 11, 57783–57795. [Google Scholar] [CrossRef]
- Mellit, A.; Pavan, A.M.; Lughi, V. Deep learning neural networks for short-term photovoltaic power forecasting. Renew. Energy 2021, 172, 276–288. [Google Scholar] [CrossRef]
- Munsif, M.; Ullah, M.; Fath, U.; Khan, S.U.; Khan, N.; Baik, S.W. CT-NET: A novel convolutional transformer-based network for short-term solar energy forecasting using climatic information. Comput. Syst. Sci. Eng. 2023, 47, 1751–1773. [Google Scholar]
- Zhu, J.; Zhao, Z.; Zheng, X.; An, Z.; Guo, Q.; Li, Z.; Sun, J.; Guo, Y. Time-series power forecasting for wind and solar energy based on the SL-transformer. Energies 2023, 16, 7610. [Google Scholar] [CrossRef]
- Hu, X. Weather Phenomena Monitoring: Optimizing Solar Irradiance Forecasting with Temporal Fusion Transformer. IEEE Access 2024, 12, 194133–194149. [Google Scholar] [CrossRef]
- Al-Ali, E.M.; Hajji, Y.; Said, Y.; Hleili, M.; Alanzi, A.M.; Laatar, A.H.; Atri, M. Solar energy production forecasting based on a hybrid CNN-LSTM-transformer model. Mathematics 2023, 11, 676. [Google Scholar] [CrossRef]
- Lim, S.-C.; Huh, J.-H.; Hong, S.-H.; Park, C.-Y.; Kim, J.-C. Solar power forecasting using CNN-LSTM hybrid model. Energies 2022, 15, 8233. [Google Scholar] [CrossRef]
- Alharkan, H.; Habib, S.; Islam, M. Solar power prediction using dual stream CNN-LSTM architecture. Sensors 2023, 23, 945. [Google Scholar] [CrossRef] [PubMed]
- Elizabeth Michael, N.; Mishra, M.; Hasan, S.; Al-Durra, A. Short-term solar power predicting model based on multi-step CNN stacked LSTM technique. Energies 2022, 15, 2150. [Google Scholar] [CrossRef]
- AlKandari, M.; Ahmad, I. Solar power generation forecasting using ensemble approach based on deep learning and statistical methods. Appl. Comput. Inform. 2024, 20, 231–250. [Google Scholar] [CrossRef]
- Ortiz, A.; Negandhi, D.; Mysorekar, S.R.; Nagaraju, S.K.; Kiesecker, J.; Robinson, C.; Bhatia, P.; Khurana, A.; Wang, J.; Oviedo, F. An artificial intelligence dataset for solar energy locations in India. Sci. Data 2022, 9, 497. [Google Scholar] [CrossRef]
- Díaz–Vico, D.; Torres–Barrán, A.; Omari, A.; Dorronsoro, J.R. Deep neural networks for wind and solar energy prediction. Neural Process. Lett. 2017, 46, 829–844. [Google Scholar] [CrossRef]
- Xu, C.; Chen, S.; Ren, H.; Xu, C.; Li, G.; Li, T.; Sun, Y. A novel deep learning and GIS integrated method for accurate city-scale assessment of building facade solar energy potential. Appl. Energy 2025, 387, 125600. [Google Scholar] [CrossRef]
- El-Shahat, D.; Tolba, A.; Abouhawwash, M.; Abdel-Basset, M. Machine learning and deep learning models based grid search cross validation for short-term solar irradiance forecasting. J. Big Data 2024, 11, 134. [Google Scholar] [CrossRef]
- van der Merwe, S.; du Plessis, A.A.; Rix, A.J. Providing Ancillary Services from Renewable Energy in South Africa. In Proceedings of the 2024 International Conference on Artificial Intelligence, Computer, Data Sciences and Applications (ACDSA), Victoria, Seychelles, 1–2 February 2024; pp. 1–6. [Google Scholar]
- Liu, Y.; Zhou, Y.; Wen, S.; Tang, C. A strategy on selecting performance metrics for classifier evaluation. Int. J. Mob. Comput. Multimed. Commun. (IJMCMC) 2014, 6, 20–35. [Google Scholar] [CrossRef]
- Qi, J.; Du, J.; Siniscalchi, S.M.; Ma, X.; Lee, C.-H. On mean absolute error for deep neural network based vector-to-vector regression. IEEE Signal Process. Lett. 2020, 27, 1485–1489. [Google Scholar] [CrossRef]
- Willmott, C.J.; Matsuura, K. Advantages of the mean absolute error (MAE) over the root mean square error (RMSE) in assessing average model performance. Clim. Res. 2005, 30, 79–82. [Google Scholar] [CrossRef]
- Wang, Z.; Bovik, A.C. Mean squared error: Love it or leave it? A new look at signal fidelity measures. IEEE Signal Process. Mag. 2009, 26, 98–117. [Google Scholar] [CrossRef]
- Hodson, T.O.; Over, T.M.; Foks, S.S. Mean squared error, deconstructed. J. Adv. Model. Earth Syst. 2021, 13, e2021MS002681. [Google Scholar] [CrossRef]
- Hossin, M.; Sulaiman, M.N. A review on evaluation metrics for data classification evaluations. Int. J. Data Min. Knowl. Manag. Process 2015, 5, 1. [Google Scholar]
- Chai, T.; Draxler, R.R. Root mean square error (RMSE) or mean absolute error (MAE)?–Arguments against avoiding RMSE in the literature. Geosci. Model Dev. 2014, 7, 1247–1250. [Google Scholar] [CrossRef]
- Savage, N.; Agnew, P.; Davis, L.; Ordóñez, C.; Thorpe, R.; Johnson, C.; O’Connor, F.; Dalvi, M. Air quality modelling using the Met Office Unified Model (AQUM OS24-26): Model description and initial evaluation. Geosci. Model Dev. 2013, 6, 353–372. [Google Scholar] [CrossRef]
- Nadipally, M. Optimization of methods for image-texture segmentation using ant colony optimization. In Intelligent Data Analysis for Biomedical Applications; Elsevier: Amsterdam, The Netherlands, 2019; pp. 21–47. [Google Scholar]
- Kaplan, Y.A. Forecasting of global solar radiation: A statistical approach using simulated annealing algorithm. Eng. Appl. Artif. Intell. 2024, 136, 109034. [Google Scholar] [CrossRef]
- Moreno, J.J.M.; Pol, A.P.; Abad, A.S.; Blasco, B.C. Using the R-MAPE index as a resistant measure of forecast accuracy. Psicothema 2013, 25, 500–506. [Google Scholar] [CrossRef] [PubMed]
- Hahn, G.J. The coefficient of determination exposed. Chemtech 1973, 3, 609–612. [Google Scholar]
- Gao, J. R-Squared (R2)–How much variation is explained? Res. Methods Med. Health Sci. 2024, 5, 104–109. [Google Scholar] [CrossRef]
- Thongsak, N.; Lawson, N. A Class of Regression-type Estimators for Population Mean Utilizing Transformed Variable with Missing Data with an Application to COVID-19. Lobachevskii J. Math. 2025, 46, 1425–1436. [Google Scholar] [CrossRef]
- Di Bucchianico, A. Coefficient of determination (R2). In Encyclopedia of Statistics in Quality and Reliability; Wiley: Chichester, UK, 2008. [Google Scholar] [CrossRef]
- Saunders, L.J.; Russell, R.A.; Crabb, D.P. The coefficient of determination: What determines a useful R2 statistic? Investig. Ophthalmol. Vis. Sci. 2012, 53, 6830–6832. [Google Scholar] [CrossRef] [PubMed]
- Cheng, C.-L.; Garg, G. Coefficient of determination for multiple measurement error models. J. Multivar. Anal. 2014, 126, 137–152. [Google Scholar] [CrossRef]
- Ramaneti, K.; Kakani, P.; Prakash, S. Improving solar panel efficiency by solar tracking and tilt angle optimization with deep learning. In Proceedings of the 2021 5th International Conference on Smart Grid and Smart Cities (ICSGSC), Tokyo, Japan, 18–20 June 2021; pp. 102–106. [Google Scholar]
- Uddin, M.F. Addressing accuracy paradox using enhanched weighted performance metric in machine learning. In Proceedings of the 2019 Sixth HCT Information Technology Trends (ITT), Ras Al Khaimah, United Arab Emirates, 20–21 November 2019; pp. 319–324. [Google Scholar]
- Abro, G.E.M.; Ali, A.; Memon, S.A.; Memon, T.D.; Khan, F. Strategies and Challenges for Unmanned Aerial Vehicle-Based Continuous Inspection and Predictive Maintenance of Solar Modules. IEEE Access 2024, 12, 176615–176629. [Google Scholar] [CrossRef]
- Frizzo Stefenon, S.; Kasburg, C.; Nied, A.; Rodrigues Klaar, A.C.; Silva Ferreira, F.C.; Waldrigues Branco, N. Hybrid deep learning for power generation forecasting in active solar trackers. IET Gener. Transm. Distrib. 2020, 14, 5667–5674. [Google Scholar] [CrossRef]
- Liu, H.; Chen, C. Data processing strategies in wind energy forecasting models and applications: A comprehensive review. Appl. Energy 2019, 249, 392–408. [Google Scholar] [CrossRef]
- Page, M.J.; McKenzie, J.E.; Bossuyt, P.M.; Boutron, I.; Hoffmann, T.C.; Mulrow, C.D.; Shamseer, L.; Tetzlaff, J.M.; Akl, E.A.; Brennan, S.E.; et al. The PRISMA 2020 statement: An updated guideline for reporting systematic reviews. BMJ 2021, 372, n71. [Google Scholar] [CrossRef]


Disclaimer/Publisher’s Note: The statements, opinions and data contained in all publications are solely those of the individual author(s) and contributor(s) and not of MDPI and/or the editor(s). MDPI and/or the editor(s) disclaim responsibility for any injury to people or property resulting from any ideas, methods, instructions or products referred to in the content. |
© 2025 by the authors. Licensee MDPI, Basel, Switzerland. This article is an open access article distributed under the terms and conditions of the Creative Commons Attribution (CC BY) license (https://creativecommons.org/licenses/by/4.0/).